
Abstract
The rapid advances in automation technologies are disrupting labor markets at an unprecedented speed, contributing to the secular decline in US labor force participation and raising questions about where workers shift to when they leave the labor force. This article investigates the margins of adjustment of workers after being displaced by the introduction of industrial robots. Exploiting exogenous variation in the adoption of robots across local labor markets over time, the authors show that almost 8% of non-participants respond by enrolling in college, approximately 10% claim disability benefits, and nearly 40% retire early. The remaining non-participants rely on the income of their household members or live off their savings. These margins differ with the sociodemographic characteristics of individuals. Results also show that robots have worsened non-participants’ health, including self-reported health problems and hospitalizations related to severe mental disorders and substance abuse.
Advances in labor-replacing technologies are poised to shape the future of labor markets, fueling concerns that the automation of labor through robots and artificial intelligence is going to displace millions of workers in the years to come (Brynjolfsson and McAfee 2014; Susskind 2020). The displacement of workers is an issue with profound implications since information technologies are affecting labor markets at an unprecedented speed, forcing many to leave the labor force and seek alternative sources of income. Despite growing interest in the impact of new technologies on the labor market, little is known about how displaced workers adapt to automation. This article investigates the impact of the introduction of industrial robots on the margins of adjustment of non-participants in the United States between 1993 and 2014. We provide novel evidence about the relative contribution of the different margins of adjustment on the stock of non-participants, including education, disability insurance take-up, and early retirement, among others, as well as the demographic characteristics of non-participants. Our results highlight the need to design policies that facilitate the reallocation of the workforce to new jobs during the automation transition.
Industrial robots have been among the leading automation technologies of the past decades. The International Federation of Robotics (IFR) defines them as fully autonomous machines that can be programmed to perform various manual tasks without the intervention of a human worker. The astonishing advances in robotics in recent decades, along with a decline in their quality-adjusted prices, have led to the widespread adoption of robots in many countries and affected the demand for labor (Graetz and Michaels 2018). In the United States, the stock of industrial robots has increased from less than half a robot to more than two robots per thousand workers (approximately 180,000 units) between 1993 and 2014, displacing thousands of workers from their jobs (Acemoglu and Restrepo 2020).
Although technological advancements are generating millions of new job opportunities (Autor, Chin, Salomons, and Seegmiller 2024), these jobs frequently require collaboration between humans and machines, potentially leading to challenges for displaced workers who lack the required skills (Restrepo 2015). Displaced workers are therefore likely to become unemployed or drop out of the labor force altogether (Grigoli, Koczan, and Topalova 2020; Jaimovich, Saporta-Eksten, Siu, and Yedid-Levi 2021), unless they are endowed with easily redeployable human capital (Goldin and Katz 2010).
To identify the margins of adjustment of non-participants, we use individual-level information about the labor force status and detailed sociodemographic characteristics of the US population from the Census and the American Community Survey (ACS), including college enrollment, disability take-up, early retirement, income sources, and recent migration history. We match these data with industry-level data from the IFR about the adoption of industrial robots. We follow Acemoglu and Restrepo (2020) in constructing a plausibly exogenous measure of robot exposure at the local labor market level using a shift-share approach that interacts baseline industry employment shares within local labor markets, proxied by commuting zones (CZs; Tolbert and Sizer 1996), with the adoption of robots in the United States. Identification builds on the assumption that advances in robotics vary by industry and expose CZs differently based on their industrial composition of employment.
Literature
This article contributes to the growing literature that studies the disruptive labor market impacts of automation. Although to date there is no general consensus on its aggregate implications for labor markets, the literature agrees that technological progress is rapidly changing the demand for skills and the nature of work (Katz and Murphy 1992; Acemoglu 1999; Goos and Manning 2007; Goos, Manning, and Salomons 2009; Autor and Dorn 2013).
We focus on the stream of the literature that identifies a mismatch between the new skill requirements of jobs and the skill endowment of workers (Goldin and Katz 2010; Acemoglu and Restrepo 2018). We build on these results and investigate where workers shift to when they have been directly or indirectly displaced by the introduction of industrial robots. In particular, we build on the pioneering work of Acemoglu and Restrepo (2020), who showed that industrial robots have reduced aggregate employment and wages in the United States. We complement their work by providing a comprehensive assessment of the margins of adjustment of workers who leave the labor force because of robots, analyzing systematic differences in the adjustment across demographic groups.
The literature has identified school enrollment (Hickman and Olney 2011; Greenland and Lopresti 2016; Hunt 2017; Foote and Grosz 2020; Weinstein 2022; Di Giacomo and Lerch 2023; Ferriere, Navarro, and Reyes-Heroles 2023), disability take-up (Black, Daniel, and Sanders 2002; Autor, Dorn, and Hanson 2013; Maestas, Mullen, and Strand 2015), and early retirement (Bartel and Sicherman 1993; Peracchi and Welch 1994; Ahituv and Zeira 2011; Burlon and Vilalta-Bufi 2016) to be among the margins of adjustment of non-participants. Evidence is lacking, however, about whether these margins of adjustment are also relevant for individuals who leave the labor force when exposed to robots. We address this question and quantify the relative contribution of each margin of adjustment for the increase in non-participation caused by local robot exposure.
The article further contributes to the literature analyzing the effect of labor market shocks on migration flows (Blanchard and Katz 1992; Monras 2018; Foote, Grosz, and Stevens 2019; Yagan 2019; Howard 2020; Faber, Sarto, and Tabellini 2022) and health outcomes (Schaller and Stevens 2015; Frank, Glied, Marple, and Shields 2019; Lang, McManus, and Schaur 2019; Adda and Fawaz 2020; De Vries, Gentile, Miroudot, and Wacker 2020; Gihleb, Giuntella, Stella, and Wang 2022) to understand to what extent they are contributing to the increase in labor force non-participation in the United States.
The adverse effects of robots on employment are less visible in Europe. In these countries, the displacement of workers from low-skill (Graetz and Michaels 2018), routine task-intensive (De Vries et al. 2020), and manufacturing jobs (Dauth, Findeisen, Suedekum, and Woessner 2021) has often been compensated by the employment growth in other occupations and industries. However, it is important to account for the fact that even in European countries a fraction of the displaced workers may drop from the labor force because of a skill mismatch with the newly created jobs (Grigoli et al. 2020), suggesting that the findings of this article are also of interest for Europe.
Data
This section describes the main data sources along with a set of descriptive statistics (see Table 1).
Descriptive Statistics: Margins of Adjustment of Non-participants
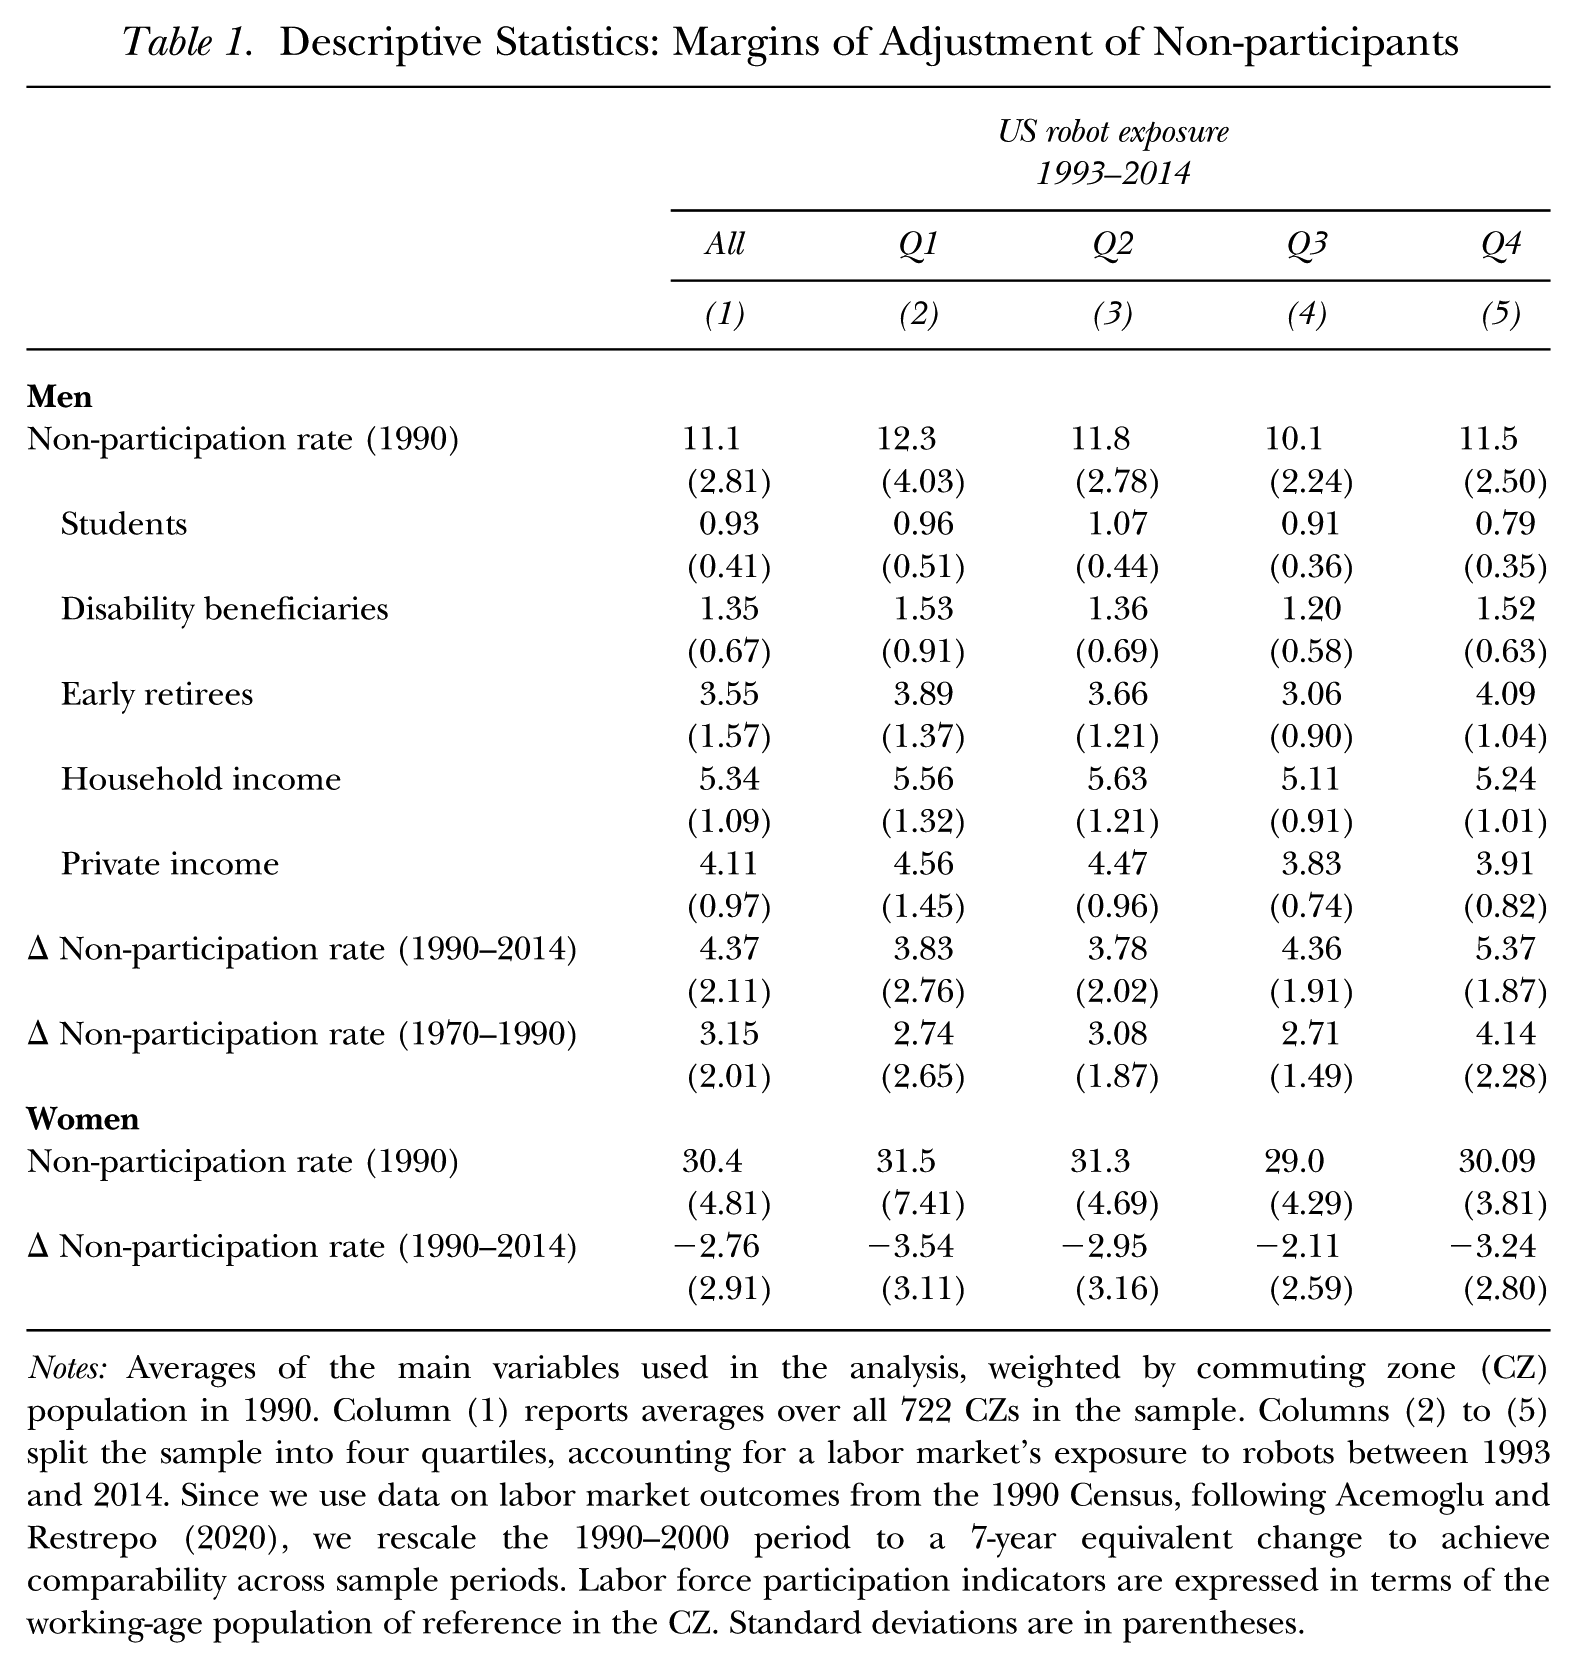
Notes: Averages of the main variables used in the analysis, weighted by commuting zone (CZ) population in 1990. Column (1) reports averages over all 722 CZs in the sample. Columns (2) to (5) split the sample into four quartiles, accounting for a labor market’s exposure to robots between 1993 and 2014. Since we use data on labor market outcomes from the 1990 Census, following Acemoglu and Restrepo (2020), we rescale the 1990–2000 period to a 7-year equivalent change to achieve comparability across sample periods. Labor force participation indicators are expressed in terms of the working-age population of reference in the CZ. Standard deviations are in parentheses.
Industrial Robots
We obtain data on the adoption of robots from the International Federation of Robotics (IFR). The IFR is a survey that collects data about shipments and operational stocks of industrial robots by country, industry, and year ranging back to 1993 for 50 countries. The IFR defines an industrial robot as an “automatically controlled, reprogrammable, multipurpose manipulator, programmable in three or more axes, which can be either fixed in place or mobile for use in industrial automation applications” (IFR 2018: 29). That is, industrial robots are machines that can be programmed to autonomously perform several manual tasks (e.g., assembly, material handling, packing, and welding) without the intervention of a human worker. They are often designed as robotic arms and do not include conveyor belts, cranes, or elevators, since these machines do not meet the above requirements.
The IFR breaks down the stock of operational robots according to the International Standard Industrial Classification (ISIC), Fourth Revision, and provides consistent data for six broad industries outside the manufacturing sector (agriculture, forestry, and fishing; construction; education, research, and development; mining; utilities; and other non-manufacturing branches, such as services) and 13 industries within the manufacturing sector (automotive; basic metals; electronics; food and beverages; industrial machinery; metal products; minerals; paper and printing; plastics and chemicals; textiles; wood and furniture; other transport equipment [e.g., airplanes, locomotives, and ships]; and other manufacturing branches). These data have been widely used in the literature; however, they also include some limitations, as presented in Online Appendix A2. (Hereafter, numbering for Online Appendix material is prefaced with an “A.”)
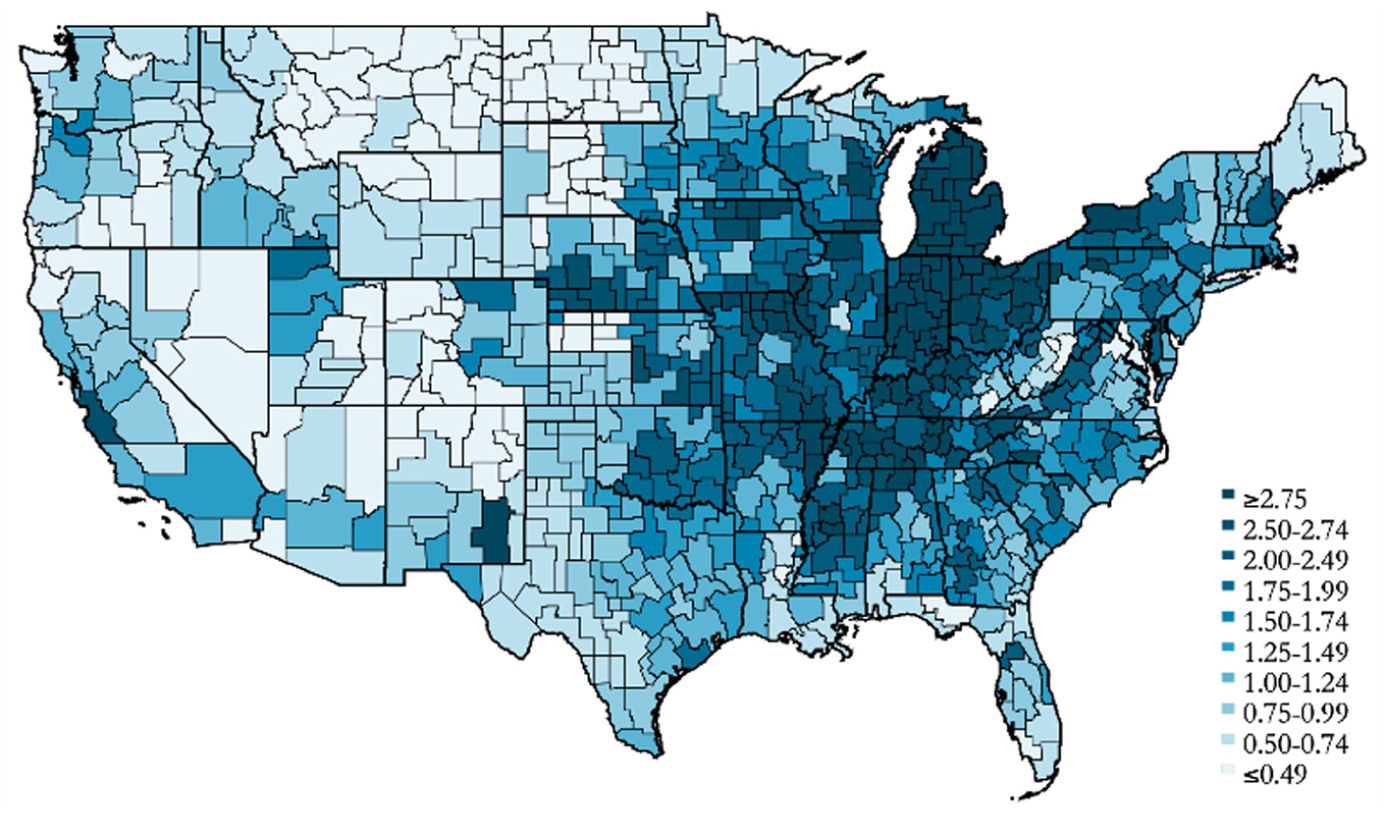
The US stock of industrial robots has increased by approximately 1.5 robots per thousand workers—a fivefold increase, or roughly 180,000 units, compared to its 1993 level. According to the IFR (2018), this number is expected to grow even more in the future. Industrial robots are adopted primarily in a subset of manufacturing industries, such as the automotive, electronic, plastic and chemical, and metal production industries (see Table A1 for details). This characteristic exposes the Midwest of the country significantly more to their adoption, especially the local labor markets of the Rust Belt (including the states of Indiana, Michigan, and Ohio), given their specialization in industrial manufacturing industries (see Figure 1).
US Robot Exposure at the CZ Level
Margins of Adjustment
To measure long-term changes in local labor market outcomes contemporaneous to the introduction of industrial robots, we obtain data from the Integrated Public Use Microdata Series (IPUMS) for the decennial Census for 1970, 1980, 1990, and 2000, and the ACS for 2007 and 2014 (Ruggles et al. 2019). These data sets are from repeated cross-sectional surveys that include between 1% and 5% of the US population and provide a comprehensive set of information at the individual and household level, including the employment status, sociodemographic characteristics, income sources, and the place of residence of households and their members.
An individual is considered to be out of the labor force if she is not employed and is not looking for work at the time the survey is conducted. Individuals are also asked about recent migration, school attendance, receipt of Social Security income, and their household role. We use these data alongside their labor force status to determine the adjustments among non-participants. We focus on the non-institutionalized population between 25 and 64 years of age. These individuals are above the usual full-time school age and below the full retirement age.
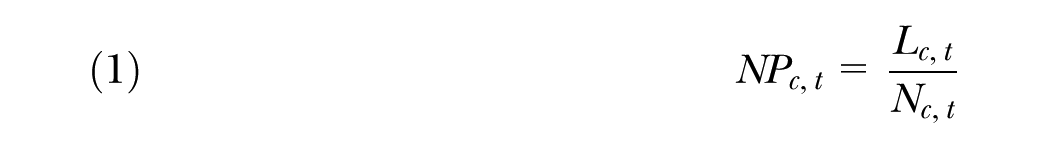
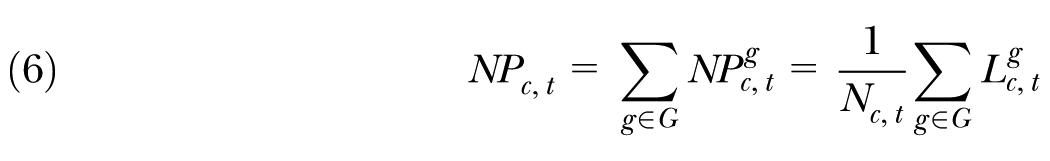
We aggregate individual-level data at the labor market level using 722 Commuting Zones (CZs) that cover the entire US mainland and act as proxies of local labor markers (Tolbert and Sizer 1996). This aggregation allows us to build a measure of the labor force non-participation rate at the local labor market level:
where
where
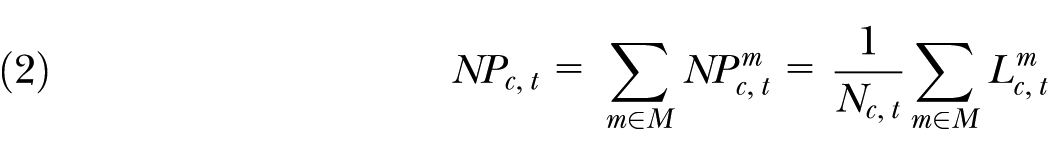
Table 1 shows that while the US has been experiencing a reduction in female labor force non-participation over the last decades (–2.8%), labor force non-participation of men increased from 11.1% in 1990 to 15.5% in 2014. When decomposing non-participants by their margin of adjustment, we find that approximately 8% of the non-participants are enrolled in college (0.93/11.1), one out of 10 receives disability benefits from Social Security Disability Insurance (SSDI), and almost one-third receives some form of retirement income (pension plan income or Social Security early retirement benefits). We also find that approximately half of the non-participants rely on the income of their household members and more than one-third rely on private savings from previously earned income. Note that, although college enrollment, disability take-up, and early retirement are mostly mutually exclusive, this is not the case for non-participants who rely on their household income or who rely on private savings. For instance, a 62-year-old displaced worker who leaves the labor force to retire early is unlikely to enroll in college. It might be the case, however, that a college student in his late twenties lives with his parents and relies on their income. Therefore, the shares of non-participants in the individual margins of adjustment do not necessarily add up to total non-participation.
Columns (2) to (5) split the sample into four quartiles based on a CZ’s exposure to industrial robots and provide means of the main variables used in the analysis for the respective quartile. Results show that the increase in labor force non-participation of men is largest in CZs with heavy utilization of industrial robots (5.37 percentage points), whereas we observe no particular correlation between the decline in non-participation of women and robot exposure. Note, too, that male non-participation was already on an increasing trend since the 1970s in more exposed areas and, as illustrated in Table A2, these CZs are also highly exposed to import competition from China during our sample period. We account for this threat to identification in developing our empirical strategy.
As outlined, a potential margin of adjustment against robot exposure is disability enrollment. We are unable to determine, however, whether an increase in disability take-up is associated with a deterioration in the health condition of displaced workers or if individuals are misusing the SSDI as a sort of permanent unemployment insurance (Ford 2015). We investigate this question by supplementing labor market data with indicators of mental and physical health conditions at the CZ level from the Behavioral Risk Factor Surveillance System (BRFSS) of the Centers for Disease Control and Prevention (CDC) and the National Inpatient Sample (NIS) of the Healthcare Cost and Utilization Project (HCUP). We provide additional details on the data in Appendix A2.
Empirical Strategy
We estimate the effect of robots on the margins of adjustment of non-participants using a stacked first-difference specification with 722 CZs and three time periods (1993–2000, 2000–2007, 2007–2014). 1 The key estimating equation is given by:

where
We build a measure of robot exposure at the CZ level using a shift-share approach. We follow Acemoglu and Restrepo (2020) and match industry-level data from the IFR with employment counts from the Census:
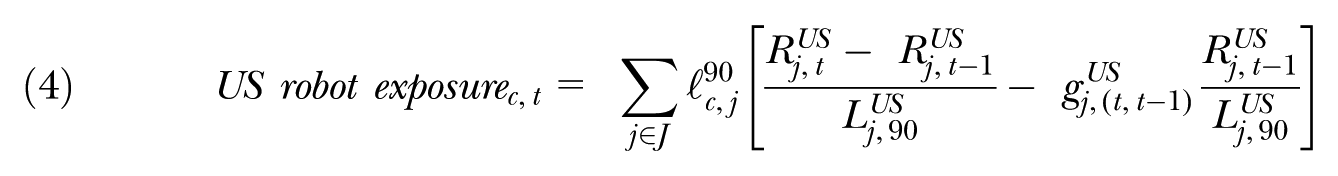
The term in brackets (shift-component) is a measure of industrial robot density, computed as the US-wide change in the stock of robots in industry j ∈ J, relative to its workforce in 1990, and adjusted for the adoption of robots that is driven by overall industry output growth,
Identification builds on the assumption that advances in robotics vary by industry and expose CZs differently depending on the industrial composition of employment. The adoption of robots, however, is likely to be correlated also with local labor market conditions that affect the demand for labor and, therefore, labor force participation rates. For instance, positive demand shocks might induce US firms to raise both capital and employment, biasing upward the estimates of the effect of robots on labor demand.
To address the endogeneity concern and identify robot adoption that is driven by the supply channel, we instrument the shift-component of Equation (4) using contemporaneous changes in the stock of robots in seven European countries with a comparable adoption of robots as the United States:
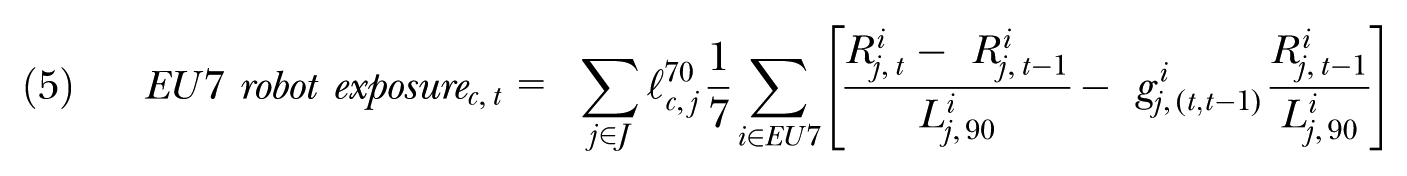
where
Our instrumental variables (IV) strategy aims to identify the labor market effects of exogenous improvements in robotics available to US firms. The strategy relies on the assumption that the adoption of robots in European countries is positively related to the adoption of robots in the United States but is unrelated to domestic labor market conditions. The first condition can be easily verified (see first-stage results in Table 2), while we discuss possible threats to identification related to the exclusion restriction in Appendix A4. Reassuringly, the empirical results are robust and survive a variety of tests, including checks for international product market competition from Europe, industry trends (Goldsmith-Pinkham, Sorkin, and Swift 2020), and labor market pre-trends.
Robots and Non-participation
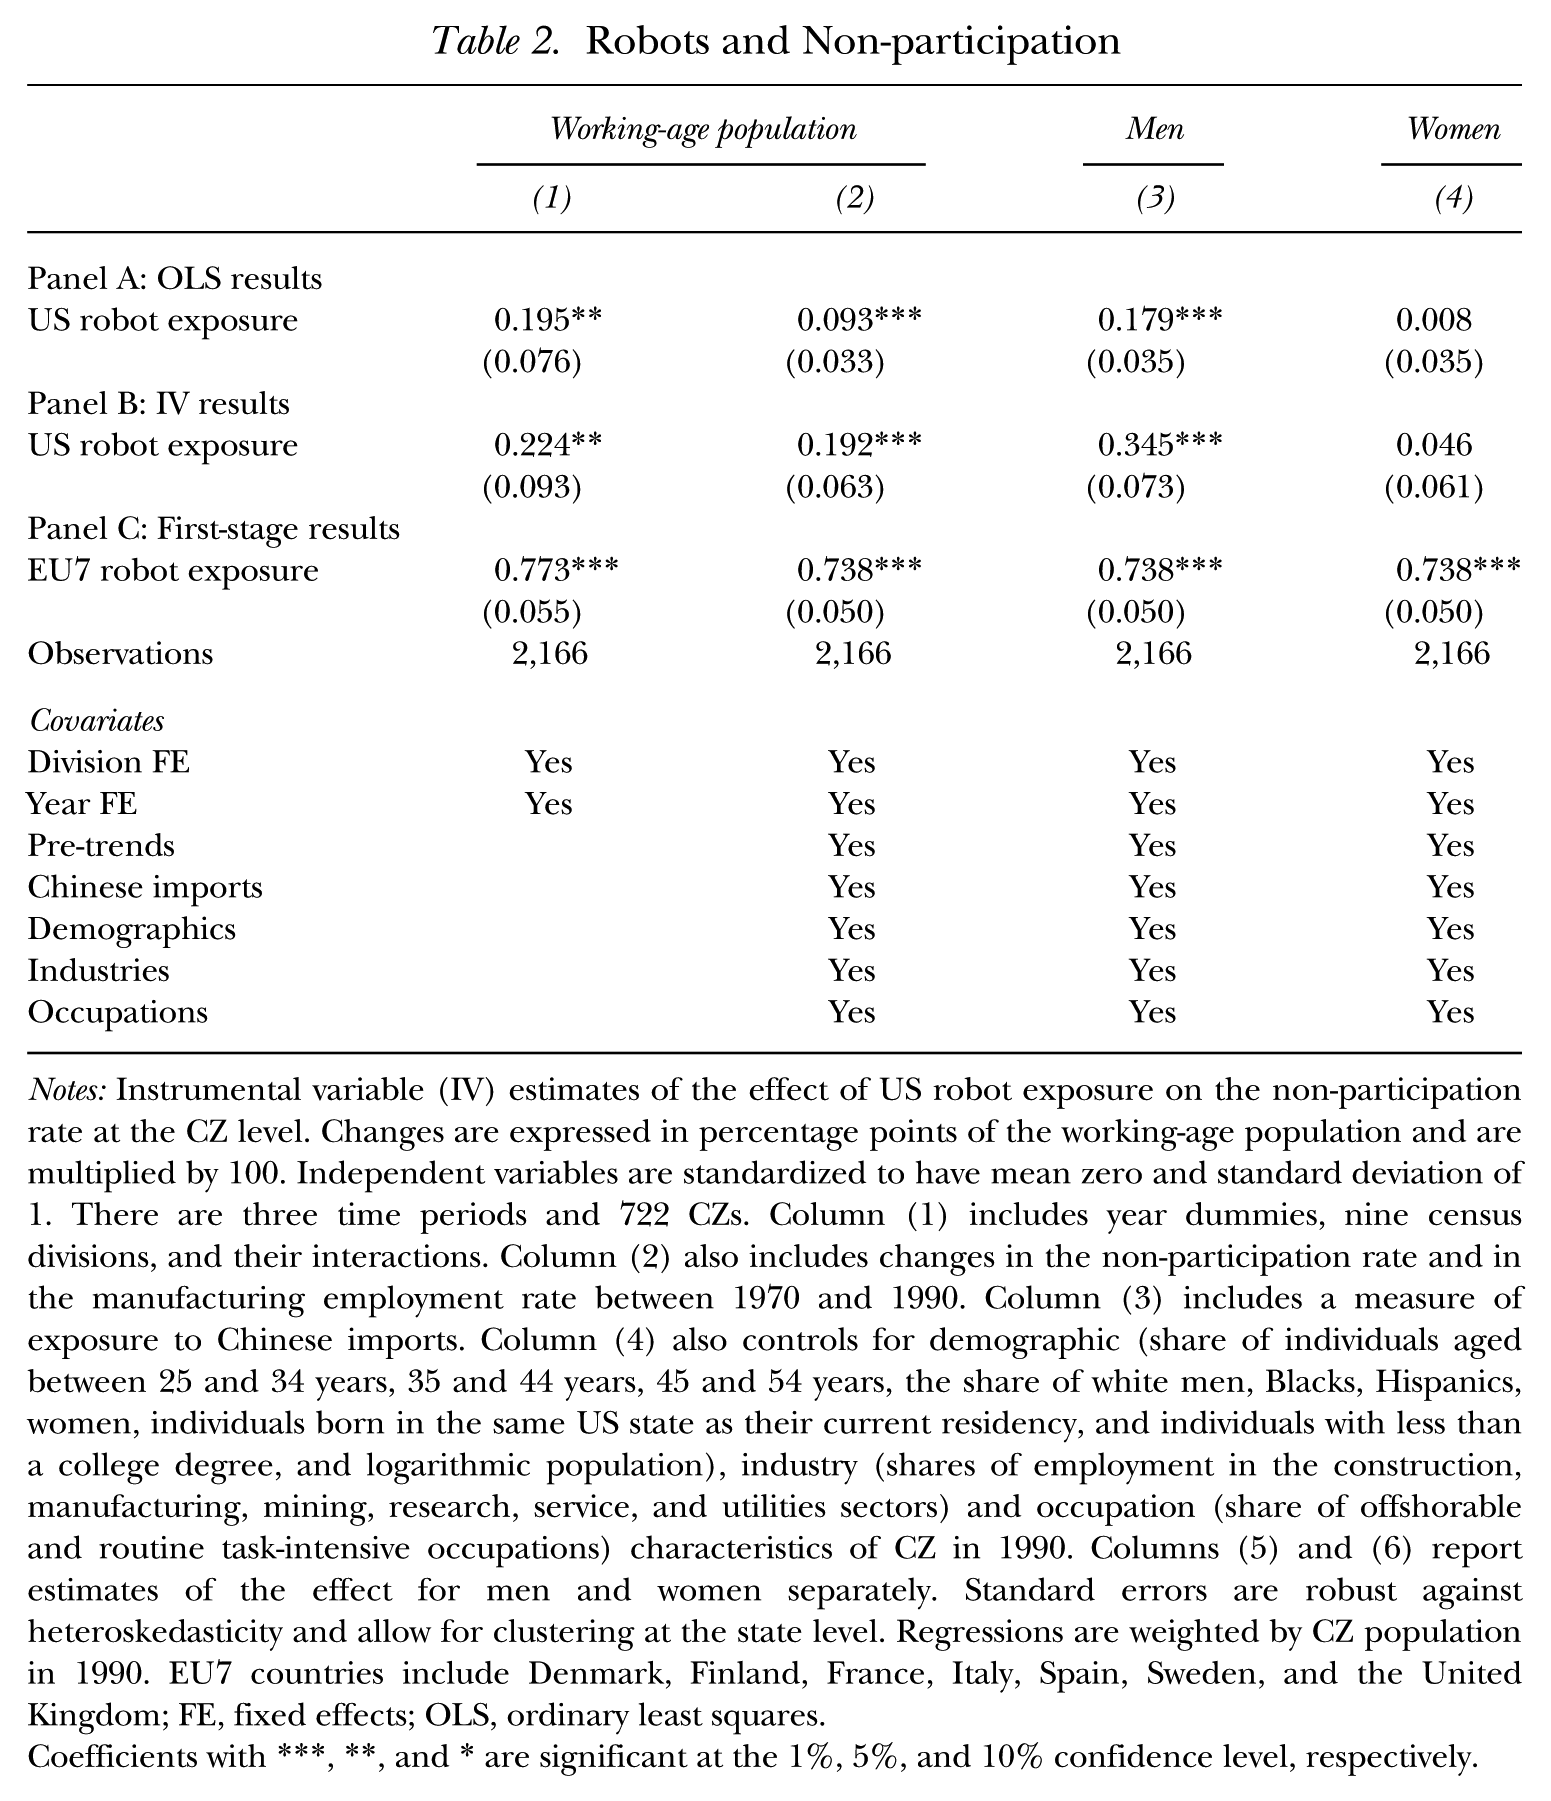
Notes: Instrumental variable (IV) estimates of the effect of US robot exposure on the non-participation rate at the CZ level. Changes are expressed in percentage points of the working-age population and are multiplied by 100. Independent variables are standardized to have mean zero and standard deviation of 1. There are three time periods and 722 CZs. Column (1) includes year dummies, nine census divisions, and their interactions. Column (2) also includes changes in the non-participation rate and in the manufacturing employment rate between 1970 and 1990. Column (3) includes a measure of exposure to Chinese imports. Column (4) also controls for demographic (share of individuals aged between 25 and 34 years, 35 and 44 years, 45 and 54 years, the share of white men, Blacks, Hispanics, women, individuals born in the same US state as their current residency, and individuals with less than a college degree, and logarithmic population), industry (shares of employment in the construction, manufacturing, mining, research, service, and utilities sectors) and occupation (share of offshorable and routine task-intensive occupations) characteristics of CZ in 1990. Columns (5) and (6) report estimates of the effect for men and women separately. Standard errors are robust against heteroskedasticity and allow for clustering at the state level. Regressions are weighted by CZ population in 1990. EU7 countries include Denmark, Finland, France, Italy, Spain, Sweden, and the United Kingdom; FE, fixed effects; OLS, ordinary least squares.Coefficients with ***, **, and * are significant at the 1%, 5%, and 10% confidence level, respectively.
Results
Margins of Adjustment of Non-participants
We start the analysis by presenting the impact of robot exposure on US labor force non-participation. Table 2 reports ordinary least squares (OLS) and IV estimates, as well as first-stage results. The coefficients are standardized and represent the estimated labor market effect of a one standard deviation increase in robot exposure. Regressions are weighted by the 1990 CZ population and standard errors allow for arbitrary clustering at the state level.
Column (1) presents a baseline specification that accounts only for division-specific business cycles. The following columns include additional covariates that might confound the labor market effect of robots. The absolute size of OLS estimates is smaller than that of IV estimates across all specifications since US robot adoption is likely to be correlated with omitted demand shocks that bias the estimates toward zero.
In line with the findings of Acemoglu and Restrepo (2020), our results show that robots have an adverse effect on US labor markets. They suggest that each robot reduces employment by approximately six workers in a local labor market. We find that, on average, a one standard deviation increase in robot exposure decreases labor force participation by 0.192 percentage points, which translates into a decrease in the local labor force of approximately four workers for each additional robot.
In addition to Acemoglu and Restrepo (2020), we account for the effect of robots during and after the Great Recession as well. The results are relatively similar with and without accounting for the 2007–2014 period (see Table A14), suggesting that the increase in non-participants accounts for more than half of the employment effects of robots.
Table 2, columns (3) and (4) analyze the impact of robot exposure on non-participation by gender. Results show that the effect is fully driven by men. Even though Acemoglu and Restrepo (2020) and Lerch (2025) found that robot exposure decreases the employment rate of both men and women, only men respond by leaving the labor force. The magnitude of this result suggests that the introduction of robots between 1993 and 2014 has had an impact on the labor force non-participation rate of men that is equivalent to approximately 18% of its secular increase. 2 The following analysis focuses on the characteristics of displaced male workers after they have left the labor force.
Table 3 decomposes the effect of robots on non-participation of men from Table 2 into the main margins of adjustment of non-participants. In particular, we focus on college enrollment, disability insurance take-up, early retirement, household income, private savings, and idle individuals. We focus on these margins as they have been identified as being the most relevant for non-participants (Deshpande and Lockwood 2022) and are detected by Census and ACS data. The table reports the estimated coefficients and standard errors using Equation (3), as well as the share of each margin of adjustment on the effect on non-participation of men from Table 2, panel B, column (3) (0.345).
Margins of Adjustment of Non-Participants
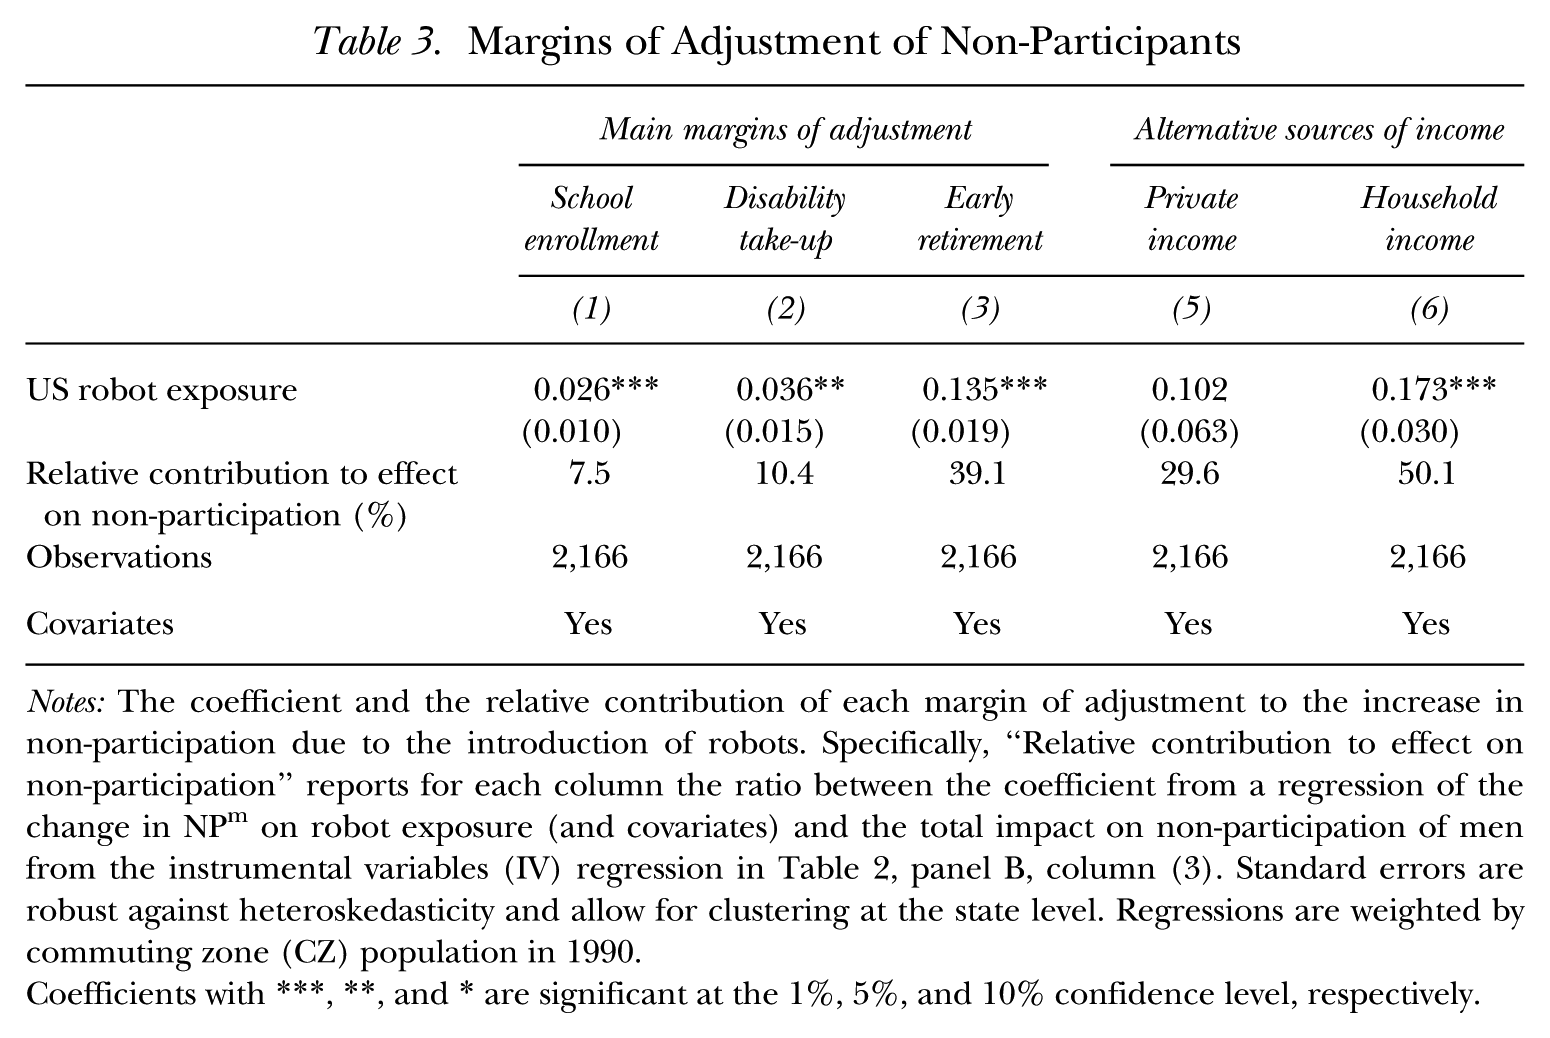
Notes: The coefficient and the relative contribution of each margin of adjustment to the increase in non-participation due to the introduction of robots. Specifically, “Relative contribution to effect on non-participation” reports for each column the ratio between the coefficient from a regression of the change in NPm on robot exposure (and covariates) and the total impact on non-participation of men from the instrumental variables (IV) regression in Table 2, panel B, column (3). Standard errors are robust against heteroskedasticity and allow for clustering at the state level. Regressions are weighted by commuting zone (CZ) population in 1990.Coefficients with ***, **, and * are significant at the 1%, 5%, and 10% confidence level, respectively.
As we anticipated in the Data section, some of the margins of adjustment might not be mutually exclusive. For instance, non-participants who rely on their household income or who rely on private savings might also be enrolled in college, be disability income beneficiaries, or be early retirees. Therefore, the estimated effect on the margins of adjustment of non-participants does not necessarily add up to the overall effect on non-participation from Table 2.
Table 3, column (1), shows that 7.5% of the non-participants are enrolled in college. These individuals are either delaying their labor market entry or they are temporarily leaving the labor force to invest in additional human capital to increase their labor market competitiveness, either through a GED, college, or a graduate degree. 3 Table A3 shows that the effect is mostly driven by individuals below the age of 35, implying that the effect is predominantly confined to individuals in their early prime age. This finding is consistent with the result of Di Giacomo and Lerch (2023), who illustrated the surge in enrollment in US community colleges resulting from robot adoption. Similarly, it echoes the findings of Dauth et al. (2021), indicating that in Germany, robots have bolstered the ratio of college graduates while reducing the proportion of workers who have completed an apprenticeship. 4
Column (2) shows that 10.4% of non-participants receive disability income from SSDI. This result is in line with previous literature that shows that labor demand shocks and poor labor market conditions are significantly affecting disability take-up in the United States (e.g., Black et al. 2002; Autor et al. 2013; Maestas et al. 2015). Two channels may fuel the rise in disability take-up of prime-age workers. First, SSDI acts as a sort of permanent unemployment insurance against the risks of automation and worse future job prospects (Ford 2015). Second, adverse shocks affect the health condition of workers who, as a consequence, become eligible for disability benefits (Rege, Telle, and Votruba 2009; Sullivan and Von Wachter 2009; Schaller and Stevens 2015; Adda and Fawaz 2020).
In line with this framework, the fraction of disability claims related to difficult-to-verify impairments has risen substantially over the past four decades (Autor and Duggan 2003; Liebman 2015), suggesting that SSDI could be misused as a sort of permanent unemployment insurance against adverse shocks (Ford 2015; Deshpande and Lockwood 2022). Other empirical work argues that poor labor market conditions could also directly affect workers’ health (Hollingsworth, Ruhm, and Simon 2017), and that poor health is one of the main reasons individuals do not join the labor force (Parsons 1980a, 1980b; Krueger 2017). Evidence shows that the high job insecurity during periods of poor labor market conditions and the exposure to trade shocks during the 2000s led to a substantial increase in mental health problems among working-age Americans (Lang et al. 2019; Adda and Fawaz 2020; Pierce and Schott 2020), with the strongest deterioration in health conditions among white males (Case and Deaton 2015, 2017). While we cannot exclude that non-participants are misusing SSDI as insurance against adverse labor market shocks (Ford 2015; Deshpande and Lockwood 2022), in the upcoming section on health outcomes we provide suggestive evidence that the increase in disability take-up might be associated with a worsening of health outcomes among non-participants.
Table 3, column (3) shows that 39.1% of non-participants retire early. This result confirms previous findings that highlighted that workers older than 55 are eligible for some form of retirement income and retire early when facing labor-displacing technological progress (Bartel and Sicherman 1993; Peracchi and Welch 1994; Ahituv and Zeira 2011; Burlon and Vilalta-Bufí 2016). Adding up the estimates from columns (2) and (3), we find that approximately half of the non-participants leave the labor force permanently, as only a few disability beneficiaries and retirees rejoin the labor force in the future (Parsons 1980a, 1980b; Krueger 2017).
Our results suggest that nearly 6 out of 10 non-participants are either enrolled in school, receiving disability insurance, or retiring early. This finding, however, raises the question of where the remaining 40% of individuals, who are not participating in the labor force due to robots, shift to when they leave the labor force. We address this question in the subsequent columns of Table 3. Columns (4) and (5) show the results on the share of non-participants who rely on income from their household members (including partners, parents, adult children, or siblings) as well as for the share of non-participants who rely on the income they earned in the past year. We find that half of the non-participants live on their household members’ income and almost one-third have earned some income in the previous year. Accounting only for the margins of adjustment of non-participants who are not enrolled in school, who do not receive any disability benefits, and who are not retired, we instead find that 25.1% of them rely on the income of other household members, and 14.3% live off their savings. These non-participants are more likely to (re)join the labor force in future years, as are non-participants who are enrolled in school, compared to disability insurance beneficiaries and early retirees. Finally, we find that less than 5% of non-participants are idle and do not fall into any of these categories. 5
Demographics of Non-participants
To understand the underlying causes that drive individuals out of the labor force and into a particular margin of adjustment, we must account for their sociodemographic characteristics. For this purpose, we break down the estimated effect of robots on non-participation of men by race and ethnicity (whites and racial/ethnic minorities), age groups (25–34, 35–44, 45–54, and 55–64 years), and education levels (with and without a college degree). This breakdown is achieved by using a decomposition exercise analogous to Equation (2), but for demographic groups
where
Table 4, panel A, illustrates the relative contribution of each group to the aggregate effect of robots on non-participation. Results show that the increase in non-participation is fueled in similar proportions by whites and racial/ethnic minorities and that it is caused predominantly by less-educated workers. This result is in line with previous literature, which argues that workers with a college degree are often employed in occupations that require the use of communication and interpersonal skills that are more difficult to automate (Acemoglu and Autor 2011). However, this effect is also mechanically small due to the relatively low share of the population with a college degree (below 32% between 1990 and 2014). The same reasoning applies to racial and ethnic minorities, who make up less than 36% of the population.
Non-participation by Demographics
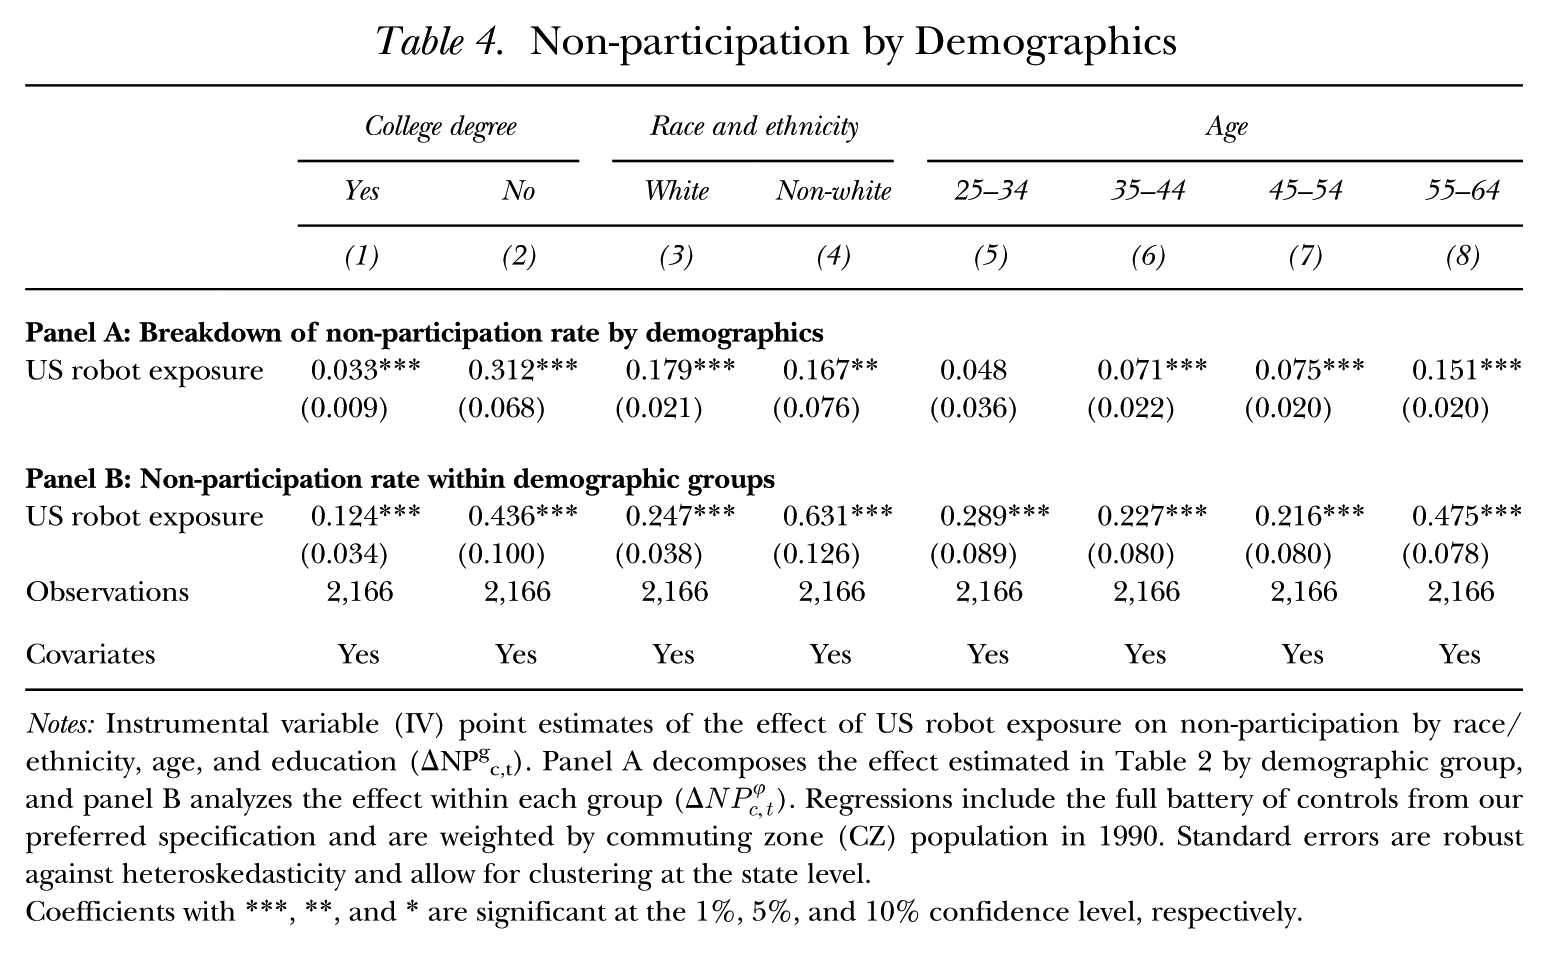
Notes: Instrumental variable (IV) point estimates of the effect of US robot exposure on non-participation by race/ethnicity, age, and education (ΔNPgc,t). Panel A decomposes the effect estimated in Table 2 by demographic group, and panel B analyzes the effect within each group (Δ
Finally, the effect of robots on labor force dropouts increases with age (though not monotonically among each group). Individuals between 55 and 64 years account for 40% of the overall increase in non-participation. Again, this result is likely to be subject to underlying composition effects unrelated to robot adoption, such as population aging, and differences in the size of the population attributable to older individuals having lower labor force participation rates.
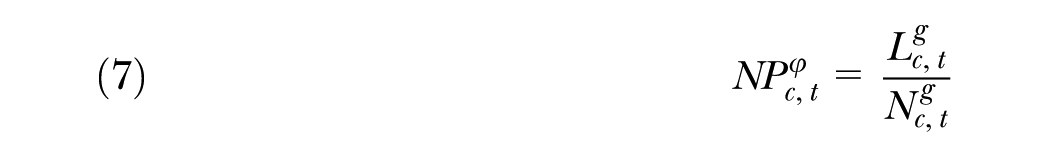
To account for these effects, we further analyze changes in the non-participation rate within population subgroups. This analysis is achieved by reconstructing our dependent variables, the change in non-participants of demographic group g,
The impact of robot exposure on demographic-specific non-participation rates obtained using the regression analysis presented in Equation (3) is illustrated in Table 4, panel B. When accounting for the relative population size of demographic groups, the adverse effect of robots on the non-participation rate of racial and ethnic minorities stands out. The increase is more than twice that of whites. This result follows from the fact these workers are often over-represented in blue-collar jobs with a high workload of manual tasks, which are more susceptible to automation through industrial robots (Lerch 2025). 6
Migration
The literature on regional shocks has identified workers’ geographic mobility as one of the key channels through which labor markets adjust to local economic shocks (Blanchard and Katz 1992; Howard 2020). A recent study by Faber et al. (2022) has shown that the introduction of robots has a negative effect on the population by reducing the inflow of prospective migrants in the local labor market. This effect is likely to affect the composition of the local labor force. In particular, the reduced inflow of workers could mechanically increase the share of non-participants.
Table 5 confirms these results, showing that robots reduce the inflow of migrants from different US states. While they do not affect the outflow of migrants, they also do not affect the inflow of migrants from other CZs in the same state. Moreover, column (5) shows the impact of robots on non-participation among individuals who live in their state of birth. 7 The estimate is not economically nor statistically different from our preferred specification’s estimate.
Migration Flows and Place of Birth
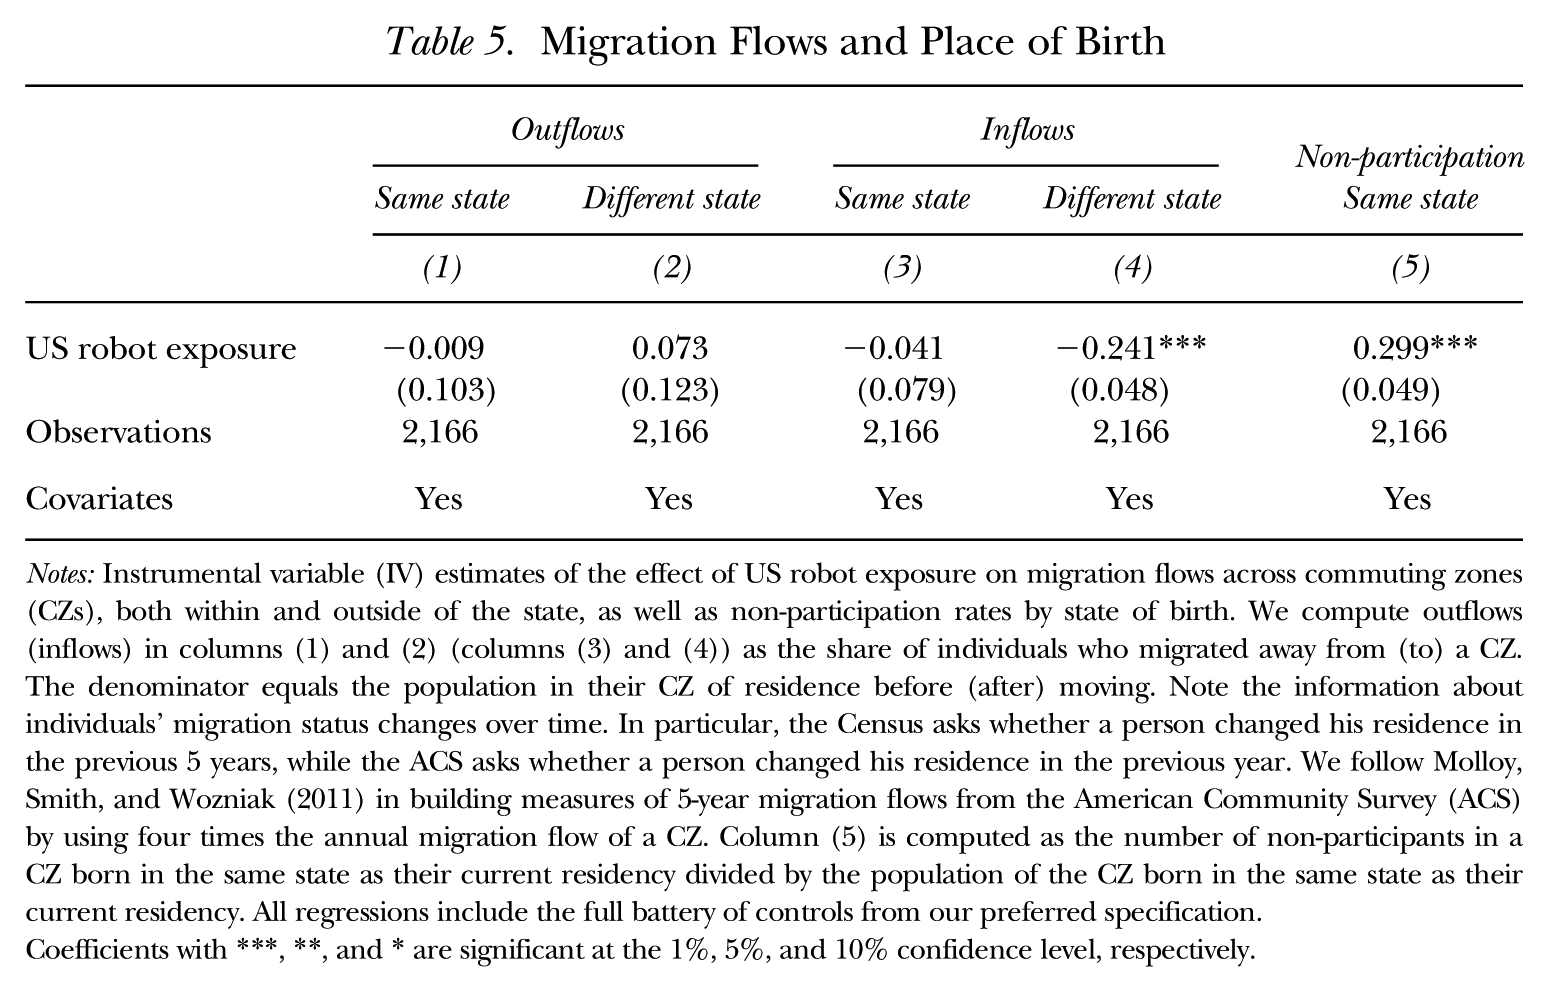
Notes: Instrumental variable (IV) estimates of the effect of US robot exposure on migration flows across commuting zones (CZs), both within and outside of the state, as well as non-participation rates by state of birth. We compute outflows (inflows) in columns (1) and (2) (columns (3) and (4)) as the share of individuals who migrated away from (to) a CZ. The denominator equals the population in their CZ of residence before (after) moving. Note the information about individuals’ migration status changes over time. In particular, the Census asks whether a person changed his residence in the previous 5 years, while the ACS asks whether a person changed his residence in the previous year. We follow Molloy, Smith, and Wozniak (2011) in building measures of 5-year migration flows from the American Community Survey (ACS) by using four times the annual migration flow of a CZ. Column (5) is computed as the number of non-participants in a CZ born in the same state as their current residency divided by the population of the CZ born in the same state as their current residency. All regressions include the full battery of controls from our preferred specification.Coefficients with ***, **, and * are significant at the 1%, 5%, and 10% confidence level, respectively.
These results suggest that the effect of robot exposure on non-participation is more likely to reflect individuals’ change in employment status rather than changes in the composition of the labor force through migratory flows. We address this point further in the next section.
Change of Employment Status
Here, we shed light on whether the introduction of robots has affected the flow of non-participants in and out of employment. The results are summarized in Table 6. Column (1) shows the effect of robots on non-participation of individuals who moved from employment to non-participation. These individuals have been (directly or indirectly) displaced from the labor market and, as a consequence, left the labor force. Column (2) shows the impact on non-participation of individuals who were already non-participants and those who moved from unemployment to non-participation. These non-participants were unable or unwilling to seek employment when exposed to robots in their CZ of residence.
Non-participants Previously Employed
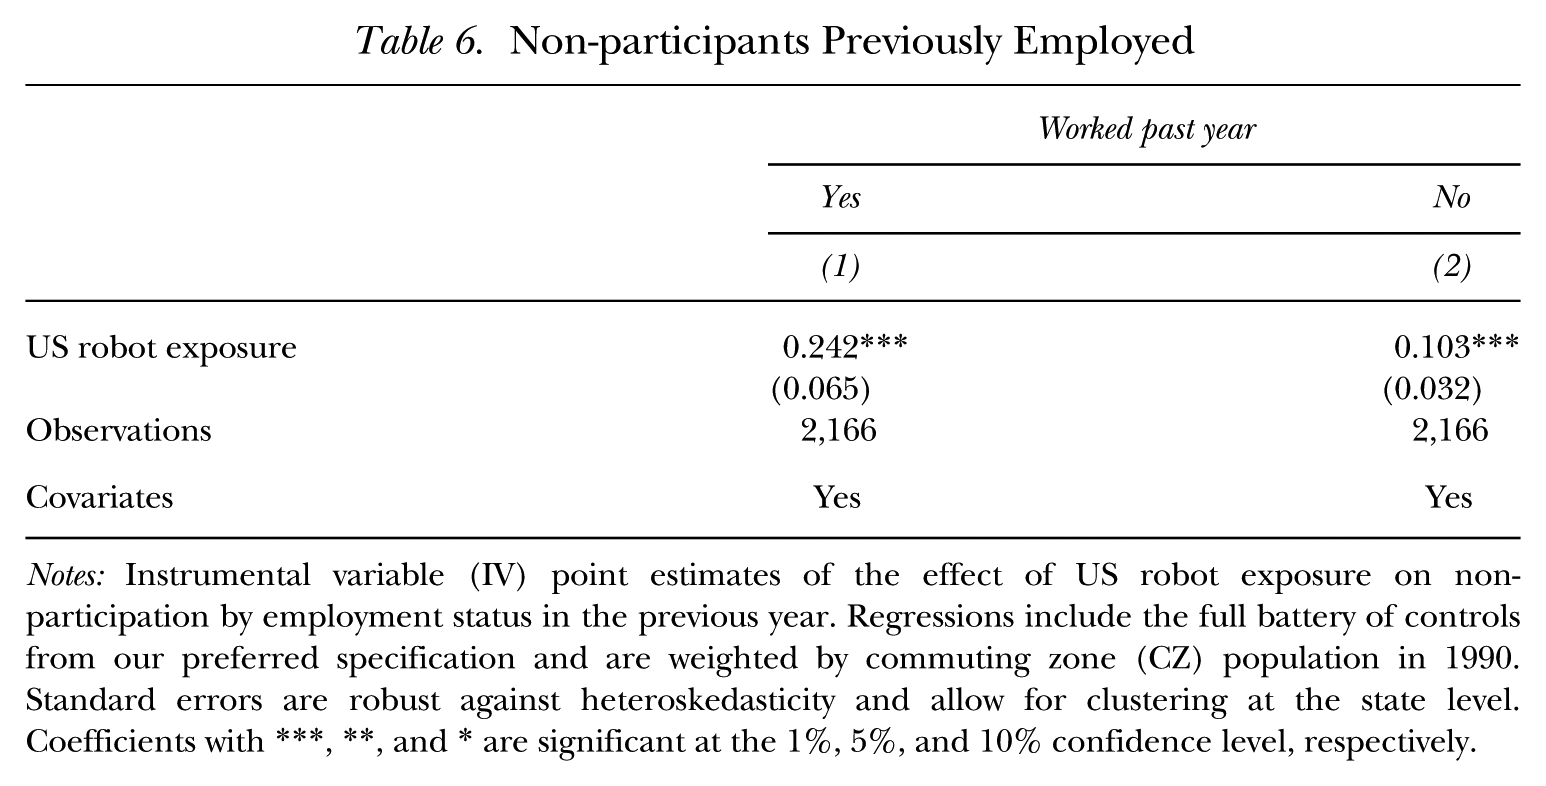
Notes: Instrumental variable (IV) point estimates of the effect of US robot exposure on non-participation by employment status in the previous year. Regressions include the full battery of controls from our preferred specification and are weighted by commuting zone (CZ) population in 1990. Standard errors are robust against heteroskedasticity and allow for clustering at the state level. Coefficients with ***, **, and * are significant at the 1%, 5%, and 10% confidence level, respectively.
We find that approximately 70% of the increase in non-participants observed in Table 2 (0.242/0.345) consists of individuals who were employed in the previous year. This result shows that robots have displaced from the labor market a significant fraction of workers. The remaining 30% consists of non-participants who were not employed in the past year.
Health Outcomes
Next, we analyze how robot exposure affects the health outcomes of non-participants. Table 7 reports estimates of the labor market effect of robot exposure on self-reported health conditions. We find that robot exposure increases the share of non-participants who report suffering from persistent physical health problems. Although the estimated impact of robots on the share of individuals who report fair or poor health and persistent mental problems is positive, these effects are not statistically significant. 8
Self-perceived Health
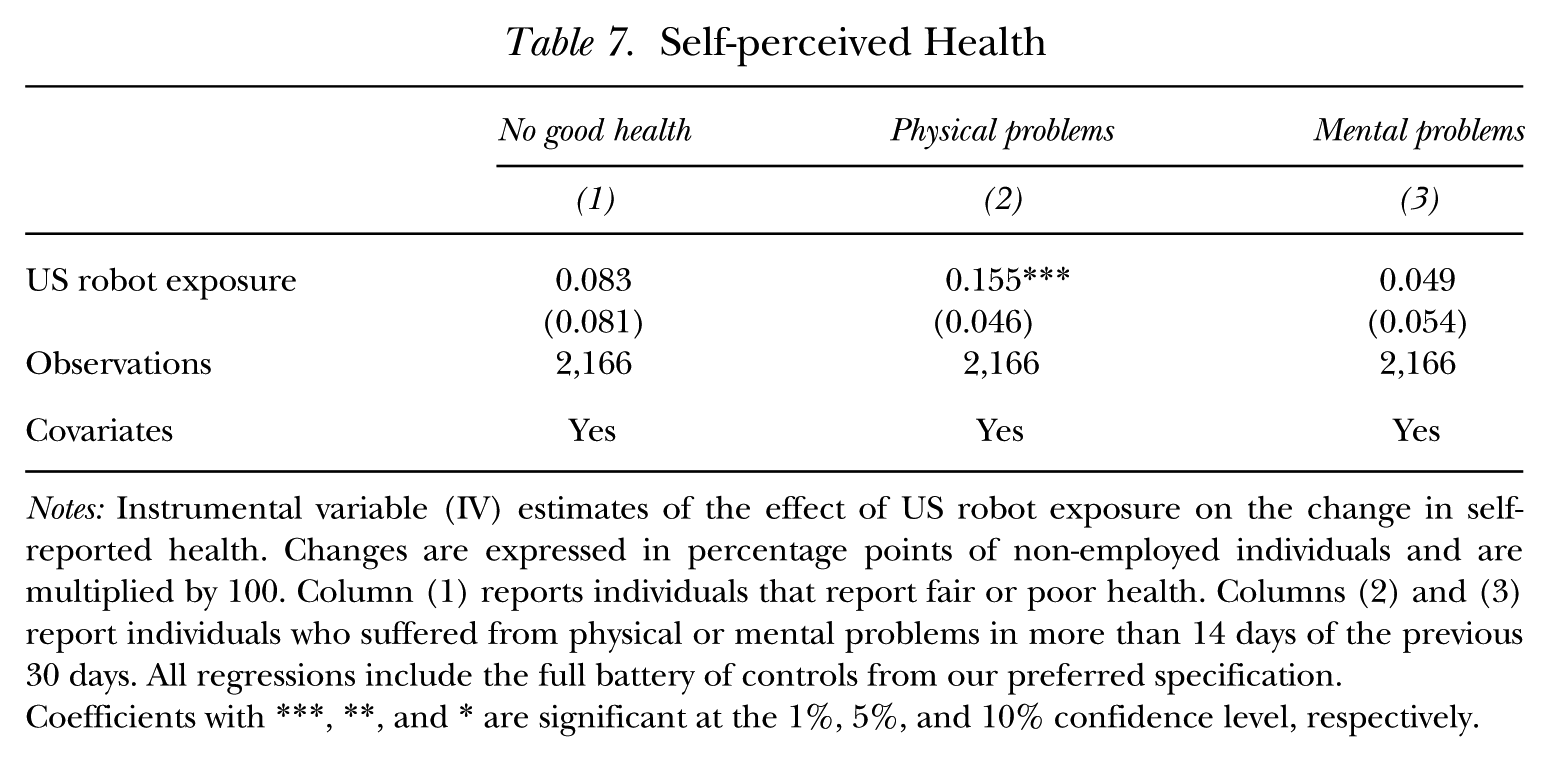
Notes: Instrumental variable (IV) estimates of the effect of US robot exposure on the change in self-reported health. Changes are expressed in percentage points of non-employed individuals and are multiplied by 100. Column (1) reports individuals that report fair or poor health. Columns (2) and (3) report individuals who suffered from physical or mental problems in more than 14 days of the previous 30 days. All regressions include the full battery of controls from our preferred specification. Coefficients with ***, **, and * are significant at the 1%, 5%, and 10% confidence level, respectively.
Additionally, Table A4 shows that exposure to robots increases regular drinking behavior and decreases physical activity, raising the share of non-employed individuals who suffer from obesity, in particular among whites. Moreover, Table A5 shows that robot exposure has no adverse effects on the self-perceived health conditions of employed workers, suggesting that the impact of robots on individuals’ health depends on their employment status. 9
The adoption of robots might affect workers’ health conditions in two (not mutually exclusive) ways. First, workers who already suffer from health problems are less productive and are, therefore, more likely to be displaced by robots. These workers mechanically increase the share of non-employed individuals who suffer from health problems (Frank et al. 2019). Second, the health condition of displaced workers deteriorates after a job loss (Sullivan and Von Wachter 2009). This mechanism is likely to be reinforced by the fact that for many US workers, losing their jobs is associated with losing health insurance (Schaller and Stevens 2015). Indeed, Table A4 shows that robot exposure decreases the share of non-employed whites with health care coverage. This, in turn, increases the share of individuals who cannot afford a doctor visit for cost reasons and who had no medical checkup in the previous two years. The inability to be treated by a doctor in case of need may substantially worsen individuals’ health conditions which, if neglected for too long, may become severe and eventually lead to a disability. If this is the case, we should also observe a rise in hospitalization rates with acute health problems in areas that are more exposed to robots.
Table 8 summarizes the results on the effect of robots on the share of hospital admissions with a length of stay of more than seven days (they are most likely to be related to a severe health condition) and a disability-related diagnosis. 10 We use shares in terms of hospital admissions (rather than in per capita terms) because the sample of US community hospitals is changing from year to year, making a comparison of per capita values across years uninformative. 11
Hospitalizations
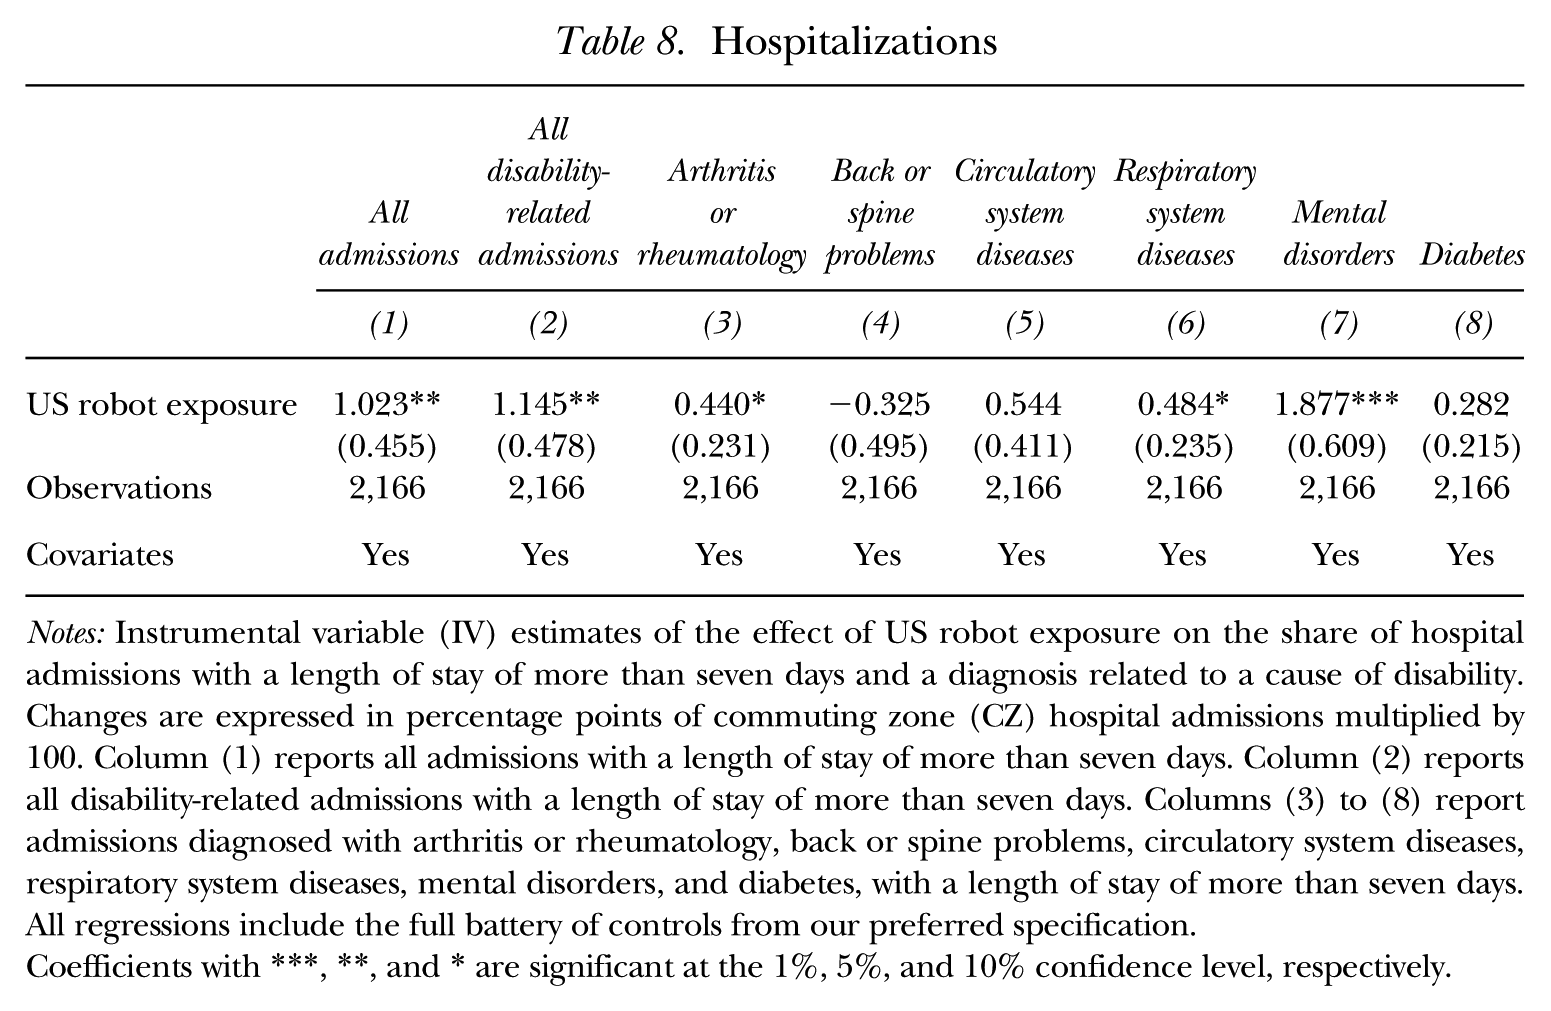
Notes: Instrumental variable (IV) estimates of the effect of US robot exposure on the share of hospital admissions with a length of stay of more than seven days and a diagnosis related to a cause of disability. Changes are expressed in percentage points of commuting zone (CZ) hospital admissions multiplied by 100. Column (1) reports all admissions with a length of stay of more than seven days. Column (2) reports all disability-related admissions with a length of stay of more than seven days. Columns (3) to (8) report admissions diagnosed with arthritis or rheumatology, back or spine problems, circulatory system diseases, respiratory system diseases, mental disorders, and diabetes, with a length of stay of more than seven days. All regressions include the full battery of controls from our preferred specification.Coefficients with ***, **, and * are significant at the 1%, 5%, and 10% confidence level, respectively.
Results show that robots increase the relative share of admissions with an acute health condition and, in particular, that they increase the relative share of admissions diagnosed with mental disorders. 12 Robot exposure also increases the relative share of severe hospital admissions related to substance abuse, such as alcohol, drug (in particular opioid), and tobacco abuse (see Table A9). These diagnoses are often related to mental disorders. 13
These findings provide suggestive evidence that the increasing disability take-up in CZs that are more exposed to robots might be associated with a deterioration in individuals’ health condition.
Conclusions
This article investigates the margins of adjustment of US workers after they were displaced by industrial robots between 1993 and 2014. By exploiting plausibly exogenous variation in robot exposure across local labor markets over time, we find that robots have an adverse effect on the labor force participation of men, but not of women. The impact is concentrated among workers without a college degree, it increases with age, and is strongest among racial and ethnic minorities.
Overall, each additional robot drives four workers out of the labor market. The margins of adjustment for these individuals include college enrollment (7.5%), disability take-up (10.4%), and early retirement (39.1%). Moreover, non-participants (in particular those who do not fall in any of these categories) often rely on income of their household members or live off their savings. The rising enrollment in SSDI coincides with robots negatively affecting workers’ self-reported health, and an increasing share of hospital admissions diagnosed with acute mental disorders.
The rapid progress in automation technologies is likely to intensify the mismatch between the skill requirements of jobs and the skills of workers. As a result, workers may increasingly drop out of the labor force to seek alternative sources of income, unless they are endowed with redeployable human capital. Our findings highlight the need for policymakers to design policies that facilitate the transition of the workforce to new jobs, and to improve the interplay between workers and machines through education and on-the-job training.
Supplemental Material
sj-pdf-1-ilr-10.1177_00197939251373051 – Supplemental material for Robots and Non-participation in the United States: Where Have All the Workers Gone?
Supplemental material, sj-pdf-1-ilr-10.1177_00197939251373051 for Robots and Non-participation in the United States: Where Have All the Workers Gone? by Giuseppe Di Giacomo and Benjamin Lerch in ILR Review
Footnotes
Acknowledgements
We are extremely grateful to Giovanni Pica for his guidance in this project. We thank Daron Acemoglu, David Autor, David Dorn, Marius Faber, Lorenz Kueng, Fabrizio Mazzonna, Matt Notowidigdo, Luigi Pistaferri, Pascual Restrepo, Isaac Sorkin, and the participants of the USI Brown Bag Seminars; the 2021 Young Swiss Economists Meeting; the 3rd QMUL Economics and Finance Workshop; as well as the faculty of the Department of Economics at Università della Svizzera italiana and Stanford University for valuable feedback. We also thank Pascual Restrepo for sharing their data.
Giuseppe Di Giacomo gratefully acknowledges financial support from the Swiss National Science Foundation grant No. 100018_197802.
The views expressed in this article are those of the authors and do not necessarily reflect the official position of the Swiss Federal Finance Administration, the Federal Department of Finance, or the Federal Council.
For general questions as well as for information regarding the data and/or computer programs, please contact the authors at
1
2
3
The General Educational Diploma (GED) is a high school equivalent diploma designed for individuals who have not completed high school. The GED can be used to apply to college just like a traditional high school diploma.
4
Our results on schooling focus on attendance in degree-granting institutions. They do not include enrollment in a trade or business school, or company training, as information about enrollment in these programs is not detected by Census and ACS data. However, certificates or other non-degree credentials are potentially important for affected workers seeking to transition to new employment. This fact may be particularly true for workers over 35 years of age. Indeed, Katz, Roth, Hendra, and Schaberg (2022) exploited data from four randomized controlled trials (RCTs) on sector-focused training programs designed for low-wage workers and found a significant increase in earnings after participants complete the training. They suggested that the earnings gains result from placing participants in higher-paying jobs, rather than solely increasing employment rates. On the contrary, other papers have shown that US training programs produce mixed results, with few instances of substantial and lasting increases in earnings (Greenberg, Michalopoulos, and Robbins 2003; Card, Kluve, and Weber 2018; ![]() ).
).
5
Results are available on request.
6
Table A27 in ![]() applies the same decomposition exercise to each margin of adjustment across demographic groups to investigate whether significant differences exist across non-participants depending on their demographics. Results suggest that non-participants who are enrolled in college are between 25 and 34 years, white, and enrolled in graduate or professional schools, given that most of them have already achieved a bachelor’s degree. Middle-aged (35–54 years) and older workers (55–64 years), by contrast, do not invest in additional human capital by enrolling in college, but rather leave the labor force permanently by enrolling in disability insurance or retiring early. We also find that a significant fraction of non-participants across all demographic groups relies on their household income, their private savings, or, in particular for less-educated racial and ethnic minorities, are idle.
applies the same decomposition exercise to each margin of adjustment across demographic groups to investigate whether significant differences exist across non-participants depending on their demographics. Results suggest that non-participants who are enrolled in college are between 25 and 34 years, white, and enrolled in graduate or professional schools, given that most of them have already achieved a bachelor’s degree. Middle-aged (35–54 years) and older workers (55–64 years), by contrast, do not invest in additional human capital by enrolling in college, but rather leave the labor force permanently by enrolling in disability insurance or retiring early. We also find that a significant fraction of non-participants across all demographic groups relies on their household income, their private savings, or, in particular for less-educated racial and ethnic minorities, are idle.
7
Unfortunately, the US Census/ACS do not provide information about the place of birth of individuals more granular than the state.
9
10
11
This approach does not entirely resolve the issue of changes in the sample of hospitals, which complicates the interpretation of our results. Specifically, robot adoption could influence both the numerator and the denominator of our regression. It may increase the number of severe cases while reducing hospital admissions for non-severe cases, as individuals with less insurance coverage might limit their use of medical services. We also run a regression of the log of total hospital admissions on robot exposure and find no statistically significant results.
12
The effect on all disability-related admissions (column (2)) remains positive and statistically significant when we construct the variable as a share of all hospital admissions with a length of stay exceeding seven days.
13
Table A8 reports estimates of the effect of robots on the share of disability-related hospital admissions by diagnosis including all admissions, while ![]() reports estimates of the impact of robots on the share of diagnoses that are not directly related to a disability. We find no evidence that robots are systematically affecting the health outcomes of these individuals.
reports estimates of the impact of robots on the share of diagnoses that are not directly related to a disability. We find no evidence that robots are systematically affecting the health outcomes of these individuals.
References
Supplementary Material
Please find the following supplemental material available below.
For Open Access articles published under a Creative Commons License, all supplemental material carries the same license as the article it is associated with.
For non-Open Access articles published, all supplemental material carries a non-exclusive license, and permission requests for re-use of supplemental material or any part of supplemental material shall be sent directly to the copyright owner as specified in the copyright notice associated with the article.