
Abstract
The authors estimate the effects of an increase in the youth minimum wage in the Netherlands on low-paid workers’ employment and earnings, using a difference-in-differences approach with detailed administrative data. Findings show that the increase does not have a negative effect on the number of jobs or hours worked, hence raising overall earnings for affected workers. Further, the minimum wage increase has substantial spillover effects, accounting for close to 70% of the average wage increase experienced by workers. While employment grows in fixed-term and temporary help agency contracts, the authors do not find evidence of declines in employment in other types of work arrangements, nor of labor-labor substitution. Labor market outcomes evolve most favorably for full-time incumbent workers who are not enrolled in education and are thus less likely to be transient occupants of minimum wage jobs.
The past decades have witnessed increasing inequality in many developed countries (OECD 2015). Minimum wage increases are an important policy instrument to counteract inequality at the bottom of the labor market, as real minimum wages have important consequences for the evolution of lower-tail inequality (Lee 1999; Autor, Manning, and Smith 2016; Engbom and Moser 2018). However, because minimum wages raise employers’ labor costs, they may have adverse consequences for employment among affected groups of workers.
In this article, we study one of the most strongly affected groups: young workers, who are greatly over-represented among minimum wage workers. We examine the impact of a recent increase in the age-specific minimum wage for 20- to 22-year-olds in the Netherlands on the employment outcomes of these age groups at the extensive and intensive margins (i.e., the number of jobs and hours worked), as well as on their overall earnings. We also study heterogeneity in these effects by considering the most affected industries, as well as impacts across different types of labor contracts and worker demographics. This 2017 reform increased age-specific minimum wages by 15% to 19% for affected workers, with virtually no change for older minimum wage workers.
The context we study is of interest for several reasons. First, the increase in the minimum wage is directly aimed at specific age groups. While most of the empirical literature focuses on the impact of a change in the general minimum wage, relatively few studies have considered the impact of a minimum wage increase that is only legally binding for workers of specific ages, even though such age-specific minimum wages are very common. A clear consensus has not yet emerged, with some studies finding zero or positive impacts on youth labor market outcomes while others find negative effects or have mixed results.
Second, the increase in the age-specific minimum wage is sizable and has a non-negligible bite, because, as in many other countries, Dutch youth employment is concentrated in low-wage jobs. However, Dutch youth employment is high: In 2019, the Dutch employment rate of 15- to 24-year-olds was 65.3%, compared to 51.2% in the United States and 54.1% in the United Kingdom (OECD 2021). As a result, firms have a strong incentive to adjust their workforce and production process, particularly in sectors where youth workers account for a large share of the labor force, such as retail and in bars and restaurants. In addition, firms are able to adjust their workforce quickly because flexible and part-time work arrangements are common among young workers.
To credibly measure the causal effects of minimum wages on youth labor market outcomes, we use an empirical design exploiting the fact that somewhat older workers are not directly affected by the youth minimum wage increase. To inform on impacts for low-wage workers, we study how the number of jobs and hours worked change around the new minimum wage, following Cengiz, Dube, Lindner, and Zipperer (2019). This approach also allows us to ask whether minimum wage increases have raised wages for workers already being paid above the minimum wage. We exploit detailed administrative records on all youth workers in the Netherlands, in contrast to the more commonly used survey data. These data give us precise estimates and confidence that results are not driven by misreported hours or wages, which is a concern in this literature (Autor et al. 2016).
Related Literature and Contribution
A large literature has assessed the potential downside of minimum wages predicted by perfectly competitive labor market models: decreased employment for low-wage workers. The empirical evidence suggests that for the economy as a whole, such disemployment effects are absent or negligibly small, at least at prevailing minimum wage levels (for overviews, see Belman and Wolfson 2014; Dube 2019). However, Gregory and Zierahn (2022) studied a setting in which minimum wages are set above the median sectoral wage level, showing that such large increases in the minimum wage can lead to sizable disemployment effects.
The absence of disemployment effects for moderate minimum wage increases can be understood as resulting from efficiency wages (e.g., Rebitzer and Taylor 1995), inelastic labor demand, or employers’ monopsony power (e.g., Burdett and Mortensen 1998; Manning 2003). Increased minimum wages could, for example, reduce worker turnover and monitoring costs, as well as raise worker productivity, offsetting any direct increase in firms’ wage costs. Labor demand could be relatively inelastic because minimum wage workers are not a large share of firms’ labor costs; minimum wage workers are not easily substitutable for other factors of production; and/or product demand is inelastic in the (often non-tradable) sectors where minimum wage workers are employed. Further, in imperfectly competitive labor markets, raising the minimum wage increases labor supply, making the employment effects theoretically ambiguous. See Manning (2021) for a recent overview of the literature’s findings and theories consistent with absent disemployment effects.
However, this body of work does not rule out bigger effects for the most strongly affected groups: a prime example being young workers, who are strongly over-represented among minimum wage workers.
Studying this group is also important given the recent declines in labor force participation in both the United States and the Netherlands for young, low-skilled men (Dillingh, Ebregt, Jongen, and Scheer 2018; Aguiar, Bils, Charles, and Hurst 2021). While some recent studies for the United States also find small or near-zero employment effects of the minimum wage for these groups (e.g., Dube, Lester, and Reich 2016; Allegretto, Dube, Reich, and Zipperer 2017), others report adverse effects on youth labor market outcomes (e.g., Neumark, Salas, and Wascher 2014a, 2014b). Our study contributes new empirical evidence to this literature, which has not yet reached a consensus.
Age-specific minimum wages are common, 1 but most of the empirical literature focuses on the impact of a change in the general minimum wage. Our study contributes to a small literature that examines the impact of a minimum wage increase that is only legally binding for workers of specific ages. 2 Also here, a clear consensus has not yet emerged, with some finding zero or positive impacts on youth labor market outcomes (Portugal and Cardoso 2006; Hyslop and Stillman 2007) and others finding negative effects or mixed results (Pereira 2003; Shannon 2011). 3
Data
Youth Minimum Wages in the Netherlands
The adult minimum wage in the Netherlands covers all workers aged 23 and older. For workers aged 15 to 22, the youth minimum wage is defined as a stepwise increasing fraction of the adult minimum wage. In January 2017, right before the reform we study, the youth minimum wage ranged from 35% of the adult minimum wage for 15-year-olds to 85% of the adult minimum wage for 22-year-olds (column (1) in Table 1). Workers become eligible for the next step in the minimum wage in the month of their birthday. The minimum wage is biannually adjusted to keep pace with average collectively bargained wage growth.
Two-Step Youth Minimum Wage Reform
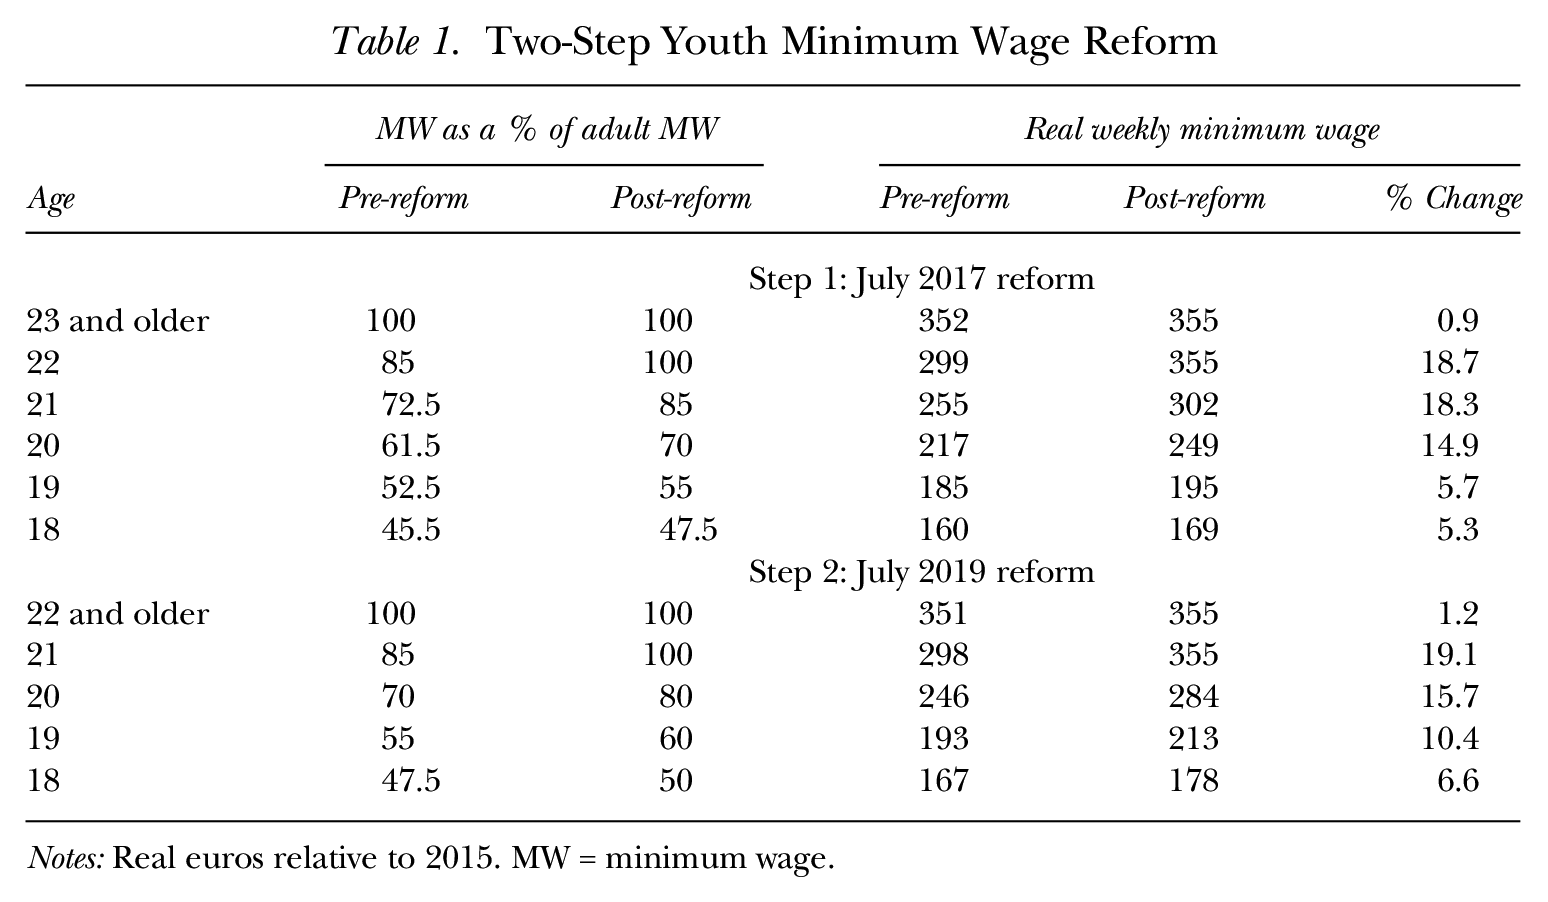
Notes: Real euros relative to 2015. MW = minimum wage.
The Netherlands has no hourly minimum wage. Instead, minimum wages are defined per day, week, and month. The hourly minimum wage depends on what constitutes a full-time workweek. This number is agreed upon in collective bargaining agreements, which often cover a whole sector, but large firms frequently have their own collective bargaining agreement. Full-time workweeks always range between 36 and 40 hours per week.
The Minimum Wage Reform
In July 2017 and July 2019, the youth minimum wage for workers aged 18 and older was increased in two steps. The increase was proposed in October 2016 and confirmed into law in January 2017. 4 The minimum wage for workers aged 15 to 17 remained unaltered. Table 1 shows the change in both the rate of the age-specific minimum wage relative to the adult minimum wage and the resulting increase in the real weekly minimum wage by age group for both steps of the reform. The first column reports the youth minimum wage as a share of the adult minimum wage before each step of the reform. The third column reports the youth minimum wage in real euros per week before the reform. For example, prior to the 2017 reform, 22-year-olds had a minimum wage that was 85% of the adult minimum wage, or 299 euros per week, compared to 352 euros per week for those aged 23 or older. (Given an exchange rate of IEU = 0.92 dollars in 2015, the equivalent US wages would equal $275 and $323, respectively.)On July 1, 2017, the minimum wage increased overnight by 18.7% for 22-year-olds, 18.3% for 21-year-olds, and 14.9% for 20-year-olds. At the same time, the minimum wage for adults was raised by only 0.9%, reflecting biannual real wage indexation.
On July 1, 2019, the minimum wage was raised by another 19.1% for 21-year-olds and 15.7% for 20-year-olds. The minimum wage for adults, now also including 22-year-olds, was raised by 1.2%. Minimum wages for 18- to 19-year-olds increased by relatively small amounts. We will not study these here but will instead focus on the sizable minimum wage increase for 22-year-olds. 5 We focus on this age group because a wage subsidy policy was introduced to compensate employers for increased minimum wages of 20- and 21-year-olds, as we discuss next.
Additional Policies
As part of a compensation scheme for the minimum wage increase, the Dutch government announced temporary wage subsidies to firms employing youth minimum wage workers. Further, a policy is in place that targets low-wage workers earning above the adult minimum wage. These policies, which were announced before the minimum wage increase came into effect, could have important confounding effects. Here, we outline how this impacts our estimates for 22-year-olds, our baseline treatment group, and 18- to 21-year-olds, whom we do not include at baseline.
Policy Impacting 22-Year-Olds
Workers aged 22 (and aged 21, in the case of the second reform in 2019) were ineligible for the main wage subsidy (the so-called JLIV subsidy), discussed below. This ineligibility was known to firms, as we outline in detail in Online Appendix A.1 (hereafter, all references to an appendix indicate the online resource associated with this article). However, some 22-year-olds were eligible for another subsidy for low-wage workers that was introduced in January 2017. This subsidy (the lageinkomensvoordeel or LIV subsidy) is aimed at firms employing workers who earn between 100% and 125% of the adult minimum wage. 6 Eligibility for the subsidy is based on two criteria: 1) the worker must work at least 1,248 hours in the firm over one calendar year, and 2) the worker must earn between 100% and 125% of the adult minimum wage on average over the calendar year. Because of these stringent eligibility criteria, only 5.7% of workers aged 22 at the time of the minimum wage reform (July 2017) are eligible over the year 2017. For those initially earning below the new minimum wage for 22-year-olds, 7.5% are eligible. In a later section titled Robustness to LIV Wage Subsidy, we analyze how this policy impacts our findings.
Policy Impacting 18- to 21-Year-Olds
Workers aged 18 to 21 (and aged 18 to 20 in the case of the second reform in 2019) were generally not eligible for the LIV subsidy discussed above; 7 however, they were covered by a much more comprehensive compensation scheme, the jeugd-lageinkomensvoordeel, or JLIV subsidy. This subsidy was announced in November 2016 and implemented on January 1, 2018 (Tweede Kamer der Staten-Generaal 2016c; Staatsblad van het Koninkrijk der Nederlanden 2017). The announcement mentions there would be no compensation for hours worked by youth minimum wage workers in 2017 when the youth minimum wage increased, as we document in Appendix A.2. Instead, the subsidy compensated firms for hours worked by 18- to 21-year-old workers from 2018 onward, covering those earning up to 117% of the minimum wage for 21-year-olds and up to 135% for 20-year-olds. The first compensation was paid out automatically to firms in September 2019, covering hours worked in 2018. 8
At the time of the subsidy announcement, the government also announced that the baseline subsidy for 2018 would be increased by 50%, with the stated purpose to compensate for the higher labor costs that firms incurred in 2017 because of the minimum wage increase (Tweede Kamer der Staten-Generaal 2016c). As a result, the 2018 subsidy was approximately 120% of the increase in the minimum wage for 18- to 21-year-olds. For hours worked in 2019, the subsidy amount was lower, around 50% of the increase in the minimum wage. Subsidy amounts were lowered again in 2020, and the subsidy will be abolished in 2024.
Choice of Treatment Group
The JLIV subsidy clearly weakens the link between labor costs and the minimum wage increase for two of the potential treated age-groups, 21- and 20-year-olds, and could also lead to wage spillovers for these age groups because the subsidy covers workers earning up to 117% of the minimum wage for 21-year-olds and up to 135% for 20-year-olds. If firms had taken into account the subsidy they would receive in 2019 for their youth employment in 2018 when making employment decisions in 2017, we would underestimate any potential negative effects of the minimum wage increase. We therefore do not consider 21- and 20-year-olds in our baseline analysis of the 2017 minimum wage reform, focusing exclusively on 22-year-olds as our treatment group. 9 Similarly, when considering the 2019 minimum wage reform as a robustness check, we focus our analyses on 21-year-olds as firms knew they would not receive the subsidy for these workers (see Appendix A). (Again, we show results for 20-year-olds, for whom the subsidy confounds effects, in Appendix C.)
Data Construction
Data Sources
We construct a panel of monthly employment records of the universe of 20- to 27-year-olds with residency in the Netherlands, over 2007–2017. We merge several high-quality administrative sources collected by Statistics Netherlands, covering the entire population of the Netherlands. Employment data are based on income statements from employers to the Employee Insurance Agency (UWV). Individuals in the employment data are matched to municipal register data that contain information on individual demographic characteristics, such as gender, date of birth, residency spells, and country of birth for both the individual and their parents. Because many young workers are still in school, we match education enrollment data, which include information on the date of enrollment and graduation, as well as the level and type of education.
The employment data contain information on hours worked and gross monthly earnings for each individual worker’s employment spell, separately by firm. In addition, we observe several job characteristics, such as the type of contract (e.g., intern, on-call-employee, temporary work agency; fixed term or open-ended contract) and sector (but not occupation) of employment.
We define a job as a single employer–employee relationship during a given month. For individuals who have multiple employment relationships with the same firm in a given month, we sum the gross monthly earnings and hours worked at the firm level. 10 We compute a worker’s average hourly wage for each job-month by dividing gross earnings by hours worked. This hourly wage measure is an approximation of the contracted hourly wage. We deflate hourly wages to 2015 euros using the annual consumer price index.
Determining the Applicable Minimum Wage
As outlined above, we need the full-time workweek for each worker to determine the applicable hourly minimum wage. We do not observe workers’ actual full-time workweek, however, so we approximate it as follows. For each job we observe the number of full-time equivalent days worked. We divide this by the number of working days in a month to obtain the part-time share of each job. We then divide the actual hours worked observed in the data by the calculated part-time share to obtain implied full-time hours for each job. We take average implied full-time hours over the months worked in a calendar year and assign each job to the closest category out of either 36, 38, or 40 hours per week. (See Appendix E for details. Our results are robust to instead assign every worker a 36- or a 40-hour workweek—the lower and upper bound, respectively).
Sample Restrictions
We restrict the sample in the following ways. First, we exclude jobs of individuals without a registered address in the Netherlands in a month. This removes around 2.5% of the jobs in the raw employment data. Second, we exclude jobs that are internships, sheltered employment arrangements, or directors and major shareholderships, since the minimum wage does not apply to these job types. This removes an additional 4.3% of jobs.
Descriptives
Table 2 shows descriptives for our sample, averaged over 2007–2017. This highlights several characteristics of the Dutch youth labor market. First, a non-negligible share of young workers earns the minimum wage: approximately 11% of workers aged 20 to 22 and 10% of workers aged 23 to 25. On average in the Netherlands, around 6% of workers earn the minimum wage (CBS 2021). Second, many young workers are working while enrolled in education: 67% to 53% of 20- to 22-year-olds, 26% of 23- to 25-year-olds (the 26% is a weighted average of those in MW jobs [11%] and those not in MW jobs [89%]: 0.11 × 40 + 0.89 × 24 = 26%), and 12% of 26- to 27-year-olds. This high education enrollment rate contributes to the high incidence of part-time work, as seen from low average weekly hours and the low share of full-time jobs. Minimum wage workers are more likely to be enrolled in education and to hold part-time jobs than those earning more than the minimum wage. Third, most young workers are employed in temporary contracts (which is defined as having a contract with a fixed end date or a fixed duration), and temporary contract incidence is higher among minimum wage workers compared to non-minimum wage workers. On-call and temp agency work are also relatively common, with the former more frequent for the youngest age groups.
Summary Statistics on the Dutch Youth Labor Market by Age Group
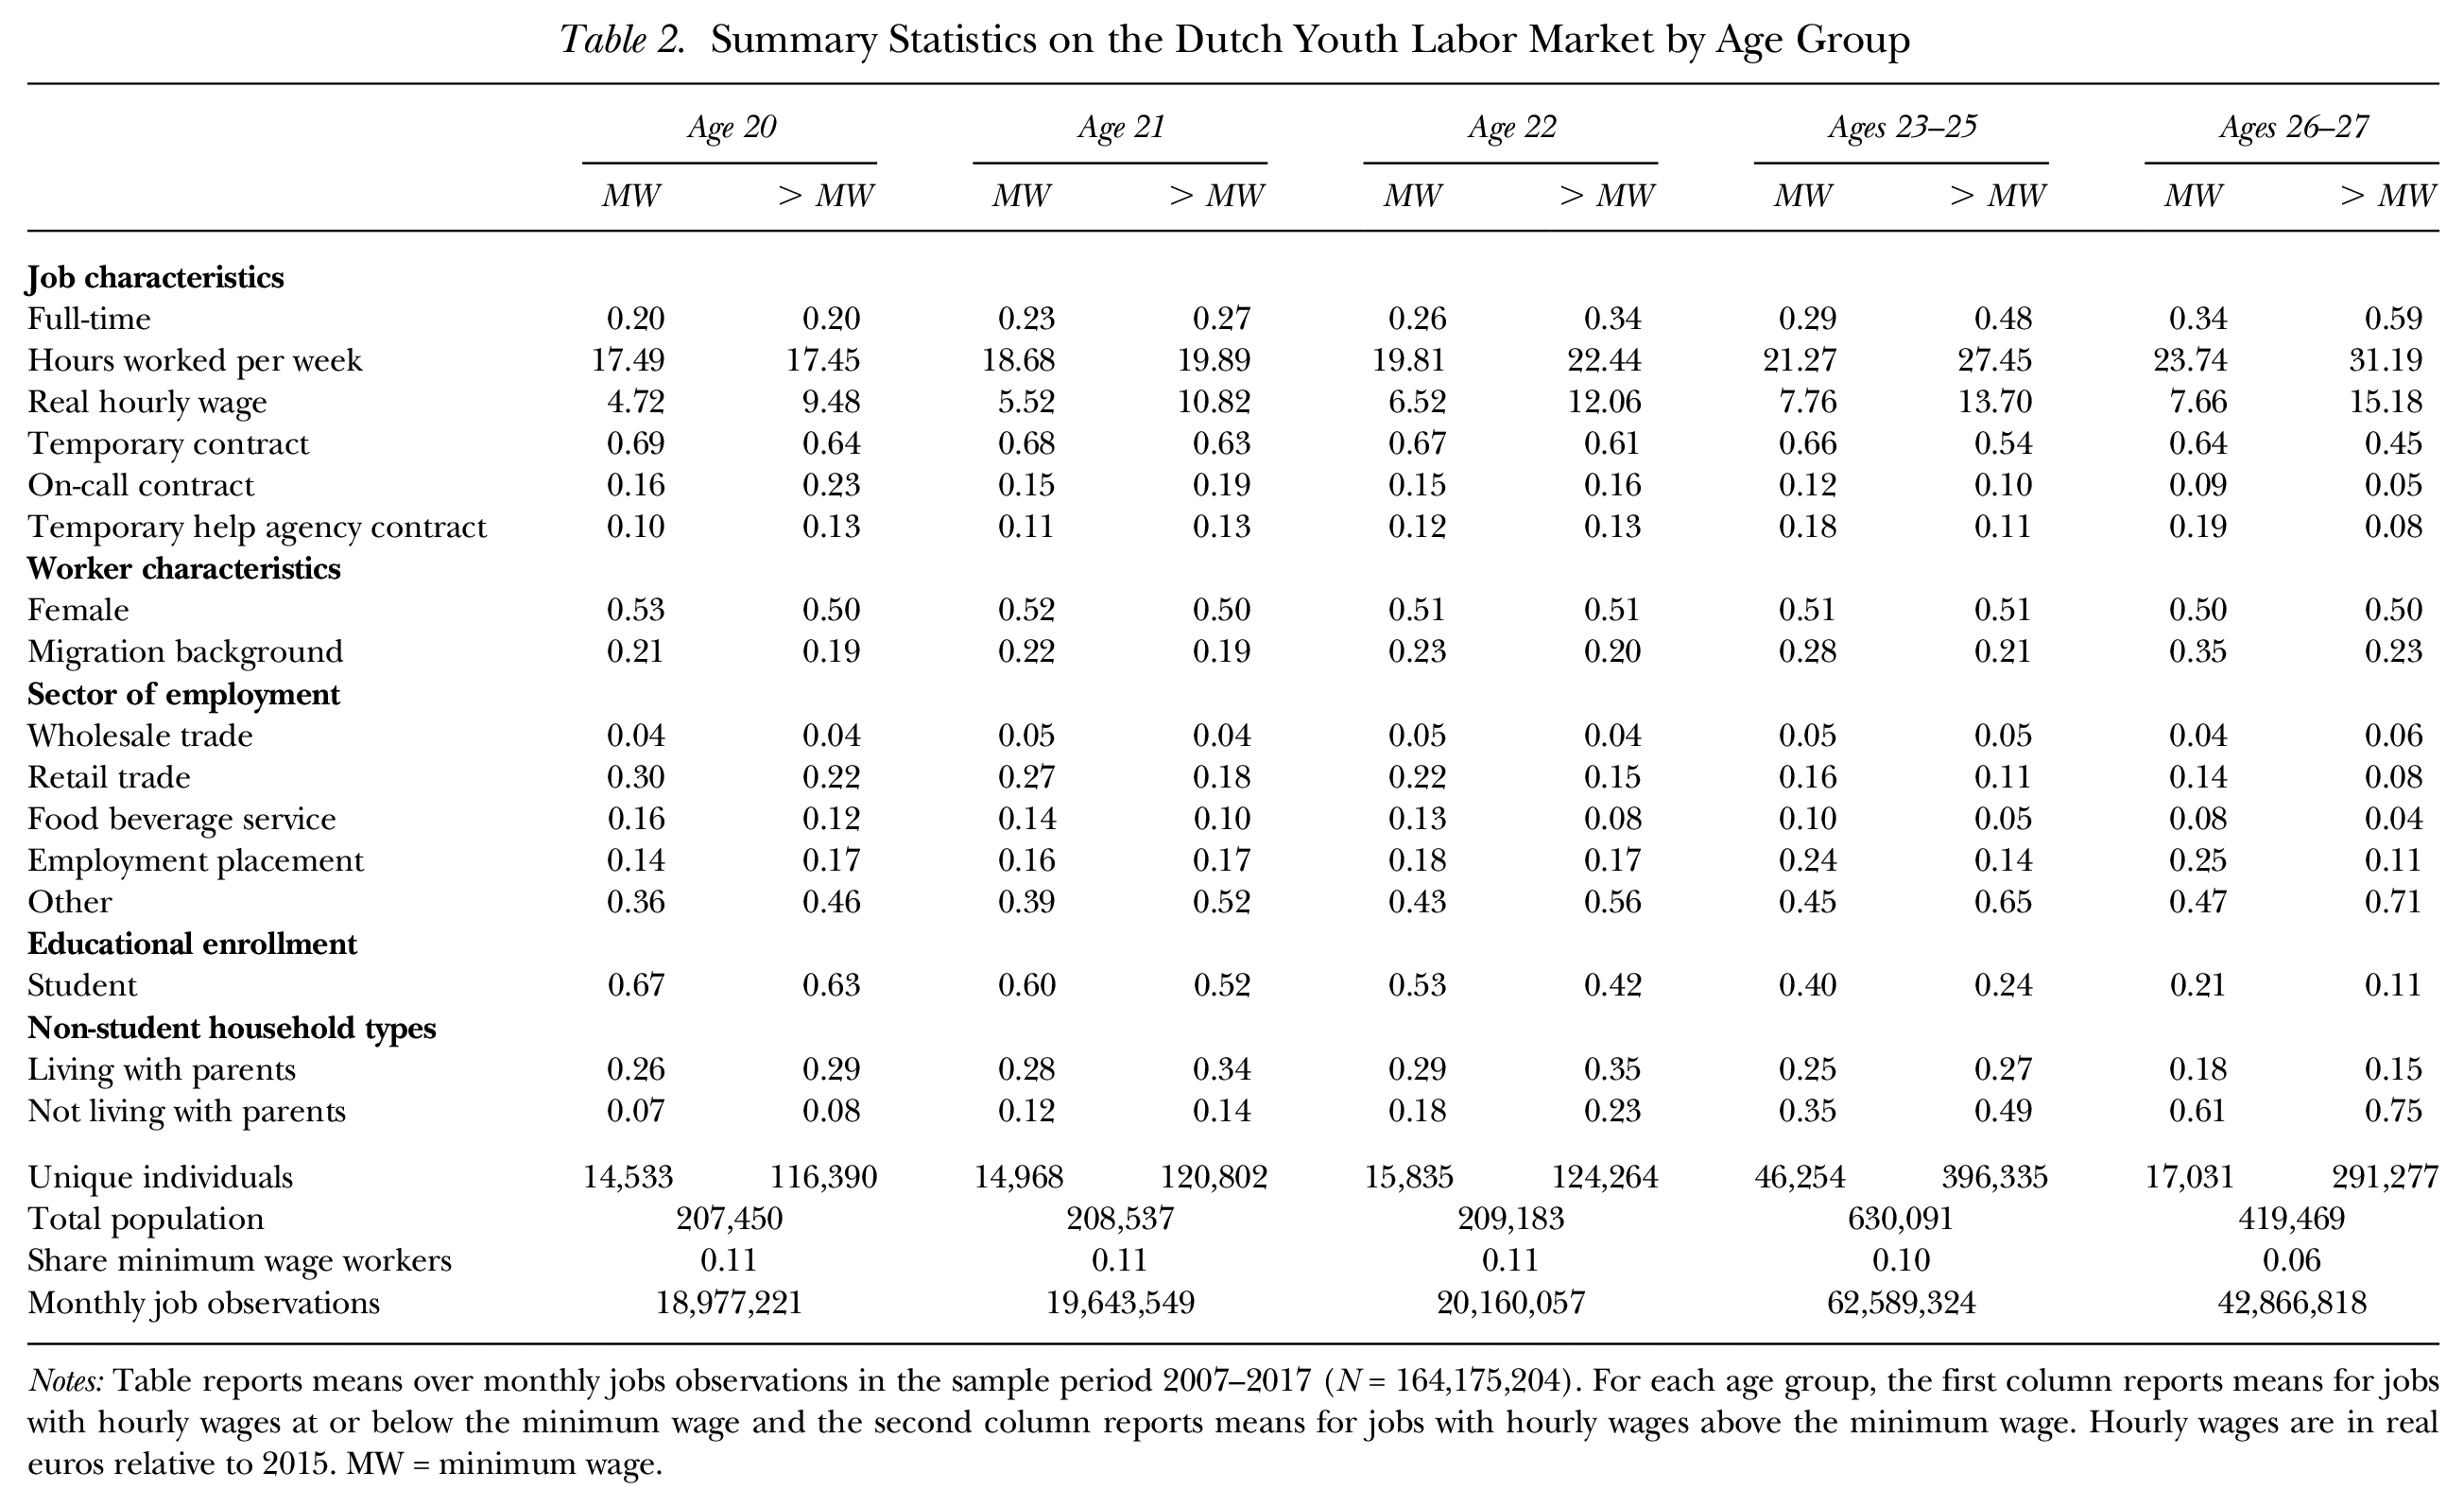
Notes: Table reports means over monthly jobs observations in the sample period 2007–2017 (N = 164,175,204). For each age group, the first column reports means for jobs with hourly wages at or below the minimum wage and the second column reports means for jobs with hourly wages above the minimum wage. Hourly wages are in real euros relative to 2015. MW = minimum wage.
Minimum wage employment of 20- to 22-year-olds is concentrated in wholesale and retail trade, food and beverage services, and the employment placement industry (including temporary help agencies
11
). Together, these account for approximately 60% of all minimum wage jobs held by these workers. Retail trade accounts for the largest share of minimum wage employment, accounting for 30% of minimum wage jobs held by 20-year-olds and 27% to 22% of minimum wage jobs held by 21- to 22-year-olds. While men and women are about equally represented, first- or second-generation migrants are over-represented among minimum wage workers, particularly among 23- to 27-year-olds. Finally, while between 26% and 29% of minimum wage jobs among 20- to 22-year-olds are held by individuals not enrolled in education who live with their parents, non-negligible shares of minimum wage jobs are held by individuals in single- or two-person households. In particular, among 20- to 22-year-olds, between 7% and 18% of minimum wage jobs are held by individuals in one- or two-person households who are not enrolled in education. In our analyses, we study impacts on minimum wage workers not enrolled in education (47% for 22-year-olds) separately because students are more likely to be transient occupants of minimum wage jobs.Table 3 summarizes the real wage distributions of the number of jobs and total hours worked, expressed as the distance from the real minimum wage in
Wage Distributions in the Dutch Youth Labor Market
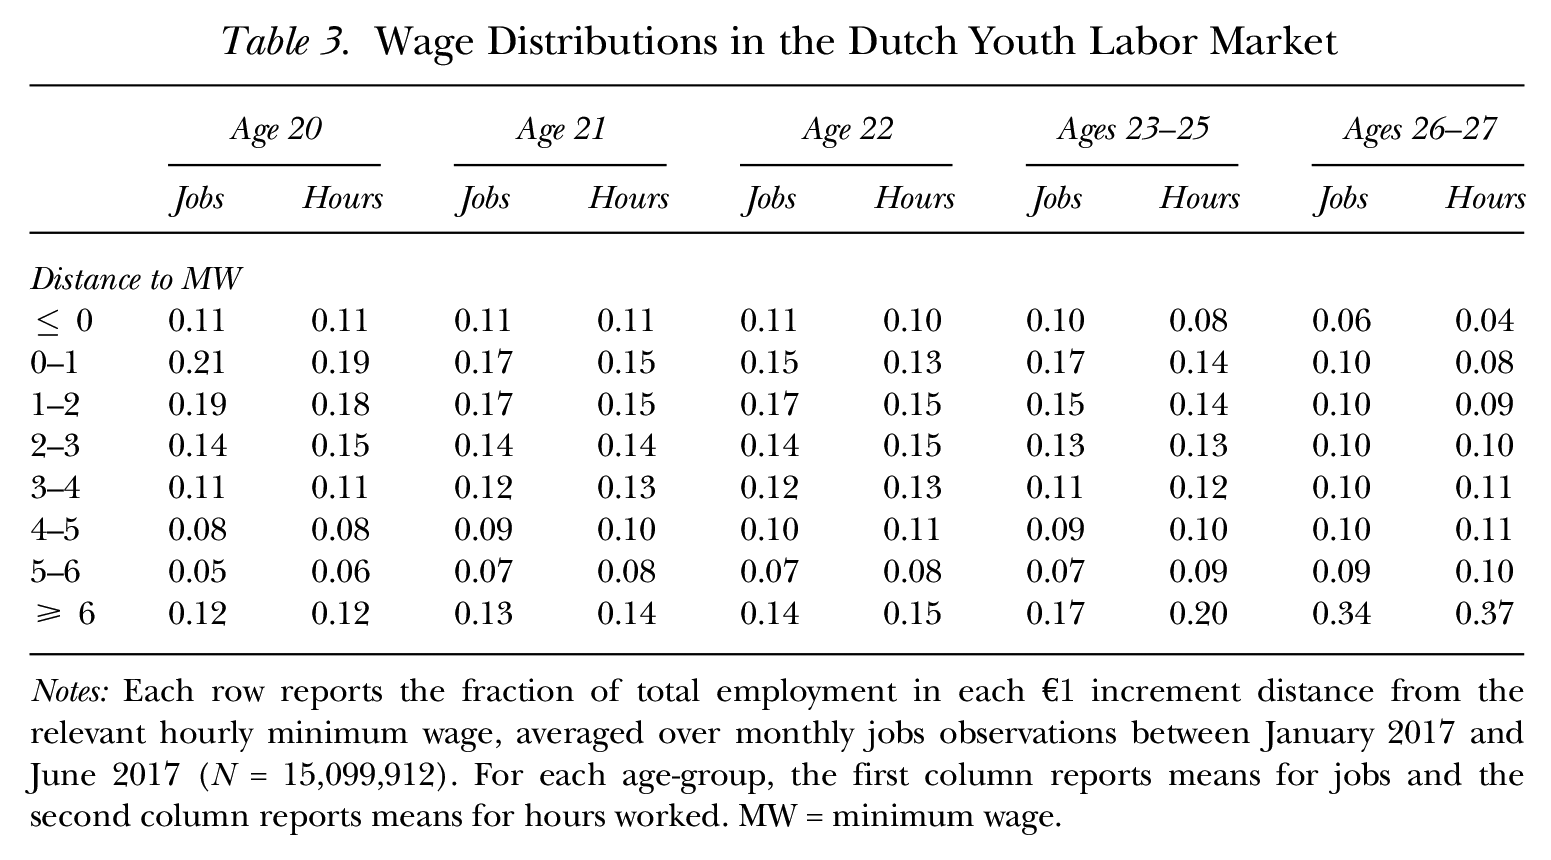
Notes: Each row reports the fraction of total employment in each
Empirical Approach
To identify the impact of the youth minimum wage on young workers’ employment and earnings, we exploit the increase in the youth minimum wage on July 1, 2017. We use a difference-in-differences design to estimate the impact of the minimum wage on the number of jobs and total hours worked by 22-year-olds. (Analyses for 21- and 20-year-olds are reported in Appendix C.1.1.) We adopt the bunching approach developed in Cengiz et al. (2019), disaggregating the aggregate employment effect of the minimum wage by constituent wage bins throughout the hourly wage distribution. The impact of the minimum wage is then inferred by examining changes in employment in wage bins locally around the minimum wage.
The intuition behind this approach is that an increase in the minimum wage induces a change in the wage distribution for affected workers. The distribution is altered in three ways. First, if firms comply with the higher legislated minimum wage, there is a reduction in the number of jobs that were paying below the minimum wage prior to the reform. Second, not all jobs previously paying below the new minimum wage need to disappear. Jobs that are preserved and experience a mandated wage increase could appear at the new minimum wage, creating a spike at the new minimum wage. Third, the minimum wage change may induce spillover effects, that is, changes in employment further up the wage distribution. Such spillovers could be driven by various factors, such as labor-labor substitution (Fairris and Bujanda 2008; Clemens, Kahn, and Meer 2021), hedonic-based labor supply substitution (Phelan 2019), fairness concerns about maintaining within-firm wage hierarchies (Giuliano 2013; Dube, Giuliano, and Leonard 2019), reallocation of employment toward higher paying firms (Dustmann et al. 2021), and increased job search because the new minimum wage exceeds the reservation wage for more workers (Flinn 2006). However, these spillover effects are likely to fade out further up the wage distribution, and any changes in the distribution observed beyond this fade-out are likely not caused by minimum wage increases. This observation implies that the employment effect of the minimum wage should be inferred by examining employment changes locally around the new minimum wage.
To estimate the impact of the increase in the minimum wage on the number of jobs and hours worked, we first compute monthly distributions of hourly wages for each age group. Each job in our sample is assigned to a bin relative to the age-specific new real hourly minimum wage effective July 2017 (defined as
Workers aged 23 to 25, who are not affected by the minimum wage reform, serve as our control group. For these workers, we calculate the same age-specific bins relative to their (the adult) minimum wage. (In Appendix Tables C.1 and C.2 we also show results using workers aged 26 to 27 as a control group: Results have the same sign but are larger in magnitude. We present the more conservative estimates as a baseline.)
Descriptive Evidence
Figure 1 describes the data and illustrates our approach. Panel A shows the pre- and post-reform distributions of hours worked relative to the new minimum wage for the treated age group: 22-year-olds. It is clear that the reform induced a rightward shift in the wage distribution, with a substantial spike at the new minimum wage. There also appears to be an increase in jobs higher up the wage distribution, up to approximately 3 euros (i.e., 6 wage bins) above the new minimum wage. The second figure shows the distribution of hours worked for the same time period for our control group (23- to 25-year-olds), relative to their minimum wage. No change is evident in the control group’s distribution following the reform in the minimum wage for treated age groups. Our difference-in-differences approach compares the change in employment in each wage bin for treated age groups to the change in employment in the same wage bin for the control group. We then sum employment changes across wage bins to arrive at the total employment effect.
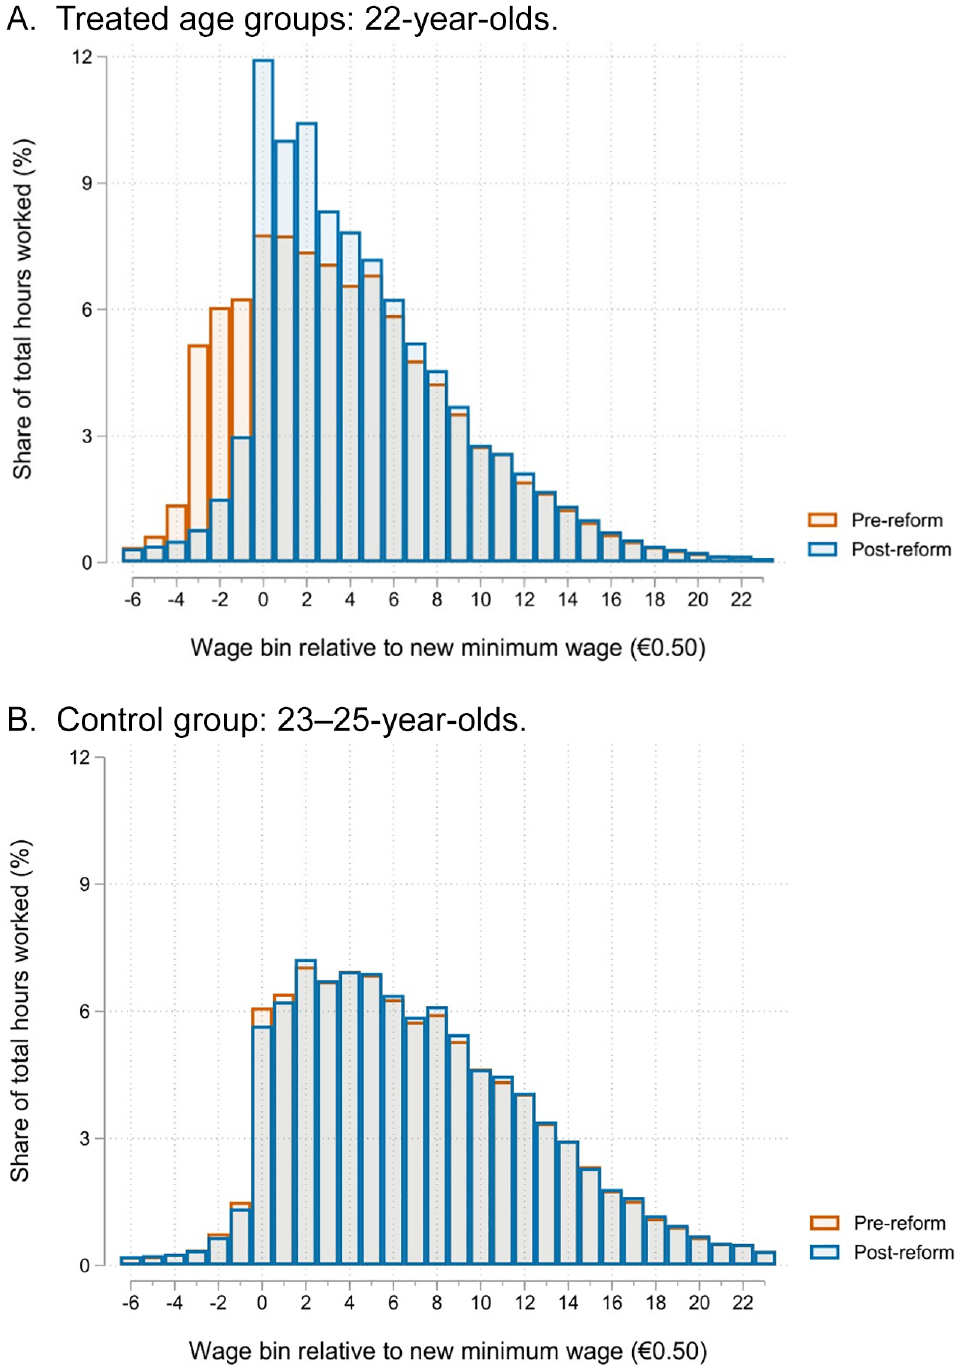
Wage Distributions for Treated and Control Age Groups before and after the Minimum Wage Change
Note that for the control group, bins below the new minimum wage should be empty since there has been no shift in their minimum wage. Nonetheless, because of measurement error, we have some observations below the new minimum wage. This outcome is common in the literature, for example, Kabátek (2021) found the same using earlier Dutch data. We have also estimated our baseline models artificially setting these bins to zero, essentially making the analysis of the bins below the minimum wage a “before-and-after” comparison instead of a difference-in-differences, and we find very similar results (see Appendix Figure C.8).
Estimating Equation
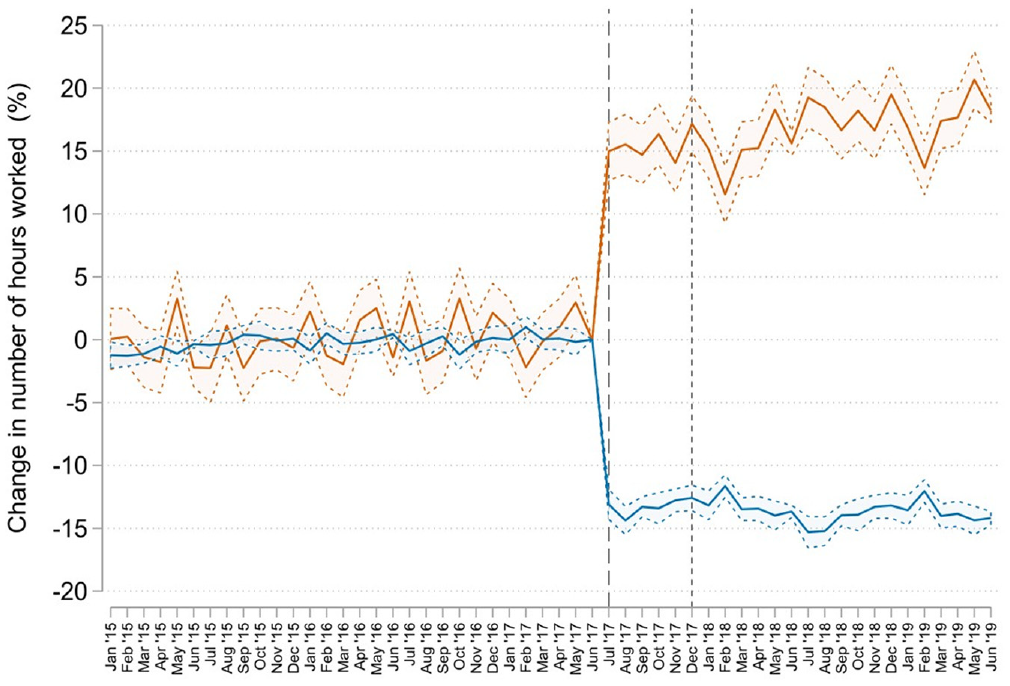
We use the following regression specification to estimate the impacts of the minimum wage on employment and earnings of treated workers:
where
Outcome Variables
We estimate the impact of the minimum wage increase on two outcome variables. The first is the monthly number of jobs in each wage bin, relative to the population of 22-year-olds. In other words, it is the age-specific number of jobs per capita by wage bin. This outcome captures employment adjustments at the extensive margin. The second outcome variable is the total hours worked per capita by wage bin, capturing employment adjustments both at the extensive and intensive margins. This outcome is defined as monthly total hours worked in each wage bin, relative to the population. (The population of 22-year-olds is the monthly number of individuals aged 22 with a registered address in the Netherlands.) The normalization by age-specific populations accounts for changes in population by age that could (mechanically) impact the number of jobs held and total hours worked by workers of different ages.
Control Variables
We include a full set of wage bin by age group fixed effects,
Assumptions for Causal Identification
Causal interpretation of our estimates relies on two assumptions: parallel trends and the Stable Unit Treatment Value Assumption (SUTVA). Parallel trends mean that absent the reform, the change in each constituent wage bin relative to the new minimum wage should be the same for the treated and control groups. In support of this assumption, we estimate leading terms up to 30 months before the treatment and find no evidence of pre-trends (shown below).SUTVA requires an absence of spillover effects to our control group such that changes in the number of jobs and total hours worked for each age group depend on the treatment status of that age group alone. Violation of SUTVA would bias the estimated employment effects of the minimum wage. If, for example, firms substitute employees aged 22 with employees aged 23, because 22-year-olds are becoming more expensive because of the minimum wage increase, using 23-year-olds as a control group overestimates the job loss experienced by 22-year-olds. While choosing older age groups as a control group may limit the threat of cross-age spillover effects, it is also less likely that the parallel trends assumption is satisfied. For this reason, we choose 23- to 25-year-olds as our baseline control group. As a robustness check, we use 26- to 27-year-olds and find similar results (see Appendix Tables C.1 and C.2).
The Impact of Youth Minimum Wages on Labor Market Outcomes
Impact of the 2017 Minimum Wage Increase on Hours Worked and Number of Jobs
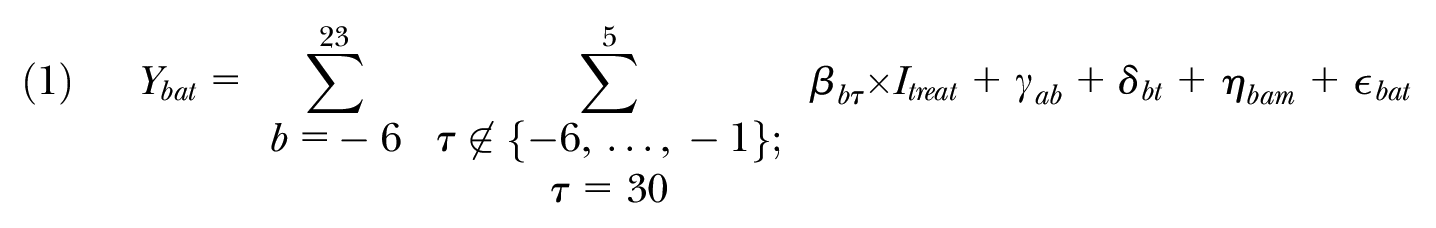
We begin our analysis by estimating the effect of the 2017 increase in the minimum wage on the number of jobs and hours worked in each
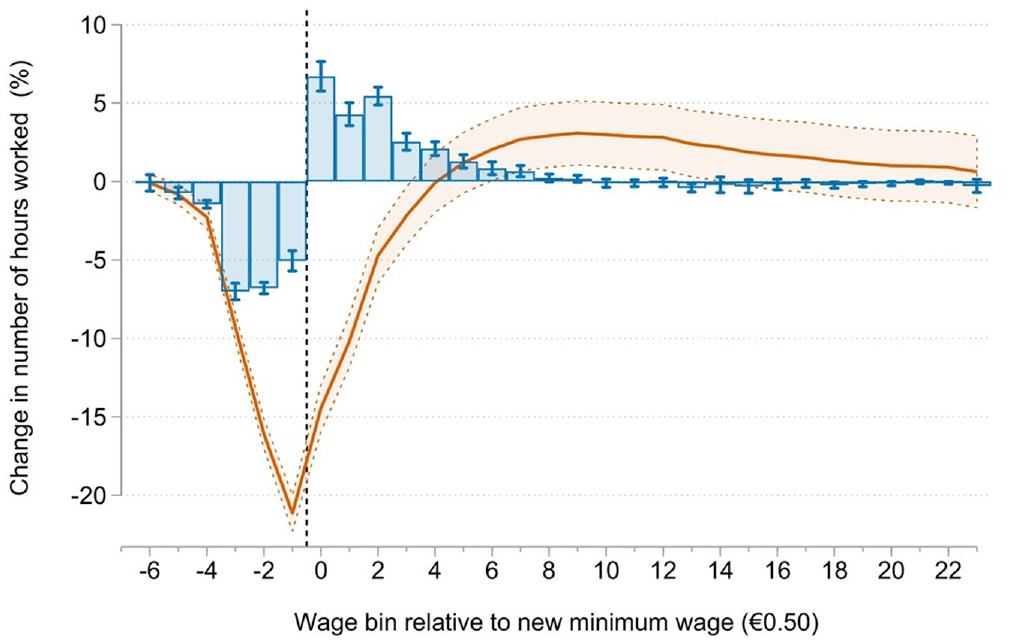
Impact of 2017 Minimum Wage Increase on Number of Hours Worked by 22-Year-Olds by Wage Bin (Blue Bars) and the Running Sum (Orange Line)
We highlight three main findings. First, the increase in the minimum wage has not changed total hours worked by treated workers. The cumulative impact of the minimum wage becomes statistically indistinguishable from zero beyond the wage bin
Second, total hours worked at the new minimum wage increase markedly, creating a spike at the bin containing the minimum wage. This finding is consistent with some jobs being preserved and experiencing a wage increase in accordance with the higher legislated minimum wage.
Third, we see substantial spillover effects to jobs above the minimum wage: The number of hours worked not only increases at the new minimum wage but also in bins above the minimum. These spillovers fade out further up the wage distribution. For each treated age group, the impact of the minimum wage largely fades out beyond
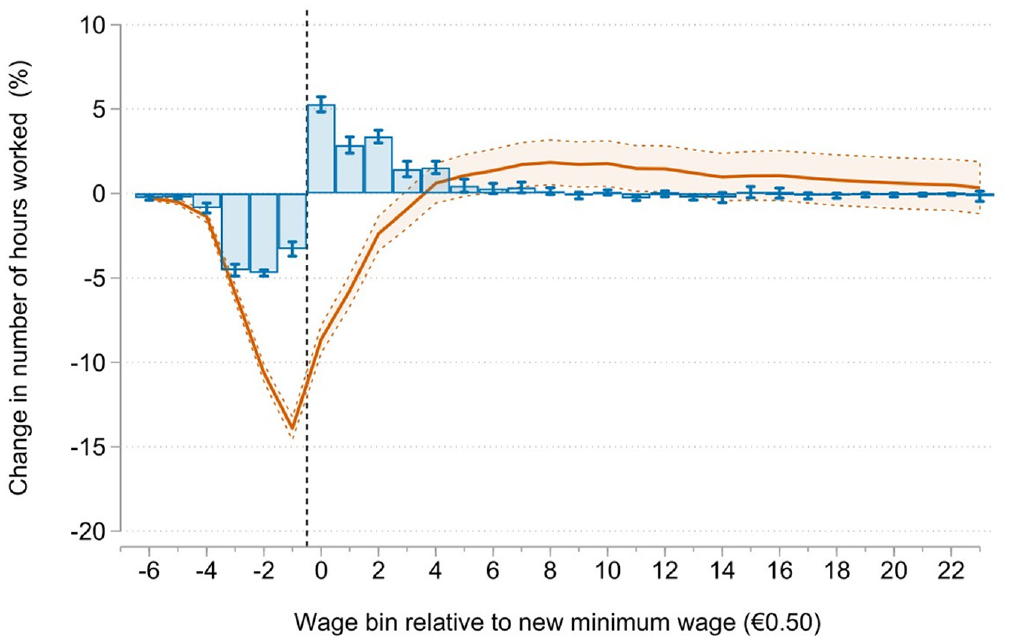
We perform an analogous analysis for the number of jobs in Figure 3. The reallocation of jobs around the new minimum wage broadly mirrors the results for total hours worked. However, the cumulative impact of the minimum wage on the number of jobs becomes statistically indistinguishable from zero at any point beyond
Impact of the 2017 Minimum Wage Increase on the Number of Jobs Held by 22-Year-Olds by Wage Bin (Blue Bars) and the Running Sum (Orange Line)
We do not find any reallocation of hours worked around the minimum wage for our control group, the 23- to 25-year-olds, compared to older age groups (either 26- to 27-year-olds or 30- to 35-year-olds). 19 This finding is reassuring since positive changes in low-paid hours worked for our control group relative to older workers would be indicative of positive spillovers of the youth minimum wage increase, violating SUTVA. We do see some small positive changes in wage bins higher up the wage distribution, which suggests other labor demand shifts may be occurring for these higher-paid workers. In particular, we find some small, positive changes in hours worked for 23- to 25-year-olds compared to 30- to 35-year-olds high up the distribution. (Note that these workers’ wages are too high to qualify for the LIV subsidy.) This finding underscores the importance of studying effects for wage bins close to the minimum wage, to avoid capturing effects much further up the wage distribution that are unlikely to be caused by minimum wage changes (Cengiz et al. 2019).
Dynamic Impacts
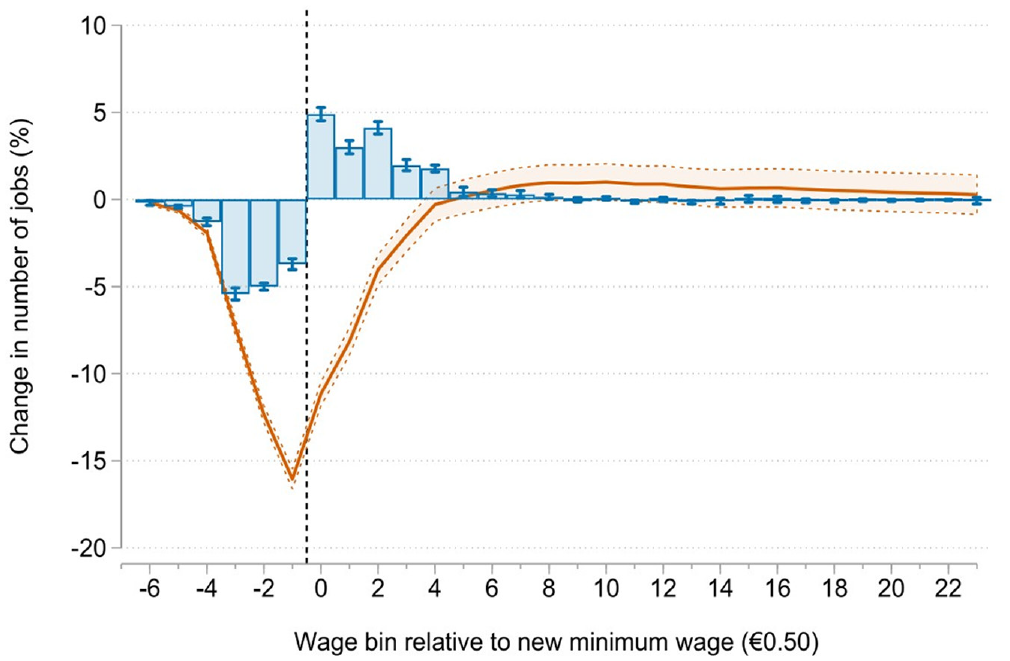
We continue our analysis by tracing the impact of the minimum wage increase resulting from the July 2017 reform month-by-month from January 2015 to right before the start of the second step of the reform, June 2019. This exercise serves a dual purpose. First, we can assess the presence of pre-existing trends by examining leading terms. Second, by tracing the impact of the minimum wage over the months following the reform, we can document potential dynamic treatment effects. While we find no short-term impact of the reform, the mid- and long-term impacts may differ if firms face adjustment costs (Sorkin 2015; Aaronson, French, Sorkin, and To 2018). Therefore, we may underestimate potential employment losses when focusing on the six-month post-reform period.
We extend our primary sample to June 2019 to estimate a model similar to Equation (1) but now including terms up to
Figure 4 shows the month-by-month changes in “missing” (
Impact of the 2017 Minimum Wage Increase on Number of Hours Worked above and below the New MW by 22-Year-Olds from January 2015 to June 2019
Quantifying Employment Elasticities and Spillover Shares
As is common in the literature, we use our results to calculate the overall short-term impact of the minimum wage increase on age-specific employment, and the elasticities with respect to the minimum wage and the own wage. We use the estimated six-month average changes in employment up to a point in the post-reform wage distributions where the impact of the minimum wage fades out, which we call
Effects of the 2017 Minimum Wage Increase on Employment, Average Wages, Wage Elasticities, and Spillover Share for 22-Year-Olds
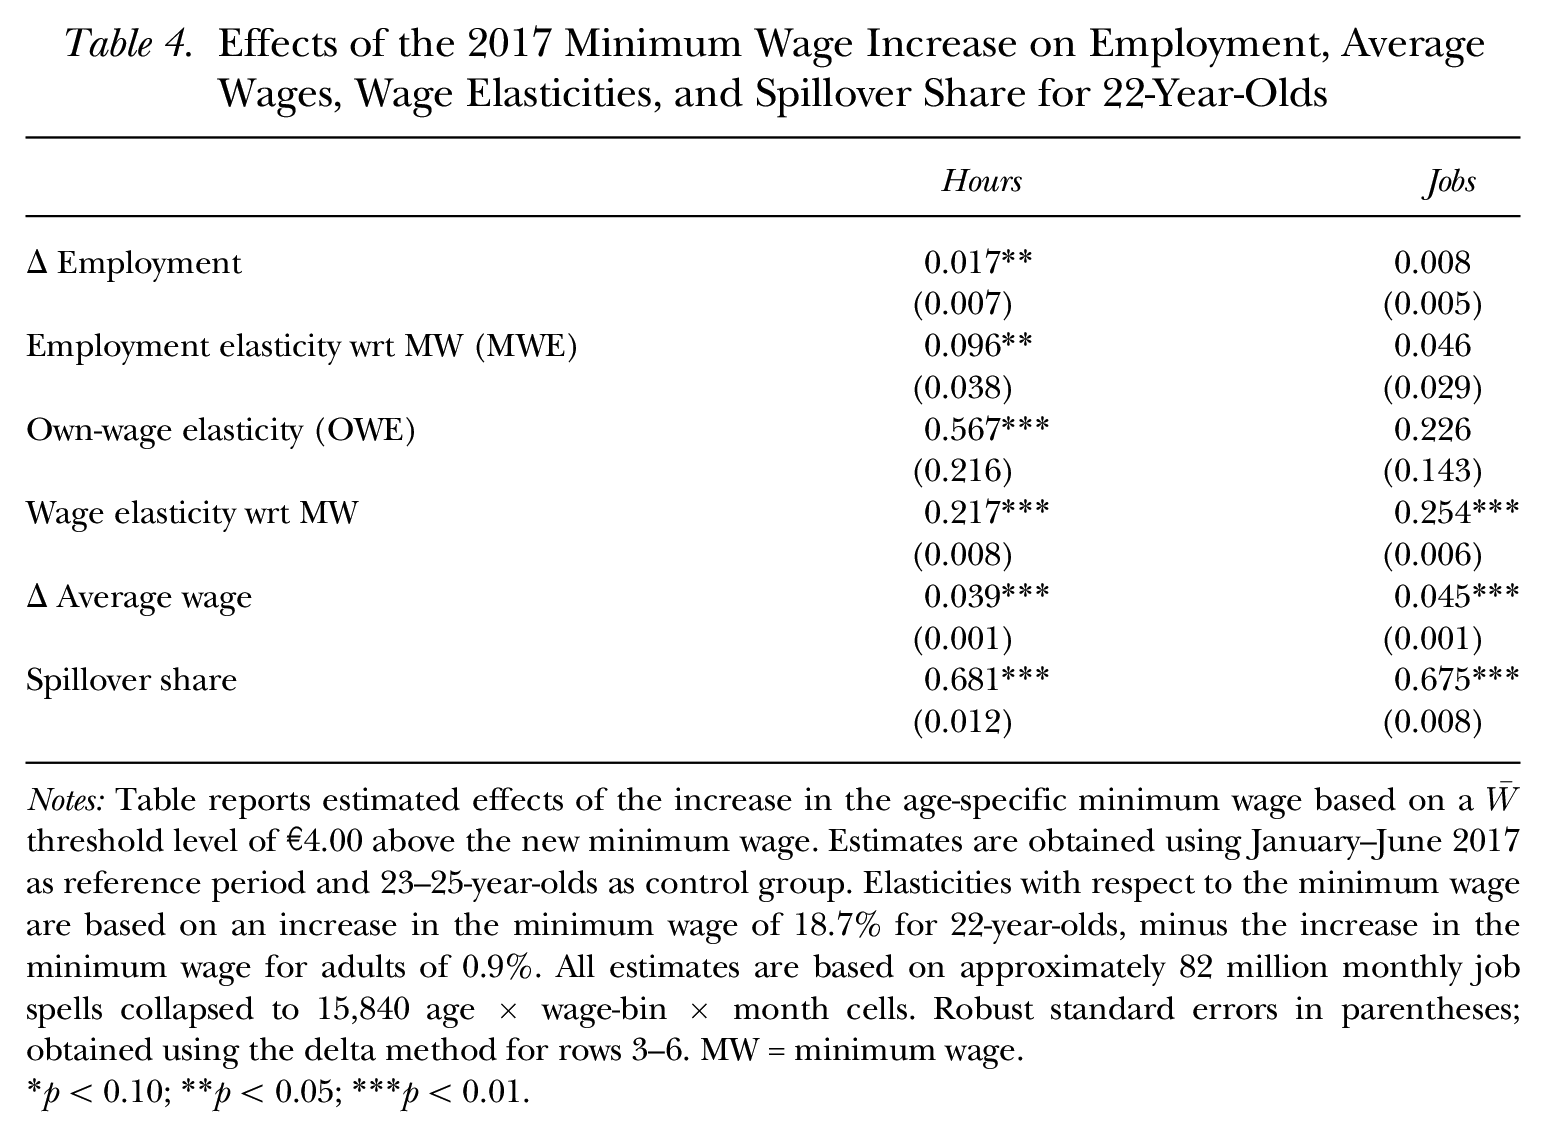
Notes: Table reports estimated effects of the increase in the age-specific minimum wage based on a
p < 0.10; **p < 0.05; ***p < 0.01.
We find that the minimum wage hike increased total hours worked by 1.7% when considering changes up to
A disadvantage of the MWE is that it is difficult to compare across studies because the minimum wage may have a different bite across settings. To facilitate direct comparisons of our findings to those reported in the literature, we calculate the implied own-wage elasticity (OWE), which measures the responsiveness of employment to a change in the average wage. The OWE effectively normalizes the MWE by the change in the average wage due to the minimum wage increase, recognizing that a more binding minimum wage increase tends to have a larger impact on the average wage.
The fourth row of Table 4 shows that the increase in the minimum wage had a significant impact on average wages, with an elasticity of
Our findings are most directly comparable to studies that also consider changes in youth minimum wages. Our findings are in line with Hyslop and Stillman (2007), who studied the impact of an age-specific minimum wage reform in New Zealand on workers aged 16 to 19 over 2001–2002. Their implied MWEs of weekly hours worked are
Looking beyond studies that consider age-specific minimum wages, our results are consistent with recent studies on the impact of changes in the general minimum wage on teenage employment, which generally find no or only modest effects (e.g., Allegretto, Dube, and Reich 2011; Dube et al. 2016; Gittings and Schmutte 2016; Allegretto et al. 2017; Cengiz et al. 2019). However, our estimated MWEs are well outside the range of those reported in some recent studies that find a negative impact of general minimum wage increases on teenage employment (e.g., Thompson 2009; Sabia, Burkhauser, and Hansen 2012, 2016; Neumark et al. 2014a, 2014b). 22
In addition, we quantify the relative importance of spillover effects in the total wage impact, following the approach of Cengiz et al. (2019). First, we compute a counterfactual change that would occur if there were no spillovers. This value is the wage increase that results from moving the (hours worked in) jobs that were initially below the new minimum wage to exactly the new minimum wage. For more details, see Appendix F. Next, we infer the spillover share of the total wage impact by taking the difference between the actual and the “no spillover” wage increase. Using hours, we find that in the absence of spillovers, wages would increase by 1.2% for treated workers. This outcome implies spillovers are quantitatively important, constituting approximately 68% of the total found wage gains resulting from the 2017 minimum wage increase. Results for the number of jobs are very similar, as seen in the second column of Table 4.
Comparison to the 2019 Minimum Wage Increase
We repeat the analysis using variation in the minimum wage for 21-year-olds induced by the July 2019 reform (recall that 22-year-olds were already at the adult minimum wage, so nothing changed for them in 2019). We focus our analysis on 21-year-olds (henceforth treated workers) as these are unaffected by the wage subsidy for young workers. (Results for 20-year-olds are shown in Appendix Figure C.5.) For this analysis we extend our primary sample to December 2019. We assign jobs to
Figure 5 shows the impact of the minimum wage increase as the six-month averaged change in the number of hours worked for treated workers in each wage bin. We again normalize by the average total number of hours worked per capita by age group over the six months prior to the reform. Similar to the 2017 reform, the 2019 increase in the minimum wage did not result in reduced employment for treated workers. (Appendix Table C.4 contains the estimated employment effects and elasticities.) The cumulative impact of the minimum wage is positive beyond
Impact of the 2019 Minimum Wage Increase on Number of Hours Worked by 21-Year-Olds by Wage Bin (Blue Bars) and the Running Sum (Orange Line)
We perform a placebo test using 22-year-olds and find small positive estimates on their hours worked in 2019 compared to 23- to 25-year-olds. This finding suggests there might be some spillovers toward 22-year-olds in 2019, even though we find no negative impacts on hours worked for 21-year-olds. Results are shown in Appendix Figure C.10 and Appendix Table C.13. Overall, we conclude that employment effects of the 2017 and 2019 minimum wage reforms are very similar, but we put more stock in our baseline estimates for 2017 when we find no employment effects for non-treated age groups.
Robustness to LIV Wage Subsidy
A potential concern with our results is the impact of the LIV wage subsidy. Figure 6 therefore shows estimates of our baseline models for which we exclude workers who are eligible for the LIV subsidy. Specifically, we restrict the sample to employment spells with fewer than 1,248 hours worked in a calendar year. Note that this sample selection is more restrictive than the LIV-eligibility requirements, which additionally impose bounds on average wages. While 16.9% of workers aged 22 at the time of the reform would be eligible for the LIV subsidy based on their hours worked over 2017, only 5.7% meet both LIV-eligibility requirements. 24 Panel A shows results for 22-year-olds in the 2017 reform, and panel B for 21-year-olds in the 2019 reform. Reassuringly, these estimates are very similar to the ones for the full sample, and we do not find evidence of negative impacts on hours worked when using the same wage-bin cutoff. That is, among the large majority of treated workers who were not eligible for any wage subsidy, there is no evidence of aggregate employment declines.
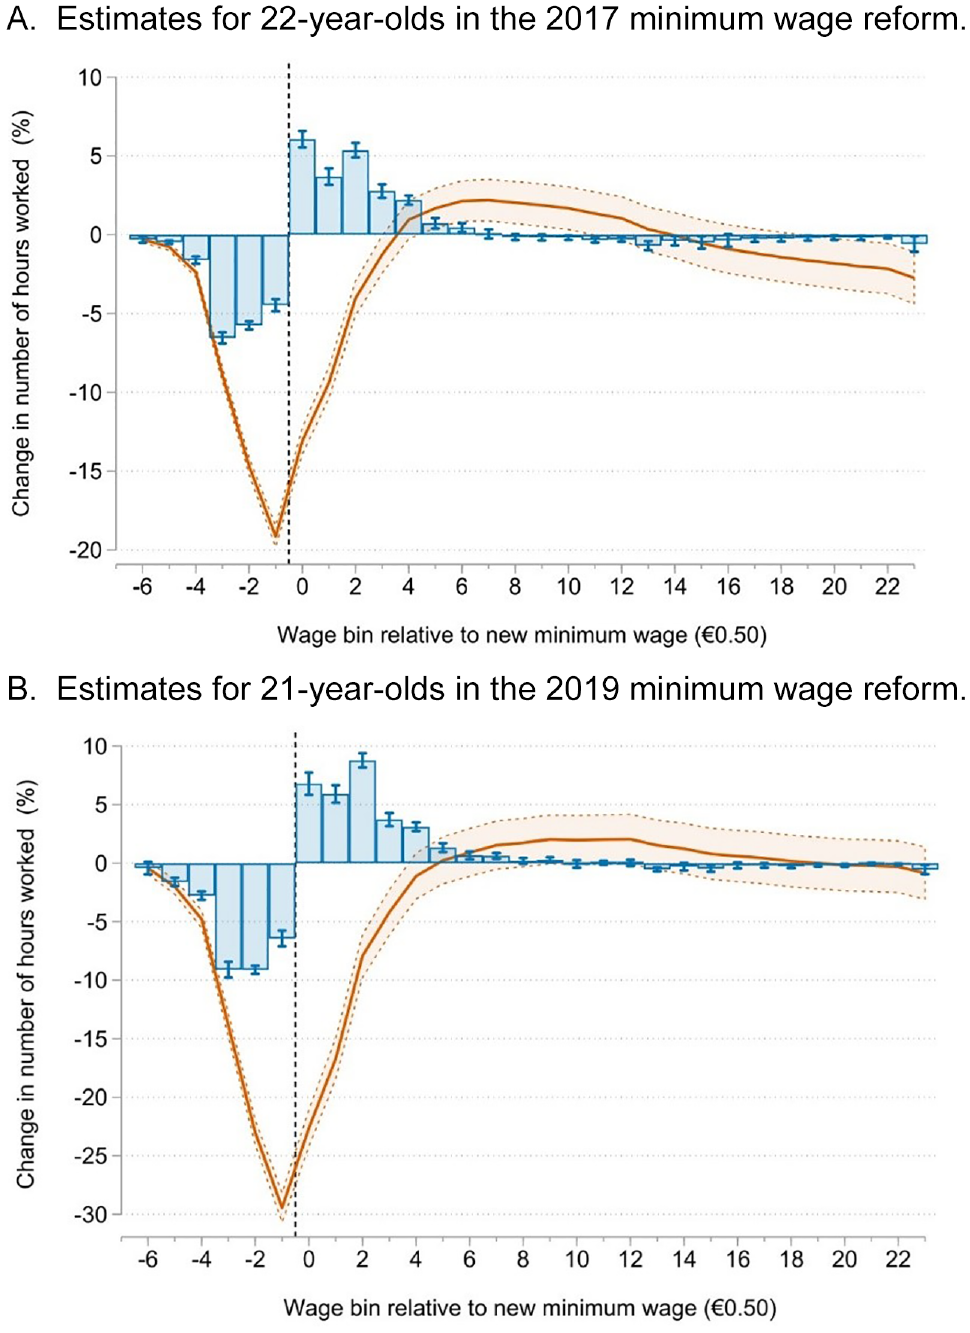
Robustness Check: Removing Subsidy-Eligible Workers
A concern might be that firms strategically retain workers until they work at least 1,248 hours in the year: This would allow firms to obtain the subsidy and could bias our estimates of employment effects. 25 To test this, Figure 7 shows the distribution of hours worked in 2017 and 2016 for all 22-year-olds. We find no evidence of a shift in hours worked toward the 1,248 hour cutoff: Both distributions almost completely overlap. In Appendix Figure C.13, we show that no shift in hours worked occurred in the second half of 2017.
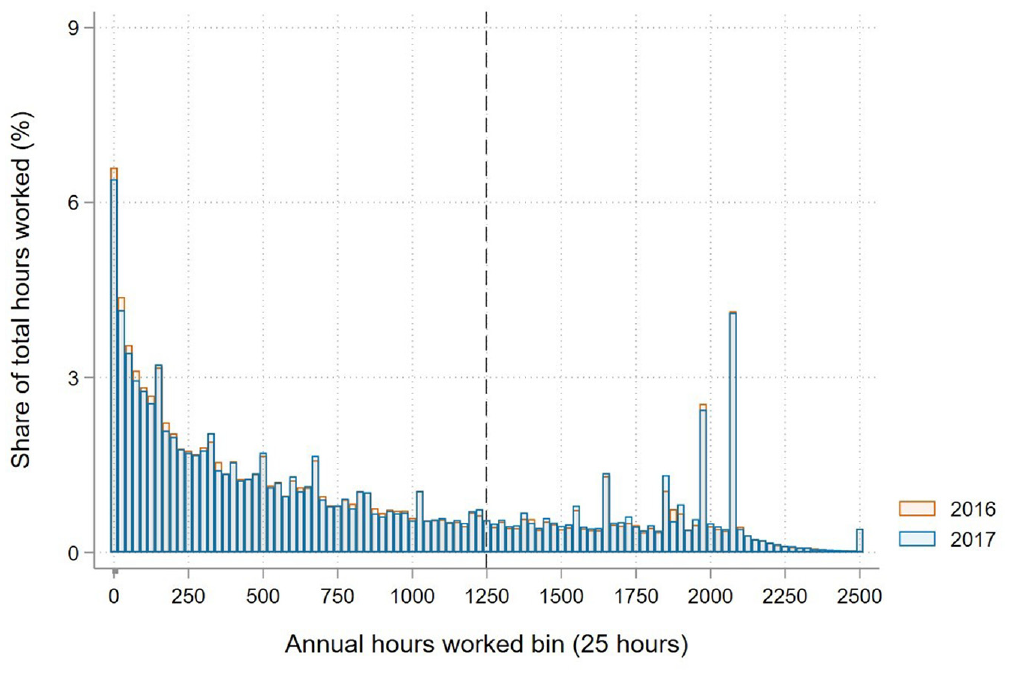
Robustness Check on Bunching in Distribution of Hours Worked Due to Subsidy
In conclusion, we do not uncover an impact of the LIV subsidy on the aggregate employment effects that we find. The share of workers affected by the subsidy is small and strategic behaviors by firms are not apparent. However, we cannot rule out that some firms retain workers affected by the minimum wage increase in order to benefit from the subsidy.
Effect Heterogeneity
Although we find no employment effects of the minimum wage increase, there may be underlying heterogeneity that obscures adverse outcomes for some groups of workers. Of particular concern would be a rising incidence of flexible work arrangements; more adverse effects in specific industries with a high incidence of low-wage employment; and any adverse impacts concentrated among workers who are not transitory occupants of minimum wage jobs. We study these in turn, followed by a decomposition into effects for incumbent workers, recruits from other firms, and labor market entrants. Table 5 presents results for hours worked by 22-year-olds, our baseline group of treated workers. Appendix C.2.1 shows similar results for 21- and 20-year-olds, as well as estimates for the other outcomes including wage elasticities and spillover shares. Appendix C.2.2 shows that our findings also hold for jobs.
Heterogeneity in Effects of the 2017 Minimum Wage Increase on Hours Worked by 22-Year-Olds
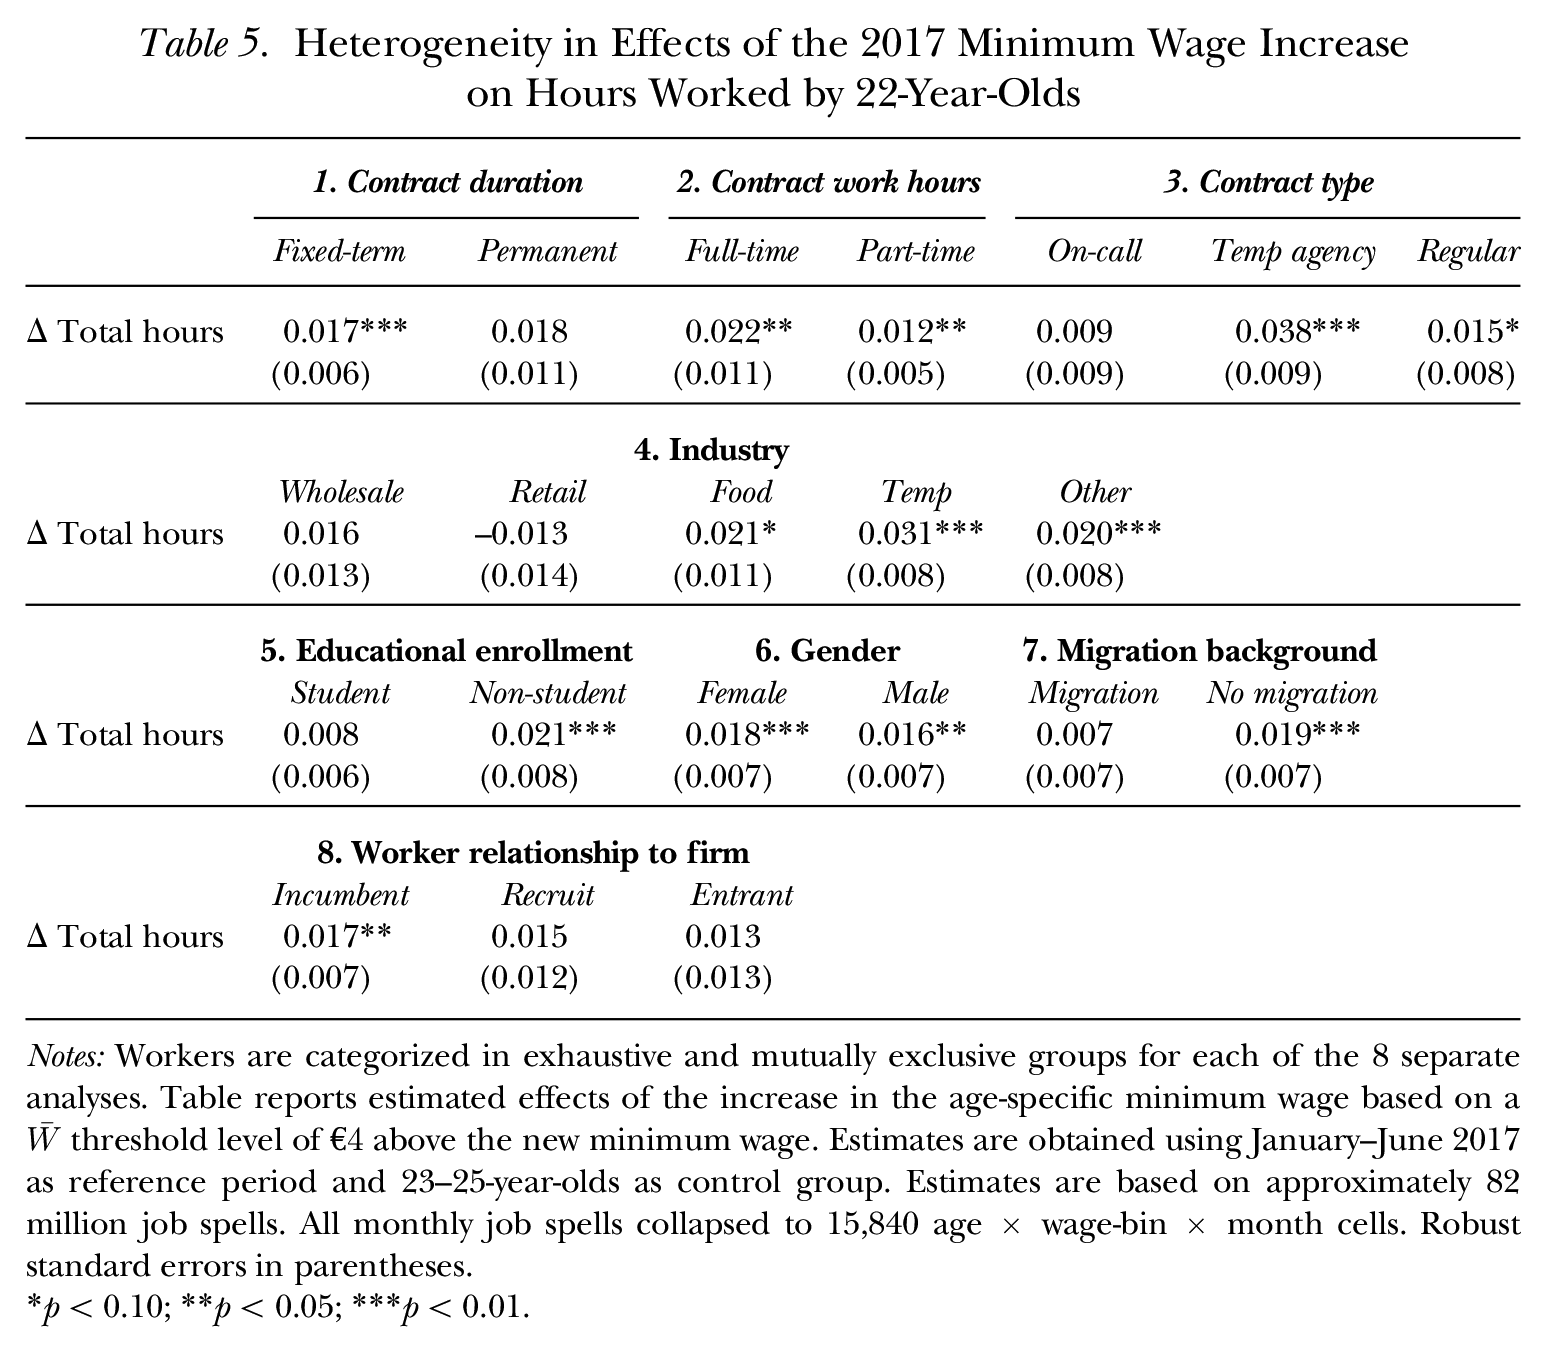
Notes: Workers are categorized in exhaustive and mutually exclusive groups for each of the 8 separate analyses. Table reports estimated effects of the increase in the age-specific minimum wage based on a
p < 0.10; **p < 0.05; ***p < 0.01.
Heterogeneity by Contract Type
Even absent negative employment impacts, employment could shift toward more flexible arrangements in response to minimum wage increases (Datta, Giupponi, and Machin 2019). This possibility is of particular concern in the Netherlands, where flexible work arrangements have become very common over the past 20 years (CBS 2020).
We therefore study the impact of the minimum wage on employment changes across contract types. Specifically, we distinguish fixed-term versus permanent contracts; part-time versus full-time contracts; and on-call versus temp agency versus regular contracts. These contract types can overlap in ways that differ across the three groups: for example, one worker could be on a fixed-term, part-time, regular contract and another could be on a permanent, part-time, on-call contract. Using our primary sample, we collapse the number of jobs and total hours worked in each contract type by age, wage bin, and month. We estimate Equation (1) using age-specific employment in a contract type in bin
First, we find some evidence of a rise in flexible employment arrangements for workers affected by the minimum wage increase relative to the control group, as shown in the top row of Table 5. In particular, hours worked in fixed-term and temp agency work contracts increase. However, hours worked in full-time contracts rise too, and more strongly than in part-time contracts, as do hours worked in regular contracts. This finding suggests that the small number of additional hours worked up to
Heterogeneity by Industry
We continue exploring effect heterogeneity by zooming in on several industries that together account for the largest share of low-wage employment for treated workers, estimating Equation (1) separately for these industries. These are shown in the second row of Table 5: wholesale; retail; food and beverage services; and employment placement, temporary employment provision, and payrolling (labeled “temp”). We include all other industries as a separate category (labeled “other”).
The minimum wage increase has a heterogeneous impact across industries. Most prominently, and in line with findings for contract types, we find the largest increase in hours worked in temp agency work, followed by food and beverage services. Note that we do not find negative effects on hours worked for any of these most-exposed industries: The negative point estimate for retail is very small and not statistically significant. The minimum wage increase had the largest bite in the food and beverages industry, where average wages increased by 6% to 7%. It had the smallest bite in temp agency work, where average wages increased by approximately 4%. For each industry we can confidently rule out own-wage elasticities below
Heterogeneity by Demographics
We also study the extent of labor-labor substitution within age groups by looking at demographic groups. 26 Specifically, we estimate our baseline model separately for students and non-students; females and males; and workers with and without a migration background. 27 Results are shown in the third row of Table 5 (and Appendix Table C.11 reports estimates for jobs).
We find no evidence of labor-labor substitution in hours worked: None of the groups we study experience a decline in working hours following the minimum wage reform. However, most of the additional hours worked following the reform are worked by non-students and people without a migration background. The minimum wage had the largest bite for students, whose hourly wages increase by 4% to 5% on average. We find small increases in hours worked (and in the number of jobs) for non-students, but no corresponding declines for students. Overall, these results suggest little labor-labor substitution and more favorable employment outcomes for workers who are not enrolled in education and therefore are likely to be less-transient occupants of minimum wage jobs.
Effects for Incumbents, Recruits, and Entrants
Last, we explore minimum wage impacts separately for incumbent workers, recruits, and entrants by exploiting the panel dimension of our data. We classify workers as “incumbent” if they worked in the same firm in the month prior, as “recruit” if they were employed in a different firm in the month prior, and as “entrant” if they were not employed in the month prior. Most workers in our sample are incumbents. Recruits and entrants together make up 7% of hours worked in any month. By documenting worker flows at the firm level, this analysis is informative about labor-labor substitution as well as mechanisms underlying spillover effects.
The fourth row of Table 5 shows that hours worked increase most strongly for incumbent workers, though no declines are detected for recruits and entrants. 28 The lack of negative employment effects is consistent with Cengiz et al. (2019) and also suggests employers are not replacing incumbent workers with differently skilled or higher-skilled new hires.
The existence of spillovers for these worker groups can be informative about theoretical mechanisms driving such spillovers. Previous papers have not separately distinguished incumbents, recruits, and entrants, but either include recruits with incumbent workers (Cengiz et al. 2019)—finding spillovers are less prevalent among labor market entrants—or include recruits with entrants (Gopalan et al. 2021), finding this combined group has experienced spillovers also. In our case, incumbents, recruits, and entrants all have substantial and similarly sized spillover shares, although spillover shares are somewhat larger for incumbents among 21- and 20-year-olds (see Appendix Table C.8). Larger spillovers for incumbents are consistent with within-firm relative pay concerns and/or increased bargaining power (Dube et al. 2019; Gopalan et al. 2021); but the existence of sizable spillovers for recruits and entrants suggests that search frictions, workers’ outside options, and reservation wages of non-employed workers may also play a role (Flinn 2006).
Conclusion
We study the employment impacts of a sizable minimum wage increase for young workers, using a difference-in-differences approach combined with detailed administrative data from the Netherlands. To avoid confounding effects of a subsidy for low-wage workers that took effect in 2018 for some of the age groups affected by the minimum wage increase, we focus our results on 22-year-old workers, whom firms knew were not eligible for the subsidy throughout. We find no evidence that the minimum wage has reduced the number of jobs held or the total hours worked by affected workers. No disemployment effects arise because the increase in the age-specific minimum wage has resulted in a reallocation of employment around the new minimum wage: The number of jobs and hours worked in wage bins below the new minimum wage is reduced, but this is fully compensated by an increase in the number of jobs and hours worked in wage bins at or slightly above the new minimum wage. While we focus our analysis on 22-year-old workers and the 2017 minimum wage increase, we find similar impacts for younger affected workers and from a second minimum wage increase implemented in 2019.
The robust absence of negative effects is in large part attributable to substantial spillover effects from the minimum wage further up the wage distribution, accounting for almost 70% of the total wage increase. These spillover effects are concentrated among low-wage workers, with approximately 90% of spillovers occurring within
Our results clearly rule out own-wage elasticities below
The absence of negative employment effects of the minimum wage is consistent with a low demand elasticity for young low-paid workers, for example, because demand for goods and services produced by these workers is inelastic (such that consumers effectively pay for the minimum wage increase); because firms’ profit margins decrease; or because minimum wage workers are a small share of firms’ total costs even in sectors where they account for a large share of labor costs. It could also be explained by models of imperfect labor market competition, which predict such effects if the minimum wage is not set too high. These models include efficiency wages (e.g., Rebitzer and Taylor 1995) and models incorporating various sources of monopsony power through frictions (e.g., see Burdett and Mortensen 1998; Manning 2003). While we do not distinguish specific mechanisms, our finding that in particular non-student, full-time, incumbent workers are seeing increases in hours worked is consistent with firms focusing on more stable and productive employment relationships following the minimum wage increase, as would be predicted by some variants of these models.
Supplemental Material
sj-pdf-1-ilr-10.1177_00197939241239317 – Supplemental material for The Young Bunch: Youth Minimum Wages and Labor Market Outcomes
Supplemental material, sj-pdf-1-ilr-10.1177_00197939241239317 for The Young Bunch: Youth Minimum Wages and Labor Market Outcomes by Emiel van Bezooijen, Wiljan van den Berge and Anna Salomons in ILR Review
Footnotes
Acknowledgements
Helpful comments by Jan Kabátek and participants of seminars at the Bank of Lithuania, CPB, Utrecht University, KVS New Paper Sessions, De Nederlandse Economenweek, European Society for Population Economics, IAB-LASER Virtual Seminar Series on Minimum Wages and Low Wage Policies, European Economic Association, and European Association of Labour Economists are gratefully acknowledged. Salomons and van den Berge gratefully acknowledge funding from Instituut Gak. Author names are randomized.
For general questions as well as for information regarding the data and/or computer programs used for this study, please contact the corresponding author at
1
Many countries have age-specific minimum wage systems or have had youth minimum wage provisions in the past. Implementation differs across countries, with variation in the number of age gradients, the youth-adult minimum wage ratio, and the age threshold that separates youth and adult minimum wages (see Grimshaw 2014; ![]() ).
).
2
Some studies use age-discontinuities in the minimum wage to study the impact of youth minimum wages on youth labor market outcomes. For example, Dickens, Riley, and Wilkinson (2014), Kreiner, Reck, and Skov (2020), and Kabátek (2021) considered the impact on individual labor market outcomes when individual workers cross an age threshold, resulting in a higher applicable minimum wage. While these studies focused on minimum wage variation embedded in the prevailing youth minimum wage system, we focus on minimum wage changes resulting from a change in the age-dependent minimum wage system. Kabátek (2021) studied the Dutch minimum wage before the reform: We replicate his descriptive analyses in ![]() using data two years before and after the reform and find similar results.
using data two years before and after the reform and find similar results.
3
A policy report has also considered the 2017 policy change we study (ter Weel, van der Werff, and Zwetsloot 2018), finding similar results. The key difference between their study and ours is that we focus on the impact of the minimum wage change around the minimum wage while they focused on all workers in the affected age groups, which could lead to biased estimates if other changes occur higher up the wage distribution (Cengiz et al. 2019). Our setup furthermore allows us to study wage spillovers. Finally, ![]() included data from 2018, whereas we restrict our main analyses to 2017. Estimates including 2018 could be confounded by other policies—as also acknowledged in ter Weel et al. (2018)—that we discuss below.
included data from 2018, whereas we restrict our main analyses to 2017. Estimates including 2018 could be confounded by other policies—as also acknowledged in ter Weel et al. (2018)—that we discuss below.
4
See Tweede Kamer der Staten-Generaal (2016b) for the proposal to increase the youth minimum wage, and Tweede Kamer der Staten-Generaal (2016a) for the accompanying explanatory memorandum. ![]() discusses the details of the policy change and the additional policies mentioned below in detail, citing and translating the relevant government documents.
discusses the details of the policy change and the additional policies mentioned below in detail, citing and translating the relevant government documents.
5
We find that the employment impacts of these small increases for 18- and 19-year-olds are close to zero. Estimates are available upon request.
6
Specifically, it subsidizes 10% of wages for workers earning between 100% and 110% of the minimum wage and 5% of wages for workers earning between 110% and 125% of the minimum wage up to a maximum of 2,000 and 1,000 euros per year, respectively. The LIV subsidy for hours worked in year t is automatically paid out in September of year t+ 1.
7
Because of the stringent criteria, only 3.7% (1.9%) of workers aged 21 (20) were eligible. For those initially earning below the new minimum wage, only 1.1% (0.25%) were eligible.
8
The subsidy compensates firms for only the increase in gross wages and not for other wage components (e.g., holiday allowance and contributions to the employee insurance), decreasing the effective compensation in labor costs.
9
10
Monthly earnings are defined as gross basic income, which excludes premiums and special payments. Income for overtime hours worked are included in gross basic income as long as compensation for these hours worked is the same as the contractual wage. Hours worked are defined as the total hours over which an employee receives a wage during an employment spell, including any overtime hours for which employees receive the same hourly compensation. Employers are obliged to pay the minimum wage over all hours worked, including any overtime; that is, they cannot increase overtime hours to avoid minimum wage compliance.
11
In the Netherlands, as is common in other countries, temporary help agencies are for-profit organizations that do not receive additional subsidies from the government.
12
Further, the share of total hours worked at low wages is slightly below the share of the total number of jobs, reflecting that lower-wage jobs have lower weekly hours on average.
13
14
Because we estimate treatment effects up to 30 months prior to treatment (i.e., starting in January 2015), these seasonal effects are identified using variation from January 2007 up to December 2014.
15
In ![]() , we report results showing the employment change in a bin relative to employment in the pre-reform period in that specific bin instead of relative to total employment by age. We find similar patterns to our main results, but much noisier estimates especially higher up the distribution where the bins are sparsely populated. The advantage of the scaling we employ in the main text is that the effects per bin can simply be added to get the total employment effect, given by the orange line in the main figures.
, we report results showing the employment change in a bin relative to employment in the pre-reform period in that specific bin instead of relative to total employment by age. We find similar patterns to our main results, but much noisier estimates especially higher up the distribution where the bins are sparsely populated. The advantage of the scaling we employ in the main text is that the effects per bin can simply be added to get the total employment effect, given by the orange line in the main figures.
16
The orange line is constructed by calculating the running sum of the estimated effects up to each bin. For example, at 2 euros above the new minimum wage, the orange line shows the total change in hours worked (relative to total hours worked in the six months prior to the reform) following the reform for bins up to 2 euros above the new minimum wage.
17
We use robust standard errors throughout. As an alternative, we have tried clustering by age × wage bin, which substantially shrinks standard errors.
18
Since the hourly minimum wage depends on the standard workweek in each sector, firms could in principle adjust the standard workweek to (partially) adjust to the minimum wage. In practice this approach is not easy, since the standard sectoral workweek is laid out in a collective bargaining agreement and also covers workers not affected by the minimum wage reform. In ![]() , we show that there has been no change in contracted hours surrounding the reform.
, we show that there has been no change in contracted hours surrounding the reform.
19
Results from this placebo test are reported in ![]() . One possible explanation for this finding is the frequent use of age-specific pay scales in collective bargaining agreements that cover most firms. Such frictions might prevent firms from also having to adjust wages of older workers if younger workers see a wage increase. Another possible reason is that workers of different ages are segregated in different firms.
. One possible explanation for this finding is the frequent use of age-specific pay scales in collective bargaining agreements that cover most firms. Such frictions might prevent firms from also having to adjust wages of older workers if younger workers see a wage increase. Another possible reason is that workers of different ages are segregated in different firms.
20
![]() report results. These tables also show results for
report results. These tables also show results for
21
Implied elasticities are not reported by Hyslop and Stillman (2007) but were computed by ![]() .
.
22
For an extensive overview of this literature, see Neumark and Wascher (2008), Belman and Wolfson (2014), and Dube (2019). For recent meta-studies, see Doucouliagos and Stanley (2009), Belman and Wolfson (2014), and ![]() .
.
23
We still estimate leading terms starting in January 2015, such that leading terms now start at
24
Among 22-year-olds with wages initially below the new minimum wage, 23% meet the hours worked requirement of the LIV and 7.5% meet both LIV requirements.
25
Note that for 22-year-old workers initially earning below the new minimum wage, this strategy works only if they also start earning substantially more than the new minimum wage so that their average wage over the year is at least the adult minimum wage.
26
Recent studies uncover mixed evidence of labor-labor substitution in the United States, with Cengiz et al. (2019) finding no such effects, but Giuliano (2013) showing an increase in teenage employment relative to older workers following an overall minimum wage increase and ![]() showing an increase in hours worked of more productive workers.
showing an increase in hours worked of more productive workers.
27
Students are defined as being enrolled in education. If there is up to a three-month gap in enrollment, we continue to classify people as students during that gap to account for summer holidays and so forth. An individual with a migration background was either born in a foreign country or one of their parents was born in a foreign country.
28.
Appendix Table C.8 shows negative effects for recruits and entrants among workers aged 20 and 21. These effects are quite substantial, leading to own-wage elasticities smaller than −1 for 20-year-old recruits and entrants, and an own-wage elasticity around −1 for 21-year-old recruits. However, these hours effects are primarily driven by changes at the intensive margin, as shown in ![]() .
.
References
Supplementary Material
Please find the following supplemental material available below.
For Open Access articles published under a Creative Commons License, all supplemental material carries the same license as the article it is associated with.
For non-Open Access articles published, all supplemental material carries a non-exclusive license, and permission requests for re-use of supplemental material or any part of supplemental material shall be sent directly to the copyright owner as specified in the copyright notice associated with the article.