
Abstract
Using data from the Canadian Employer-Employee Dynamics Database between 2001 and 2015, the authors examine the impact of firms’ hiring and pay-setting policies on the gender earnings gap in Canada. Consistent with the existing literature and following Card, Cardoso, and Kline (2016), findings show that firm-specific premiums explain nearly one-quarter of the 26.8% average earnings gap between female and male workers. On average, firms’ hiring practices, due to differences in the relative proportion of women hired at high-wage firms (known as sorting), and pay-setting policies, due to differences in pay by gender within similar firms, each explain approximately one-half of this firm effect. The compositional difference between the two channels varies substantially over a worker’s life cycle, by parental and marital status, and across provinces.
Convergence in the economic outcomes of women and men has slowed down since the 1990s (Olivetti and Petrongolo 2016; Kunze 2018). The nature of the gender earnings gap has also shifted: It is no longer associated with disparities in human capital and instead is largely attributed to the sorting of female and male workers into dissimilar occupations, industries, and firms (e.g., Olivetti and Petrongolo 2016; Blau and Kahn 2017). Correspondingly, a renewed focus of the research is on the role of the firm or the workplace in explaining what is left of the gender earnings gap.
A bulk of recent studies show that women and men sort into firms that vary in pay and non-pay attributes, and that at a given firm, women and men differ in their ability or willingness to access better paid positions. 1 Among other things, whether the remaining gender earnings gap stems primarily from a “glass door” or a “glass ceiling” effect leads to potentially very different policy implications (Pendakur and Woodcock 2010).
In this article, we ask the following questions: What is the relative importance of workers’ sorting across firms and of firms’ pay-setting practices in explaining the gender earnings gap in Canada? 2 Our approach follows Card, Cardoso, and Kline (2016). We estimate the proportion of the gender earnings gap that is explained by firm fixed effects and decompose this contribution into a sorting and a pay-setting component. The sorting component measures the degree to which male and female workers sort into different types of firms; the pay-setting component measures the degree to which male workers are paid differently from female workers by a given firm. 3
We use data from the Canadian Employer-Employee Dynamics Database (CEEDD), which is a linked administrative data set covering all individual workers and their employers filing corporate tax returns since 2001. The analysis relies on the ability to observe individual workers over time and across firms. It also exploits key variables on workers (e.g., annual earnings, age, sex, and province of residence), their families (e.g., marital status and presence and age of children), and the firms they work for (e.g., industry and firm size).
Our main contribution is twofold. First, we add to the large body of work examining the role of firms in explaining the gender pay gap (e.g., Olivetti and Petrongolo 2016; Blau and Kahn 2017), and more specifically, to the emerging literature on the relative importance of sorting and pay-setting in firms’ contribution to the gender earnings gap (Card et al. 2016; Coudin, Maillard, and Tô 2018; Bruns 2019; Casarico and Lattanzio 2019; Morchio and Moser 2019; Masso, Meriküll, and Vahter 2020; and Cruz and Rau 2022).
Second, our data allow us to investigate whether the role of firms varies across people who differ in their marital status. In doing so, we add to the limited evidence on the factors that drive the relative importance of the sorting and pay-setting channels. Existing research has focused on differences across age groups and between parents and non-parents (Card et al. 2016; Coudin et al. 2018; Bruns 2019).
The relationship between marital status, intra-household resource allocation, and women’s labor supply is well documented in the literature (e.g., Chiappori, Fortin, and Lacroix 2002; Stevenson 2007; Voena 2015; Goussé and Leturcq 2018). It seems therefore natural to ask whether household dynamics are associated with differences in access to firm premiums.
Literature
The growing availability of large linked employer-employee data sets has supported increasingly refined assessments of gender segregation across firms, of gender disparities within firms, and of the relative importance of between- and within-firm mechanisms. 4
In this vein, Card et al. (2016) decomposed the contribution of firm premiums to the gender wage gap into what they refer to as sorting and bargaining (or pay-setting) effects. To do so, they estimated separate wage equations for women and men, with non-nested worker and firm fixed effects. 5 Their decomposition captures the fact that women and men may be unequally distributed across firms with different premiums (sorting effect) and may capture a dissimilar share of the firm-specific surplus (bargaining effect). Using a large administrative data set on private-sector workers from Portugal, they found that 20.9% of the gender wage gap in the early 2000s can be attributed to firm effects. Approximately three-quarters of this firm-specific pay premium results from the sorting of women into lower-paying firms, with the remainder stemming from gender disparities in bargaining.
Subsequent work has produced comparable results for other countries, with the portion of the gender pay gap attributable to firm effects ranging from 8% in France (Coudin et al. 2018) and 11% in the 1990s in West Germany (Bruns 2019) to nearly 40% in Chile (Cruz and Rau 2022) and 60% in Brazil (Morchio and Moser 2019). In addition to Portugal, mid-range countries include West Germany in the early 2000s (Bruns 2019), Italy (Casarico and Lattanzio 2019), and Estonia (Masso et al. 2020), where respectively 25.9, 30.5, and 35.1% of the gender pay gap is attributable to firm effects. Common to almost all of these studies is the central role played by sorting. Depending on the country considered, sorting is estimated to account for 15.0 to 31.8% of the gender pay gap, explaining at least 70.0% of the firm effect. 6 Relying on other methodologies, Jewell et al. (2020) and Sorkin (2017) also found that sorting plays an important role in the United States and the United Kingdom, accounting respectively for 16.1 and 27.8% of the overall gender gap.
We apply the methodology developed by Card et al. (2016) to the Canadian context. Our results show that firm-specific pay premiums explain nearly one-quarter of the 26.8% gender earnings gap in Canada, in line with existing research. We find that workers’ sorting and firms’ pay-setting practices each explain approximately one-half of that effect. This implies that firms’ pay-setting policies play a larger part in Canada compared with other studied countries.
Knowing the relative importance of sorting and bargaining is valuable insofar as it can be used to learn about the mechanisms that contribute to the gender pay gap and to design policy accordingly. Research in that respect is still in its very early stages. For the most part, existing work has relied on comparisons across demographic groups to draw tentative conclusions about the forces that may be at play and on informal cross-country comparisons of the institutional setting that affects the labor market directly and indirectly.
Card et al. (2016) observed that the sorting channel gains in importance as women age, beginning in their early 30s. Building on this finding, Coudin et al. (2018) showed that sorting increases after childbirth among French women, an effect that is not driven by age. They also found that mothers are more likely to work in firms closer to their home or in firms that offer more flexible hours. In line with this, Bruns (2019) estimated that sorting into lower-paying firms accounts for at least a quarter of the wage penalty associated with motherhood. This effect is driven by mothers who change jobs following childbirth. 7
The emphasis on the distinction between women with and without children is not surprising, given the large literature that documents the substantial impact childbirth and child-rearing have on women’s labor market outcomes (Angelov, Johansson, and Lindahl 2016; Kleven et al. 2021). Differences have been observed across other dimensions as well, however; for example, across the skill distribution. Card et al. (2016) documented the greater importance of bargaining for higher-educated workers, whereas Bruns (2019) found that bargaining affects individuals only at the top of the earnings distribution.
Our source of data distinguishes itself from data sets used so far in this literature in that it allows us to precisely identify the marital status of every individual in our sample, for every year in which they are observed. We can therefore determine not only whether people are in unions but also what type of union they are in—common-law union or legal marriage—and, if they are single, whether they have been in a union previously and how that union has come to an end—separation, divorce, or widowhood. We find that sorting is most important among married workers and least important among single individuals. Although this may in part be related to the life-cycle patterns discussed above, we find substantial differences in sorting between legally married people and those in common-law unions. Ours is the first article to show that family composition decisions other than fertility decisions, such as marital formation and dissolution, are also associated with differences in the ways in which firms affect the gender pay gap.
Empirical Model
In this section, we present the framework used to estimate the total contribution of firms to the gender earnings gap and to quantify the relative importance of the sorting and pay-setting channels. Like Card et al. (2016) and others in this literature, our model follows the well-known Abowd, Kramarz, and Margolis (1999) (hereafter AKM) linear model with non-nested worker and firm fixed effects. Our dependent variable is the worker’s annual earnings. A concern associated with annual earnings is that they incorporate both wages and work intensity (number of hours and weeks of work). This approach is potentially problematic given that women are more likely than men to work part time. To obtain a measure of the earnings differential between men and women that more closely reflects the wage differential, we apply a full-time equivalent income threshold to select our analysis sample. We discuss the sample selection procedure in more detail in the next section of the article.
Let

where
The vector
Because worker fixed effects also capture time-invariant cohort effects, the linear impact of age cannot be identified given that age is perfectly collinear with time-invariant year of birth and year. Instead, we normalize age at 46 and impose a linear restriction by dropping the linear term in the quartic function. This restriction effectively constrains the age profile to be flat at age 46, which is supported by the age-earnings profile in our data.
As with the use of any administrative data, we have limited information on workers’ characteristics such as education or ethnicity. However, because of the time-invariant nature of these characteristics, they are well captured by worker fixed effects. Similarly, firm fixed effects capture time-invariant characteristics such as industry. Any time-varying characteristics other than the observables mentioned above are included in the error term. This term captures any measurement errors, labor market shocks, shocks to personal conditions (e.g., health), and job transitions.
As shown in AKM (1999), unbiased estimation of worker and firm fixed effects requires the following condition to hold:

where
Using the same data as we do, Dostie, Li, Card, and Parent (2020) evaluated the exogenous mobility assumption for Canadian-born individuals and immigrants and found no indication that it fails. 9 We replicate their analysis and compute the percentage change in earnings for firm movers (from two years before to one year after the change), by co-worker earnings quartile at origin and destination firms, separately for men and women. Under the exogenous mobility assumption, the mean earnings of workers who move to higher- and to lower-paying firms should be symmetric; that is, of similar magnitude but opposite sign. This analysis is summarized in Figure 1 and shows evidence consistent with exogenous mobility. The gains for workers who move to a higher quartile are strongly negatively correlated to the losses of workers who move down (–0.98 for men and −0.97 for women).
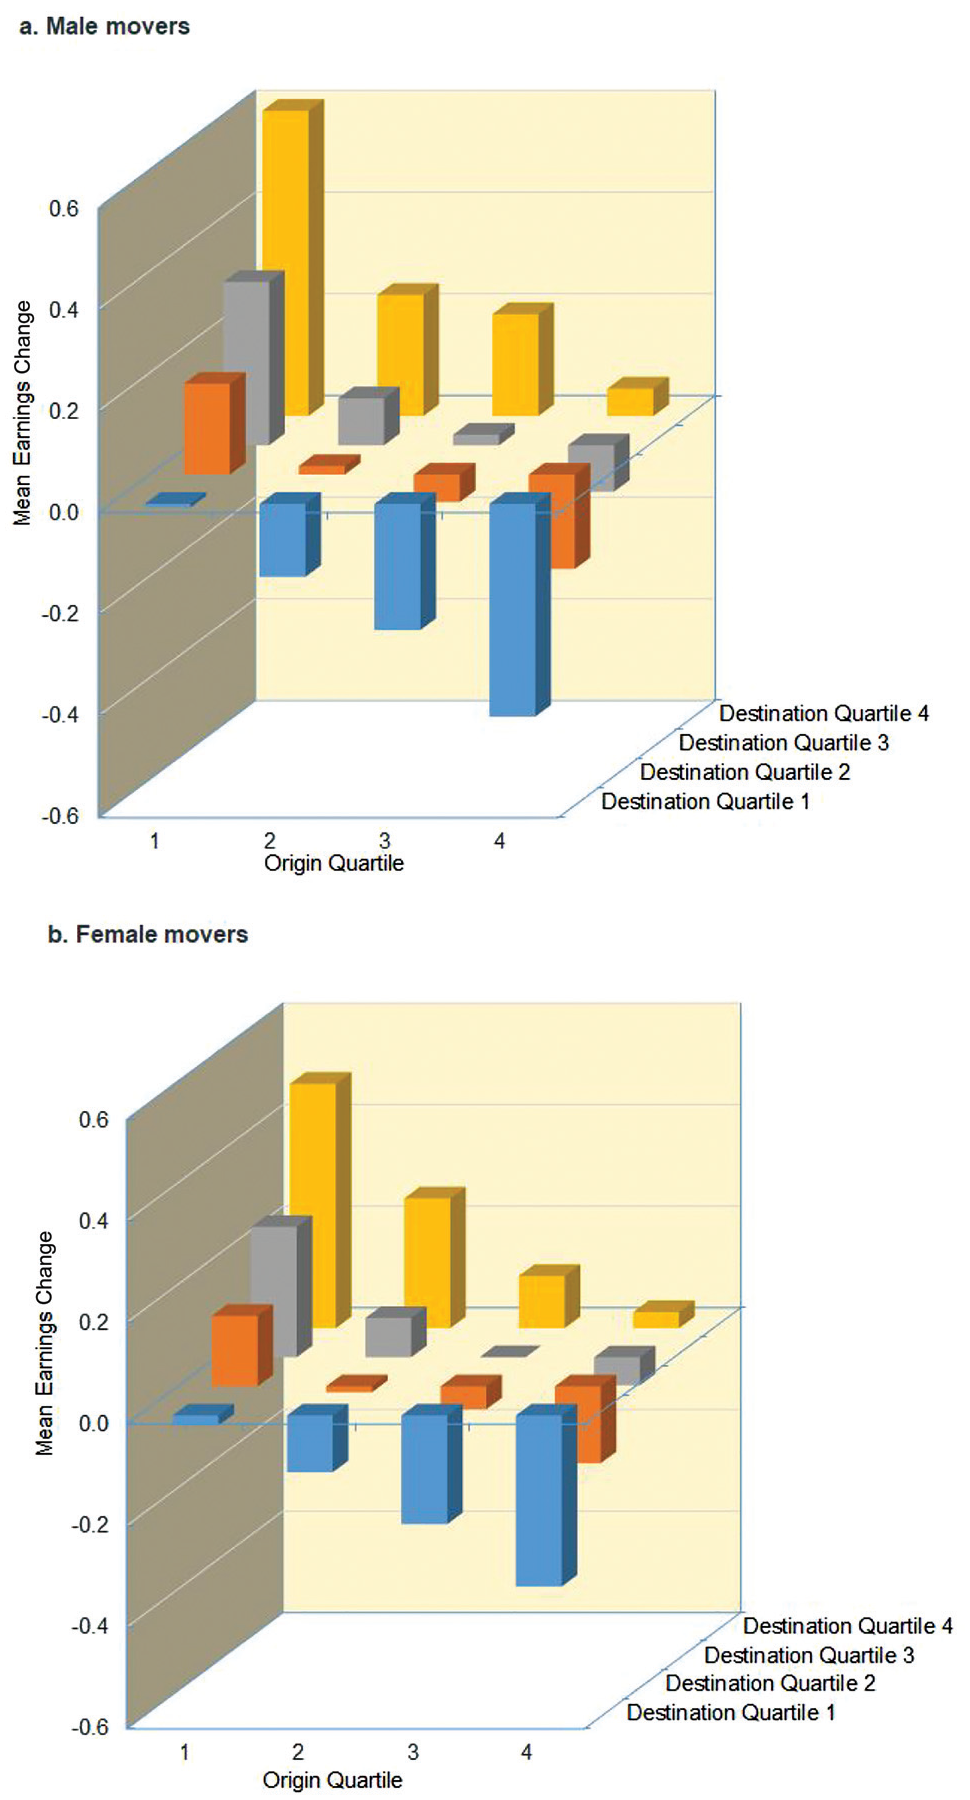
Earnings Changes of Firm Movers by Co-worker Earnings Quartile of Origin and Destination Firms
A large body of literature shows that changes in the labor market can occur simultaneously with family transitions. For instance, research has found evidence that job loss leads to divorce among married men and to changes in the types of unions of unmarried men (Charles and Stephens 2004; Ahituv and Lerman 2011; Eliason 2012; Foerster, Obermeier, Paul, and Schulz 2021). By comparison, existing work suggests that positive economic outcomes for women—increased earnings, promotion, or primary earner status within the couple—are associated with higher rates of divorce, and that at least part of this relationship may be causal (Weiss and Willis 1997; Bertrand, Kamenica, and Pan 2015; Folke and Rickne 2020). Evidence also indicates that job loss among women negatively affects fertility (Del Bono, Weber, and Winter-Ebmer 2012, 2015).
The relationship may also operate in the opposite direction. Among men, a large literature has documented the existence of a sizeable marriage pay premium, although the mechanisms that lead to this observation remain ambiguous (for a review, see Juhn and McCue 2017). For both men and women, several authors have also found evidence of a causal impact of marital dissolution on labor supply (Chiappori et al. 2002; Stevenson 2007; Bargain, González, Keane, and Özcan 2012; Voena 2015). Finally, it is well established that the birth of children has large and lasting effects on women’s labor market outcomes, in part by leading to shifts to lower-paying firms (Angelov et al. 2016; Coudin et al. 2018; Bruns 2019; Kleven et al. 2021).
In brief, it is possible for match-specific time-varying earnings shocks to impact both firm mobility and marital status. This effect, however, would be problematic for our analysis only if those shocks had an asymmetric impact on the probability to move up to a high-wage firm or down to a low-wage firm. Our analysis of earnings and firm changes presented in Figure 1 does not seem to show this pattern to be a problem.
Finally, note that the estimation of firm fixed effects depends on observing a worker in two different firms. We refer to this set of workers and firms connected by movements of workers between firms as the “connected set.” The estimation is done using ordinary least squares (OLS) regressions involving special routines to account for the high dimensionality of the problem. This model is estimated for men and women separately.
Firm Effects Normalization and the Dual-Connected Set
Because the equations for the determinants of earnings are estimated separately for men and women, and because our objective is to compare how firm effects contribute to earnings, we need a way to compare firm effects estimated from the two separate models. This comparison is challenging because, in each equation, the firm-specific earnings premium is identified only relative to a reference set of firms. To identify this set of firms, we estimate the following equations for men (M) and women (W):


in which
Decomposing the Effect of Firm-Level Pay Premiums
By denoting the firm effects estimated from the AKM model for women by

The first term on the right-hand side

is the bargaining effect as defined by Card et al. (2016). This effect measures the degree to which women obtain a smaller share of the surplus generated by firms than their male counterparts. Using the terminology employed by Dostie et al. (2020), we refer to this component as the pay-setting effect in the description of the results.
The second term on the right-hand side of the equation

is the sorting effect.
The sorting component measures the extent to which women sort into different types of firms relative to men, while the pay-setting component is thought to result from differences in how men and women are paid by the same employer. 11 The degree to which these two factors affect gender earnings differentials likely depends on labor market institutions, such as the minimum wage or the importance of collective wage setting, as well as the degree of labor market fluidity.
The set of workers for which such a comparison can be made must work in firms that employ both men and women simultaneously. This set is called the “dual-connected set.” This selection rule effectively drops all firms that employ only women or only men. We discuss the impact of these selection rules in the next section.
Data
Data Source
This study uses data from Statistics Canada’s CEEDD between 2001 and 2015. The CEEDD is a linked database of workers and employers that covers all individual and corporate tax filers. It can be accessed from Statistics Canada’s Business Data Access Centre in Ottawa.
Our target population is all workers aged between 25 and 54 and employed by incorporated businesses in the business sector in Canada. 12 We exclude employees in incorporated businesses operating in the public sector, namely the North American Industry Classification System (NAICS) industries of education (61), health (62), and public administration (91). Workers’ demographic information, such as age, gender, marital status, and family status, is derived from individual tax records for those who filed personal tax returns at least once before 2018. Marital status is categorized into single (never married), common-law, legally married, separated, divorced, and widowed. For presentation purposes, they are further aggregated into two groups: alone (single, separated, divorced, and widowed) and union (common-law and married). Family status includes two types: workers with dependent children and those without. For workers with children, their age is derived from their year of birth in a given year.
For a given worker, income is measured using annual earnings from their employment in incorporated businesses only. 13 For a worker with multiple jobs (including self-employment), the highest paying job is considered only if his or her primary income is sourced from employment. Moreover, nominal annual earnings are deflated by provincial Consumer Price Indexes (CPI, 2012=100). 14 Last, since annual earnings can confound gender difference in both pay and hours worked, we focus on full-time equivalent workers only. The nature of work (full-time versus part-time), as well as detailed measures of work intensity (hours or weeks of work), are unavailable in the administrative data. Instead, we apply a threshold of annual earnings of roughly $18,000, derived from the 2012 minimum wage and full-time hours from the Labour Force Survey (Statistics Canada 2020a) microdata file. 15
For employers, labor productivity—used to capture firm characteristics—is measured by real value added per employee. 16 Value added is measured as the sum of payrolls and net income before taxes and extraordinary items and is reported in current dollars. Industry-specific deflators from the Canadian Productivity Accounts (Statistics Canada 2020b) are used to deflate nominal values to real terms. Employment is measured by the average number of employees according to a given firm’s payroll deductions and remittances files. This measure accounts for possible seasonality and double counting as a result of multiple-job holders. Moreover, to allow for direct earnings comparisons by gender for a given employer, our sample includes incorporated businesses with a minimum of two employees throughout the sampled period. The identification of worker and firm fixed effects requires each worker to be observed over multiple years and multiple workers to be observed in each firm. Firms with very low output or value added below $100 are excluded. Last, for firms that engage in multiple activities over the sampled period, their primary industry is used to define their dominant activities. Primary industry is defined as the mode of industry classification between 2001 and 2015.
Our final sample contains all prime-age, full-time workers whose main job is with incorporated businesses in the business sector that have two or more employees. Note that the exclusion of public-sector and part-time employees likely results in a widening of the gender earnings gap (also see the next subsection). First, the gender wage gap in the public sector is narrower than in the rest of the economy. In 2015, the gender (hourly) wage gap for full-time workers aged 25 to 54 was 7% in education, 7% in health, and 10% in public administration—the three component industries in the public sector. By comparison, the gender wage gap was on average 16% for the rest of their cohort. 17 Second, part-time workers are concentrated among female workers, who have better pay than part-time male workers. Again in 2015, 19% of all female workers aged 25 to 54 were part time, compared with 6% of their male counterparts. 18 The average (hourly) wage rate was higher among prime-age, part-time female workers ($21.19) than among their male counterparts ($20.69). 19
Summary Statistics
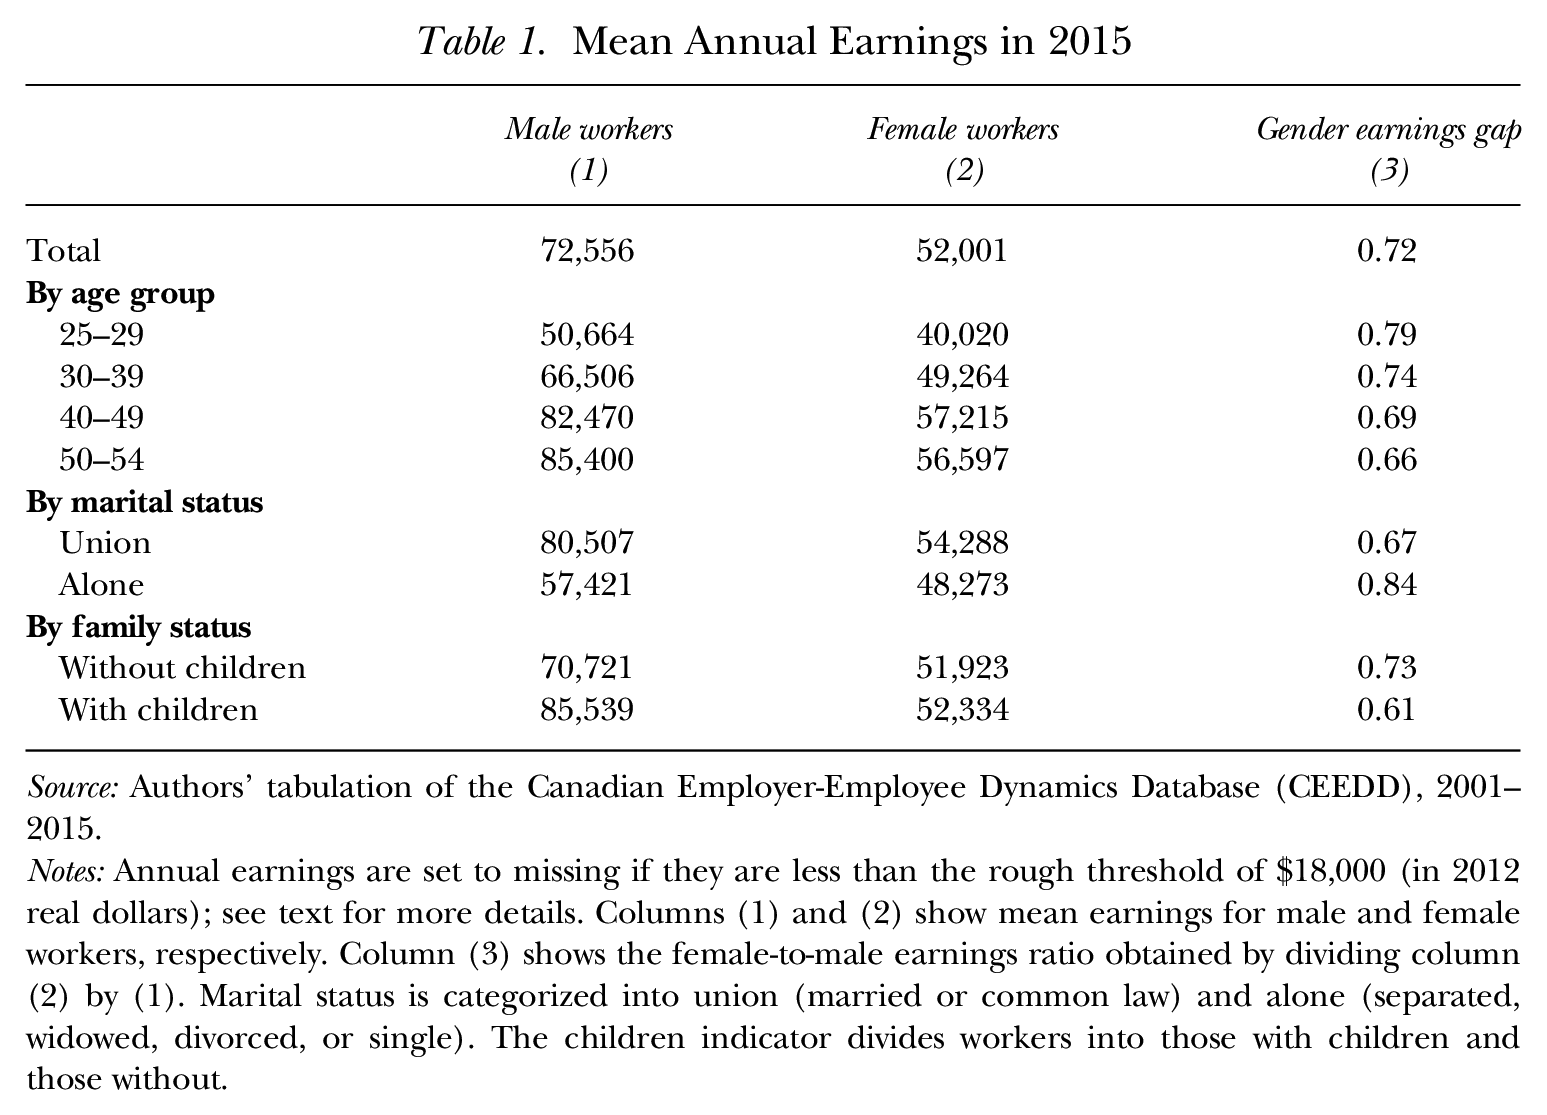
Table 1 summarizes mean annual earnings in 2015. Mean earnings on the main job for an individual who earns at least the minimum threshold are $72,556 for men and $52,001 for women, implying a gender earnings gap of 28%. This gap is greater for older workers, workers who are married or in common-law union, and for those with children. The gap has widened slightly over time (see Figure 2), which contrasts with what has been observed in the workforce overall. For example, in the public sector, the gender earnings gap has been fairly stable since the 1990s, and for part-time workers, female workers earn more than their male counterparts. 20 The pace at which the gap widens over the 15-year period is fastest among younger workers, single workers (i.e., widowed, divorced, separated, or never married), and those without children.
Mean Annual Earnings in 2015
Source: Authors’ tabulation of the Canadian Employer-Employee Dynamics Database (CEEDD), 2001–2015.
Notes: Annual earnings are set to missing if they are less than the rough threshold of $18,000 (in 2012 real dollars); see text for more details. Columns (1) and (2) show mean earnings for male and female workers, respectively. Column (3) shows the female-to-male earnings ratio obtained by dividing column (2) by (1). Marital status is categorized into union (married or common law) and alone (separated, widowed, divorced, or single). The children indicator divides workers into those with children and those without.
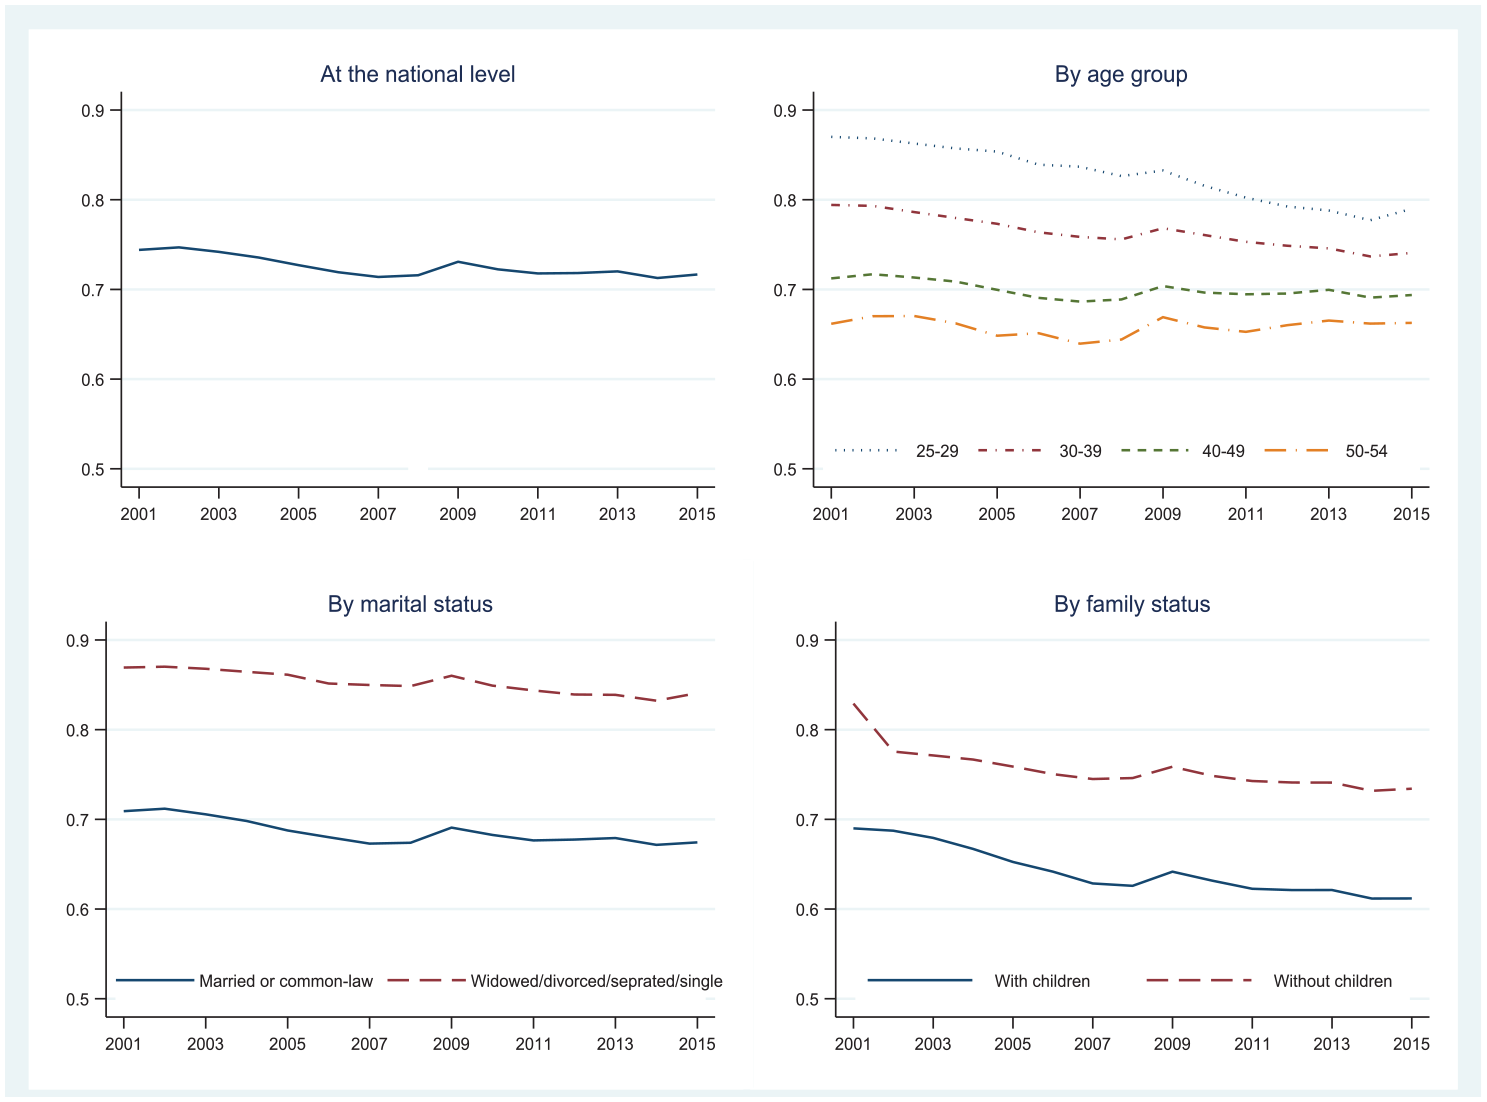
Mean Gender Earnings Gap, 2001–2015
Female workers represent approximately 35% of the workforce in our sample. Such representation varies by age and by marital and family status (Appendix Tables A.1 and A.2.1; hereafter, the “A” prefacing a number indicates it is part of the Online Appendix). The degree to which female representation varies increases according to the characteristics of their employers, such as industry and firm age and size (Tables A.2.2, A.2.3, and A.2.4), which suggests that firms play an important role in explaining earnings by gender.
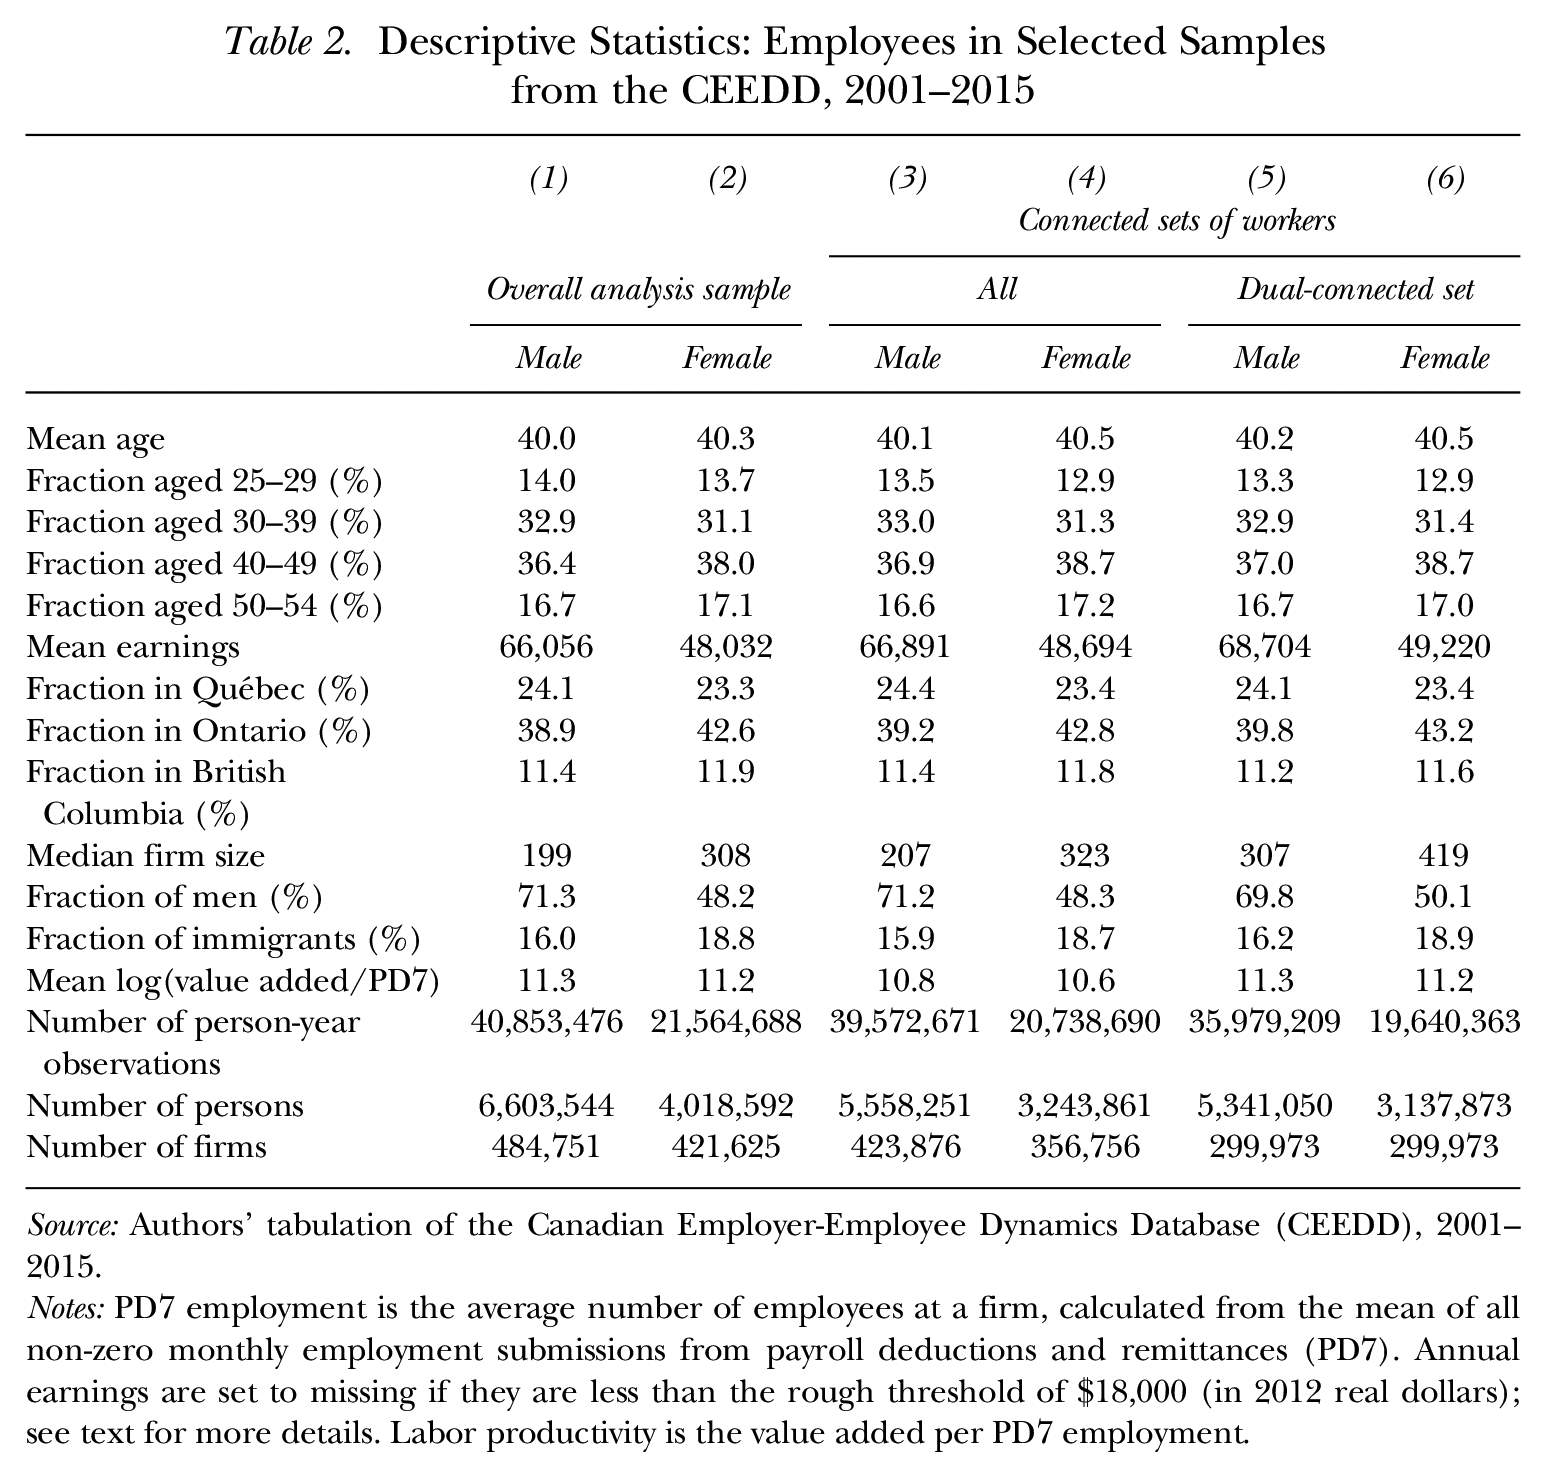
Table 2 provides a descriptive overview of the characteristics of workers aged 25 to 54 who have earnings in at least one year in the CEEDD data from 2001 to 2015. The sample selection procedure may have dropped full-time workers who did not work the entire year, and therefore, did not reach the income cutoff threshold. Earnings are counted only if they are above the “full-time equivalent” threshold. This procedure has two implications. First, it can cause an artificial dip in earnings in the final year of a job, if a worker leaves partway through the year. Conversely, that same worker would then appear to have a bump in earnings in the second year on their new job. Second, it can create fake gap years in employment if an individual spends part of the year out of employment and in doing so earns below the full-time equivalent threshold.
Descriptive Statistics: Employees in Selected Samples from the CEEDD, 2001–2015
Source: Authors’ tabulation of the Canadian Employer-Employee Dynamics Database (CEEDD), 2001–2015.
Notes: PD7 employment is the average number of employees at a firm, calculated from the mean of all non-zero monthly employment submissions from payroll deductions and remittances (PD7). Annual earnings are set to missing if they are less than the rough threshold of $18,000 (in 2012 real dollars); see text for more details. Labor productivity is the value added per PD7 employment.
Columns (1) and (2) in Table 2 summarize the characteristics of male and female workers in our CEEDD sample. As described in the bottom row, approximately 40 million male workers and 22 million female workers are in the sample. On average over the 15-year period, we have approximately 9 years of earnings data for each worker. Among other things, this fraction of 9/15 reflects the workers with earnings less than $18,000 who are removed from our sample because of job changes or entry into the workforce or retirement partway through the year.
Mean earnings on the main job for a worker who earns more than our minimum threshold are $66,056 for men and $48,032 for women, suggesting a 27% earnings gap. The samples of male and female workers both have a mean age of 40, with nearly 70% of workers in their 30s and 40s. The provincial distribution of men and women are also similar with approximately 24% in Québec, 40% in Ontario, and 11% in British Columbia. Across marital status, the distribution patterns are generally similar between men and women. The largest differences are found among married workers (by 3.9 percentage points) and divorced workers (by 2.7 percentage points). By family status, a greater portion of women have dependent children than do men (by 5.3 percentage points). Women tend to be employed at larger firms (308 employees compared to 199 for men) and tend to work at firms with a higher share of women (60% compared to 30% for men) and immigrants (19% compared to 16% for men) in their workforce.
The AKM model is estimated separately for men and women. Worker and firm fixed effects in this model are identified only in the connected set (Abowd et al. 2002), that is, the set of firms connected by mobility of workers across firms. Still referring to Table 2, columns (3) and (4) summarize the characteristics of men and women in the respective connected sets. For men, the connected set includes 97% of all person-year observations, 84% of workers, and 84% of firms; for women, the connected set includes 96% of all person-year observations, 81% of workers, and 85% of firms. The exclusions correspond to firms wherein no employees worked at other firms in the connected set at some point between 2001 and 2015.
To compare firm effects between men and women, we turn to the dual-connected set, that is, the set of firms that are in both of the above connected sets. Firms with all female or all male workforces are dropped. Table 2, columns (5) and (6), summarize the workers’ characteristics in the dual-connected set. The restriction to have at least one connected female worker has a more pronounced impact on firms in the connected set of male workers, eliminating 29% (column (5)) compared with 16% of the connected set of female workers (column (6)).
Firms and the Sorting and Pay-Setting Effects
In this section, we first discuss briefly the coefficient estimates obtained from our linear model with worker and firm fixed effects—including a variance decomposition of earnings—and explain how firm fixed effects are normalized. We then turn to the decomposition results for which we show the extent to which firm effects contribute to the gender earnings gap, and the role sorting and firm-specific pay-setting policies play in explaining this earnings gap.
Coefficient Estimates: AKM Model
The coefficient estimates from Equation (1) are shown in Table 3. Results from our main model appear in column (1) for male workers and column (2) for female workers. Note that our main model incorporates both worker and firm fixed effects, which are invariant over time. This modeling strategy allows us to implicitly account for all fixed-over-time characteristics, such as education for a given worker or managerial quality within a firm. Moreover, our earnings models are estimated separately for male and female workers. Finally, worker characteristics, including age, marital status, presence of children, and province of residence, and year fixed effects are included in all regressions. To the extent that selection into marriage (or common-law union) and parenthood is determined by time-invariant unobserved characteristics, it is accounted for by individual fixed effects. Hence, the estimated coefficients for marital status and presence of children, as well as the firm fixed effects, capture earnings differentials that control for fixed differences across individuals.
Summary of AKM Estimation Results
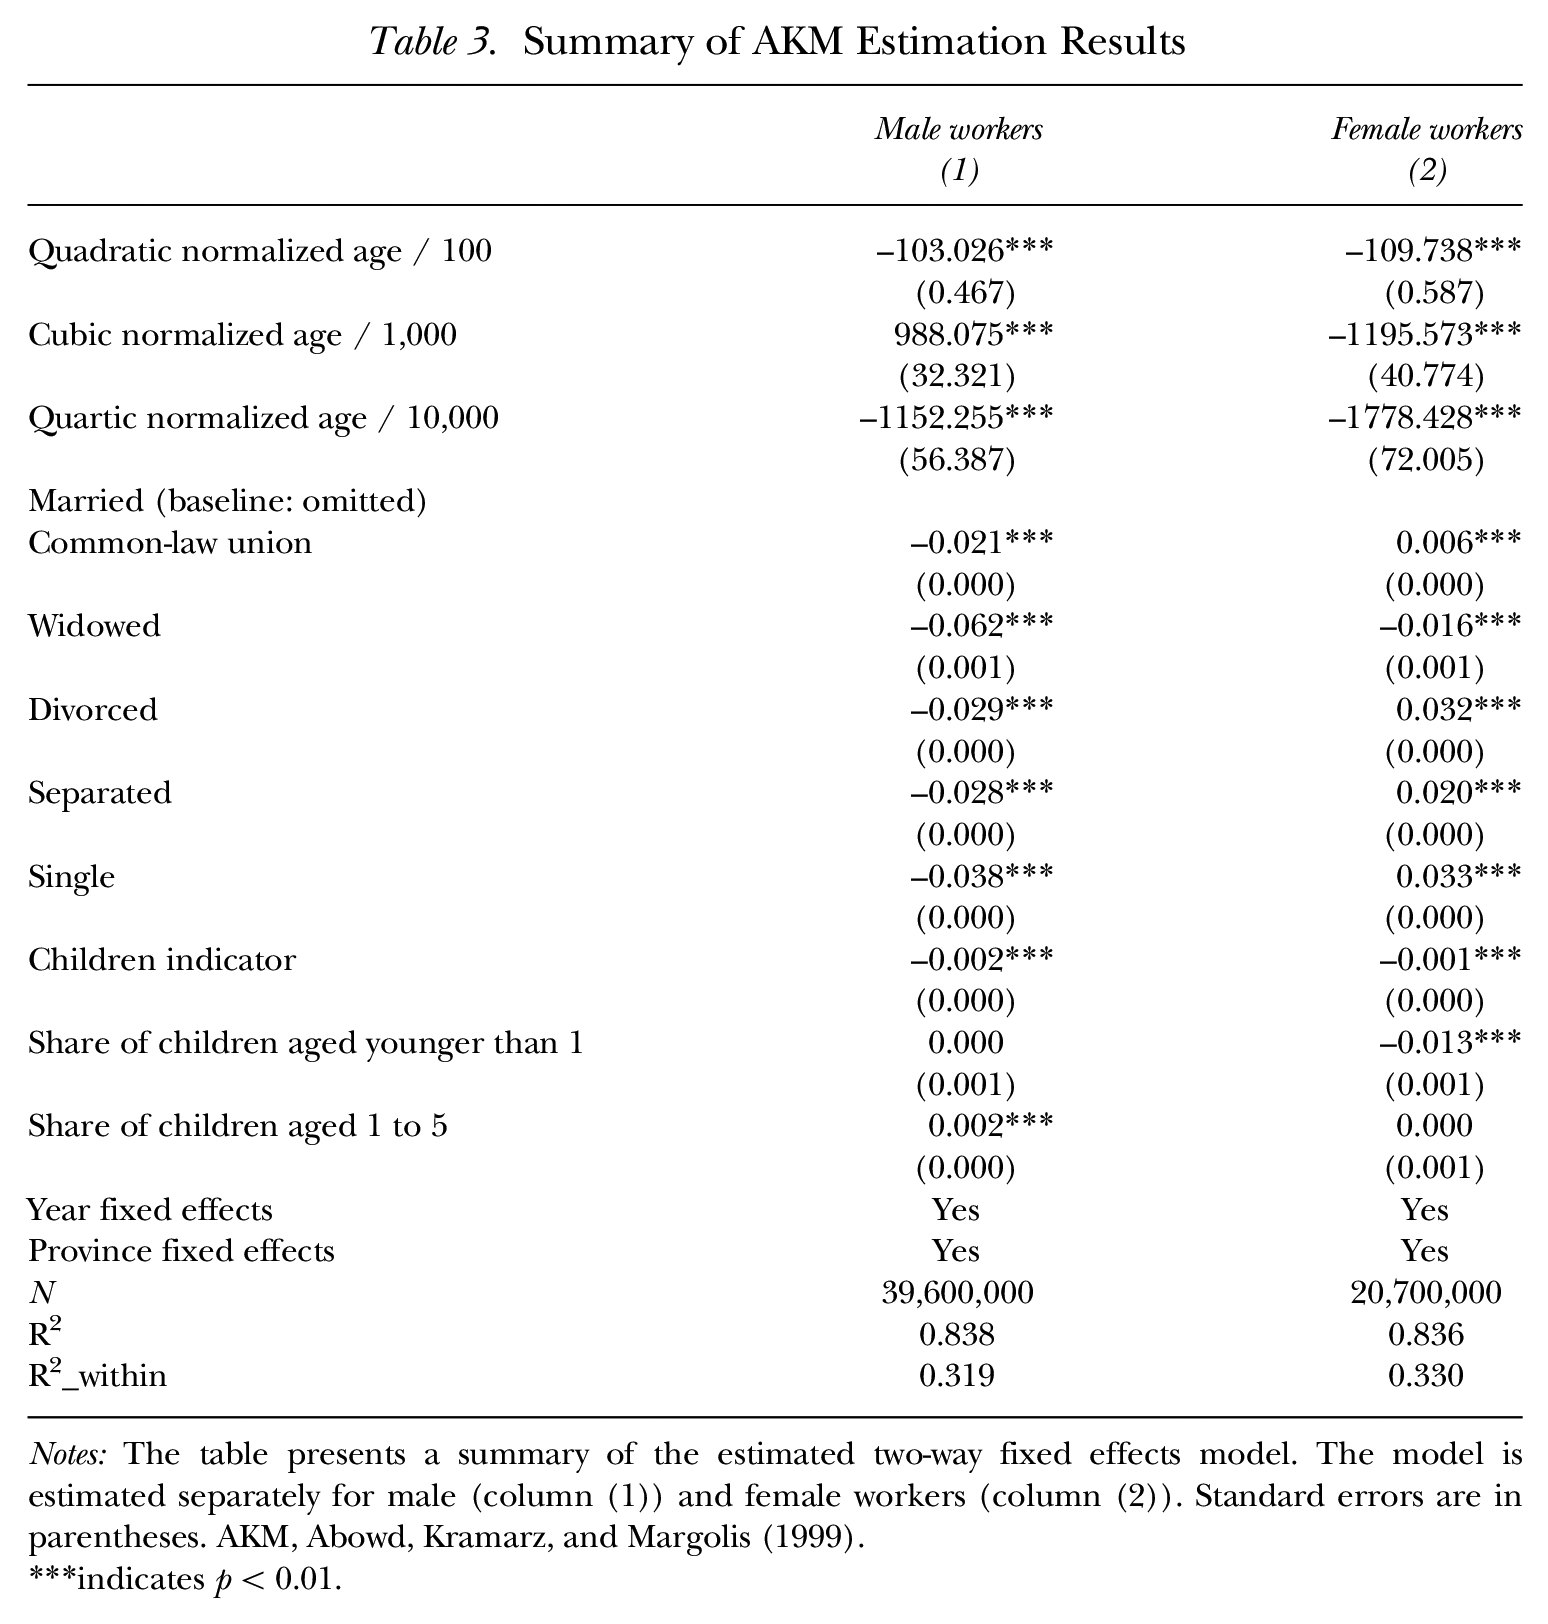
Notes: The table presents a summary of the estimated two-way fixed effects model. The model is estimated separately for male (column (1)) and female workers (column (2)). Standard errors are in parentheses. AKM, Abowd, Kramarz, and Margolis (1999).
indicates p < 0.01.
In that context, coefficient estimates show gender differences in the impact of many observable characteristics on earnings. For example, for male workers, all marital statuses other than married are associated with lower earnings, with the biggest differences being for widowed (–6.2%) and single (–3.8%) men. On average, divorced or separated men earn less than married men by 2.9% and 2.8%, respectively. For female workers, nearly all marital statuses other than married are associated with higher earnings, with the biggest difference observed among single women, who earn 3.3% more than married women. Interestingly, a small earnings difference occurs between divorced and separated women, the former earning 3.2% more than married women and the latter earning just 2.0% more. One exception is widowed women who earn less than married women (–1.6%). Because earnings are the dependent variable we use (effectively the product of hourly wages and hours of work per year), it is not possible to ascertain whether those differences are the result of differing wages or work intensities.
Having children also has dissimilar impacts based on gender, but those effects are very small. We observe a small earnings penalty for both male and female workers. For male workers, the penalty is minimal (–0.2%). For female workers, the penalty is larger (–1.4%) when children are younger than 1 year and becomes marginally negative as children grow older.
AKM Model: Analysis of Variance
Table 4 presents some summary statistics from the previous regression. To better understand the role of firms in determining earnings, Table 4 also includes results from decomposing the variance of earnings. The most important contributor to total variance is person effects, explaining 58.1% of the variance of earnings for male workers and 68.5% for female workers. This lower contribution of person effects for male workers is compensated by a higher contribution of the variance of predicted earnings based on observable characteristics (
Summary of the Estimated Two-Way Fixed Effects Model for Male and Female Workers
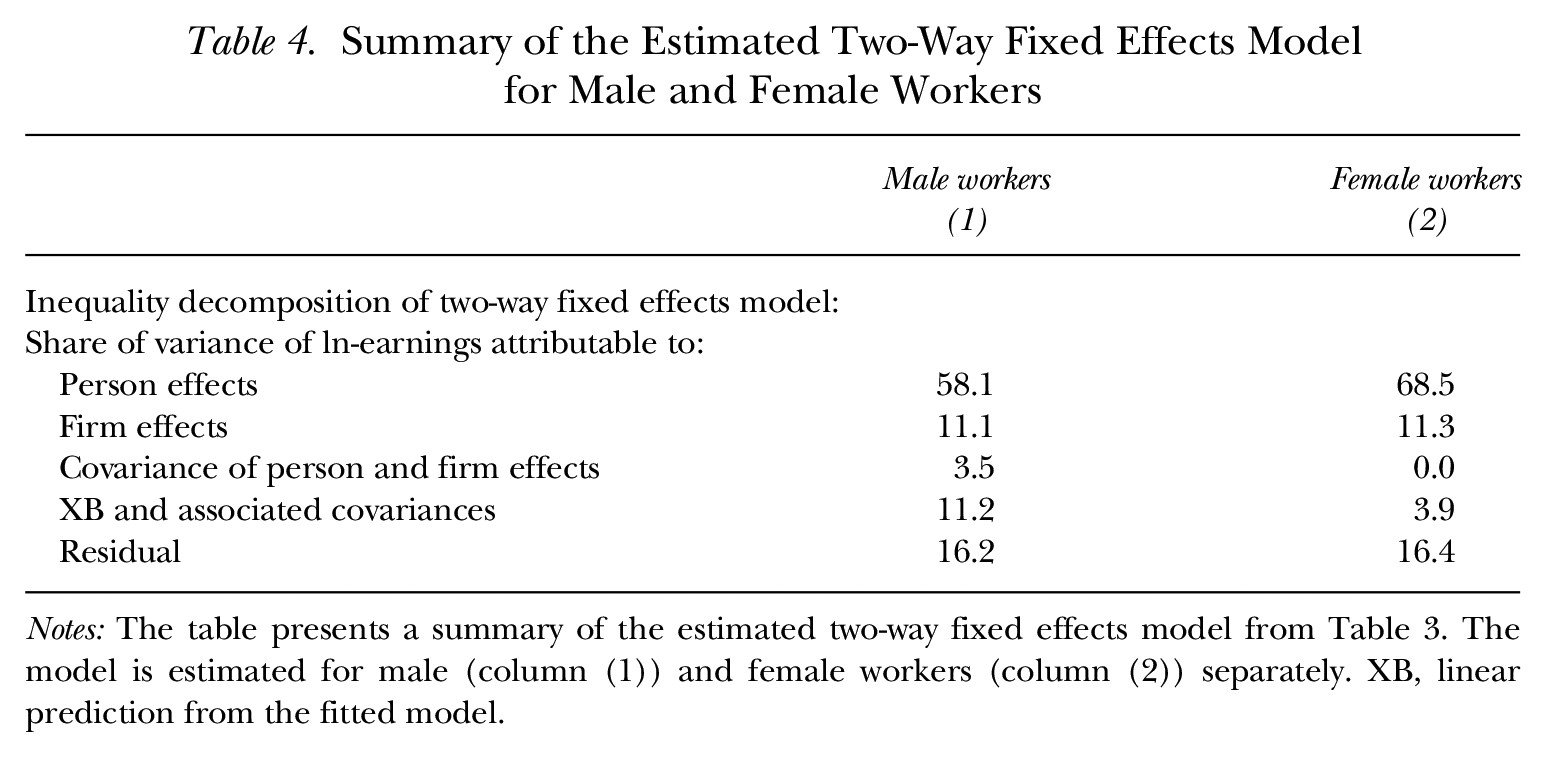
Notes: The table presents a summary of the estimated two-way fixed effects model from Table 3. The model is estimated for male (column (1)) and female workers (column (2)) separately. XB, linear prediction from the fitted model.
Firm fixed effects explain a residual of 11.1% and 11.3% for male and female workers, respectively. Note that the covariance between person and firm effects is positive (3.5%) for male workers and zero for female workers. 21 This positive covariance for male workers is indicative of some amount of positive assortative matching, a phenomenon by which high-wage male workers are more likely to be employed in high-earnings firms, meaning those with above-average earnings for unobserved reasons compared with their peers. The results show no evidence of positive assortative matching for female workers. This, in turn, suggests that differential sorting between genders is likely to explain part of the gender earnings gap.
Normalizing the Firm Fixed Effects: Hockey Stick Regression Results
Because firm fixed effects are obtained from separate regressions for male and female workers, they need to be normalized to ensure meaningful comparisons between genders. Figure 3 plots firm fixed effects against real value added per worker in logarithms for male and female workers. The plot is relatively flat followed by an upswing—known in Canada as a hockey stick figure. Our strategy relies on identifying the inflection point in Figure 3 by estimating Equations (3) for men and (4) for women. We then normalize the firm fixed effects according to their average value for low value-added firms in the flat portion of the curve, following Card et al. (2016).
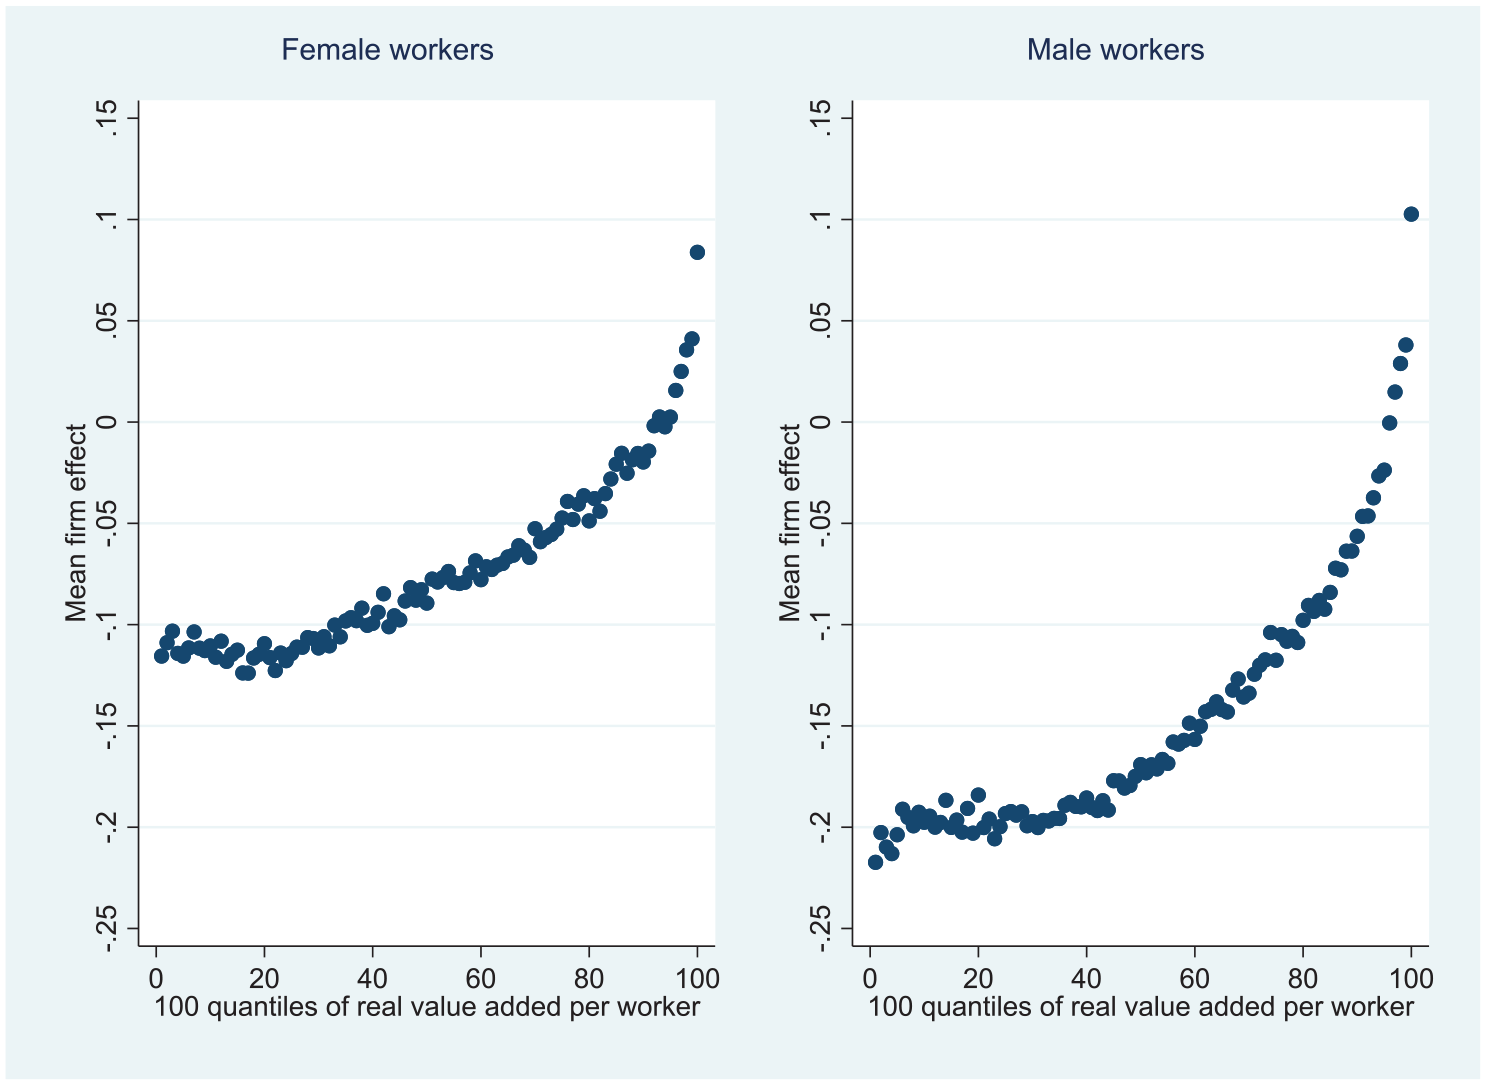
Firm Effects and Labor Productivity, 2001–2015
This normalization is equivalent to assuming that firms from the flat part of the curve, or firms with low value added, pay zero premium, to both men and women. If we were to assume those firms actually paid a small wage premium, this would make the firm contribution to the gender gap rise accordingly. Hence, our normalization provides a conservative estimate of the pay-setting effect in the overall gender earnings gap.
Table 5 shows the results from estimating Equations (3) and (4) separately for male and female workers. The identified inflection point is similar for male and female workers. The slope of the curve after the inflection point is higher for men than for women (0.138 compared to 0.108), indicating that male workers are able to capture a higher share of the surplus in high value-added firms. This in turn suggests that the impact of firm-specific pay policies will differ between genders. In our decomposition results below, we compute the exact contribution these policies make to the gender earnings gap.
Regression of Estimated Firm Effects on Mean Logged Value Added per Worker
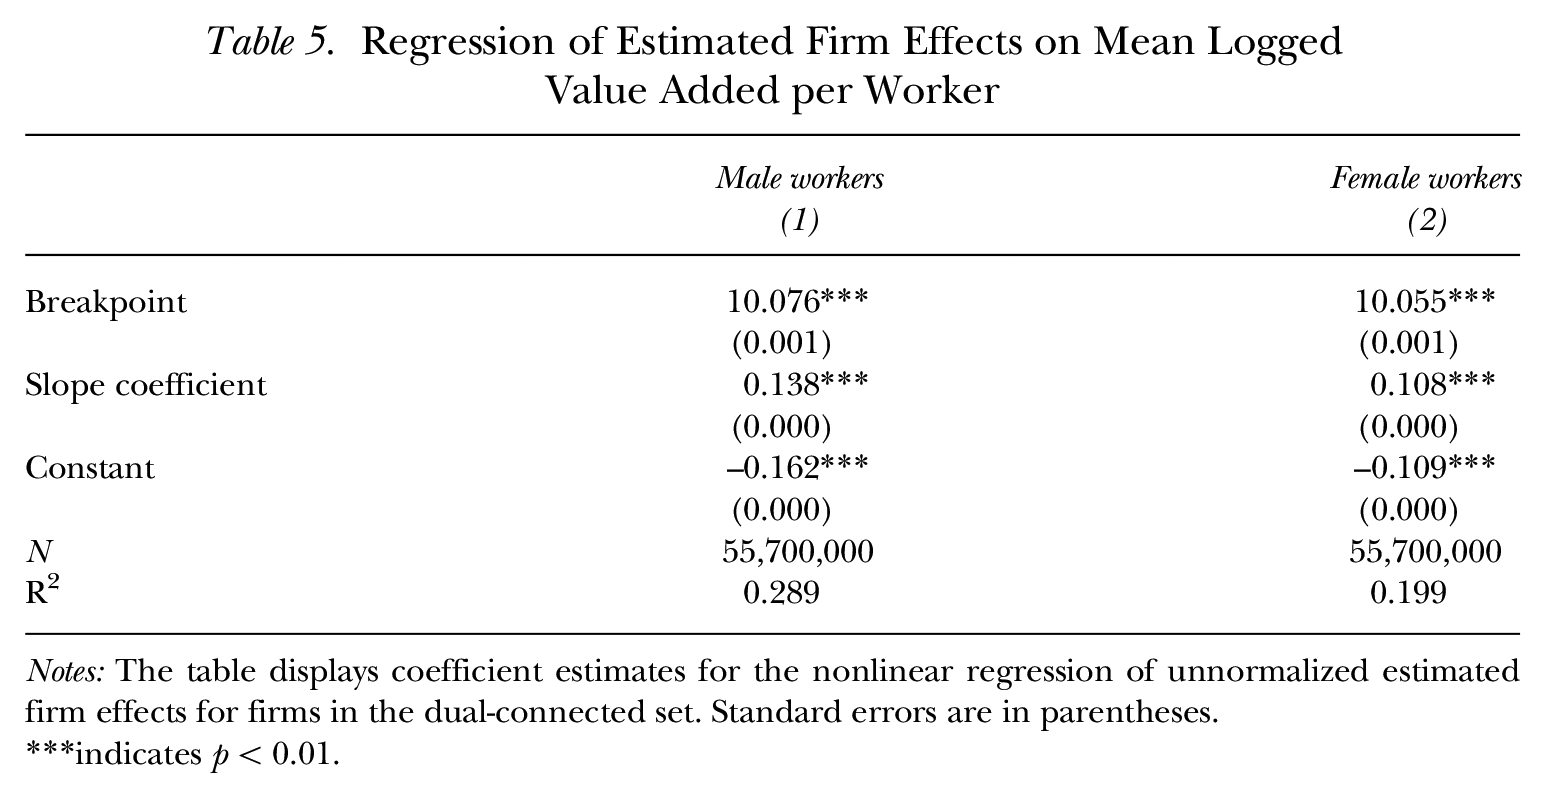
Notes: The table displays coefficient estimates for the nonlinear regression of unnormalized estimated firm effects for firms in the dual-connected set. Standard errors are in parentheses.
indicates p < 0.01.
Decomposition Results: Contribution of Firm Premiums, Role of Sorting and Pay-Setting Effects
Table 6 presents our main decomposition results. Different rows refer to various subgroups for which the decomposition is computed, defined based on age group, marital status, presence of children, and province of residence. Column (1) shows the gender earnings gap, columns (2) and (3) show the average firm effects for male and female workers, and column (4) shows the total contribution of firm premiums to the gender earnings gap—the difference between columns (2) and (3).
Contribution of Firm-Specific Pay Premiums to the Gender Earnings Gap at Dual-Connected Firms
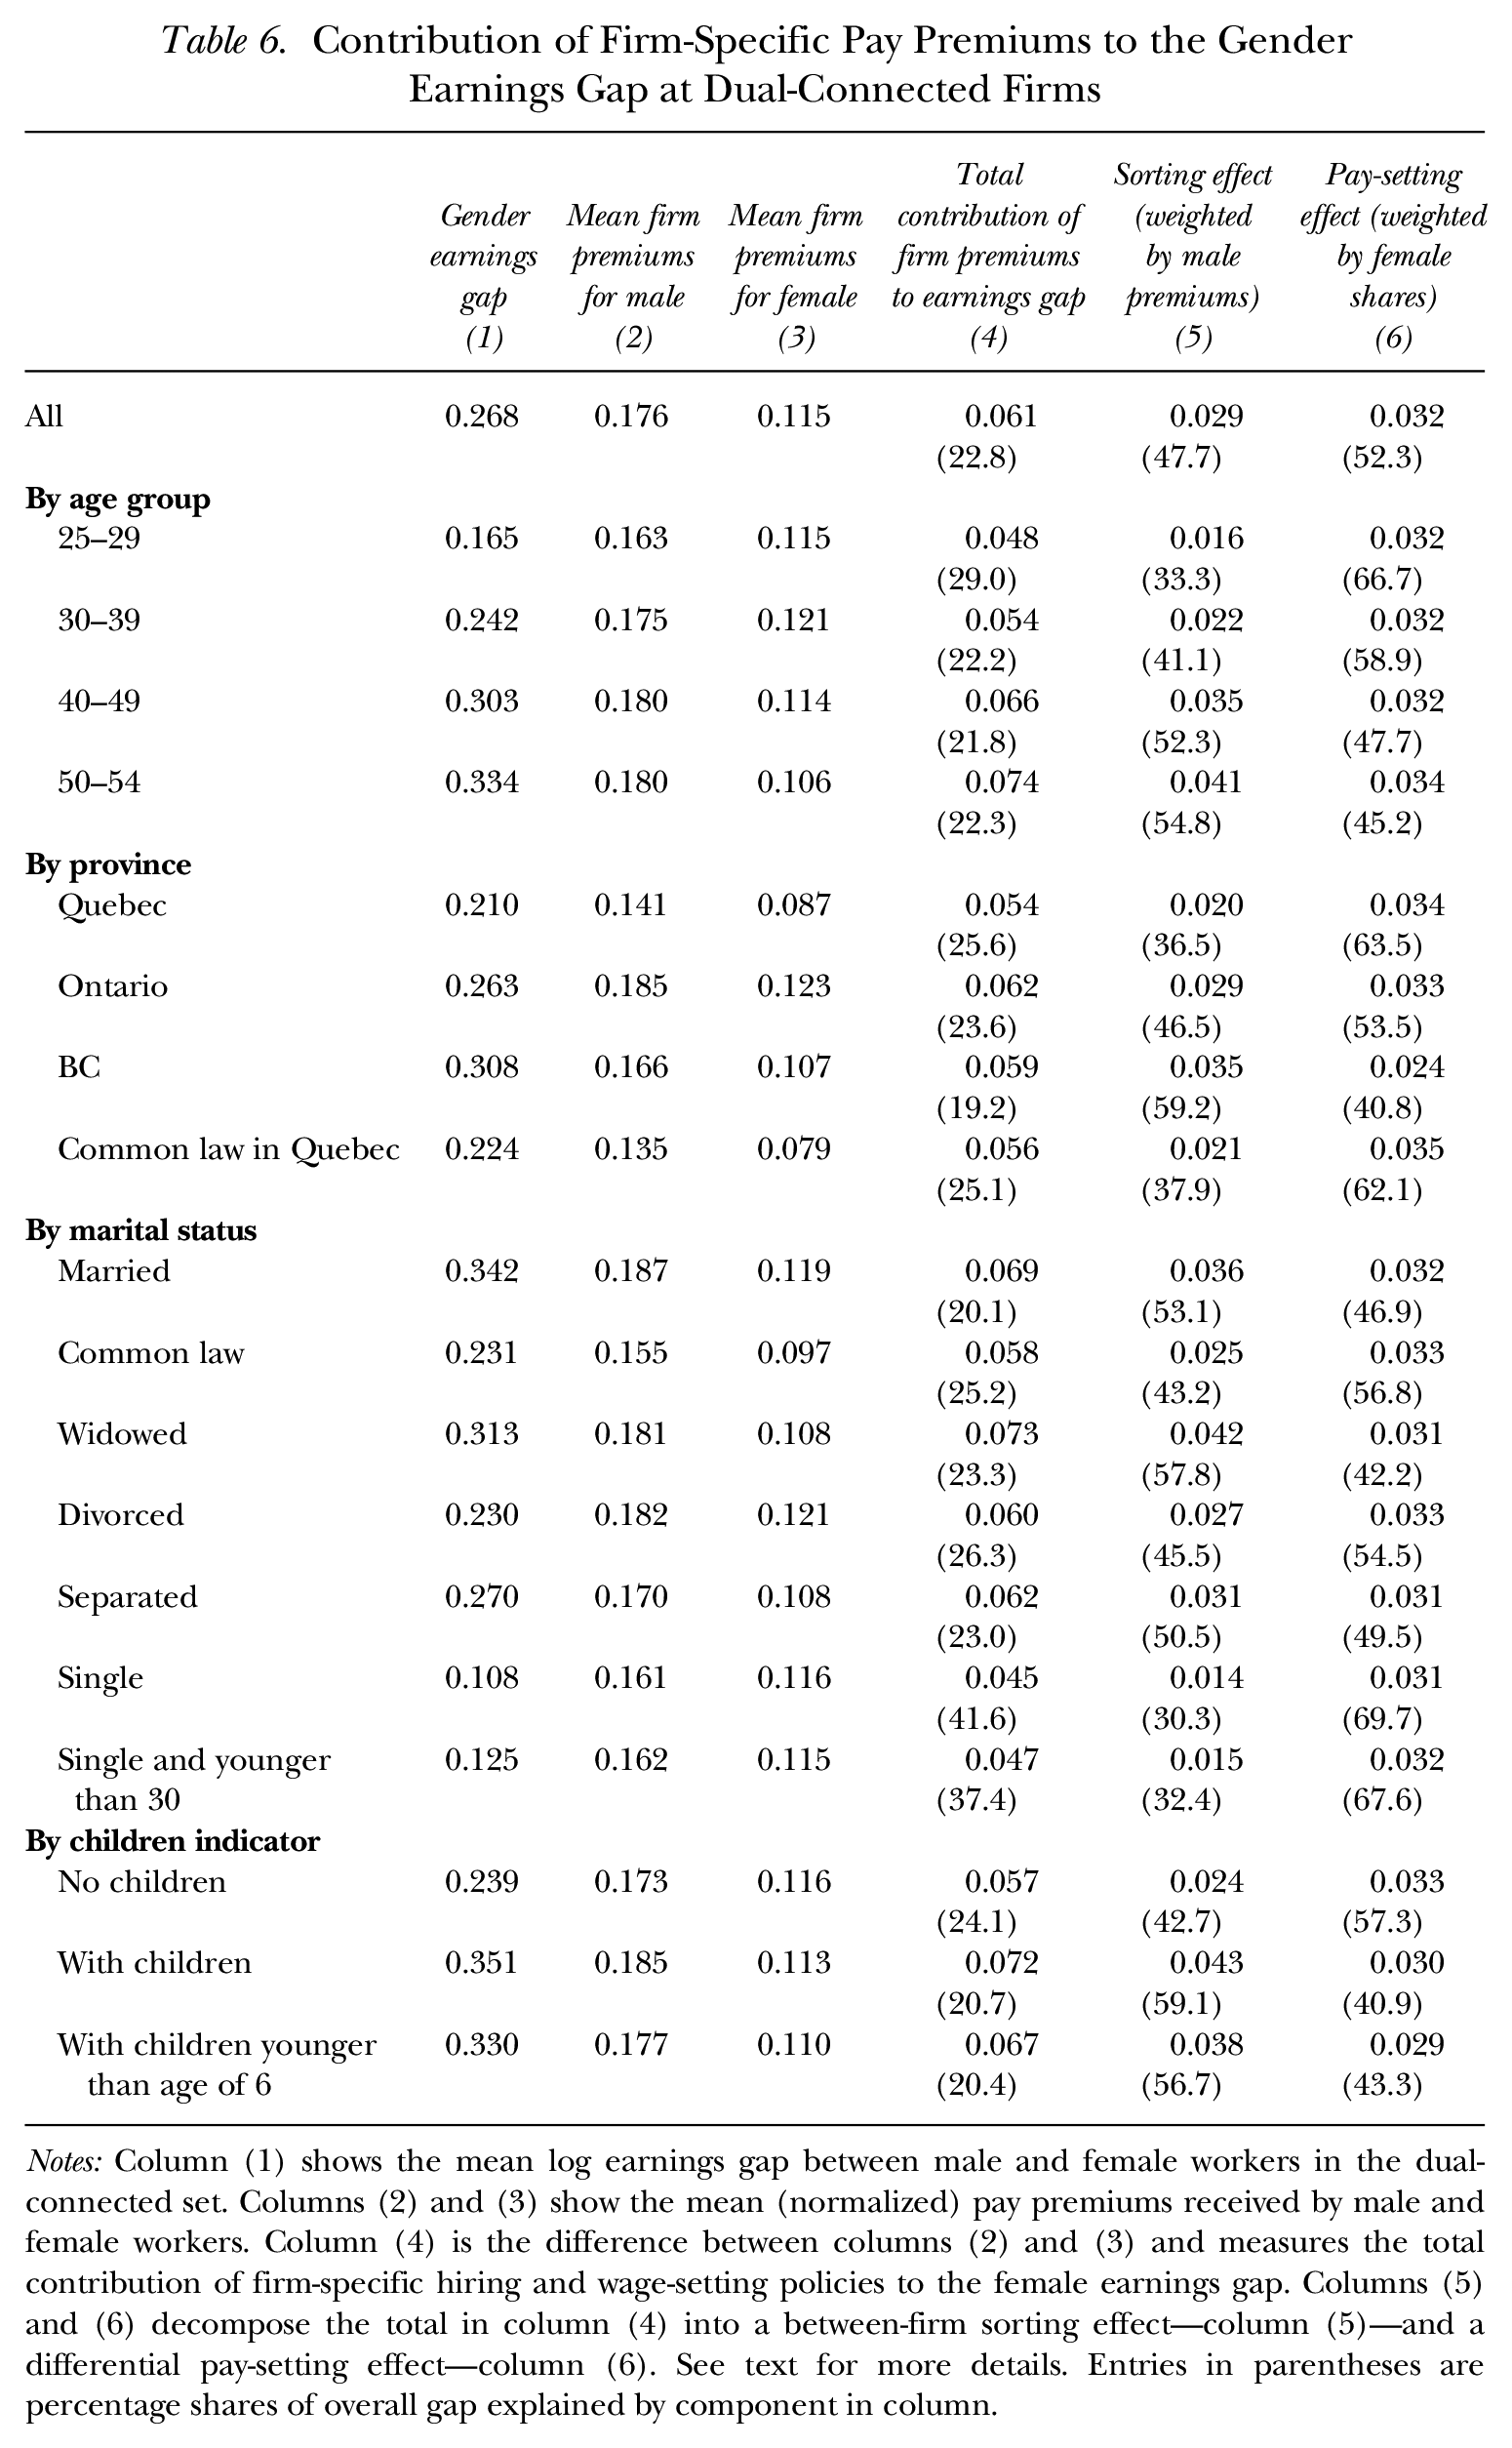
Notes: Column (1) shows the mean log earnings gap between male and female workers in the dual-connected set. Columns (2) and (3) show the mean (normalized) pay premiums received by male and female workers. Column (4) is the difference between columns (2) and (3) and measures the total contribution of firm-specific hiring and wage-setting policies to the female earnings gap. Columns (5) and (6) decompose the total in column (4) into a between-firm sorting effect—column (5)—and a differential pay-setting effect—column (6). See text for more details. Entries in parentheses are percentage shares of overall gap explained by component in column.
The first row shows an average earnings gap of 26.8% between male and female workers (column (1)). With regard to the overall contribution of firm effects to the gender earnings gap, our results demonstrate that 22.8% is attributable to the share of earnings specific to the firm (column (4)). This estimate is in the ballpark of previously published estimates from a handful of countries for which wage data are available, which supports the notion that our sample selection criteria are effective in addressing the fact that our data record earnings only. As mentioned in the literature review section, comparable estimates range from 8% in France (Coudin et al. 2018) to nearly 60% in Brazil (Morchio and Moser 2019). Our estimates for Canada are closest to those for Portugal (Card et al. 2016) and for West Germany in the early 2000s (Bruns 2019), at 20.9% and 25.9%, respectively.
Columns (5) and (6) in Table 6 decompose column (4) into sorting and pay-setting effects. As is the case for most decomposition methods, the results can be sensitive to the choice of reference group, either male or female workers. We compute the decomposition using both reference groups and obtain very similar results. For demonstration purposes, we show only one set of results here. On average, the sorting and pay-setting effects explain respectively 47.7% and 52.3% of the firm contribution to the gender earnings gap. The effect of pay-setting is larger than what has been found in other countries. As discussed earlier in the article, research on the mechanisms underlying the relative importance of sorting versus pay-setting channels remains in its early stages. In studies for which the pay-setting channel was found to play a particularly limited role, authors have evoked minimum wage and centralized wage bargaining institutions to explain the observed pattern. Following this strand of literature, our results may partly stem from Canada’s largely decentralized collective bargaining system (e.g., Card, Lemieux, and Riddell 2003; Drolet and Mumford 2012).
Note that we cannot eliminate the possibility that our estimates are in part driven by the use of earnings rather than wages. As such, our estimate of the pay-setting effect might reflect both differences in wages and intensities of work between genders. However, we do not believe this is the main factor driving our results. First, other studies using earnings obtained lower estimates of the pay-setting effect (Casarico and Lattanzio 2019; Morchio and Moser 2019). Second, Gallen, Lesner, and Vejlin (2019) decomposed both the wage gap and the hours gap using data for Denmark and found that sorting contributes respectively 11% and 13% of the overall gap; if anything, sorting is slightly stronger for hours worked than for wages.
Differences by Age and Marital Status
Next, we turn to life-cycle patterns—variation by age group and presence of children—and to differences by marital status. These are the subgroup decompositions shown in Table 6.
Life-Cycle Patterns
The growth of the gender pay gap over the life cycle is well documented (e.g., Goldin 2014). As expected, we find that the earnings gap in our sample increases with age, from 16.5% among individuals aged 25 to 29, to 33.4% among those aged 50 to 54. Conversely, the firm’s contribution to the gap drops from almost 30% between 25 and 29, to some 20% after age 30; that is, other mechanisms become relatively more important over time.
As workers age, the sorting effect explains a growing proportion of the total contribution of firm premiums to the gender earnings gap, and the pay-setting effect a correspondingly declining one. In absolute terms, the sorting effect increases with age whereas the pay-setting effect remains almost flat, approximately 3.2 percentage points. As such, the odds for women to obtain a higher share of firm surplus do not improve as they age. Bruns (2019) and Card et al. (2016) presented similar findings.
The growing importance of sorting over the life cycle has been linked to the birth of children. Coudin et al. (2018) found that growth in the gender wage gap accelerates approximately five years after the birth of the first child, coinciding with the beginning of a new phase, wherein female firm premiums start decreasing and the sorting channel shows a large and persistent increase. Similarly, Bruns (2019) documented a decline in female firm premiums over the six to seven years following childbirth, driven by women who change jobs.
Our results contribute to the small but growing evidence on the changing role of firms after childbirth. We find that the gender earnings gap is larger among workers with children, 35.1% compared with 23.9% among workers without children. It is also substantially more attributable to the sorting channel: 59.1% of the contribution of firm premiums to the gender earnings gap among workers with children operates through sorting, compared with only 42.7% among workers without children. To some extent, our evidence also suggests that the gender earnings gap and the importance of sorting are increasing with the age of children. Indeed, both values are smaller for parents with children younger than 6 years. This finding is consistent with Coudin et al. (2018) and Bruns (2019), who found that the increase in sorting unfolds and persists over several years.
These findings suggest that firms might be key to understanding gender differences in the impact of having children on workers. Indeed, a large literature shows that child penalties contribute significantly to labor market inequality between women and men (e.g., Angelov et al. 2016; Kleven, Landais, and Søgaard 2019). Recent work has also considered whether physiological changes stemming from pregnancy, delivery, and childbirth may explain part of the long-run motherhood penalty and found no evidence to that effect (Andresen and Nix 2019; Kleven, Landais, and Søgaard 2021). In this context, we find that the gender earnings gap is 11.2 percentage points higher among parents than non-parents, 1.9 points of which is attributable to differential sorting into higher-paying firms. A number of authors have found that women are more likely to trade off pay for other job features, such as flexible work arrangements and shorter commutes (e.g., Goldin 2014; Coudin et al. 2018; Le Barbanchon et al. 2020). Our results highlight the importance of pursuing this line of research going forward.
Differences by Marital Status
Substantial variation occurs in the gender earnings gap by marital status. The gap among common-law workers is only two-thirds the size of the gap among married workers (23.1% compared to 34.2%), and it is lowest among single workers (10.8%). This finding is consistent with widespread evidence that men enjoy a considerable marital pay premium that is not shared by women (for a review, see Juhn and McCue 2017).
One of our main results is that the role of firms also differs substantially by marital status, something that has not been found before in this literature because of the lack of suitable data. 22 Our results show that the total contribution of firm premiums to the gender earnings gap is lowest for married workers (20.1%) and highest for single workers (41.6%). Hence, while the earnings gap among married workers is more than three times the gap among single workers, the total contribution of firm premiums to the gap is only one and a half times greater; that is, most of the difference in the pay gap is driven by non-firm-related factors. Furthermore, we find evidence that the disparity does not solely arise from life-cycle patterns. As we restrict the sample of single workers to those younger than 30, the role of firms drops to 37.4%. This result implies that the larger contribution of firms to the singles’ pay gap is driven in part by older single individuals.
Furthermore, the relative importance of the sorting and pay-setting channels varies considerably by marital status. For example, the share explained by sorting is 53.1% for married workers, 9.9 percentage points higher than the share for workers in common-law relationships, and 22.8 percentage points higher than for single workers.
These differences are again driven almost entirely by disparities in the sorting effect. It accounts for 1.4 to 4.2 percentage points of the gender earnings gap, compared with 3.1 to 3.3 percentage points for the pay-setting effect. Some of the differences between married and single workers may stem partly from life-cycle differences, because of the overlap between marital and parental status. The size of the sorting effect, however, also differs markedly between married and common-law workers: It is 1.1 percentage points higher among the former, half as much as the difference between married and single workers. In Canada, common-law couples are only 8.8 percentage points less likely than married couples to have children (44.2% compared to 53.0%). 23 Hence, the difference in the role of sorting among married and common-law couples is unlikely to stem solely from the presence of children. This outcome suggests that the role firms play in determining the gender earnings gap may be correlated with decisions surrounding marital formation and dissolution, beyond mechanisms associated with the presence of children.
A well-established literature shows that decisions surrounding labor market participation and household formation (and dissolution) are tightly linked. For instance, scholars have shown that policies and shocks that impact people’s employment have repercussions in the marriage market (e.g., Baker, Hanna, and Kantarevic 2004; Michelmore 2018; Schulz and Siuda 2020). Conversely, non-labor factors that affect intra-household bargaining power also carry over to individual spouses’ labor supply decisions (e.g., Chiappori et al. 2002; Stevenson 2007; Voena 2015; Goussé and Leturcq 2018). Our findings are in line with this work. Specifically, theoretical modeling and empirical evidence suggest that common-law spouses may have less incentive to specialize, since the union is easier to break off and spouses have less legal responsibilities toward each other than do married individuals (for a review, see Goussé and Leturcq 2018). In this context, we find a positive correlation between the level of commitment within a relationship and the size of the sorting effect.
Finally, just as the sorting effect increases from single, to common-law, to married individuals, it decreases again from married (3.6 percentage points), to separated (3.1 percentage points), to divorced individuals (2.7 percentage points). This additional and new evidence indicates that people’s relationship with the labor market is closely connected to their household dynamics.
Conclusion
It is well established that the gender earnings gap has reached a plateau in high-income countries, with little progress to speak of over the past three decades. Furthermore, research has unambiguously shown that breaking through this plateau will require a better understanding of the role firms play in the remaining gap. To this avail, a large and growing literature has studied differences in the types of firms at which female and male workers are employed, as well as gender disparities in the ability and willingness of workers to access the full range of positions within firms. In line with this, Card et al. (2016), and others after them, have provided evidence suggesting that the former of the two channels plays a larger part in explaining firms’ contribution to the gender earnings gap. However, much remains to be learned about the forces that underpin this observation.
In this article, we apply the methodology of Card et al. (2016) to the Canadian context. Using a large employer-employee matched data set, our sample covers all prime-age, full-time workers in the business sector between 2001 and 2015. We make two contributions to the literature on the relative importance of the sorting and pay-setting channels through which firms contribute to the gender earnings gap.
First, we show that if female workers benefited from the same firm premiums as male workers, the gender earnings gap in Canada would fall by 22.8%. This finding is in the mid-range of what has been estimated for countries in Europe and South America, and it constitutes the first estimate available for North America and for the Commonwealth more generally. Although the importance of the sorting effect in the overall gender earnings gap has been investigated in the United States (Sorkin 2017) and the United Kingdom (Jewell et al. 2020), their data do not allow for the decomposition of firm contributions into sorting and pay-setting effects. In the Canadian context, we find that the two channels account for near-eq8 shares of the firm contribution to the gender earnings gap. This outcome contrasts with previous evidence, which has overwhelmingly found that pay-setting accounts for no more than 30% of the firm effect.
Second, we contribute to the literature that has used comparisons across subgroups to learn about the forces that may explain the relative importance of sorting and pay-setting. Specifically, our data allow us to reproduce results separately by workers’ marital status. We find that sorting is most important for married workers but muted among single workers.
Furthermore, we find substantial differences between married workers and those in common-law unions, both in terms of the contribution of firms to the gender earnings gap and the role of sorting. We interpret this as evidence that life-cycle patterns alone cannot explain the substantial variation we observe in the role of firms across workers who differ in marital status. This interpretation is consistent with the large literature following the work of Chiappori (1988, 1992), which shows how intra-household dynamics impact workers’ labor market outcomes. Our results suggest that bridging these two strands of literature might prove fruitful in furthering our understanding on how firms affect the gender earnings gap.
Future work could examine whether institutional differences across provinces, such as parental leave policies and access to childcare, explain differences in the importance of sorting. As has been argued by Olivetti and Petrongolo (2017), understanding cross-country comparisons of the gender earnings gap requires assessing the overall portfolio of labor market and family policies that characterize individual countries. On the one hand, this would contribute to the growing literature that documents the various ways in which these policies have an impact on parents’ and children’s outcomes. On the other hand, it would inform an alternative channel through which government can improve pay equity.
Supplemental Material
sj-pdf-1-ilr-10.1177_00197939221093562 – Supplemental material for Firm Pay Policies and the Gender Earnings Gap: The Mediating Role of Marital and Family Status
Supplemental material, sj-pdf-1-ilr-10.1177_00197939221093562 for Firm Pay Policies and the Gender Earnings Gap: The Mediating Role of Marital and Family Status by Jiang Li, Benoit Dostie and Gaëlle Simard-Duplain in ILR Review
Footnotes
Acknowledgements
We are grateful to Wendy Cukier, Marie Drolet, René Morrissette, and Nicole Yaansah for their helpful comments and suggestions. We also thank the reviewers from Women and Gender Equality Canada for their comments. Jiang Li acknowledges funding from Women and Gender Equality. Benoit Dostie and Gaëlle Simard-Duplain acknowledge funding from the Productivity Partnership as supported by the Social Sciences and Humanities Research Council of Canada (SSHRC). We are grateful for the comments by meeting participants at the SouthWestern Ontario Research Data Centre (SWORDC) Data Talk, and the Canadian Economics Association Annual Conference 2021.
The views expressed herein are those of the authors and do not necessarily reflect the views of Statistics Canada. Some results in this article also appear in Li, Dostie, and Simard-Duplain (2020).
1
2
Similar to what has been observed in several other high-income countries, progress in the relative earnings (wages) of Canadian women has plateaued since the early 1990s (early 2000s) (Baker, Benjamin, Desaulniers, and Grant 1995; Baker and Drolet 2010; Pelletier, Patterson, and Moyser 2019). Canada has also witnessed a shift in the factors underlying the remaining gap, whereby sorting into higher-paying firms and sectors has supplanted education and experience (Drolet 2002; Drolet and Mumford 2012; Morissette, Picot, and Lu 2013; Javdani 2015; Pelletier, Patterson, and Moyser 2019).
3
![]() referred to this component as the “bargaining channel that arises if women obtain a smaller share of the surplus associated with their job” (p. 634). While this smaller share could result from gender differences in workers’ ability or willingness to participate in salary negotiations, it could also arise through differences in labor supply elasticities between groups in a static model of monopsonistic wage setting. We therefore prefer to use a more neutral terminology.
referred to this component as the “bargaining channel that arises if women obtain a smaller share of the surplus associated with their job” (p. 634). While this smaller share could result from gender differences in workers’ ability or willingness to participate in salary negotiations, it could also arise through differences in labor supply elasticities between groups in a static model of monopsonistic wage setting. We therefore prefer to use a more neutral terminology.
4
Recent examples of studies on gender segregation across firms include Jewell et al. (2020) and Sin, Stillman, and Fabling (2017). For gender disparities between firms, see Bertrand, Black, Jensen, and Lleras-Muney (2019). About the relative importance of between- and within-firm mechanisms, see ![]() .
.
5
Card et al. (2016) build on Abowd, Kramarz, and Margolis (1999), who showed that employers contribute to wage differentials across workers, beyond what can be explained based on the latter’s observed and unobserved individual-level characteristics (see also Abowd, Creecy, and Kramarz 2002).
6
7
These findings are consistent with research that has documented the pay penalties associated with such things as shorter and/or more flexible work schedules and women’s sorting into these kinds of work arrangements (see Le Barbanchon, Rathelot, and Roulet 2020 for a recent example). These results are also in line with findings from the experimental literature that suggests women have greater preferences for job flexibility than do men (e.g., Wiswall and Zafar 2018). Sorkin (2017) also found differential sorting between genders, leading to lower pay for women, that is almost entirely compensated by desirable non-pay characteristics (see also ![]() ).
).
8
9
The use of earnings rather than wages presents an added challenge to the evaluation of the exogenous mobility assumption. As described later in the article, we keep only one job per year per worker. As a result, firm movers mechanically look like they have lower earnings in the year they change jobs, in which their yearly earnings are spread across two (or more) jobs. In consequence, the typical checks used to evaluate the exogenous mobility assumption are not appropriate, and we rely instead on an alternative test proposed by Card et al. (2016) and used by ![]() .
.
10
Like most decompositions, results depend on the choice of the reference group. Our results, using men and women as the reference group, respectively, are very similar. As such, we present the former in this article.
11
12
To the extent that positive selection occurs in employment, and if the gender gap in labor market participation is sufficiently large, focusing on employed workers may bias the gender pay gap downward (Olivetti and Petrongolo 2008). Earlier studies such as Mulligan and Rubinstein (2008) found an important role for selection, but more recent evidence found that it does not explain much of the gender gap (Blau, Kahn, Boboshko, and Comey 2021).
13
An individual may have multiple sources of income; that is, from employment or self-employment. Employment income sums all Statements of Remuneration Paid, or payrolls, issued by incorporated businesses. Self-employment income sources include business, farming, fishing, rental, commissions, and professional income. We compare the two sources and select only workers whose primary income was from employment. Individuals with zero employment income are excluded, as are those with equal employment and self-employment income. The latter comprises an extremely small proportion of all workers.
14
The CPI is rebased to 2012 from 2002 as industry price deflators—used to deflate value added at the firm level—have a base year of 2012.
15
The monetary threshold of $18,733 is calculated by multiplying the minimum wage of $10.07 converted in 2012 constant dollars (Galarneau and Fecteau 2014) by the average full-time working hours of 38.8 (![]() ) and a total of 48 weeks. This value is equivalent to working full time all year.
) and a total of 48 weeks. This value is equivalent to working full time all year.
16
Value added is the sum of capital costs, labor costs, and profits. Profits are the gross output net of total costs.
17
Statistics Canada. Table 14–10-0064-01, Employee wages by industry, annual.
18
Statistics Canada. Table 14–10-0327-01, Labour force characteristics by sex and detailed age group, annual.
19
Statistics Canada. Table 14–10-0340-01, Employee wages by occupation, annual. Full-time female workers earned less than their male counterparts in 2015 ($26.12 compared to $29.81). Hence, either the types of firms where women work part-time offer relatively better pay than the types of firms where men work part-time (sorting channel), or women are better able than men to access higher pay in part-time jobs (pay-setting channel). We observe neither part-time status nor wages, so our data do not allow us to determine which combination of these scenarios reflects reality. However, this highlights the importance of focusing on full-time-equivalent workers in our decomposition of the gender earnings gap. Indeed, including part-time workers would complicate the interpretation of our results, by further confounding sorting and pay-setting effects related to both wages and hours. The differential sorting of women and men across low- and high-hours firms is an interesting question in its own right, but one beyond the scope of this article.
20
21
This correlation is similar to the one found by Abowd, Lengermann, and McKinney (2003) who reported a correlation of 0.08 for US workers. A recent working paper by ![]() , however, claimed that limited mobility bias tends to overstate the contribution of firm effects to the earnings dispersion. They also showed that using a longer panel and excluding relatively small firms, as we do in this article, help attenuate this bias.
, however, claimed that limited mobility bias tends to overstate the contribution of firm effects to the earnings dispersion. They also showed that using a longer panel and excluding relatively small firms, as we do in this article, help attenuate this bias.
22
![]() looked at the evolution of firm premiums over the life cycle, separately for married and unmarried men and women. They found that male firm premiums increase with age, regardless of marital status, whereas female firm premiums evolve along a flatter life-cycle profile, especially for married women. However, they do not decompose the gender pay gap to determine the contribution of firm premiums to the overall gap, nor do they assess the relative importance of sorting and pay-setting.
looked at the evolution of firm premiums over the life cycle, separately for married and unmarried men and women. They found that male firm premiums increase with age, regardless of marital status, whereas female firm premiums evolve along a flatter life-cycle profile, especially for married women. However, they do not decompose the gender pay gap to determine the contribution of firm premiums to the overall gap, nor do they assess the relative importance of sorting and pay-setting.
23
Statistics Canada, Table 98–402-X2016004, Families, households and marital status highlight tables, 2016 Census.
References
Supplementary Material
Please find the following supplemental material available below.
For Open Access articles published under a Creative Commons License, all supplemental material carries the same license as the article it is associated with.
For non-Open Access articles published, all supplemental material carries a non-exclusive license, and permission requests for re-use of supplemental material or any part of supplemental material shall be sent directly to the copyright owner as specified in the copyright notice associated with the article.