
Abstract
This study intended to explore the influence of informational asymmetry on stock liquidity in India. After controlling for the effects of firm-specific risk and investor sentiment, the results show that informational asymmetry, as measured by the delay factors has a significant positive association with illiquidity, indicating that market liquidity decreases with less transparency and a high level of informational asymmetry. The results also show that investor sentiment has a significant association with illiquidity, whereas firm-specific risk and illiquidity seem to have no noticeable relationship. The empirical results are validated using a dynamic panel-data approach, with two-stage GMM and remain robust. Theoretically, this study extends the existing literature on liquidity by offering new evidence from a prospective market like India. In practical terms, the findings of this study would help the stock exchange regulators and other regulatory bodies to strengthen the process of information dissemination and sensitise market participants and investors by maintaining a smooth flow of information.
Introduction
Financial markets deviate considerably from becoming a perfectly competitive market due to many reasons. One such reason is the presence of information asymmetry (Vayanos & Wang, 2012). The root of information asymmetry lies in the Agency Problem. The separation of interests between the owner and the controllers of the capital of the companies is believed to be the potential reason behind the conflicting interest (Jensen & Meckling, 1976). The controlling shareholders or any market participants having insider information that is yet to be disclosed to the general investors can use it as a competitive benefit in trading. In the opinion of Jensen and Meckling (1976), agency conflicts between managers and investors perhaps arise due to information asymmetry, and such information asymmetry problems reduce both the volume as well as the number of transactions in the stock market (Botosan & Plumlee, 2002), hence reducing liquidity. Consistent with the market microstructure approach, a stock’s liquidity is determined by three factors. First, the cost of processing an order or transaction costs such as clearing and settlement costs, and brokerage (Brock & Kleidon, 1992). Second, the inventory holding cost: When market makers’ inventory levels deviate from their ideal levels, they work to adjust bid and ask prices to go back to their target positions. When inventory levels are extremely high, the bid price must be reduced. When inventory is scarce, however, the ask price must be increased (Amihud & Mendelson, 1980; Ho & Stoll, 1983). Lastly, in the opinion of Bagehot (1971), when market makers think they may face such investors who enjoy superior information about the security’s true value it creates a probability of definite losses for them. They recover through the liquidity premium. Higher information asymmetry, as argued by Aouadi et al. (2017), is costly and lowers stock market activity. In fact, stock illiquidity is primarily caused by asymmetric information (Akerlof, 1970). Since information asymmetry is linked to the company’s stock risk, changes to the latter will prompt market makers to alter their pricing strategies, which will affect stock price performance and thus the stock liquidity (Zhang et al., 2019).
In the last two decades, there has been an increased intensity of research on the association between information asymmetry and stock liquidity. Several theoretical (e.g., Glosten & Milgrom, 1985; Kyle, 1985;) and empirical research (e.g., Cheng, 2007; Li & Wu, 2006) proved that information asymmetry is a plausible factor affecting stock liquidity. However, it is worth noting that the majority of studies in this field have been conducted by taking samples from developed markets; these studies cannot be automatically generalised to emerging economies. Furthermore, prior research has been carried out using either time-varying characteristics or a cross-sectional approach, a very few such investigations are carried out within the panel framework.
Against this backdrop, the present study seeks to examine the nexus between liquidity and information asymmetry in the Indian context. In doing so, the current study adds several novelties to the existing literature. First, this is one of the first studies to investigate the link between information asymmetry and stock liquidity in the Indian stock market. Second, prior research has focused on either time-varying attributes or a cross-sectional approach. By investigating the panel structure, the current study fills in the gap. Last but not the least, this study introduces the dynamic panel-data approach besides the static panel-data analysis within the hypothesis testing framework to alleviate the problem of endogeneity and simultaneity bias.
The remainder of the article is structured in the following way: Section II contains a survey of the available literature on the research issue and the development of the hypothesis. Section III discusses data and methodology. Empirical results are highlighted in Section IV, followed by a discussion including theoretical and practical implications of the study in Section V. Finally, Section VI concludes the study.
Literature Review and Development of Hypothesis
According to the Efficient Market Hypothesis, all available information should be represented in the price of any asset in the capital market (Fama, 1970, 1991). Agency theory given by Fama (1969) and Jensen and Meckling (1976) states that managers are treated as agents of the company owner (principal). In large companies, it becomes difficult for the owner (principal) to monitor the activities of the manager (agent). Agency theory presumes that humans are rational, selfish and opportunist. With these presumptions, the manager is considered to maximise his/her interest rather than the interest of the owners’ or organisation. A conflict of interest may arise between the owner (principal) and manager (agent) as the manager (agent) controls more information about the company’s operations than that of the owner (principal) due to which information asymmetry arises. Amiram et al. (2019) in their study demonstrated a negative relationship between transparency in the stock market and large discontinuous price changes (jump volatility). They also showed that jump volatility had an adverse connection with liquidity even after controlling for information asymmetry. Finally, their study demonstrated that the information environment significantly influences stock liquidity through jump volatility. Agency costs can arise due to conflicts among managers and stakeholders of a firm and information asymmetry is considered to be the genesis of agency conflicts. The agency costs can be defined as the aggregation of the monitoring expenditures of the principal, bonding expenditures by the agent and the residual loss (Jensen & Meckling, 1976). Adverse selection costs and information asymmetry are considered to be the most influential factors behind the liquidity (illiquidity) of a stock (Akerlof, 1970) as in a functionally efficient market, transaction costs are minimal. A rich informational environment in the capital market is predicted to increase both the volume and number of transactions (Botosan & Plumlee, 2002). However, there are other marketplaces where purchasers lack complete knowledge (Leland & Pyle, 1977). Agency theory addresses one of the possible causes of this information asymmetry (Jensen & Meckling, 1976). This theory explains how insiders control information flow by either stopping or postponing it. Asset prices are determined by the amount of risk that a less-informed trader faces in a trade with a privately-informed counterparty (Easley et al., 2002). If the asset price does not reflect its true value, agents may take unfair economic advantage of insider information. Conversely, the others trade for liquidity only using information that is publicly available (Abad & Rubia, 2005). According to Cheng (2007), noisy traders are more likely to withdraw from a transaction in a market with increased information asymmetry due to the market’s unfairness, resulting in a loss of market liquidity. This model was further developed by Glosten and Milgrom (1985) and Kyle (1985) to add liquidity as a component of adverse selection cost. The adverse selection cost and the stock market’s informational asymmetry are closely tied up. To compensate for anticipated losses to privately informed traders, an uninformed market maker will raise the bid-ask spread or limit liquidity (Glosten & Harris, 1988). The importance of the adverse selection cost as a component of liquidity as assessed by the spread has been proven by Brogaard et al. (2016). According to the signalling hypothesis, when the amount of publicly available information amplifies, the source of adverse selection costs depresses, resulting in a decrease in informational asymmetry between informed and uninformed investors (Diamond & Verrecchia, 1991; Healy et al., 1999; Leuz & Verrecchia, 2000).
Several empirical studies support this notion. Welker (1995) and Healy et al. (1999), for example, discovered an adverse association between disclosure policy and illiquidity, implying a negative association amid the information disclosures indicating transparency and information asymmetry, which on the other way indicates a better liquidity position of the stock market. Similarly, increased openness or transparency in the trading process amplifies market liquidity (or minimises illiquidity) by eliminating possibilities for less knowledgeable or professional traders to exploit the system (Pagano & Roell, 1996). Simaan et al. (2003) found that a high level of transparency and information disclosure minimises quoted spread (illiquidity) and increases stock liquidity. In a similar line, a strong and affirmative association persists between stock liquidity and information disclosure following Chen et al. (2007) and Espinosa et al. (2008). Utami et al. (2020) in the context of the Indonesian stock exchange, an emerging economy, conducted a study on 59 manufacturing sector companies and the results reported a significant negative association between information asymmetry and liquidity. Matoussi et al. (2004) in their study observed a positive association between information disclosure and stock liquidity thereby indicating an adverse relationship between information asymmetry and stock liquidity as information asymmetry is highly observed in the context of an opaque market. Interestingly, however, using the Tunisian sample, Gana and Chemli (2008) demonstrated the same as observed by Matoussi et al. (2004). Loukil and Yousfi (2011), on the contrary, documented no significant association between information asymmetry and the liquidity of the stock.
Based on the above facts and figures, we propose:
H1: Liquidity (Illiquidity) of stock is negatively (positively) affected by information asymmetry.
Data and Methodology
Data Description
The ‘Capitaline’ database is the sole source of the data used in the present study. Drawing on purposive sampling, the top 100 non-financial companies traded in the National Stock Exchanges of India (NSE) have been taken as a sample to conduct the study. In line with the prior studies, banks and other financial service-providing companies are excluded from the initial sample due to their different financial characteristics and modus-operandi. The study covers a time frame from 2011 to 2020, that is, 10 years, and is carried out on uniformly arranged panel data as per financial years. Three companies have been excluded during the filtration process owing to their different accounting years; the rest 97 companies have been retained and considered as an ultimate sample for the analysis.
Research Variables
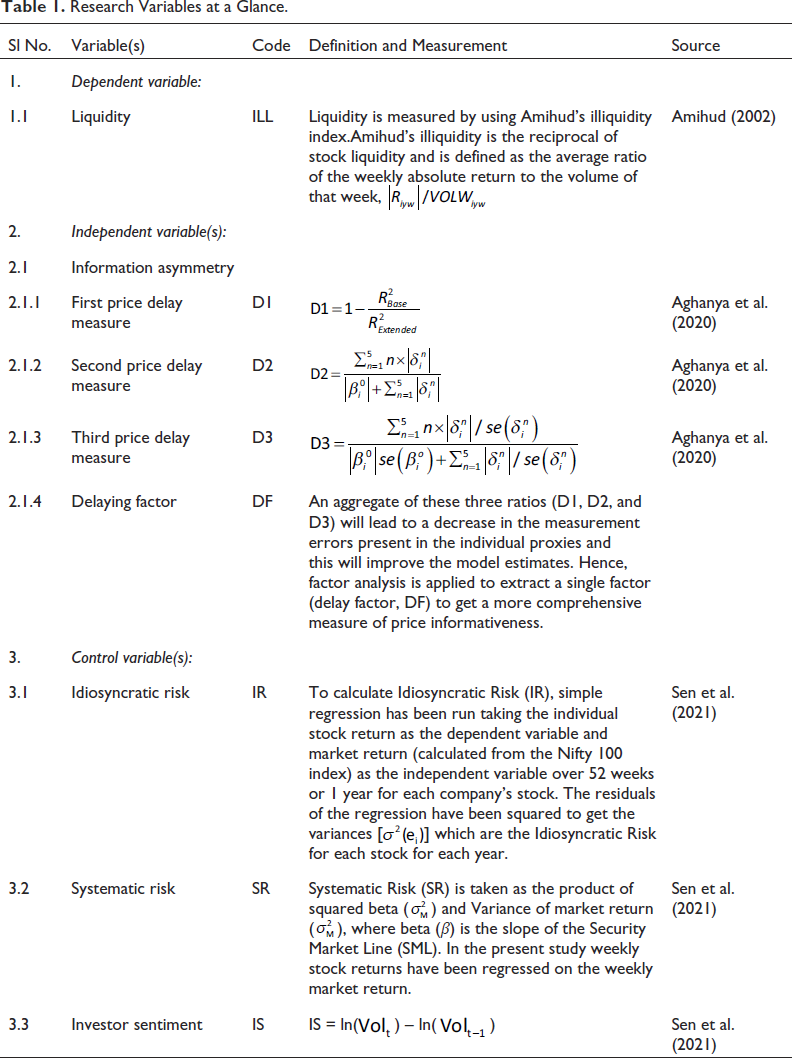
The stock’s liquidity, as defined by Amihud’s (2002) ‘illiquidity’, is the sole dependent variable in this study. Information asymmetry is the central independent variable measured by using the delay factor (see Aghanya et al., 2020) along with D1, D2, and D3. Besides, the present study controls for idiosyncratic risk, systematic risk, and investor sentiment, as these are the three potential factors affecting the liquidity of the stock (see Sen et al., 2021). The definition and measurement of variables are as under.
Liquidity
The present study uses Amihud’s (2002) ‘illiquidity’ as a measure of liquidity of the stock (denoted as ILL). Amihud’s illiquidity is the reciprocal of stock liquidity and is defined as the average ratio of the weekly absolute return to the volume of that week,
Hence, illiquidity (
where
Information Asymmetry
To measure information asymmetry, the following measures of price have been employed in this study (Aghanya et al., 2020). In this mechanism, it is assumed that new information is reflected through the market return. In addition to that, this technique also quantifies how average prices adjust to the new information. Initially, two models are estimated following Busch and Obernberger (2016): 1. The base model:
2. The extended market model:


where,
D1 is the first measure to show the price delay.
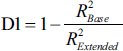
If new information is instantly stored in the stock price, then
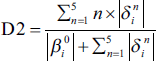
The second measure is termed D2. This is represented by the ratio demonstrating the lag-weighted sum of the mod values of coefficients of lagged market returns by the sum of the mod values of coefficients of all the regression coefficients. Whereas, in the case of D1 equal weights are assigned to all lags, and more weights are assigned to longer lags while computing D2.
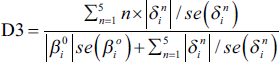
D3 is the third measure in this process which is a standard error-adjusted coefficient ratio. D3 is defined as the ratio of the lag-weighted sum of standard error-adjusted absolute (mod values) coefficients of lagged market returns to the sum of standard error-adjusted absolute coefficients (mod values) of all the regression coefficients. In D3 larger weight is assigned to more precise estimates.
Lower values of these three delay proxies namely, D1, D2, and D3 indicate quick assimilation of new information in stock prices thereby indicating market transparency where the degree of information asymmetry is lower. But higher values of these three proxies signify market opacity where the degree of information asymmetry is much higher. Accordingly, higher values of D1, D2, and D3 imply a delay in the incorporation of information about stock prices into the market thereby indicating market opacity. Lower values of D1, D2, and D3 should be maintained to keep information asymmetry at a lower level. An aggregate of these three ratios will lead to a decrease in the measurement errors present in the individual proxies and this will improve the model estimates. Hence, factor analysis is applied to extract a single factor (delay factor, DF) to get a more comprehensive measure of price informativeness. DF along with D1, D2, and D3 have been used as independent variables in the entire analysis including the robustness check.
Systematic Risk and Idiosyncratic Risk
Total risk can be disintegrated into two parts.
Total risk = Systematic, non-diversifiable risk or market risk + Idiosyncratic or firm-specific risk or diversifiable risk
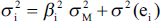
Systematic Risk (SR) is taken as the product of squared beta (
To calculate Idiosyncratic Risk (IR), simple regression has been run taking the individual stock return as the dependent variable and market return (calculated from the Nifty 100 index) as the independent variable over 52 weeks or 1 year for each company’s stock. The residuals of the regression have been squared to get the variances
Investor Sentiment
The volume of stock for a particular year =
where Vol = Volume of stock, i = ith stock and t = 1, 2,…,52 (as 1 year is equivalent to 52 weeks).
Investor’s sentiment = ln(
Baker and Stein (2004) have claimed that the trading volume trend, defined as an increase in trading volume per unit of time ln(
Method
To investigate the influence of informational asymmetry on stock liquidity, this research adopts the following four regression models:
Model (1) investigates the influence of informational asymmetry, as measured by using D1 on stock liquidity. We expect liquidity (illiquidity) of stock is negatively (positively) affected by information asymmetry (D1).

Model (2) examines the influence of informational asymmetry, as measured by using D2 on stock liquidity. We expect liquidity (illiquidity) of stock is negatively (positively) affected by information asymmetry (D2).

Model (3) investigates the influence of informational asymmetry, as measured by using D3 on stock liquidity. We expect liquidity (illiquidity) of stock is negatively (positively) affected by information asymmetry (D3).

Model (4) investigates the influence of informational asymmetry, as measured by using DF on stock liquidity. We expect liquidity (illiquidity) of stock is negatively (positively) affected by information asymmetry (DF).

Where
Note: The definition and measurement of research variables are provided in Table 1.
Research Variables at a Glance.
Following Sen et al. (2021), we adopt a static panel-data (balanced) estimation approach to examine the aforementioned econometric models. This approach, as argued by Petersen (2009), alleviates the limitations of cross-section and time-series, boosting consistency and explanatory power. To test the alternatives of panel data (i.e., fixed and random effects, respectively) against the pooled regression, the F-test (Baltagi, 1995) and the Breusch and Pagan (1980) LM test are performed concurrently. The panel data model is supported by the substantial results from each of these tests (unreported). This is followed by conducting Hausman’s (1978) specification test to determine whether to employ the fixed effects model or the random effect model (Baltagi, 1995). The Hausman test results (reported in Table 5) support the use of the random-effects model, hence it has been kept and is being used to test the study’s hypothesis.
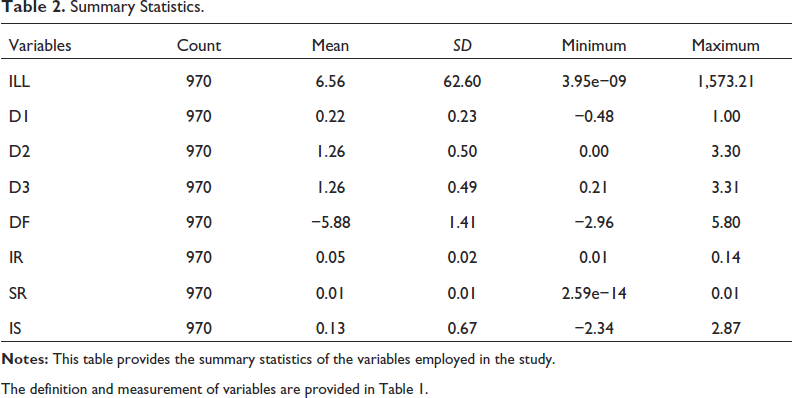
Summary Statistics
Table 2 reports the summary statistics for the full sample from 2011 to 2020. Specifically, Table 2 provides the number of observations, mean, standard deviation, and minimum, and maximum values for the select variables used in the study. The total number of firm-year observations is 970 for each variable. The mean value of the target variable, ILL is 6.56 with a maximum of 1,573.21 and a minimum of 3.95E−09. The first explanatory variable
Summary Statistics.
Summary Statistics.
The definition and measurement of variables are provided in Table 1.
Unit Root Test
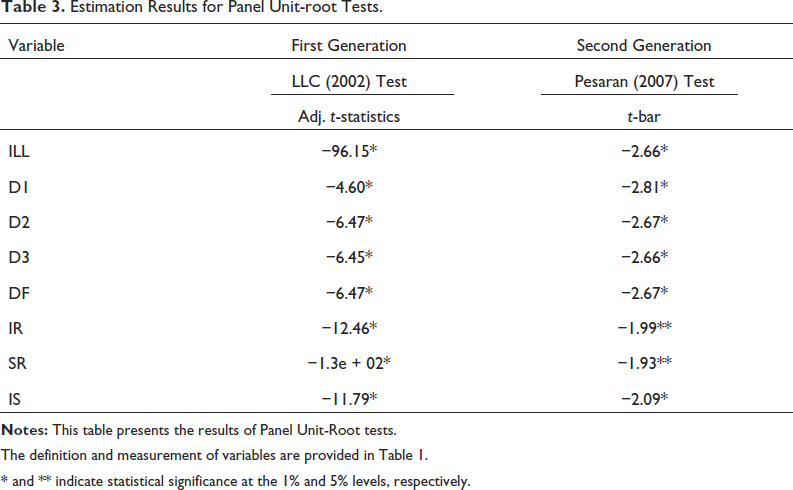
We applied both first generation and the second generation panel unit-root tests in the current research. This is because the Levin–Lin–Chu (Levin et al., 2002) test and other panel unit root tests from the first generation are based on the cross-sectional independence hypothesis. However, in certain macroeconomic applications, this assumption is relatively restrictive and fairly unrealistic as noted by Gengenbach et al. (2009). In heterogeneous panels with cross-section dependence, the underlying premise of the first generation of tests does not hold, prompting the use of a new class of tests, the second generation of panel unit root tests (Pesaran, 2007). These tests relax the cross-sectional independence assumption and allow for cross-sectional correlations (Burdisso & Sangiácomo, 2016). The results of these tests are reported in Table 3. The LLC (2002) test results show that all the select variables are stationary at their levels at the 1% level of significance. Very similar results to that of the LLC (2002) test were displayed by the Pesaran (2007) test. This indicates that the employed variables have no unit root.
Estimation Results for Panel Unit-root Tests.
The definition and measurement of variables are provided in Table 1.
* and ** indicate statistical significance at the 1% and 5% levels, respectively.
Correlation Analysis
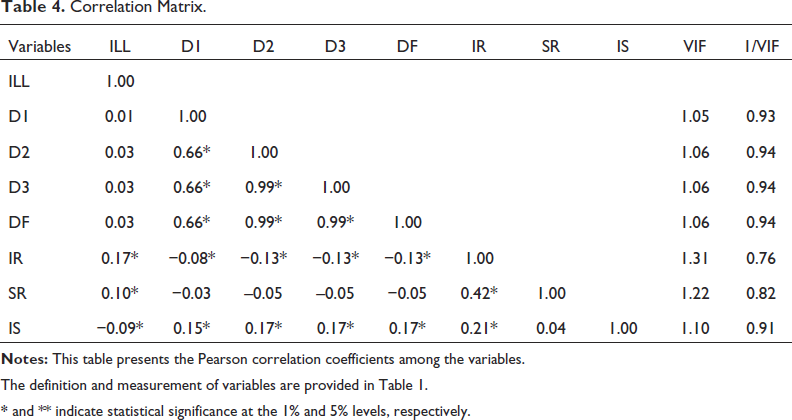
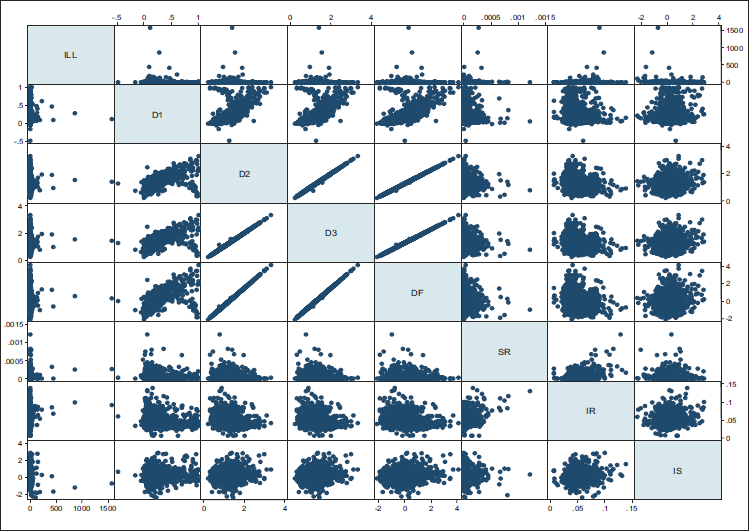
To see the degree of association among the variables, the Pearson correlation coefficients have been calculated, and the results are reported in Table 4. The results show that the correlation between illiquidity and information asymmetry, as measured by alternative proxies, namely D1, D2, D3, and DF are in the expected direction but not significant. Moreover, the results show that illiquidity and the control variables, namely IR and SR are positively correlated, while illiquidity and IS appear to be negatively correlated. It is worth noting that the correlation coefficients among the independent and control variables are within the threshold of 0.80 (see Gujarati, 1995). Further, the VIFs for all the explanatory variables including control variables are within the acceptable threshold (i.e., <4), and tolerance values (1/VIF) are more than 0.20 (see Hair et al., 2010). This allows us to rule out the possibility of multicollinearity among variables in the models examined. Figure 1 presents the correlation scatter plot diagram.
Correlation Matrix.
The definition and measurement of variables are provided in Table 1.
* and ** indicate statistical significance at the 1% and 5% levels, respectively.
Correlation Scatter Plot Diagram.
Hypothesis Testing
Table 5 presents the results for baseline Models (1)–(4). Interestingly, the coefficient on D1 (β = 8.82; z value = 0.95), in Model (1), is positive but insignificant for stock liquidity measure; consequently, we fail to find support for our hypothesis. The results for Model (1) also show that ILL maintains a positive and significant association with IR (β = 652.63; p value < .01), while ILL and SR hold no noticeable association. On the contrary, the relationship between ILL and IS is negative and significant (β = −13.15; p value < .01). In Model (2), the coefficient on D2 is positive and significant for stock measure (β = 8.17; p value < .05). This result is consistent with the hypothesis (1). Further, the results show that ILL maintains a positive and significant association with IR (β = 677.49; p value < .01), whereas the relationship between ILL and SR is positive but insignificant. On the other hand, the coefficient on IS is negative and significant for stock measure (β = −13.82; p value < .01). The results for Model (3) exhibit a positive and significant relationship between ILL and D3 (β = 8.26; p value < 0.05). This result also is in line with hypothesis (1). The control variables, namely, IR (β = 677.91; p value < .01) and IS (β = −13.83; p value < .01) appear to have significant associations with ILL, while ILL and SR have no noticeable association. The coefficient on DF (β = 4.09; p value < .05), in Model (4), is positive and significant for the stock liquidity measure. This result also is consistent with Hypothesis (1). For control variables, the results show that ILL maintains significant associations with IR (β = 677.37; p value < .01) and IS (β = −13.82; p value < .01), while ILL and SR hold no noticeable associations as noted earlier.
Overall, the results for baseline models offer strong evidence in support of our hypothesis.
Random-effect Regression Model Estimates.
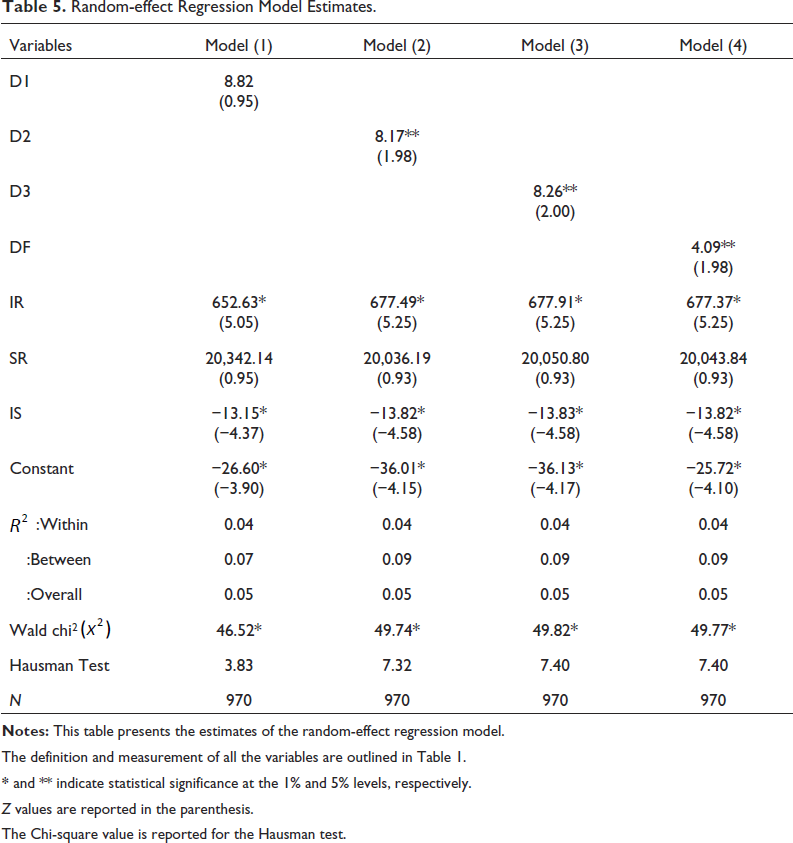
The definition and measurement of all the variables are outlined in Table 1.
* and ** indicate statistical significance at the 1% and 5% levels, respectively.
Z values are reported in the parenthesis.
The Chi-square value is reported for the Hausman test.
Robustness Check
Initially, we employ the static panel data approach to test our hypothesis. As a robustness check, the baseline models are re-estimated using two-stage dynamic sys-generalised method of moments (GMM). Although static panel data technique control for the issue of omitted variables, simultaneity and measurement error are still two possible sources of endogeneity (Mukherjee & Sen, 2022). Broadly speaking, ‘endogeneity’ is one of the serious issues in empirical corporate financial research (Wintoki et al., 2012). This is because while examining a cause-and-effect relationship, it is generally quite difficult to get through exogenous factors with which to identify the relations being examined. Endogeneity, as noted by Roberts and Whited (2013), leads to biased and inconsistent parameter estimates that almost eliminate the possibility of making a valid inference. This perhaps also be in our case. Thus we adopt a relatively-advanced two-stage dynamic panel GMM estimator to allay endogeneity worries in our research. Two-stage dynamic sys-GMM allows finer control over the instrumental variables and can yield robust estimates (Roodman, 2009).
Table 6 presents the results of the two-step system GMM for Models (5)–(8). The coefficient on D1, in Model (5), is found to be statistically significant for stock liquidity measure (β = 12.04; SE = 5.06), which is in sharp contrast to the estimate from the static random-effects model where the coefficient is noted insignificant. This dramatic significance flip suggests there is some unobservable heterogeneity that is not captured by the prior static random-effects model. However, the coefficient on D2 (β = 6.09; SE = 2.70), D3 (β = 6.10; SE = 2.68), and DF (β = 3.04; SE = 1.34) in Models (6)–(8), respectively, are relatively similar to those obtained from random-effects estimates of a static model reported in Table 5. For control variables (except IR), the results echo the estimates of baseline models both in terms of sign and significance. Interestingly, the coefficient on IR is found to be statistically insignificant in all the models for the select stock liquidity measures, which is in sharp contrast to the estimates from the static random-effects models where the same is noted as significant.
SYS-GMM Estimates.
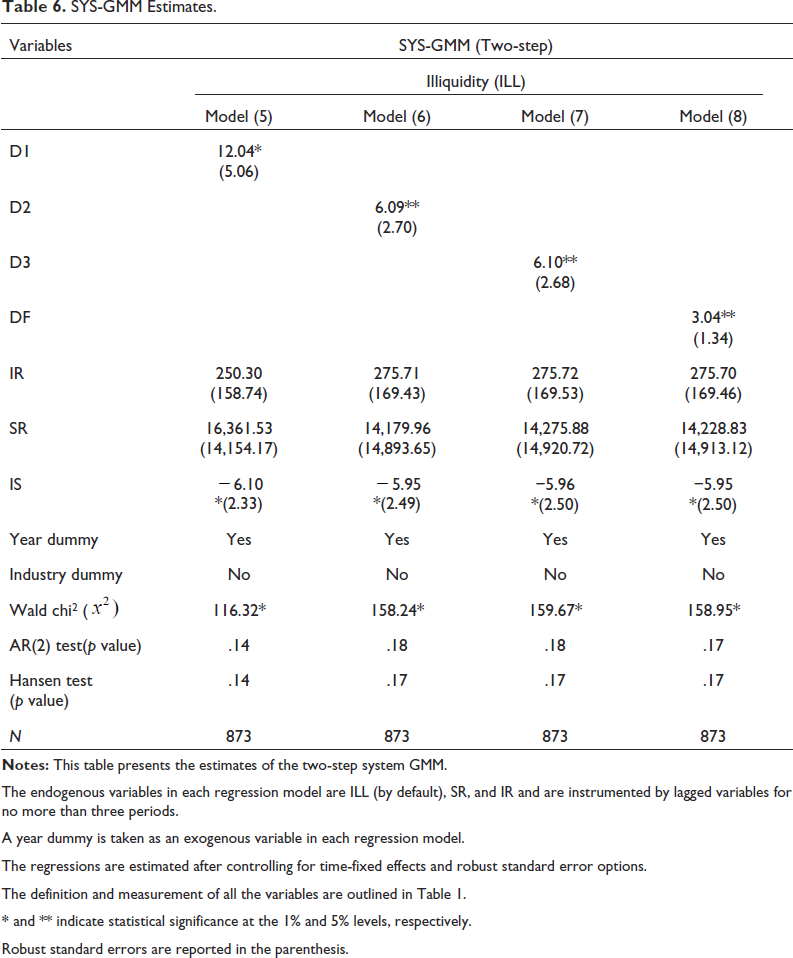
The endogenous variables in each regression model are ILL (by default), SR, and IR and are instrumented by lagged variables for no more than three periods.
A year dummy is taken as an exogenous variable in each regression model.
The regressions are estimated after controlling for time-fixed effects and robust standard error options.
The definition and measurement of all the variables are outlined in Table 1.
* and ** indicate statistical significance at the 1% and 5% levels, respectively.
Robust standard errors are reported in the parenthesis.
Furthermore, Table 6 reports the results of the post-estimation tests, namely AR(2)−second-order serial correlation test and Hansen test of over-identifying restrictions for the sys-GMM model. The AR(2) test yields p values: .14, .18, .18, and .17 for Models (5)–(8), respectively, suggesting that the null hypothesis of no second-order serial correlation cannot be rejected. The results in Table 6 also show the Hansen test statistic with p values of .14, .17, .17, and .17 for Models (5)–(8), respectively. This indicates the null hypothesis that the instruments are valid, and cannot be rejected.
Overall, the results of the two-step system GMM to a reasonable extent corroborate our main findings and remain robust at levels.
The present study examined the influence of informational asymmetry on stock liquidity in India. The empirical findings strongly support our hypothesis that liquidity (illiquidity) of stock is negatively (positively) affected by information asymmetry. This suggests market illiquidity increases as informational asymmetry rises and vice versa. This result is in line with the findings of O’Hara (2003) and Easley and O’Hara (2004) who have shown that due to information asymmetries, traders prefer to hold their securities, increasing the illiquidity of the same. Information asymmetry among market participants increases the adverse selection risk for liquidity providers. In response, liquidity providers demand higher compensation and widen the quote spread, thereby increasing the illiquidity of stocks (Glosten & Milgrom, 1985; Kyle, 1985). The open flow of information to investors must therefore be ensured to decrease illiquidity and promote liquidity. The results also reveal that the control variable, investor sentiment does influence the illiquidity of stock adversely, indicating that the liquidity of stock improves with favourable investor sentiment. This result is consistent with the findings of Sen et al. (2021). However, the research fails to find any strong influence of firm-specific risk on stock liquidity, which contradicts the findings of Sen et al. (2021).
The empirical findings have some theoretical and practical implications. The present study extends liquidity literature by showing the impact of information asymmetry on liquidity by considering a sample from emerging markets like India. In practical terms, the present study has direct implications for stock exchange regulators and corporate managers of Indian non-financial listed firms. Specifically, the findings reveal that information asymmetry has a strong and positive relationship with illiquidity, implying that reduced transparency and a high level of information asymmetry reduce market liquidity. Therefore, stock exchange regulators should strengthen the process of information dissemination and sensitise market participants and investors. Moreover, there should be some efforts both on the part of directors and other regulatory bodies to keep information asymmetry as low as possible to enhance stock liquidity in the stock market so that different stakeholders come forward to invest in the Indian market. Finally, the empirical findings can be an immense source of information for different stakeholders, corporate managers and stock market regulators when it comes to formulating and implementing investment policy.
Conclusion
The present study investigates the impact of information asymmetry on the liquidity (illiquidity) of stock in India. The investigation is based on a sample consisting of top NSE listed 97 non-financial companies over the period 2011 to 2020. Using a panel-data framework, the results show that information asymmetry, as measured by delay factors has a noticeable and affirmative association with illiquidity after controlling for the effects of firm-specific risk and investor sentiment. This suggests that market liquidity decreases with less transparency or a high level of informational asymmetry. Further, the results illustrate that investors’ sentiment does influence the illiquidity of stock adversely, while no significant association could be established between stock illiquidity and firm-specific risk, as measured by idiosyncratic risk and systematic risk. The empirical results are validated using a dynamic panel-data approach, with two-stage GMM and remain robust. Overall, these findings provide insight into how information asymmetry could affect stock liquidity in emerging market—India and what should be the role of its stock exchange regulators and the other regulatory bodies in developing a transparent market and improving trading activity.
The current research can be extended in a couple of ways. First, academicians and scholars could extend this research by increasing the firm-year observations or by considering other proxies of liquidity, information asymmetry, firm-specific risk, and investor sentiment or by including a few more control variables, such as firm size, firm age, and institutional ownership, among others. Lastly, it would be interesting to see the mediating role of corporate governance on the information asymmetry-market liquidity link.
Footnotes
Declaration of Conflicting Interests
The authors declared no potential conflicts of interest with respect to the research, authorship, and/or publication of this article.
Funding
The authors received no financial support for the research, authorship, and/or publication of this article.