Abstract
This article examines the structural responses of foreign exchange and equity markets to the COVID-19 pandemic in seven Asian countries over its first 4 months (31 December 2019 to 1 May 2020). Marginal effects derived from a structural vector autoregression (SVAR) model suggest that a 1% increase in incidence of COVID-19 cases significantly diminished Indonesia’s equity market returns by 4.7%, depreciated the Indian rupee against the US dollar by 4.8%, but improved equity prospects in South Korea by 4.1%. For the other financial markets, the effect of COVID-19 was found to be insignificant. Further, the impulse response analyses imply that the influence of COVID-19 on foreign exchange and equity markets is only transitory in nature. Additional SVAR analysis for India and Indonesia over recent months (2 May 2020 to 22 January 2021) showed that their financial markets remained (or became) resistant to the escalating incidence of COVID-19 inflections and deaths.
Introduction
Globally, social distancing, self-isolation, travel restrictions, declarations of a state of emergency and localised or nationwide lockdown restrictions have been the key strategies implemented to contain the COVID-19 pandemic. These unprecedented actions slowed down or shut down business activity, sending shock waves across interconnected financial and commodity markets. A burgeoning research in the area indicates that the pandemic caused some disruptions in the financial markets, although this was not always negative or significant.
The majority of studies indicate that the global pandemic has been responsible for increased market risk and/or reduced returns in some equity markets (see Al-Awadhi et al., 2020; Baker, et al., 2020; Harjoto et al., 2020; He et al., 2020; Liu et al., 2020; Nicola et al., 2020; O’Donnell et al., 2021; Salisu et al., 2020; Sergi et al., 2021; Takyi & Bentum-Ennin, 2020; Zhang & Hamori, 2021; Zhang et al., 2020). Using daily data on stock market returns in 10 top COVID-19-affected countries over the period from February 2020 to March 2020, Zhang et al. (2020) showed that as a result of the pandemic, global financial market risk rose considerably. Using Google Trend data on COVID-19 over the period from 2 January 2020 to 9 April 2020, Papadamou et al. (2020) find that out of the 13 stock markets in Asia, Europe, the USA and Australia, the effects of the pandemic were most felt in the stock markets in Europe (also see Ahundjanov et al., 2020 and Amstad, et al., 2020). Harjoto et al. (2020) report that emerging and developed equity markets reacted differently to COVID-19 data on deaths and infections. Al-Awadhi et al. (2020) indicate that over the period from 10 January to 6 March 2020, the daily growth of confirmed cases and total mortality linked with COVID-19 had a significant negative impact on the stock returns of all Chinese companies. Takyi and Bentum-Ennin (2020) argue that the negative effect of the pandemic on some African stock markets during the period from 31 December 2019 to 30 June 2020 was short-lived. Based on their event study of leading stock market indices in countries affected by the new COVID-19 cases over the period from 21 February 2020 to 18 March 2020, Liu et al. (2020) note that the Asian stock market response to COVID-19 was quick, transitional and negative. The study also found that some markets had already started to recover, albeit slowly. On the other hand, using Wavelet Coherence and Partial Wavelet Coherence on daily data over the period from 1 February 2020 to 13 May 2020, Sharma et al. (2021) conclude that the pandemic had long-term negative implications for the equity markets of some of the affected nations. In contrast, Narayan et al. (2021) show that the lockdowns, travel bans and economic stimulus over the period from 31 December 2020 to 16 April 2020 had a positive effect on the stock markets of G7 markets. Ashraf (2020) also emphasises that the stock market’s reaction to the pandemic was not uniform over the period from 22 January 2020 to 17 April 2020.
A few studies examine the exchange rate markets’ reaction to the pandemic (Gunay, 2020; Iqbal et al., 2020; Sharma et al., 2021). On the one hand, China, where the new COVID-19 virus was first detected, saw its currency depreciate slightly against the US dollar (Iqbal et al., 2020). On the other hand, Sharma et al. (2021) show that the rise in the number of COVID-19 cases has significantly impacted the fluctuation and volatility of affected nations’ exchange rate. Gunay (2020) finds that through stand-alone risk analysis that selected US dollar-based exchange rates, including the Euro, Chinese Yuan, Japanese Yen, Brazilian Real and Turkish Lira, during the initial months of the COVID-19 pandemic, was not as tumultuous as that in the global financial crisis (GFC). However, an examination of the co-movements and volatility spillovers between these exchange rates indicated that the COVID-19 effects were severe than the GFC. Of the exchange rates examined by Gunay (2020), the emerging markets were found to be most affected in both crises
We investigate the influence of COVID-19 cases in selected Southeast and East Asian countries on their US-based foreign exchange and equity markets in the first 4–13 months of the pandemic. Our study differs from the above-mentioned single-equation-based studies, in that we employ a structural vector autoregression (SVAR) model that exploits the endogenous relationships between financial markets (and their determinants) to investigate the impact of the COVID-19 shock. The SVAR model developed here caters for the sluggish response of the US stock market, government bond yield and COVID-19 with respect to shocks to other variables in the model, including the returns of oil price, US-based exchange rates and stock markets for the seven Asian nations. More importantly, in this article, the SVAR restrictions exploit the bidirectional relationships between oil prices and stock markets, or oil prices and exchange rate, evident in the recent literature. The seven Southeast and East Asian countries studied are China, India, Indonesia, Japan, Malaysia, Singapore and South Korea, where the COVID-19 cases, over the period from 31 December 2019 to 1 May 2020, were among the highest. We repeat the SVAR analysis over the period from 2 May 2020 to 22 January 2021 for India and Indonesia, where the COVID-19 cases escalated to serious levels. The COVID-19 event is captured in the SVAR model in terms of total cases of infection, deaths or new cases as a percentage of total cases in most of the seven Asian countries.
Foreshadowing our key results, we find that the impact of COVID-19—measured in terms of total cases of infection, deaths or new cases as a percentage of total cases—in the seven Asian countries had varying effects in the period examined. In three out of seven cases, COVID-19 left a significant mark on the exchange rate and stock markets by the close of business on 1 May 2020. Our impulse response analysis confirms that COVID-19 shocks have thus far been strongly transitory in nature, and while markets showed reaction to COVID-19 shocks, they were able to recover within a few days. The SVAR analysis with more recent data (2 May 2020 to 22 January 2021) suggest resilience of financial markets in India and Indonesia in the face of higher incidence of the COVID-19 inflections and deaths over the recent months.
The remainder of the article is organised as follows. Section II presents the econometric model, and economic and financial literature governing the structural restrictions. Section III explains the data and presents some preliminary analysis. Section IV reports and discusses the results, while the Section V concludes the study.
Model and Theory
The literature and the econometric framework employed in developing and estimating the empirical models are outlined here. 1
In the study of equity or exchange rate markets, it has become conventional to model oil prices and stock or forex markets. Further, several studies have indicated that there can be a bidirectional relationship between stock market and oil price or between exchange rate and oil price. We explore these features of the current literature on stock and exchange rate within an SVAR system. The SVAR methodology is best suited here, given the strong presence of endogeneity between the variables we seek to examine. The SVAR method uses time series data, which means we can provide individual country effects. This is particularly important in the case of clarifying the initial effects of the COVID-19 pandemic as the experience of the pandemic in each country has been different, in terms of the total number of cases of infection, new cases, deaths and new deaths.
We begin with the following reduced form of VAR model:

Here, Y
t
is a (6 × 1) vector of variables at time t and comprises
The innovations of the reduced form model, u
t
, can be expressed as a linear combination of the structural shocks, ε
t
, as in Breitung et al. (2004):

where B is a structural form parameter matrix. Substituting Equation (2) into Equation (1) and following some minor manipulations, we get the structural representation of Equation (1):

Here,

The orthonormal innovations, ε, ensure the identifying restrictions on A and B:

We use the model A, where B = I.
2
Hence, K (K – 1)/2 restrictions need to be implemented for identification of the system. Simple zero exclusion restrictions are used to identify the system. The elements of the system that are estimated are assigned as γrc. Estimations follow maximum likelihood using the scoring algorithm (Amisano & Giannini, 1997; Breitung et al., 2004). Over-identification of the system leads to a formal likelihood ratio (LR) test to check whether the identification is valid. The LR statistic is computed as:

where
The system (4) represented as model A takes the following form:
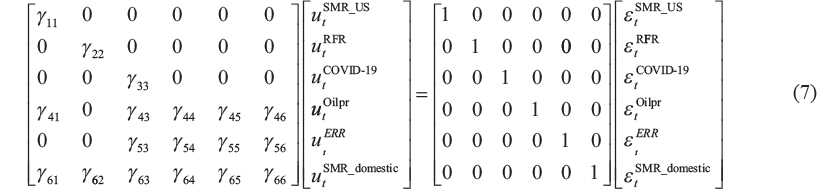
The first three equations in the system (4) represent the US stock market, the domestic government bond yield and COVID-19 shocks in the system. These equations depict the sluggish response of the US stock market, government bond yield and COVID-19 to shocks to other variables in the model, including the Oilpr, ERR and SMR_domestic.
The final three equations are several unidirectional relations flowing from SMR (US) to Oilpr; COVID – 19 to Oilpr; COVID – 19 to ERR; COVID – 19 to SMR (domestic); and government bond yields to SMR (domestic). The last three equations also depict bidirectional relationships between Oilpr – SMR (domestic); ERR – SMR (domestic); and Oilpr – ERR. We explain these relationships as follows:
As covered in the first section, several researchers investigated effects of the COVID-19 pandemic on the financial markets. In the case of the exchange rate markets, evidence of the impact is still scarce. For the stock markets, the findings are mixed. The effect of COVID-19 on the oil (or Gasoline) market has been found to be negative (Ahundjanov et al., 2021; Narayan, 2020; Salisu et al., 2020). Narayan (2020) shows that over the period from 31 December 2020 to 5 May 2020, COVID-19 exerts a stronger effect on oil price after the number of new COVID-19 cases surpasses 84,479. Ahundjanov et al. (2021) find that COVID-19 sentiments derived from Google Search volumes over the period from 22 January 2020 to 2 July 2020 negatively affected the gasoline market, but it left the oil market unaffected.
Research on the financial impact of the severe acute respiratory syndrome (SARS) epidemic in 2002–2003 also shows that impact can be varied. Nippani and Washer (2004) note that, except for China and Vietnam, SARS did not negatively impact the stock market in the other affected countries (Canada, Hong Kong, Indonesia, Singapore and Thailand) for the period from 1 June 2002 to 17 June 2003. Chen et al. (2007) find that SARS had a significant impact on Taiwanese hotel stock efficiency, while Wang et al. (2013) show that the SARs epidemic influenced the efficiency of Taiwan’s biotechnology stocks.
Positive demand shocks also coincide with bullish stock market conditions and higher stock market returns under such conditions that put pressure on the oil market that cause oil prices to increase. Hence, a bidirectional relationship has also been found for stock market returns and oil prices. Salisu and Oloko (2015) note that there is a bidirectional relationship between the oil market and US stock markets.
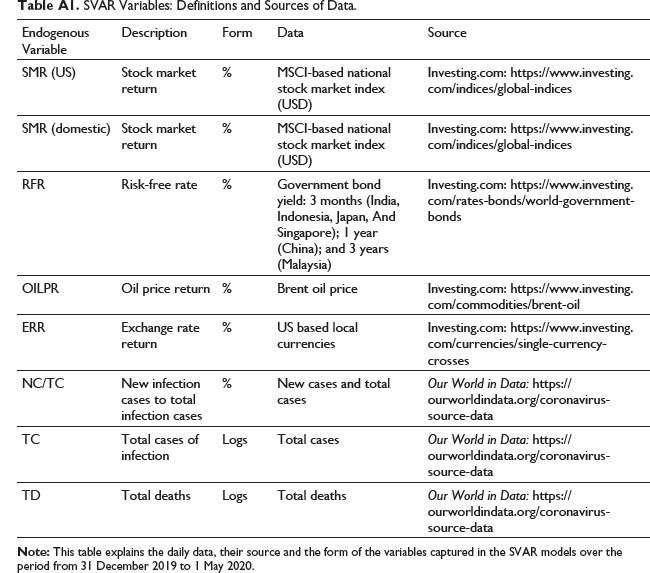
This study employs daily data over the period from 31 December 2019 to 1 May 2020. Our choice of SVAR variables has depended on the availability of data. The main COVID-19 pandemic-related data series include total confirmed cases of infections, new cases of infection and total deaths, all of which are extracted from Our World in Data. 5 Financial data, including daily oil prices, MSCI-based national stock market for the USA, MSCI-based national stock market and bond yield for the seven Southeast and East Asian countries, namely China, India, Indonesia, Japan, Malaysia, Singapore and South Korea, are extracted from the Fusion Media Investing.com website (see Table A1).
Lockdown Status (as of 1 May 2020).
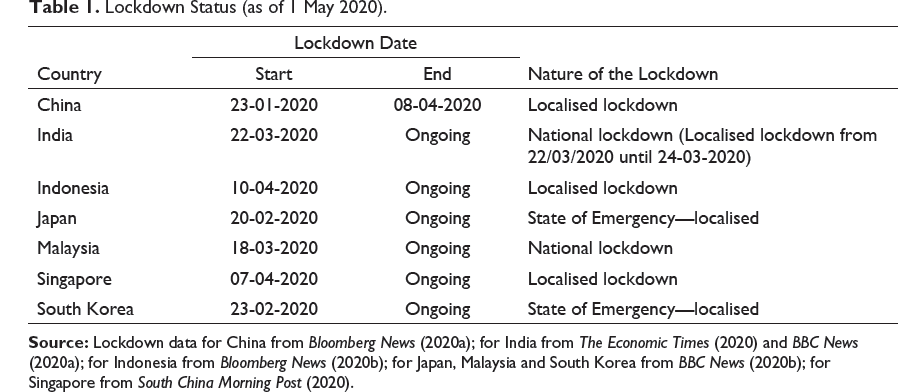
Lockdown Status (as of 1 May 2020).
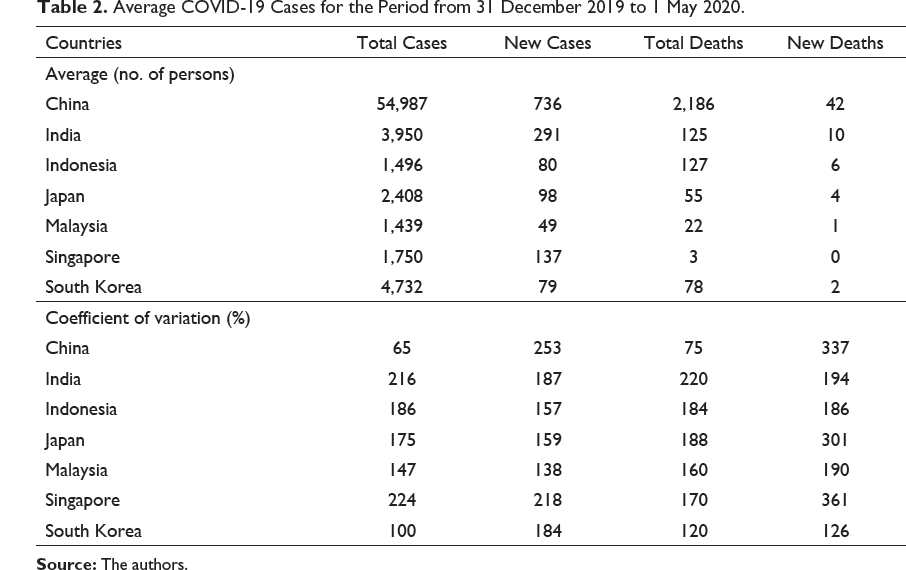
Average COVID-19 Cases for the Period from 31 December 2019 to 1 May 2020.
Other SVAR Variables: Common Statistics.
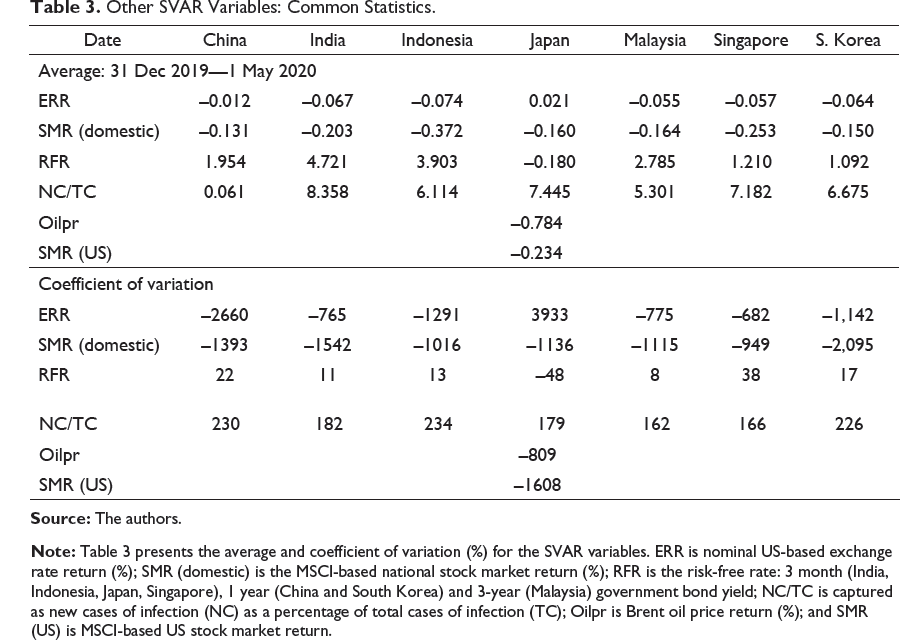
In terms of the coefficient of variation (CV), which allows comparisons of volatility of the COVID-19 statistics across countries, the key observations are as follows: of the four COVID-19 measures captured in Table 3, daily new deaths for China, Japan, Malaysia and Singapore displayed most variation, while, for India and Indonesia, total confirmed cases of infection were most volatile. However, total confirmed cases of COVID-19 infection in Singapore, compared to other countries, displayed more volatility, closely followed by India. In comparison to the other six countries, China showed the least variation in the total daily infections and total deaths, although new daily confirmed cases were most volatile in China and least in Malaysia. For South Korea, of all four COVID-19 statistics, new daily confirmed cases were most volatile.
For the average experience in the financial markets of seven Asian countries surveyed, we turn to Table 3. All financial variables are expressed in their return form. All countries, except Japan, experienced a depreciation in their exchange rate. China suffered the least fall in the value of its currency against the US dollar (−0.01%). The other nations showed depreciation of their currencies against the US dollar in the range from 0.05% (Malaysia) to 0.07% (Indonesia). All countries suffered a fall in stock market return—this was most felt by Indonesia (−0.37%). The decline in equity returns in the other six countries ranged from 0.16% (Malaysia) to 0.25% (Singapore). On average, the US MSCI return fell by 0.23%. Brent oil price fell much more—by 0.78%. In the highly volatile markets, these average falls in returns remained close to 0 over the 4 months. In all countries, the foreign exchange markets were most volatile, followed by the equity markets and the global oil market. According to Table 3, the US exchange rate against the Japanese Yen, followed by the Chinese Renminbi, and Indonesian Rupiah, and equity markets in South Korea, followed by the USA, India and China were among the most volatile.
Figure 1 presents new cases as a ratio of total cases (NC/TC, %), and all other SVAR variables over the 4 months. Strikingly, during the period when new cases were increasing at an escalating pace in the early stage of the pandemic, which is shown by the increase in NC/TC, all other markets (equity, exchange rate, bond and oil) showed very little movement, but by the middle of the second month of the COVID-19 pandemic, we begin to see increased movements (or economic activity), although these were very volatile in nature. Only more detailed analysis will indicate whether the volatility evident in the later months of the first 4 months of the COVID-19 pandemic was transitory or more enduring in nature.
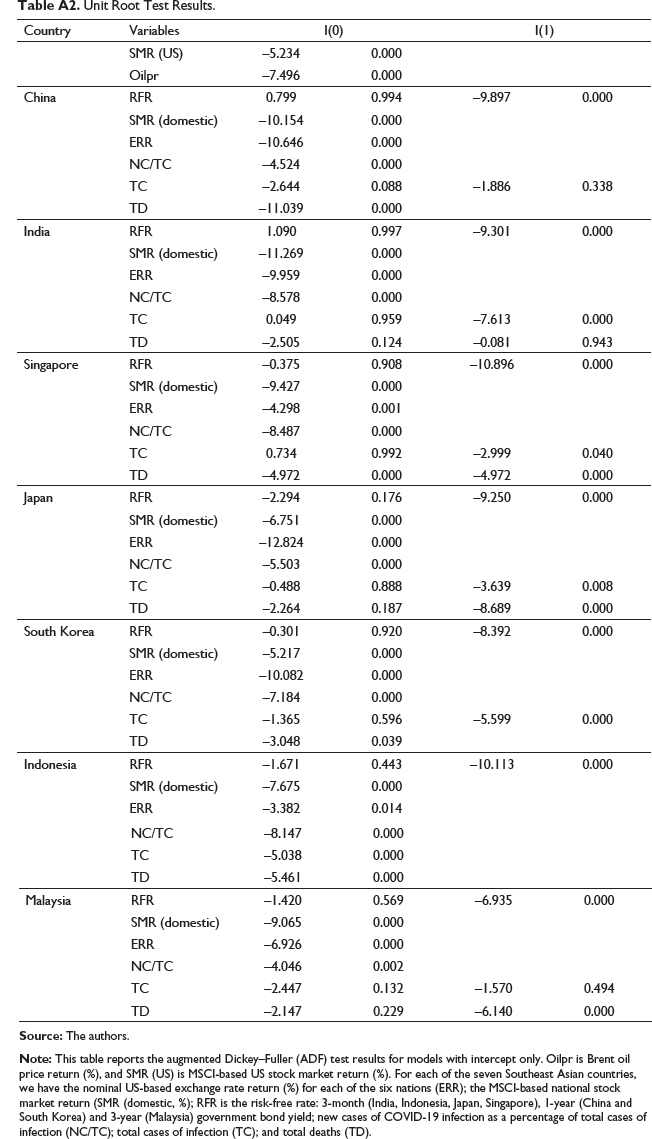
Next, we examine the stationarity of the variables. As mentioned earlier, all variables appear in the SVAR model in their stationary form. The standard augmented Dickey–Fuller (ADF) test results presented in Table A2 show that Brent oil price and the MSCI-based US stock returns are stationary, as are MSCI-based stock returns of all seven Asian countries. Exchange rate returns and NC/TC are stationary in their level forms or are I(0). Government bond yield (RFR) is non-stationary in level form but becomes stationary in the first-difference form or is I(1). Hence, DRFR, where D denotes first difference, is used in the SVAR models. Other measures of COVID-19, including TC and TD, for most countries are I(1). TD in China and South Korea follow the I(0) process, while both TC and TD in Indonesia follow the I(1) process in the SVAR models.
This section presents the empirical findings from our SVAR analysis. We interpret the structural coefficients from the A matrices and discuss the structural impulse responses to COVID-19 shocks by examining them in three ways—total COVID-19 cases (TC), total COVID-19 deaths (TD) and new cases as a percentage of total cases (NC / TC). We also briefly cover the response of the US-based exchange rates and equity markets to other structural shocks captured in our SVAR model.
Structural Coefficients from A Matrices
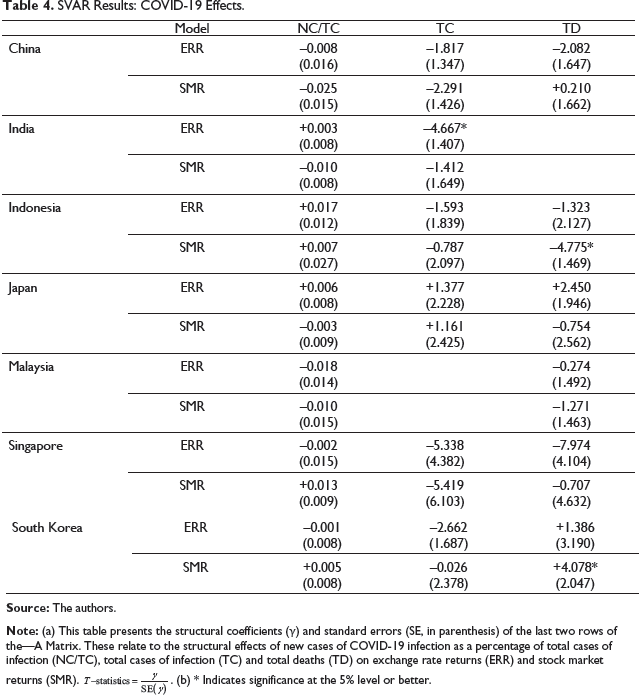
SVAR Results: COVID-19 Effects.
SVAR Results: COVID-19 Effects.
SVAR Results: Lags and Over-Identification Test.
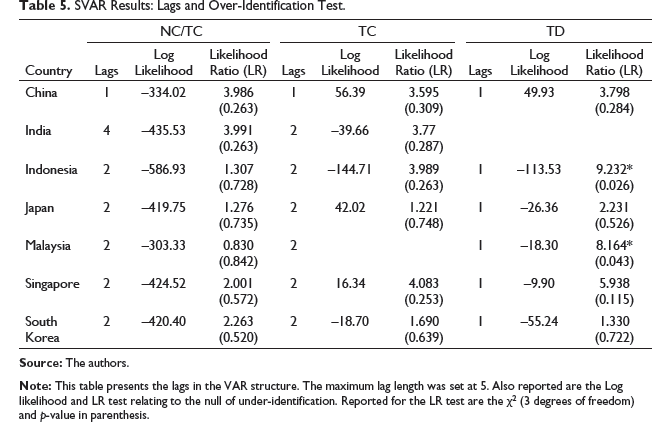
The point estimates, reported in Table 5, deserve some attention as they have important policy and theoretical implications. We begin with the structural effects of COVID-19 shock on exchange rates and stock market returns during the period from 31 December 2019 to 1 May 2020. The key result is that the COVID-19 pandemic is found to have a significant effect in the case of India, Indonesia and South Korea.
In terms of how the pandemic strikes these markets, we can make two important observations from the three highly significant cases. First, the impact of the pandemic is heterogeneous. In India, the foreign exchange market is significantly affected, while the stock markets in Indonesia and South Korea are impacted. Where COVID-19 has struck the same markets in different countries, the impact is not necessarily the same. We find that the impact is not standard in the case of equity markets. For Indonesia, the COVID-19 pandemic reduced the stock market returns, while, in the case of South Korea, the effect was found to be positive.
Second, it seems that markets are affected by different COVID-19 data. 6 In the case of India, the US-based forex market was impacted significantly by total cases of confirmed infections. India’s total deaths to total confirmed cases, averaged over the 4-month period, was lower (3%) than the new cases to total confirmed cases (7%), which may explain a rather significant reaction to total infection.
The equity market in Indonesia was, on the other hand, affected by total deaths, with total deaths as a percentage of confirmed cases of infections averaging 8% as of 1 May 2020.
Of the seven Asian nations in this study, Indonesia was one of the last to begin reporting COVID-19 cases (see Figure 1). Both the international and local news media emphasised the slow response of the Indonesian government in handling the COVID-19 pandemic (Pierson, 2020; The Jakarta post, 2020). An escalating death toll in a country, which was failing to take sufficient action, would have raised alarm bells, and as indicated by the SVAR analysis, the response to the uncertain times was reflected in its equity market. On the other hand, South Korea, which was one of the first countries to show positive signs of recovery from the COVID-19 pandemic, saw regained confidence as a result of reduced total deaths. By 1 May 2020, South Korea’s total deaths as a percentage of confirmed cases was 1.6%.
In terms of the size of the impact of COVID-19, this period of the pandemic led to a rather strong depreciation of India’s rupee against the US dollar. A 1% increase in the COVID-19 cases led to a 4.7% depreciation of the rupee against the US dollar. In Indonesia, the COVID-19 pandemic led to a fall in the stock market, with a 1% increase in total number of COVID-19-related deaths, wiping 4.8% off its stock market returns. For these two populous nations, a sudden acceleration in COVID-19 infections invited fear in the markets. On the other hand, in South Korea, the containment of COVID-19 infections—which is evident from the fall and levelling of NC / TC (see Figure 1) by the second month—would have boosted public confidence in that country’s ability to tackle the pandemic. This probably explains the improvement seen in the South Korean stock market amid higher total deaths, but stabilised infection rates. Here, a 1% increase in total COVID-19-related deaths saw an increase in stock market returns of 4.1%. There are three things at work here with respect to the COVID-19 pandemic in South Korea: first, data show that there was some lag between new infections and deaths; second, deaths due to COVID-19 occupied a very small percentage of the total infections (1.6% averaged over the 4-month period); and, third, unlike most of the countries in the sample, during the study period, South Korea had only gone as far as declaring a state of emergency and had not introduced blanket lockdown restrictions.
For the other four countries, namely China, Japan, Malaysia and Singapore, we find no case of significance at the 5% level, or better. As with the significant cases, we note that with insignificant cases, there are differing effects of COVID-19 on the returns of foreign exchange rates and stock markets.
Structural Impulse Response Analysis
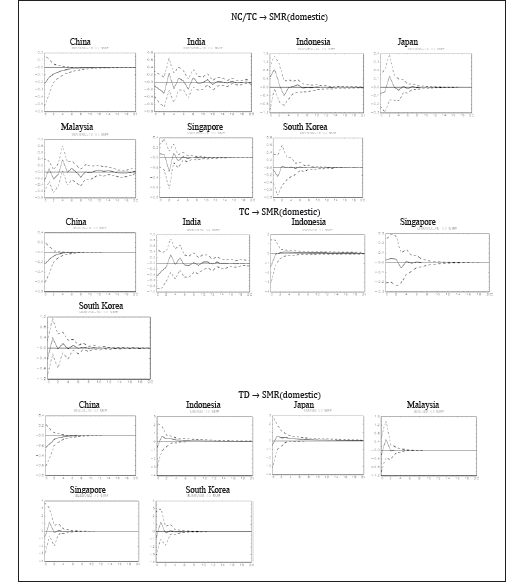
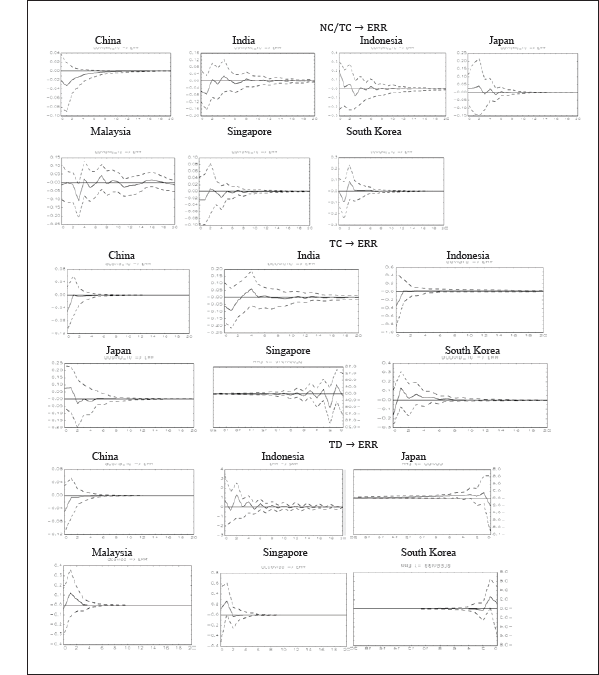
The structural impulse response (IR) analysis provides evidence on the dynamic responses of ERR and SMR to COVID-19 effects. The bootstrap percentile of 95% confidence intervals are constructed to illustrate parameter uncertainty. Responses of up to 20 days ahead are considered by using 1,000 bootstrap replications. For each measure of COVID-19 incidence, all countries are reported, with the exceptions of India, which is not covered for TD, and Malaysia for TC, as for these two countries, these variables are I (2).
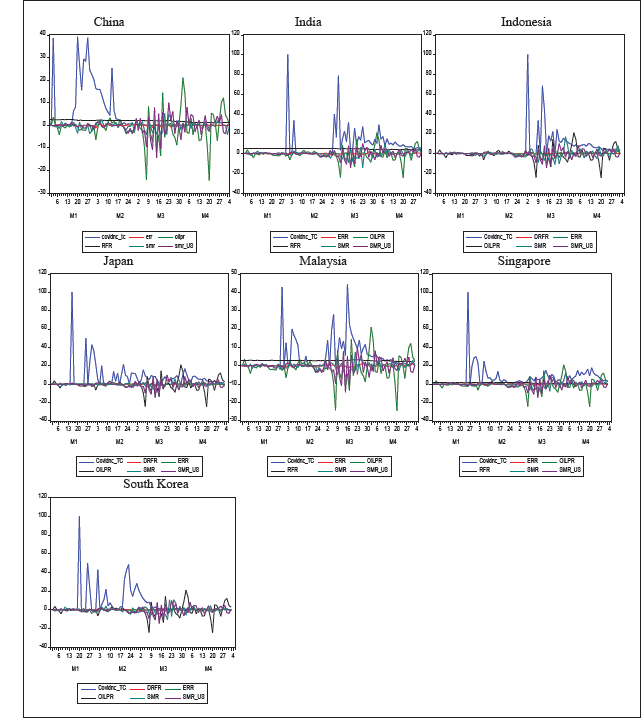
The dynamic effects of the COVID-19 pandemic on the forex and equity markets, represented by their price returns, ERR and SMR, are depicted in Figures 2 and 3, respectively. The charts are organised by the three measures of COVID-19, namely NC / TC, TC and TD. All the charts in these figures present insignificant impulse responses to COVID-19 shocks.
In comparison, the structural impulse responses of the equity and US-based exchange rate markets to shocks, other than COVID-19, within the SVAR model, are significant in some, but limited cases during the first 3 months of COVID-19. Figure 4 captures the response of our seven Southeast and East Asian countries’ stock markets to US stock market shocks, which are significant. The charts (see Figure 4) for the significant cases are organised by each of the three measures of COVID-19. Recall that each measure of COVID-19 was implemented in the SVAR one at a time. In the SVAR models with NC / TC, for the stock returns of China and South Korea, a one standard deviation increase in the SMR (US) leads to an instantaneous positive effect. The response to US shocks is somewhat delayed from Indonesia, Japan and Singapore. In all cases, except China, domestic markets increased further up to day 2 before reverting, and the effect of the US shocks dissipated by days 6–12. For China, the US market had a strong positive instantaneous effect, which dissipated after day 1, but continued to cause minor (insignificant) jitters in the market up to day 5. The impulse response was significant for China until all the initial effects of the SMR (US) shocks had dissipated.
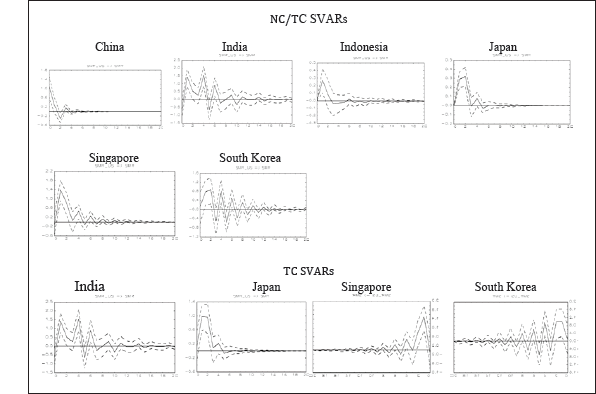
The response of the Indian equity market to SMR (US) shocks is negative in both NC / TC and TC related SVARs. A one standard deviation increase in US stock market returns receives a significant response from the Indian stock market for up to 4–5 days.
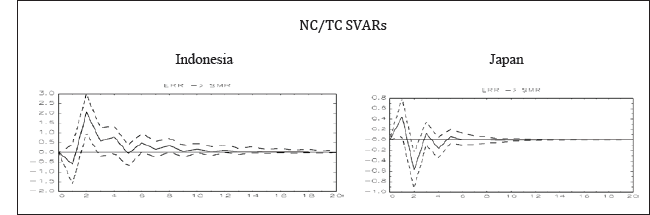
Figure 5 captures the structural impulse response of the stock markets in Indonesia and Japan to a one standard deviation increase in the ERR in the first 4 months of COVID-19. Note in both cases that the response is delayed and significant during days 1–3. The structural impulse response of other stock markets to the ERR shock in SVAR with NC / TC is insignificant. All cases are insignificant under the TC and TD SVARS. Further, when we checked the structural impulse response of the ERR to SMRs, we found that all the impulse responses were insignificant during the first 4 months of the COVID-19 pandemic. 7
On 1 May 2020, total COVID-19 inflections (deaths) stood at 35,043 (1,147) and 10,118 (792) in India and Indonesia, rising, respectively, to 10,639,684 (153,184) and 965,283 (27,453) by 22 January 2021.
Additional SVAR Results for India and Indonesia: COVID-19 Effects over the Period from 2 May 2020 to 22 January 2021.
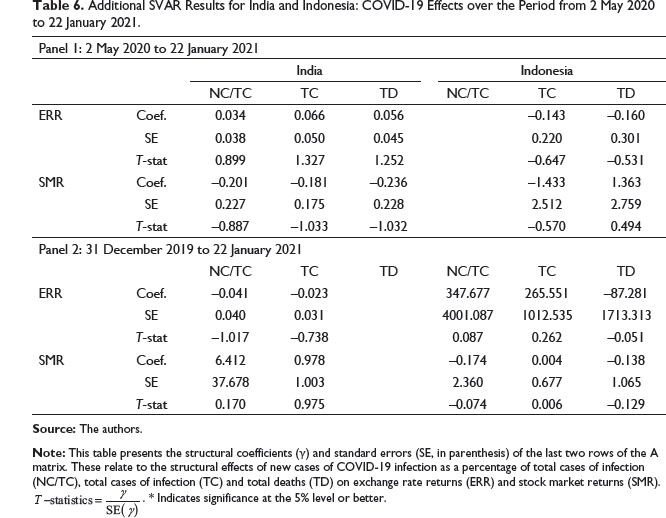
Additional SVAR Results for India and Indonesia: COVID-19 Effects over the Period from 2 May 2020 to 22 January 2021.
This study investigates the influence of COVID-19 cases in seven Southeast and East Asian countries on their US-based foreign exchange and equity markets in the first 4 months of the pandemic. An SVAR model was developed to allow for the endogenous relationships between these two markets in the investigation of the impact of COVID-19 shock. The study finds that the impact of COVID-19, measured in terms of total cases of infection, total deaths or new cases as a ratio of total cases in the seven Asian countries, had varying effects. Until 1 May 2020, COVID-19 significantly diminished Indonesia’s equity market returns, depreciated India’s rupee against the US dollar and improved equity prospects in South Korea. In all other cases, the pandemic failed to leave a significant mark on the exchange rate and stock markets by close of trade on 1 May 2020. It suggests that much of the major day-to-day impact of COVID-19 structural shocks on the US-based exchange rate and MSCI-based stock equities were temporary in nature. Our impulse response analysis confirms that COVID-19 shocks in the first 4 months of the pandemic were strongly transitory in nature, and, while both markets showed reactions to COVID-19 shocks, they were able to recover within a few days.
Overall, countries, which displayed most vulnerability during the first 4 months of the COVID-19 pandemic, saw significant deterioration of some of their key financial markets. India and Indonesia are two such examples. However, the daily market effects of the COVID-19 pandemic in its first 4 months were transitory in nature, lasting only few days. Additional analyses suggest that the equity and US-based foreign exchange markets of the two countries became (or remained) resilient in the face of growing cases of COVID-19 inflections and deaths in India and Indonesia over the recent months (2 May 2020 to 22 January 2021).
Appendix A
SVAR Variables: Definitions and Sources of Data.
Unit Root Test Results.