
Abstract
In the face of mounting protectionist sentiments, aggravated further due to COVID-19, India is redefining its trade policy. This is evident from the fact that India has decided to not join the mega-trade deal, Regional Comprehensive Economic Partnership (RCEP), giving in to the concern of massive trade deficit with China and other countries of the Association of South East Asian Nations (ASEAN). This stance is complete opposite to India’s ‘Look East Policy’. Instead, India is looking for closer trade ties with the United States (US) and the European Union (EU). In this context, this article evaluates the performance of India’s trade, in general, as well as with its Eastern (ASEAN, China, RCEP) and Western partners (US and EU), on its industrial sector employment. Employment is a better measure than trade deficit because employment gives a picture of both growth and distributional aspects of trade effects. Using a dynamic econometric model in a panel framework, it is found that, in general, while export intensity had favourable impact, import penetration had a detrimental impact on industrial sector employment during 1996–1997 to 2016–2017. Region wise analysis shows that trade with ASEAN has been employment enhancing while that with China had a negative impact on employment. On the East versus West looking trade policy debate, analysis suggests that the long run impact of exports, to both the West (EU plus USA) and the East (RCEP) partners, on employment is positive. Also, contrary to the mainstream view, the negative effects of imports, on industrial sector employment, from RCEP appears to be insignificant than that associated with imports from the EU plus USA. Thus, trade agreements with the EU and the US cannot be a substitute for dis-engaging with the resilient Eastern partners. Rather, India should strengthen its trade prospects with its East Asian partners and simultaneously look for export market in the West to enhance its employment creation.
Introduction
One of the unprecedented consequences of COVID-19 pandemic is the fanning of protectionist sentiments across that world, the rising flames of which were visible in the wake of US–China trade war, attack on World Trade Organisation, etc. In such times, India’s commitment to steady and progressive trade liberalisation (since 1991) is also being tested. Recently, India pulled out of the Regional Comprehensive Economic Partnership (RCEP) trade negotiations, primarily because of India’s ballooning trade deficit with China and other members of the RCEP. India is, lately, targeting cheaper imports from China. It seems India is giving in to growing protectionist stance, which is all the more evident from its clarion call to self-reliance. The precipitating factor for such an inward-looking policy stance, especially towards the Asian countries, is the view that trade agreements, as a result of India’s Look East Policy, have benefited only the partner countries—partner countries have successfully reduced their import –export ratio, while India’s exports to these countries have remained muted (Saraswat et al., 2018). Nonetheless, India is working towards concluding free trade agreement (FTA) with the United States (US) and the European Union (EU), particularly after plugging out of the RCEP. Is India now looking ‘West’? Will this dealignment from the East be beneficial? What should be India’s trade policy, going forward, given the current global trade scenario?
In this context, the objective of this article is to examine the overall impact of trade as well as the differential impact of trade with India’s major Eastern and Western trade partners. Unlike the recent study by Saraswat et al. (2018), where the assessment of trade performance was gauged in terms of trade balance, I shall focus the research lens on employment in industrial sector. An assessment of the impact of trade on the employment in India’s industrial sector is crucial for two reasons. First, unemployment is an issue that ails Indian economy, with growth rate of employment in recent times being as low as 1 per cent (Aggarwal & Goldar, 2019). This has been exacerbated by creation of limited employment opportunities in the traditional, labour-intensive manufacturing sector (Aggarwal & Goldar, 2019). Hence, generation of employment is an important concern among policy makers.
Second, while trade deficit indicator gives an idea on the performance of trade in absolute terms, employment figures capture both the growth and distributional aspects of trade-effects. Yet, in the Indian context, literature on the effects of trade on employment is limited and inconclusive. Some studies found that trade, particularly exports, and trade reforms had a positive impact on manufacturing employment (Banga, 2005; Ghose, 2000; Goldar, 2009; Hasan et al., 2007), while other studies found import competition had detrimental effect on employment generation (Paul, 2014; Rajesh Raj & Sasidharan, 2015; Rajesh Raj & Sen, 2012) and export did not have any significant impact on employment (Rajesh Raj & Sasidharan, 2015; Sen, 2009).
Using industry-level panel data for the period from 1996–1997 to 2016–2017, the contribution of this study is to inform debate on the topical trade policy issues, namely, whether trade enhances employment, should India engage more with its Eastern trade partners (as envisaged in the ‘look East policy’) or should India now ‘look West’? Empirically, the advantage of using a panel data set up lies in the fact that dynamic aspects of trade and employment linkages as well as the short and long run impact of trade on employment can be studies.
The remainder of the article is organised as follows. In the next section, discussion on the theoretical literature on the link between trade and employment and the theoretical basis of the model employed in the study are presented. In Section 3, the sources of data used, and construction of variables are discussed. Section 4 carries out the panel diagnostic tests and elaborates on the empirical issues in estimating the model. Section 5 presents the empirical results and Section 6 concludes the discussion and provides policy implications.
Theoretical Underpinnings and Empirical Model
Theoretically, scale effect, composition effect and process effect (Sen, 2009) are the three channels by way which trade can impact industrial sector employment (Sen, 2009). The scale effect of trade on employment works via total output of the industrial sector. On one hand, higher exports lead to an increase in level of output and therefore, raise employment level. On the other hand, greater import penetration reduces output leading to displacement of labour (Sen, 2009).
The composition effect of trade can be explained using the standard two-factor Heckscher–Ohlin (HO) model of trade. The HO model predicts that labour-abundant developing countries will export labour-intensive goods and import relatively higher capital-intensive commodities. Thus, trade will increase the demand for labour-intensive commodities which, in turn, will lead to higher demand for labour and greater employment prospects for the trading country.
Finally, the process effect of trade is based on the Stopler–Samuelson theorem. The theorem postulates that greater trade openness leads to a change in relative factor demand which changes relative factor prices leading to factor substitution in production. Additionally, trade-induced productivity effects can also affect manufacturing employment. Trade-induced competitive pressure can force firms to use labour-saving technologies (Greenaway et al., 1999). Such productivity effects can be due to a decrease in x-inefficiency (Chand & Sen, 2002) or due to technological transfers (Jenkins & Sen, 2006).
Empirically, there are three methodological approaches to study the impact of trade on employment. These are factor content, growth accounting and labour demand approaches. The factor-content approach examines whether a change in production structure due to greater trade openness leads to an increase in the labour intensity of production and therefore, employment. To accomplish this, direct and indirect labour requirements per unit of export and import-substitutes are calculated. The factor content approach captures the composition effect of trade on employment (Rajesh Raj & Sasidharan, 2015).
The growth accounting approach measures the scale effect of trade on employment (Rajesh Raj & Sasidharan, 2015). Under this approach, changes in employment are decomposed into the effects of changes due to domestic demand, exports, imports and productivity. It is assumed that increased export orientation generates employment whereas increased import penetration reduces employment. The labour demand approach captures the process effect of trade on employment. To do this, industry-level labour demand equations are estimated, where industry-level employment is regressed against a bunch of explanatory variables (Greenaway et al., 1999; Hine & Wright, 1998).
Earlier studies on the link between trade and employment in the Indian context have mostly focused on the employment outcome of trade via productivity effects of trade (Goldar, 2009; Mitra, 2011; Malik & Mitra, 2018; Maiti, 2019; Vashisht, 2016, etc.). In this article, we are interested in impact of India’s trade on its employment in the industrial sector as measured by labour demand in the sector. To estimate the impact of trade on labour demand, following Greenway et al. (1999), we adopt a regression-based approach grounded in a dynamic model of labour demand,
1
derived from Cobb–Douglas production function:

where i represents industry and t represents time. In equation (1), q is real output, k is the capital stock, l is the units of labour employed in production and A is total factor productivity term and α and β are the output elasticities of capital and labour, respectively.
Assuming perfectly competitive labour markets and solving the first-order profit maximisation for labour yields

where p is the domestic price of the output and w is the wage earned by labour.
By substituting (1) into (2), we get

and solving (3) for labour demand of industry i at time t we get:

Equation (4) conditions labour demand on capital stock and output is allowed to vary with changes in domestic prices associated with changes in trade as this could be a crucial channel through which trade affects labour demand at industry level (Castro et al., 2007). 2
It is expected that over time the total factor productivity increases with the rate of technology adoption and increases in x-efficiency (Chand & Sen, 2002). Now, both technological adoption and reduction of x-inefficiency are correlated to trade openness, therefore

where
Substituting (5) into (4) and taking logs we get following equation which forms the basis for our empirical specification:

Augmented versions of this model, adding the trade shares of India’s trade partners in Equation (6), will also be estimated to assess the marginal impact of imports from and exports to the partners.
Preparing the Database for our study
Given the empirical specification, our study requires industry wise annual statistics on India’s trade (exports and imports) with its trading partners in industrial goods, the measure of industrial output, that is, value added, and on employment, capital stock and wages for India’s industrial sector. The period of our study is 1996–1997 to 2016–2017. The data on India’s bilateral trade with its partners is sourced from the Trade Statistics of Ministry of Commerce and Industry (MoCI) which compiles and publishes the export and import data on merchandise goods for registered manufacturing sectors. I have collected the data on value added and capital stock at constant 2011–2012 prices (in Rs. crore) and employment (in 1000s) from India KLEMS database, the latest version of which is available as of 2019. 3 The source of data on wages is the Annual Survey of Industries (ASI), taken from Centre for Monitoring Indian Economy Pvt Ltd. database. As the industrial classification codes for the data pertaining to the variables of interest differ, first, I have to do an extensive mapping exercise so as to make all the data compatible and classified according to a single nomenclature. In brief, I want to map merchandise exports (which are goods, coded as per Harmonised System (HS)) to industries (which are classified by National Industrial Classification (NIC) code in India). Finally, it is necessary to make the data defined in accordance with India KLEMS industry codes for carrying out regression analysis. The step by step process of mapping is explained in the following paragraphs.
First, the ASI classifies manufacturing activities according to the NIC schedule, which in turn is based on International Standard Industrial Classification (ISIC) nomenclature of the United Nations. The period of study is from 1996–97 to 2016–17, during which the NIC nomenclature has been restructured three times, namely NIC-1998, NIC-2004 and NIC-2008 which follow the ISIC rev 3, ISIC rev3.1 and ISIC rev4, respectively. Using the three concordance tables provided by the ASI, namely, NIC-1998, NIC-2004 and NIC-2008, 4 and the concordance table between ISIC rev 3 and ISIC rev 4 5 provided by United Nations Statistical Division, a consistent time series of 15 industrial sector at 2-digit level corresponding to ISIC rev 3 covering broad industry groups is built.
Second, the MoCI adopts the Harmonised Commodity Description and Coding System (HS) for commodity classification and provides trade statistics according to HS nomenclature. As trade and industry statistics are reported according to different nomenclatures, namely, HS code and ISIC rev 3, respectively, industry-trade concordance exercise is also required for the study. To do this, trade data with the HS code nomenclature is mapped with to ISIC rev 3 codes using a concordance table accessed from World Integrated Trade Solution, 6 using minimum discretion where perfect match was not available.
Lastly, in order to make industrial classification of all the variables aligned to India’s KLEMS code, I first use the concordance table between NIC code and KLEMS industry code, available in India’s KLEMS manual, and convert the NIC codes (which are now in ISIC rev 3 codes) into KLEMS industry code with minimum discretion. Next, the HS codes (which are now in ISIC rev 3 codes) are made compatible with India’s KLEMS industry nomenclature, using minimum discretion. 7 Thus, the industry classification codes for the entire dataset is now in accordance with KLEMS.
To get a bit more insight into the nature of the industries, I have re-organised and grouped the 15 industries, classified according to the KLEMS industry code, into labour-intensive and non-labour-intensive industries. For dividing the industries into labour- and non-labour-intensive industries, I start with the basic idea that an industry that requires a large amount of labour as compared to capital for production is a labour-intensive industry, that is, if the labour cost outweighs the capital cost, the production process is said to be labour-intensive as the major cost incurred by the industry is cost of paying the workers. Using this premise, I calculate the following ratio for each industry:
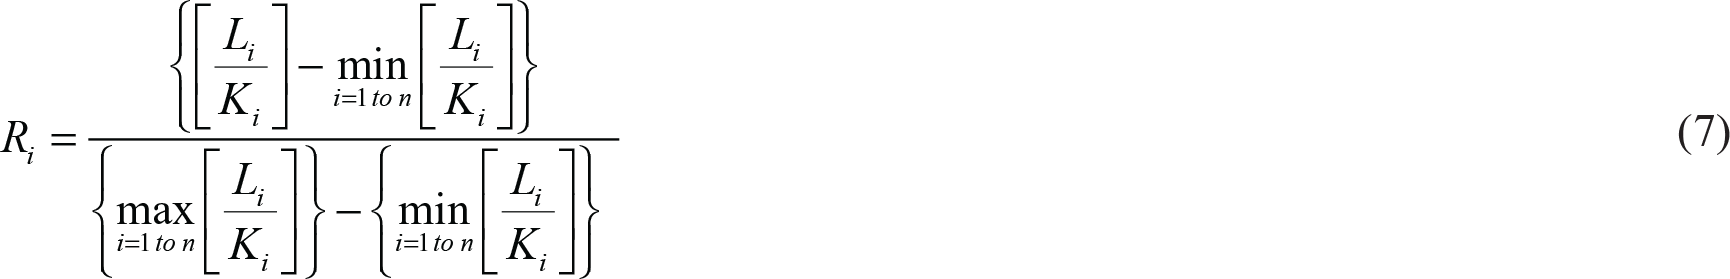
List of Industries Included in the Sample
Construction of Trade related Indices
To study the impact of trade on India’s industrial sector employment, we constructed trade related variables such as import penetration index and export intensity for a panel of 15 industrial sectors for the period 1996–1997 to 2016–2017. We use trade indices rather than absolute values of exports and imports because export intensity and import penetration indices measure the performance and importance of exports and imports respectively.
The import penetration index (IMP) for industrial sector i in year, t is defined as the ratio of total imports to domestic demand (i.e., the difference between output and exports):

where M represents value imports, X represents value exports and Q represents output or the total value added.
The export intensity (EXI) is defined as the ratio of total exports for sector i in year t to total production of that sector in year t:

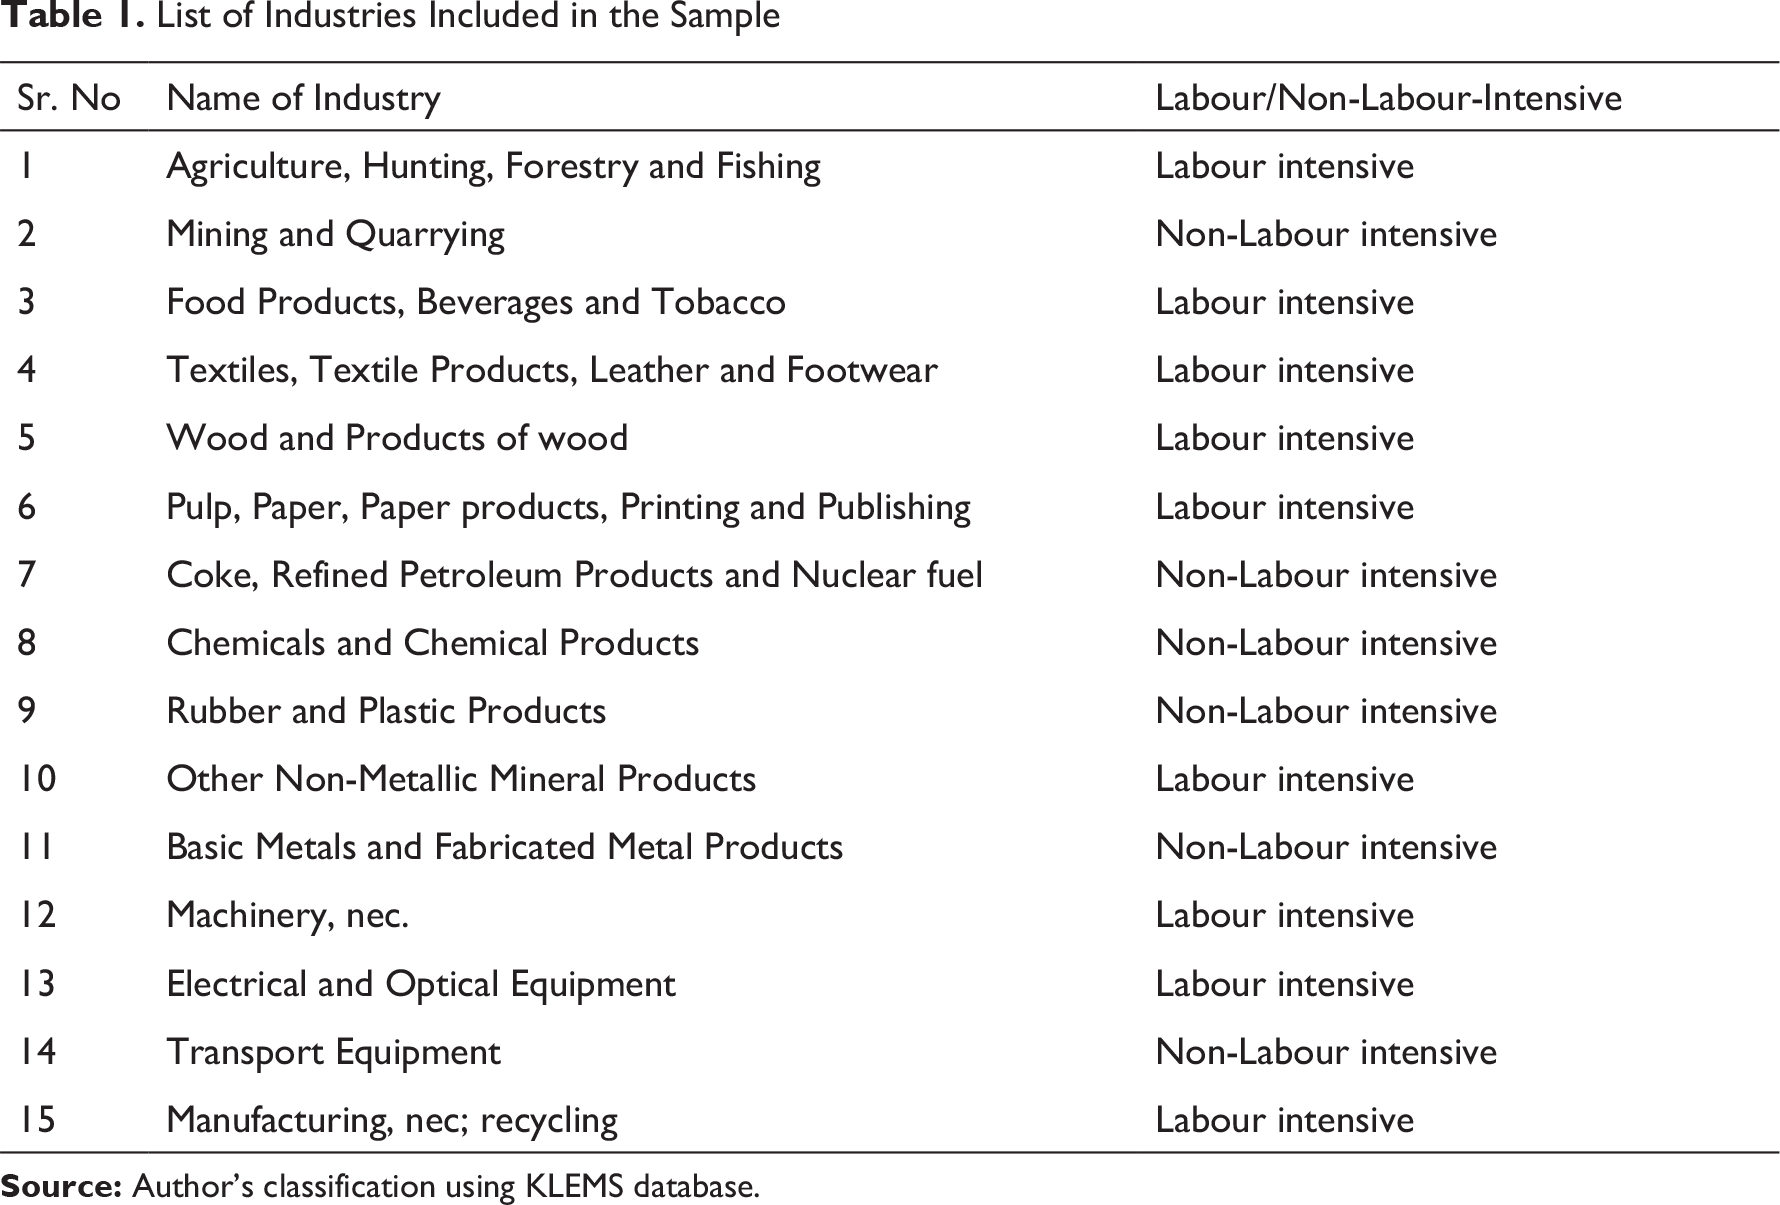
Summary Statistics of Variables
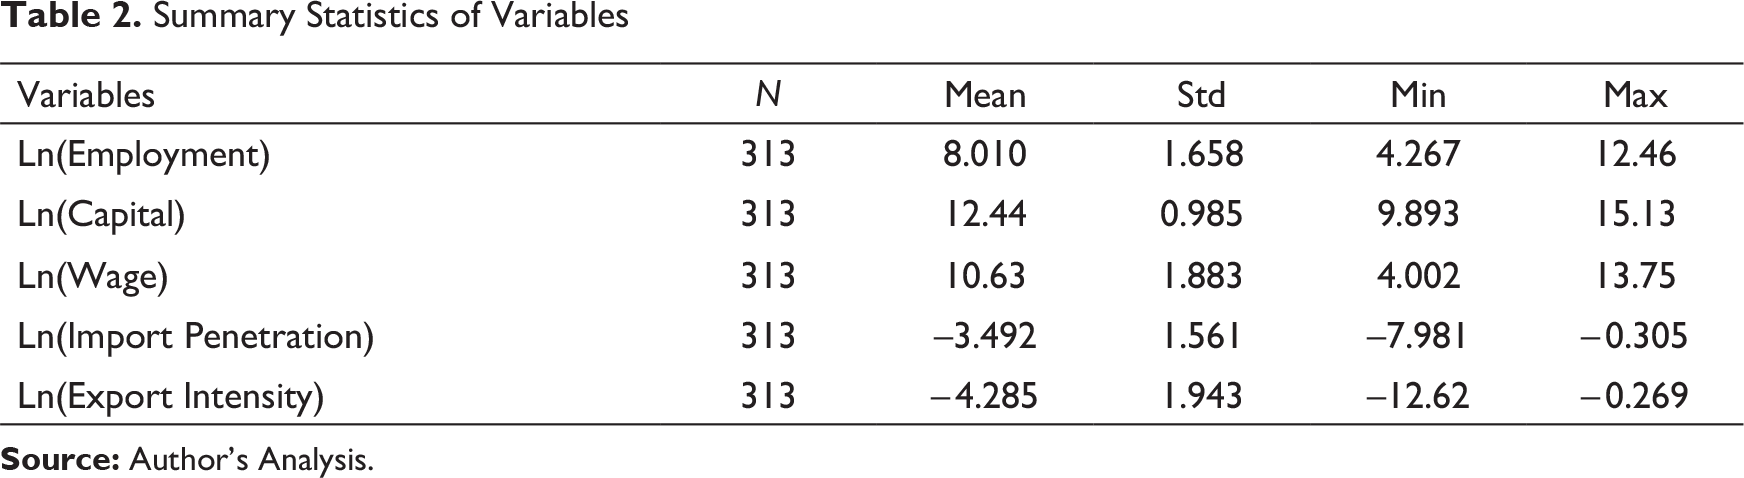
The occurrence of cross-section dependence is common in macro panels, with higher time dimension, (Pesaran & Smith, 1995). Cross-section dependence (CSD) may arise when the cross-sectional dimensions, that is, industries react in the same manner to a given shock. To assess the presence of CSD, Pesaran (2004) cross-sectional dependence (CD) test is applied and the result is reported in Table 3. The result shows a failure to reject the null of cross independence.
Results of Cross-Sectional Dependence Test
Results of Cross-Sectional Dependence Test
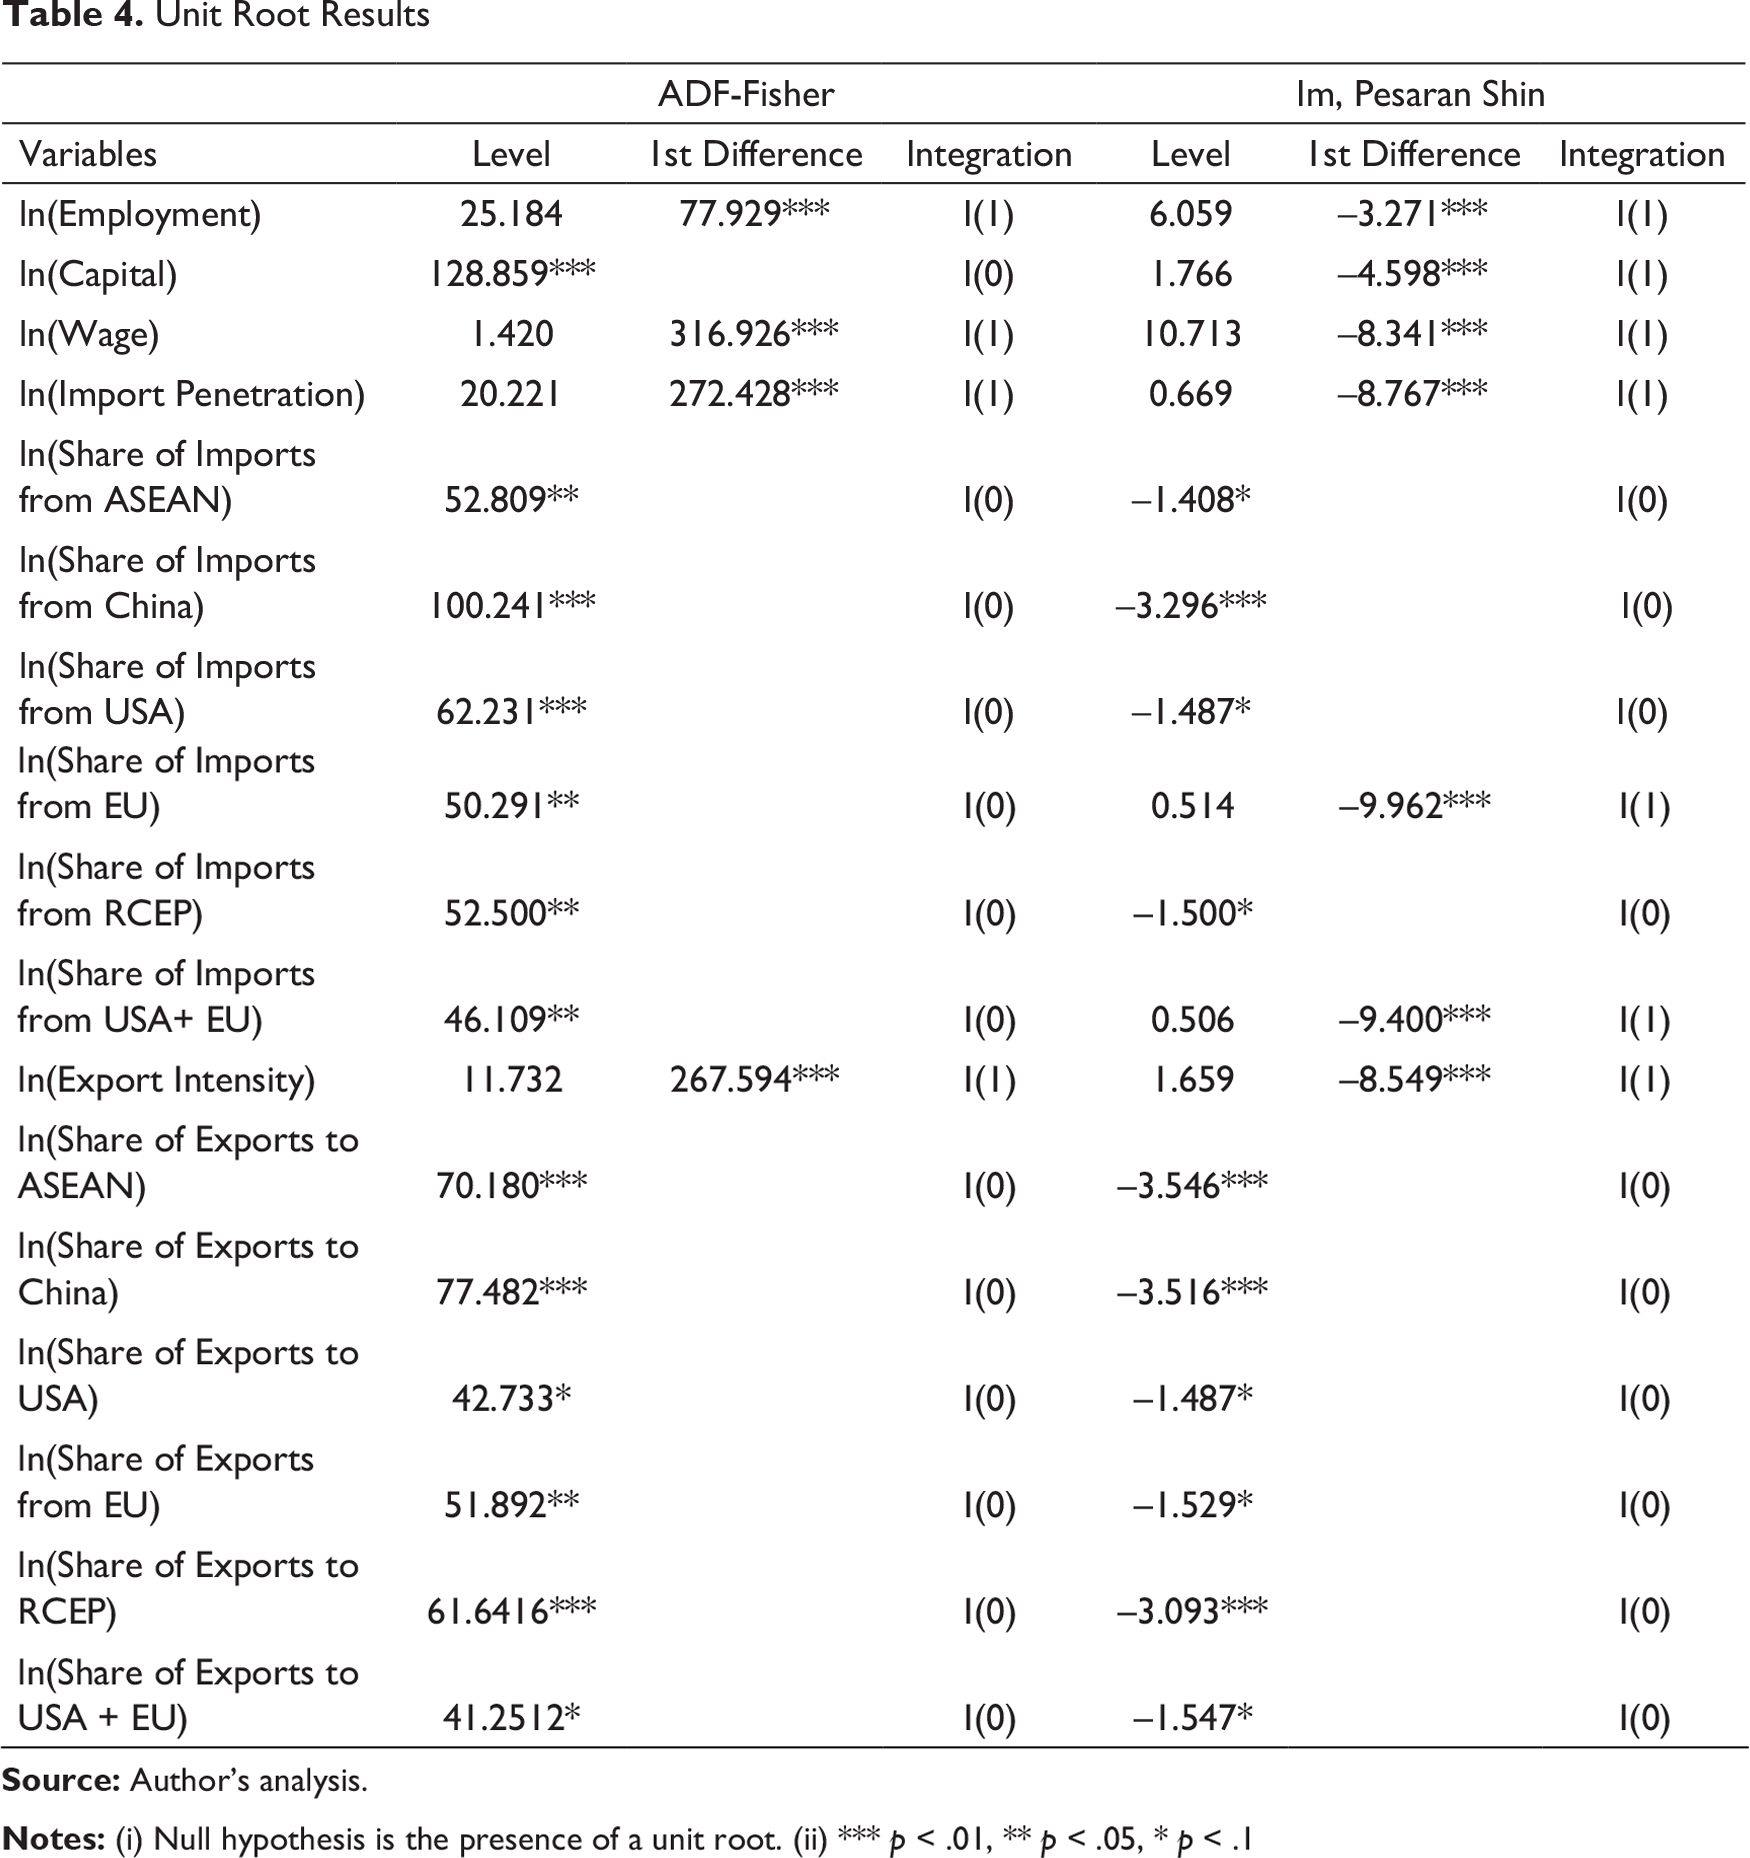
Unit Root Results
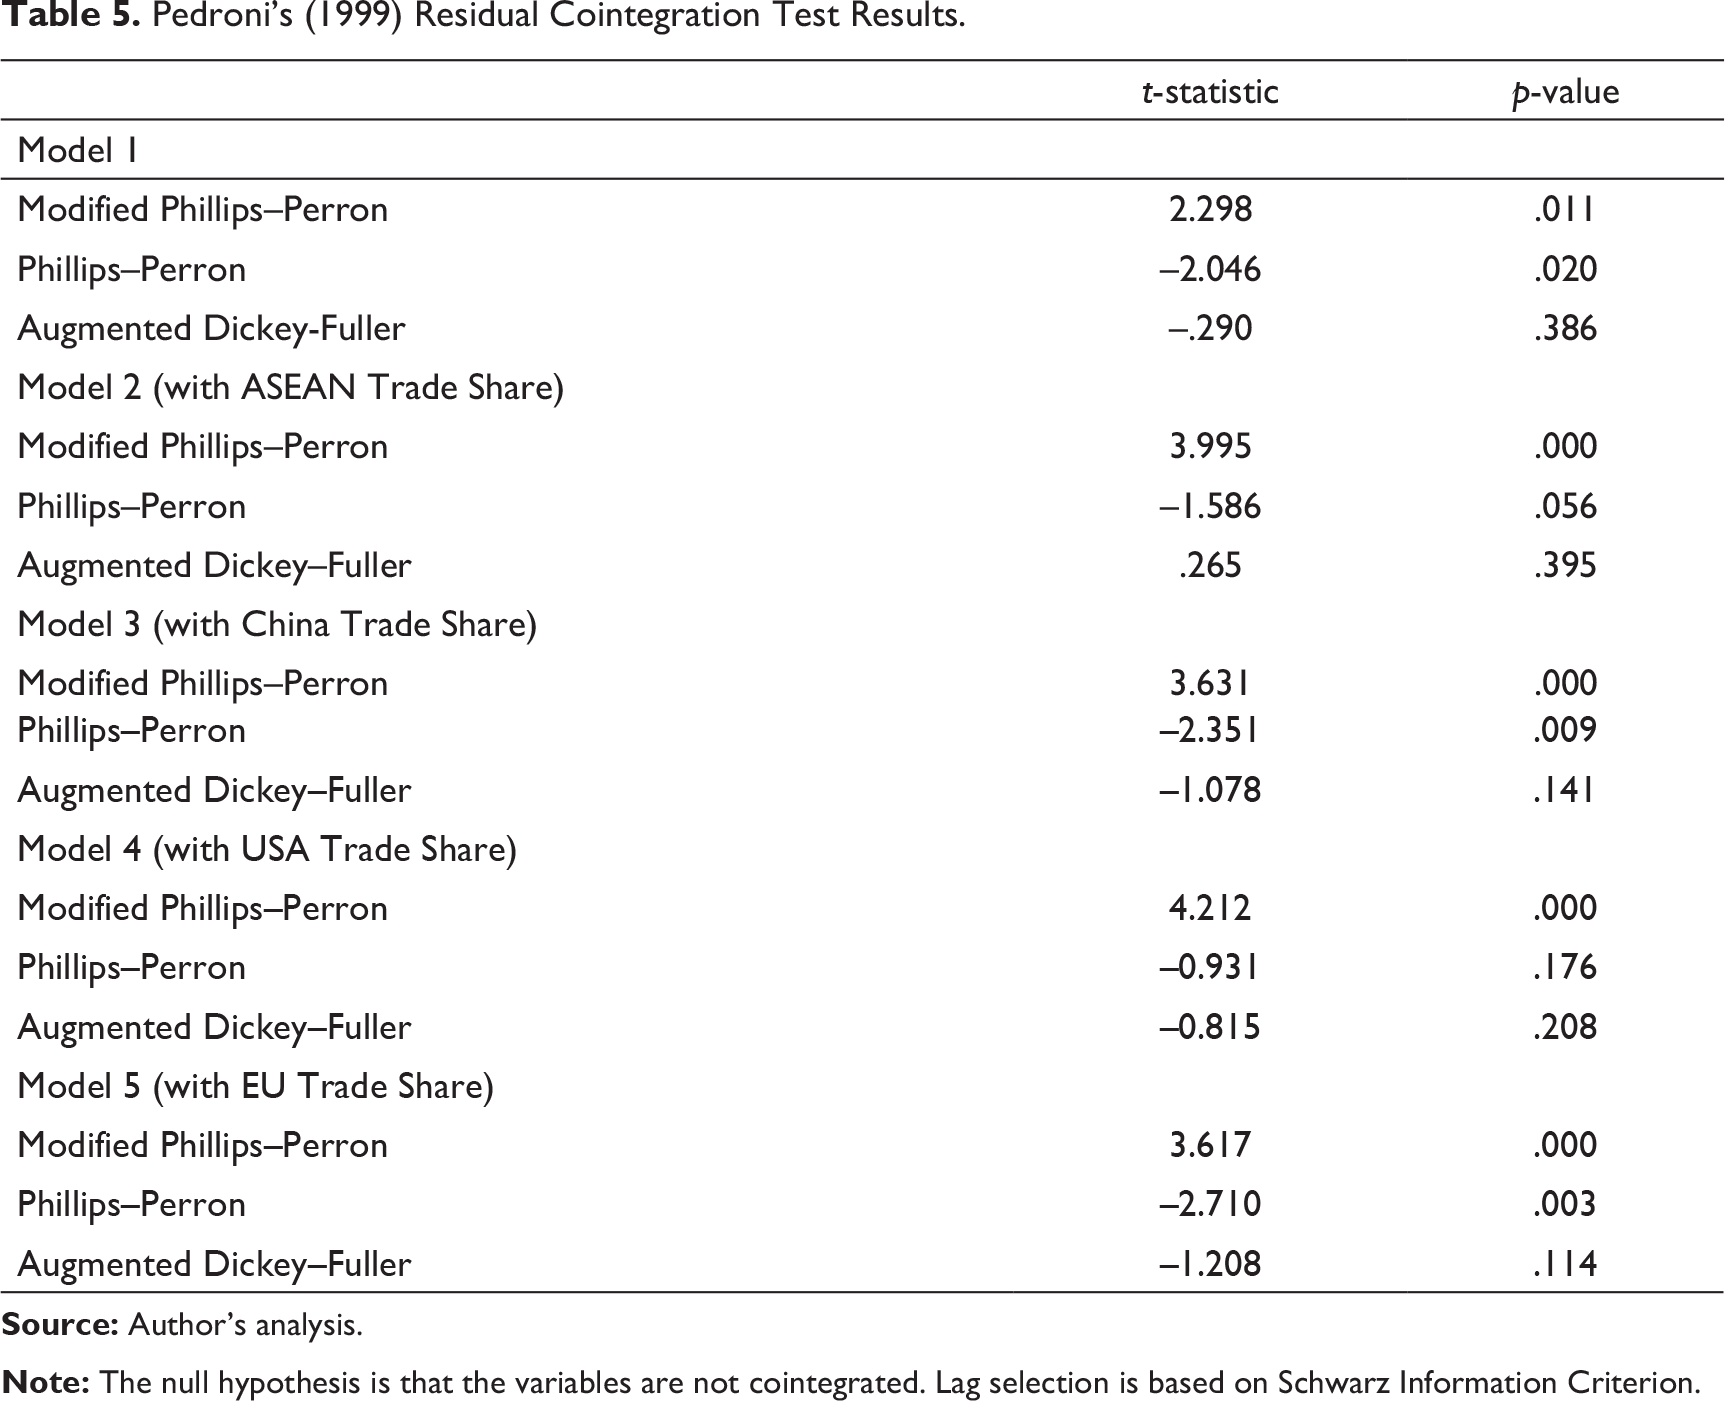
Pedroni’s (1999) Residual Cointegration Test Results.
Kao’s (1999) Residual Cointegration Test Results.
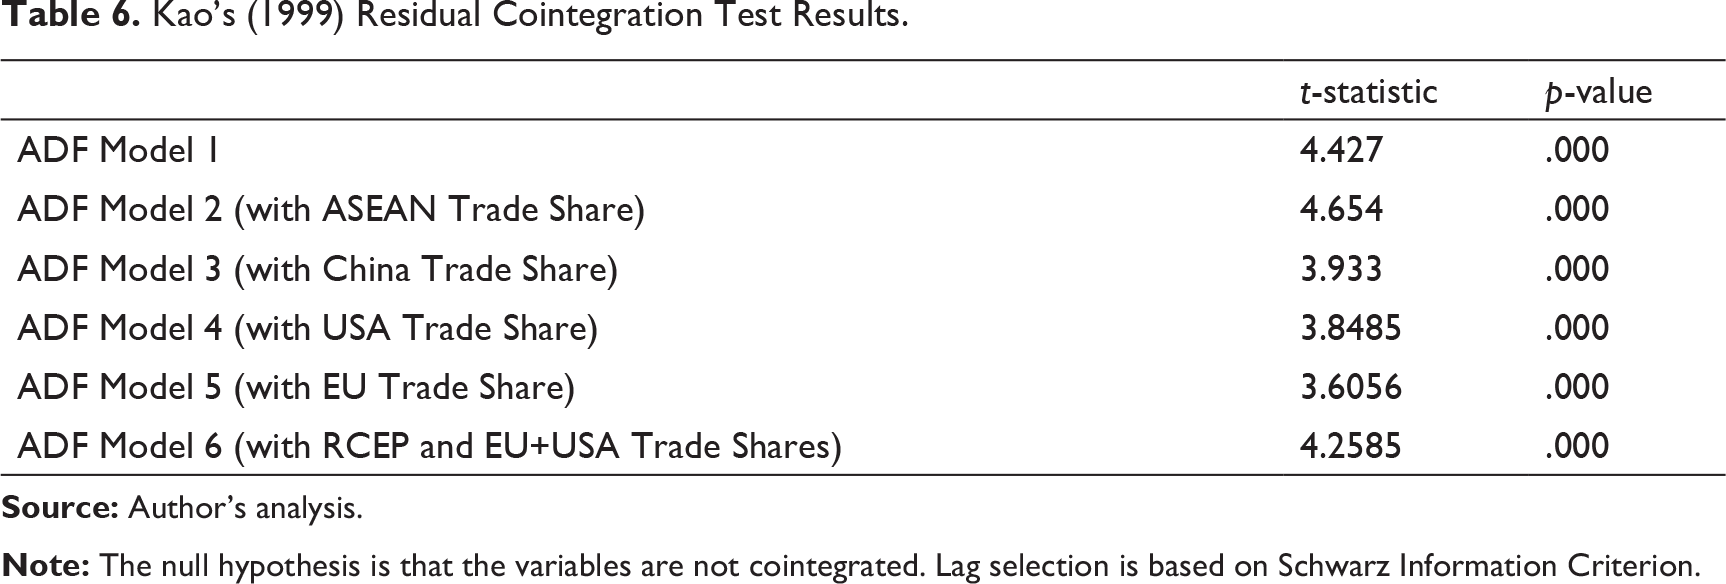
Both the cointegration tests rejects the null hypothesis of no cointegration, thus supporting the presence of long-run equilibrium relationship between the variables. Now, in order to estimate the magnitude of cointegration in terms of coefficients, panel autoregressive distributed lag (ARDL) modelling technique that allows for the presence of mixed I(0) and I(1) variables needs to be employed.
Therefore, I adopt an estimation approach of Pooled Mean Group (PMG), which is a panel ARDL technique proposed by Pesaran and Smith (1995, 1999), to explore the short run and long run dynamics between the dependent variables and its explanatory variables. The econometric equation is defined as follows:
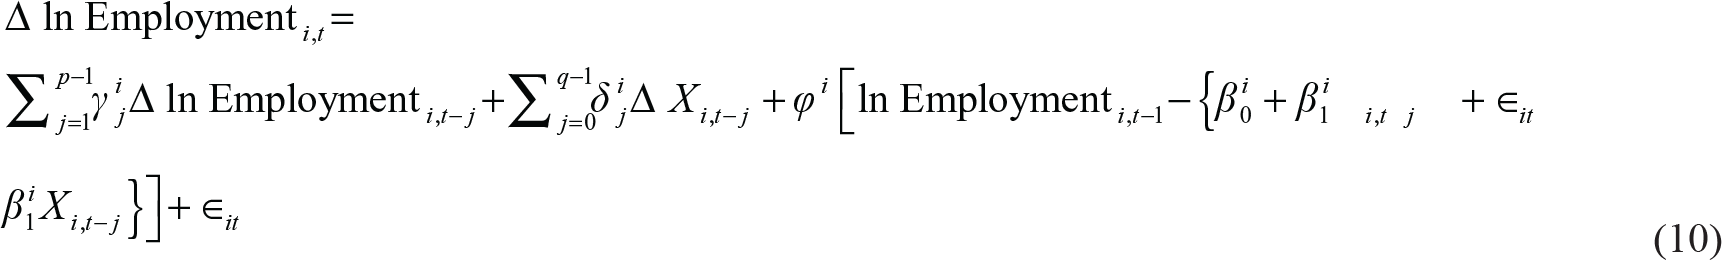
where i denote industries, t stands for time period, p represents lag length of dependent variable, q denotes the lag length of independent variables, ln Employment is the natural logarithm of industrial sector employment, X is the vector of explanatory variables such as ln(Capital), ln(Wage), import penetration and export penetration. γ denotes lag coefficient of Employment variable, δ represents the short-run coefficients of explanatory variables which vary across industries, φ is the coefficient of speed of adjustment to the long-run equilibrium, and β denotes the long-run coefficients that are homogenous across industries. These coefficients are derived from Equation (11).

The PMG-ARDL technique has a number of econometric advantages relative to other traditional panel estimation techniques. First, it accommodates the endogeneity issues in econometric modelling. It will control for potential endogeneity, in this case, arising out of the fact that the labour employment is likely to show inertia of variables, by introducing optimal lag length of the variables. The PMG-ARDL technique also remains robust to lag orders and outliers (Pesaran et al., 1999).Second, it is appropriate for heterogenous dynamic industry-specific panel data where long-run is characterised by conditions expected to be homogenous across industries while the short-run adjustment depends on industry-specific factors such as wage-price flexibility, vulnerability to domestic and external shocks and government policies. It estimates both long- and short-run coefficients simultaneously. Finally, as discussed earlier, PMG-ARDL technique is flexible in terms of its application in case of mixed order of cointegration—be it I(0) or/ and I(1). Since an appropriate ARDL lag-structure should be determined by some consistent information criterion, we impose the lag structure (1,1,1,1,1) for employment, capital stock, wages, export intensity and import penetration, respectively, which is based on the Schwartz Bayesian criterion.
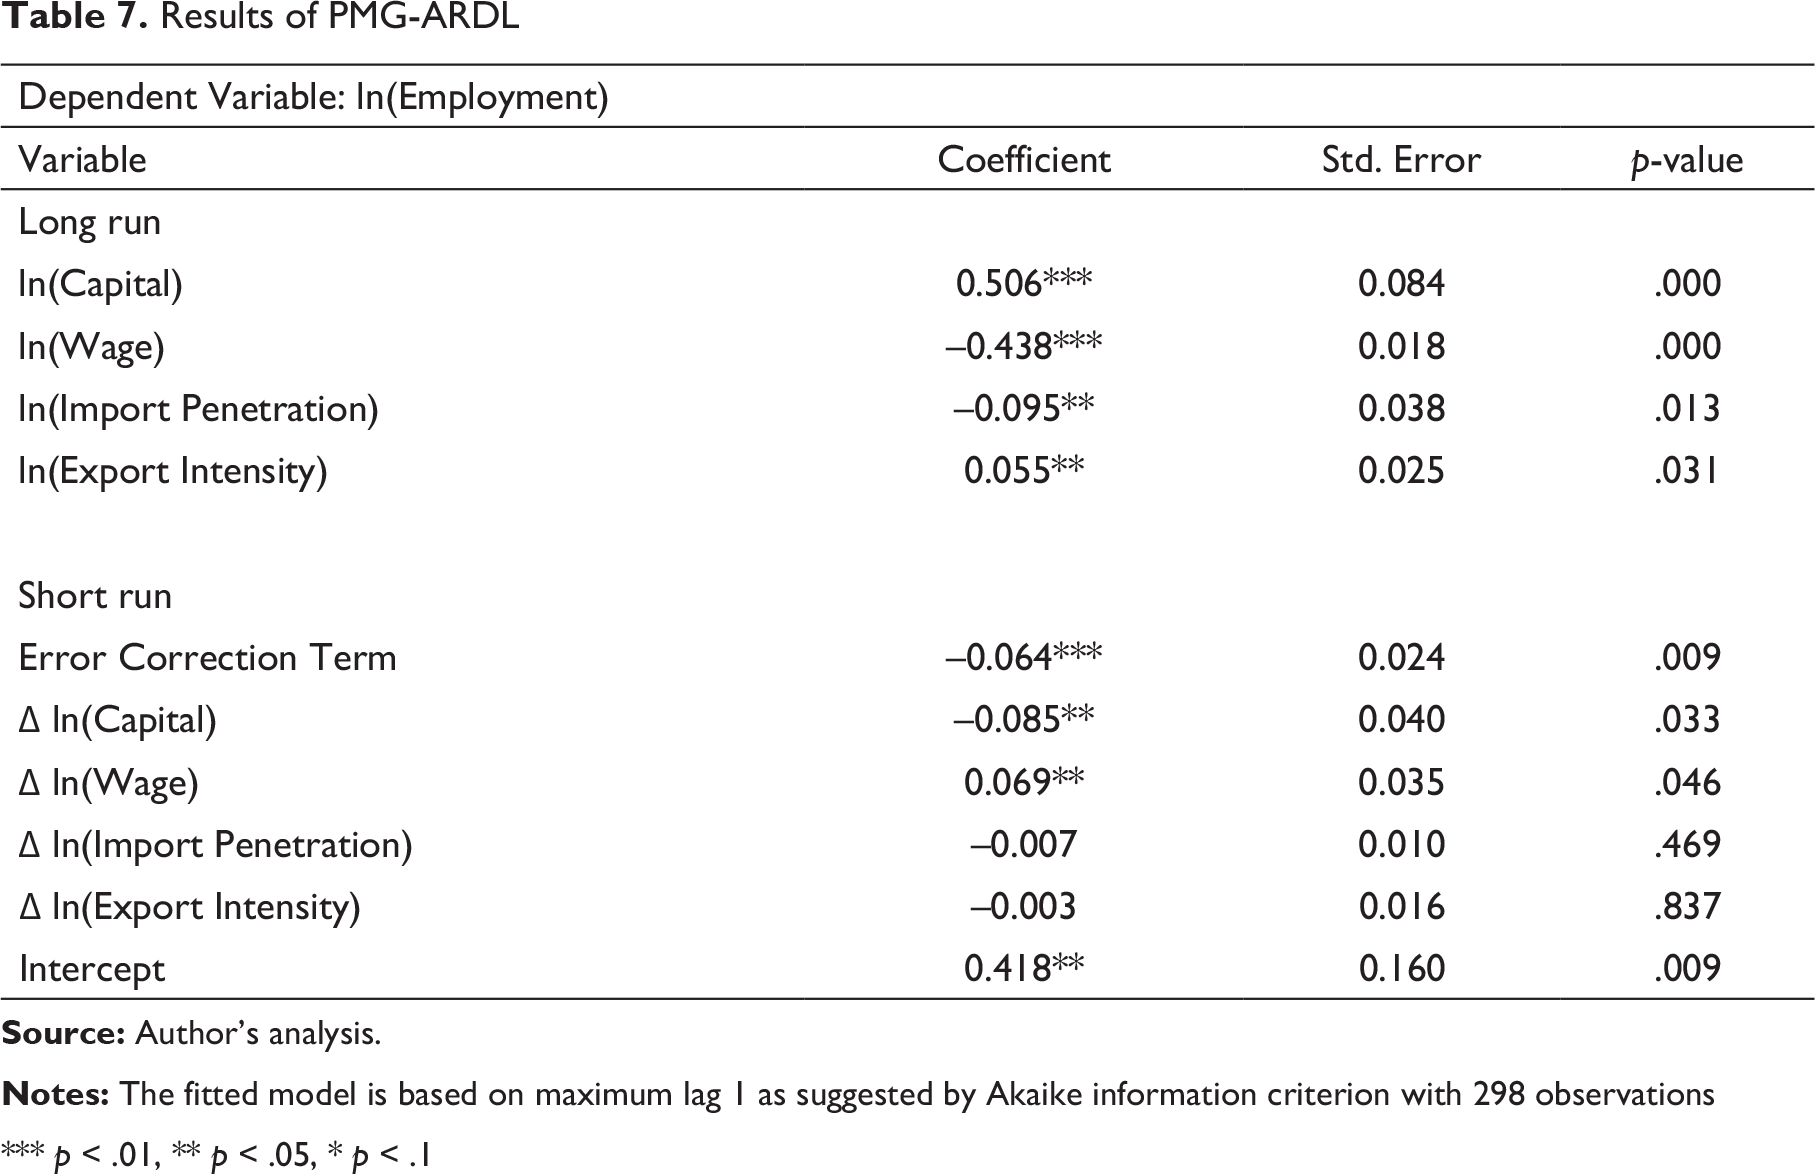
Table 7 reports the results of PMG estimations for the base model. In Table 7, the independent variables converge to their long-run path by a magnitude −0.064, which is statistically significant at 1 per cent level, thereby, affirming the equilibrium relationship between the variables. The results indicate that while import penetration has a negative and significant impact on industrial sector employment in India in the long run, export intensity has a positive and significant impact on employment in the long run. 8 In the short run, both import penetration and export intensity are negatively related to employment. This finding corroborates with Dutt et al. (2009) who found that unemployment rose in the short run as a response to trade liberalisation. In the long run, the authors found a reversal of that rise and an ensuing decline in unemployment. However, in the short run, neither import penetration nor export intensity has any significant impact on employment. 9 The economic intuition for getting insignificant short run coefficient is that the impact of any economic shock, such as trade, can only be significantly observed with lag, that is, in the long run.
Results of PMG-ARDL
Results of PMG-ARDL
*** p < .01, ** p < .05, * p < .1
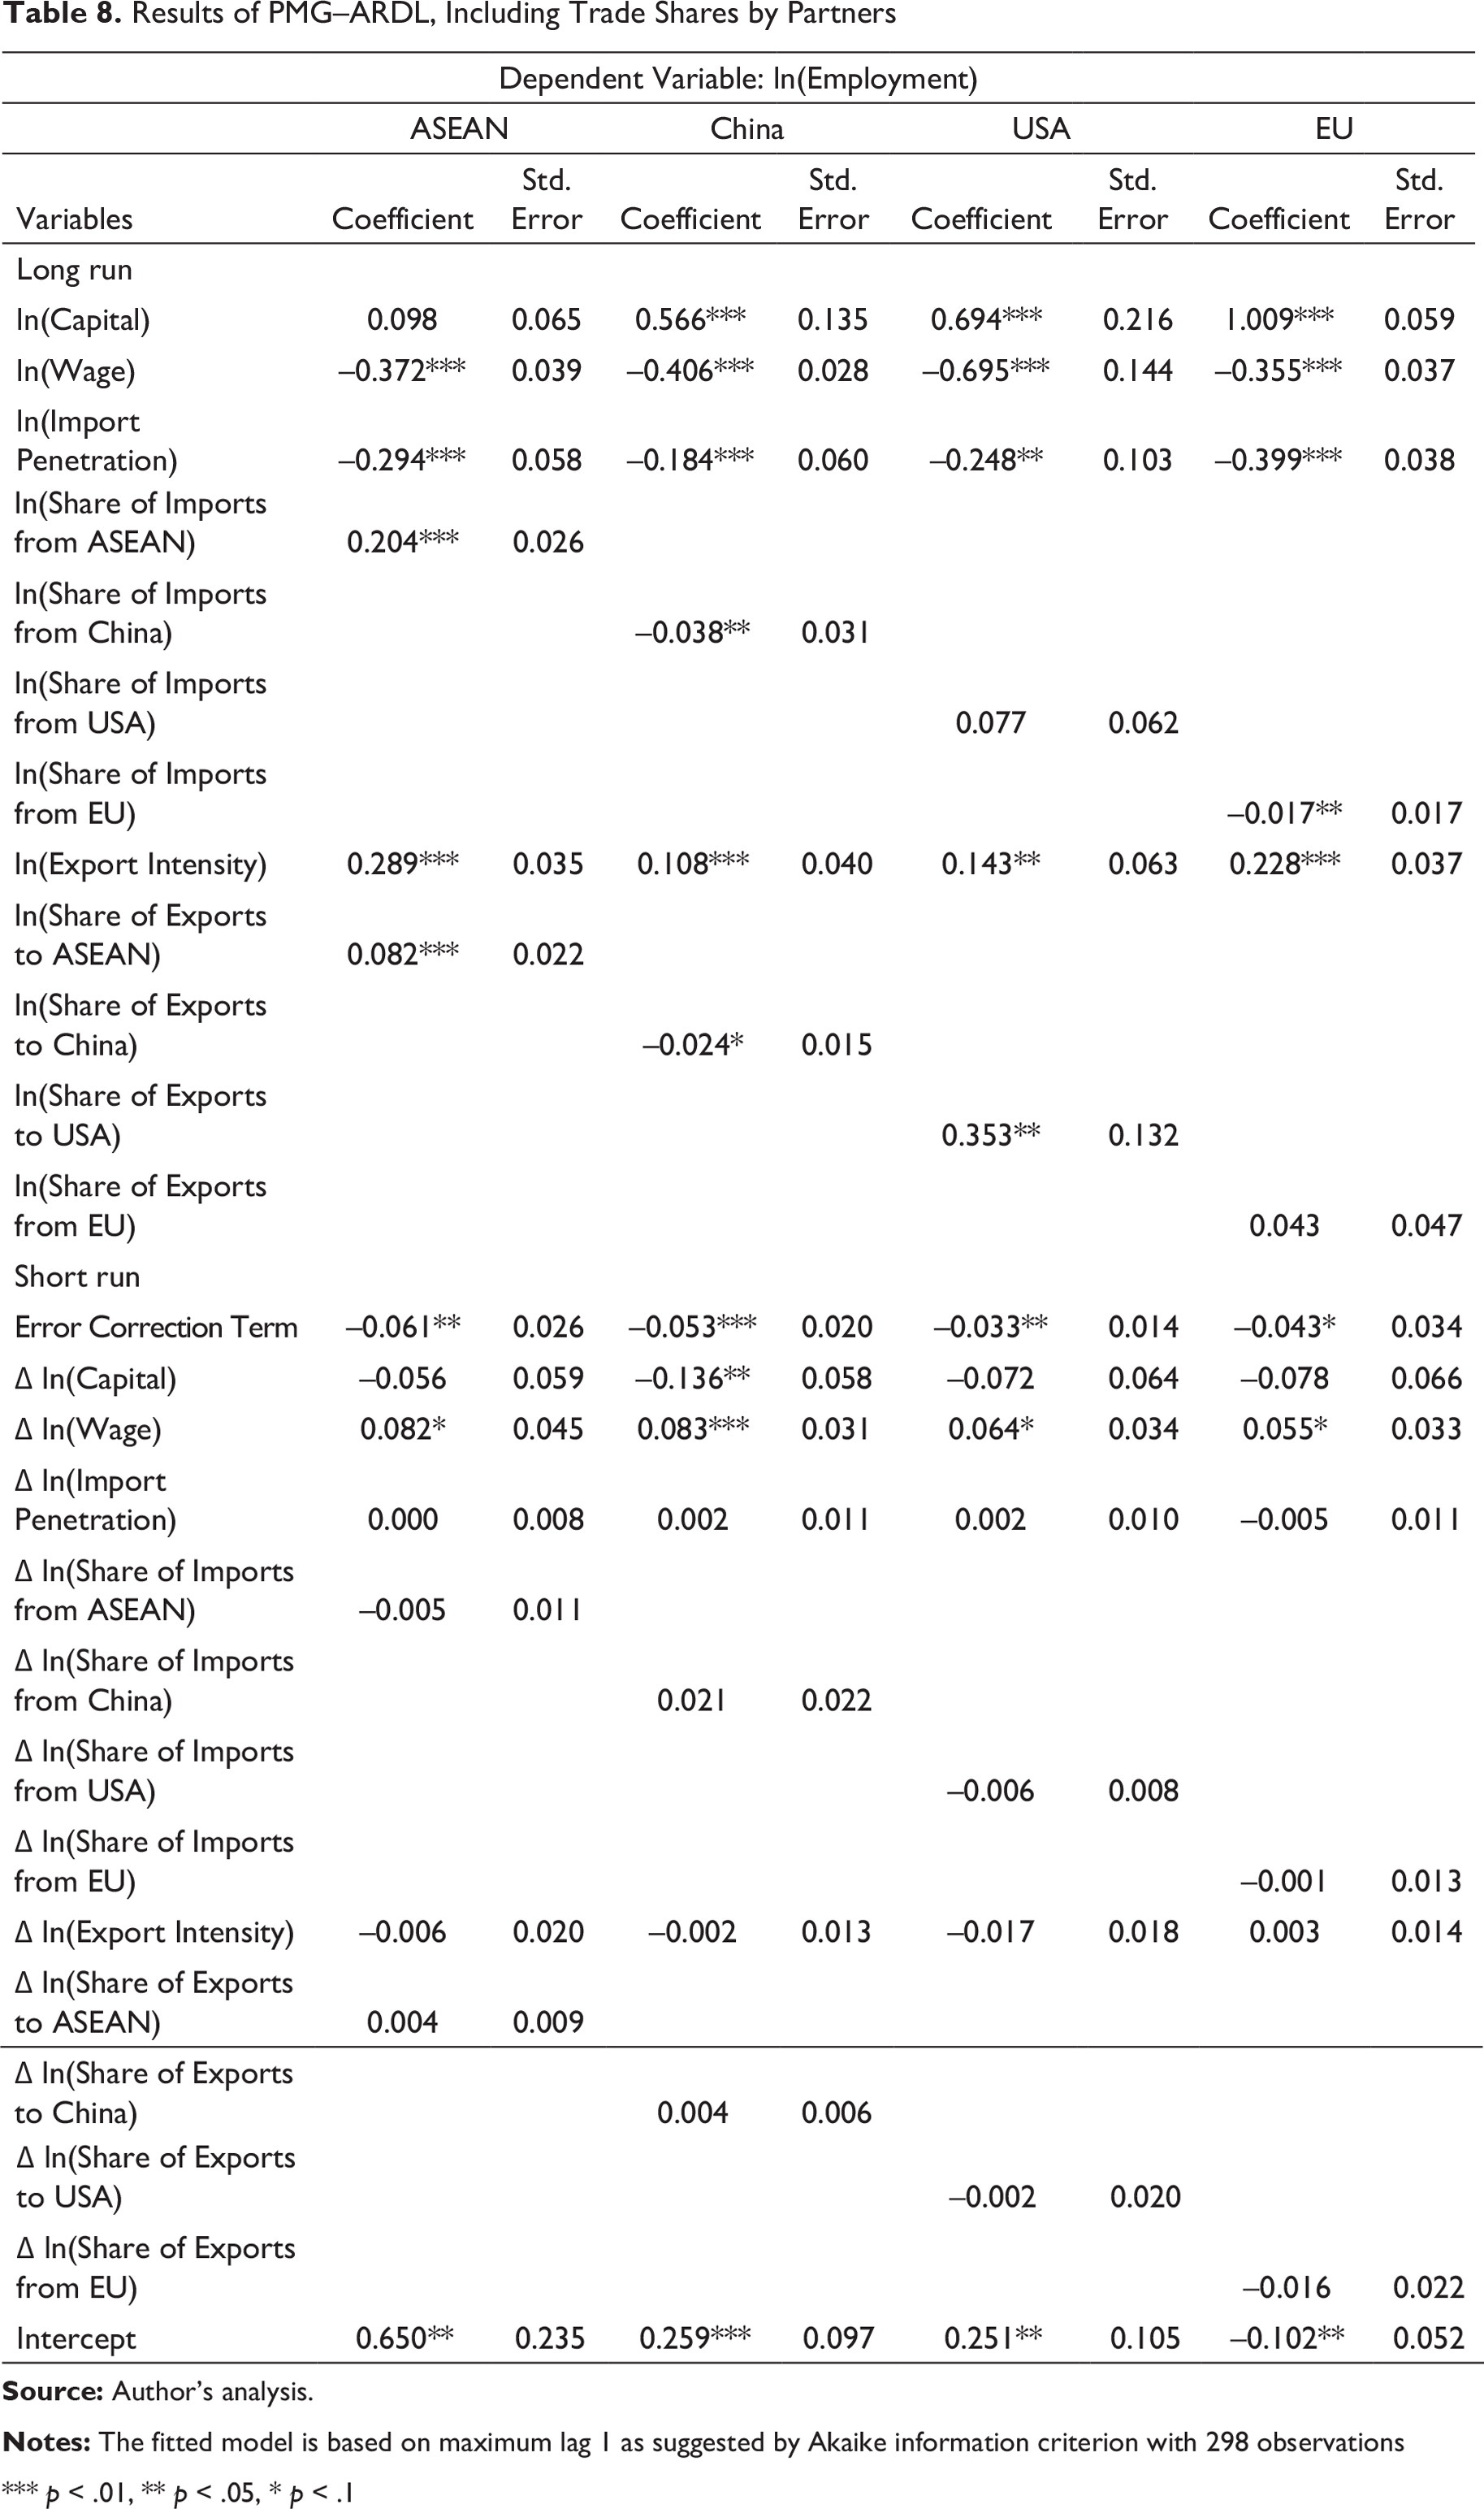
Results of PMG–ARDL, Including Trade Shares by Partners
*** p < .01, ** p < .05, * p < .1
The marginal impact of imports from and exports to ASEAN on employment is positive and significant in the long run and is insignificant in the short run. The positive effect of import share could be a manifestation of upstream import penetration, mainly in the food products, beverages and tobacco industry which is a labour-intensive industry (see Appendix A2). However, an examination of industry-wise trade with ASEAN reveals that the growth in share of exports in the food products industry, like other industries, has been slow as compared to imports in this industry. Thus, the potential of employment generation via exports has not been harnessed full.
In the case of China, the estimated coefficient of import share is negative and significant in the long run. This is not surprising as India’s imports from China is mostly concentrated in labour-intensive industries such textiles, manufacture of non-metallic mineral products, machinery and equipment, and electrical and optical equipment (see Appendix A3). 10 Thus, import competition from China has had a detrimental effect on India’s industrial sector employment. What is all the more surprising, however, is the estimated coefficient of export share is also negative and significant in the long run. The results show that a rise of share of exports to China by 1 per cent causes around 0.024 per cent decline in employment. This indicates that there could be trade induced preference for skilled labour in industries (mainly agricultural industry) exporting to China, thus displacing unskilled labour.
As far as trade with USA is concerned, imports from USA do not seem to have any significant impact on the employment. This insignificant result may be because imports from USA has been increasingly in agricultural items, chemical and chemical products and rubber and plastic product, among other non-labour-intensive industries, which can hardly have any disadvantageous impact on employment. On the other hand, share of exports to USA has had a positive impact on employment. The explanation to this finding is quite straightforward – USA is India’s export market in labour-intensive industries such as electrical machinery, medical and optical equipment, mechanical appliances as well as textiles and manufacturing of wood and wood products (see Appendix A3).
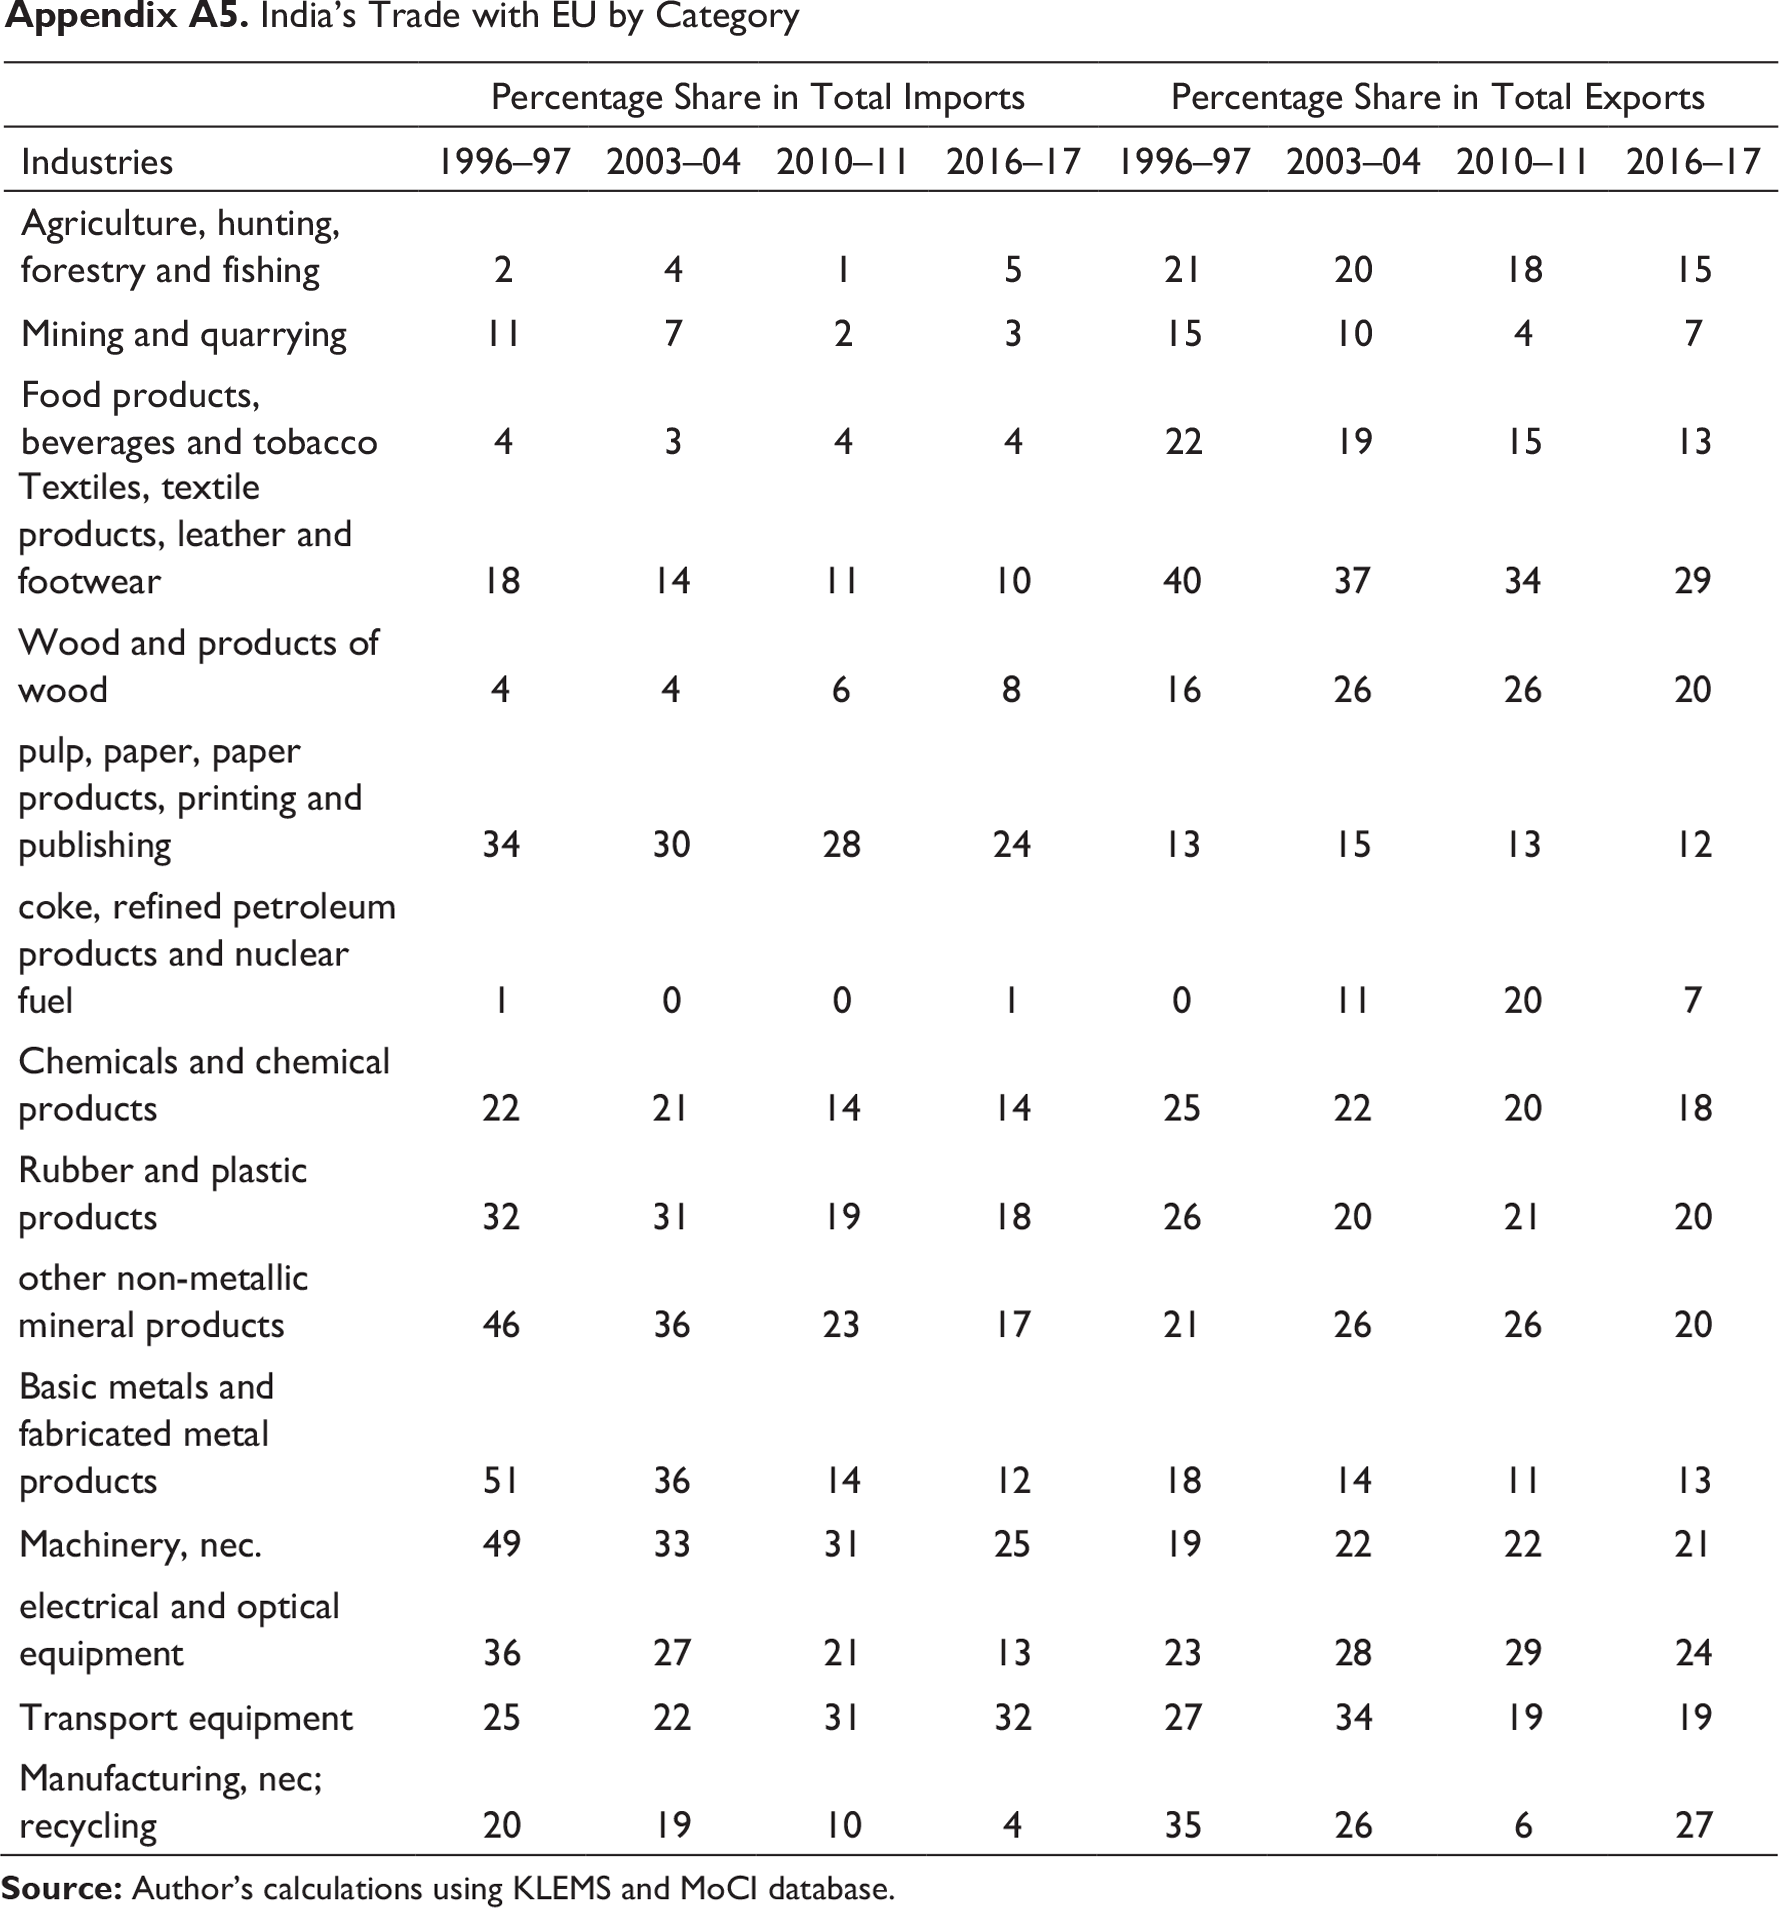
Similar to the results for China, the long run impact of import from EU is negative and significant. However, the share of export to EU hardly has any impact on the employment. This is because of the fact that the India’s importance in EU’s imports has not been significant. According to the latest data, India is tenth largest partner for EU imports and the share of EU’s import from India is only about 2 per cent of its total imports. 11 The negative impact could be because of the import competition faced by labour-intensive industries such as manufacturing of paper and paper products, non-metallic mineral products, machinery and equipment and electrical and optical equipment (see Appendix A4), which may have led to the decline in output thereby leading to decline in demand for labour these industries. The insignificant impact of India’s exports to EU
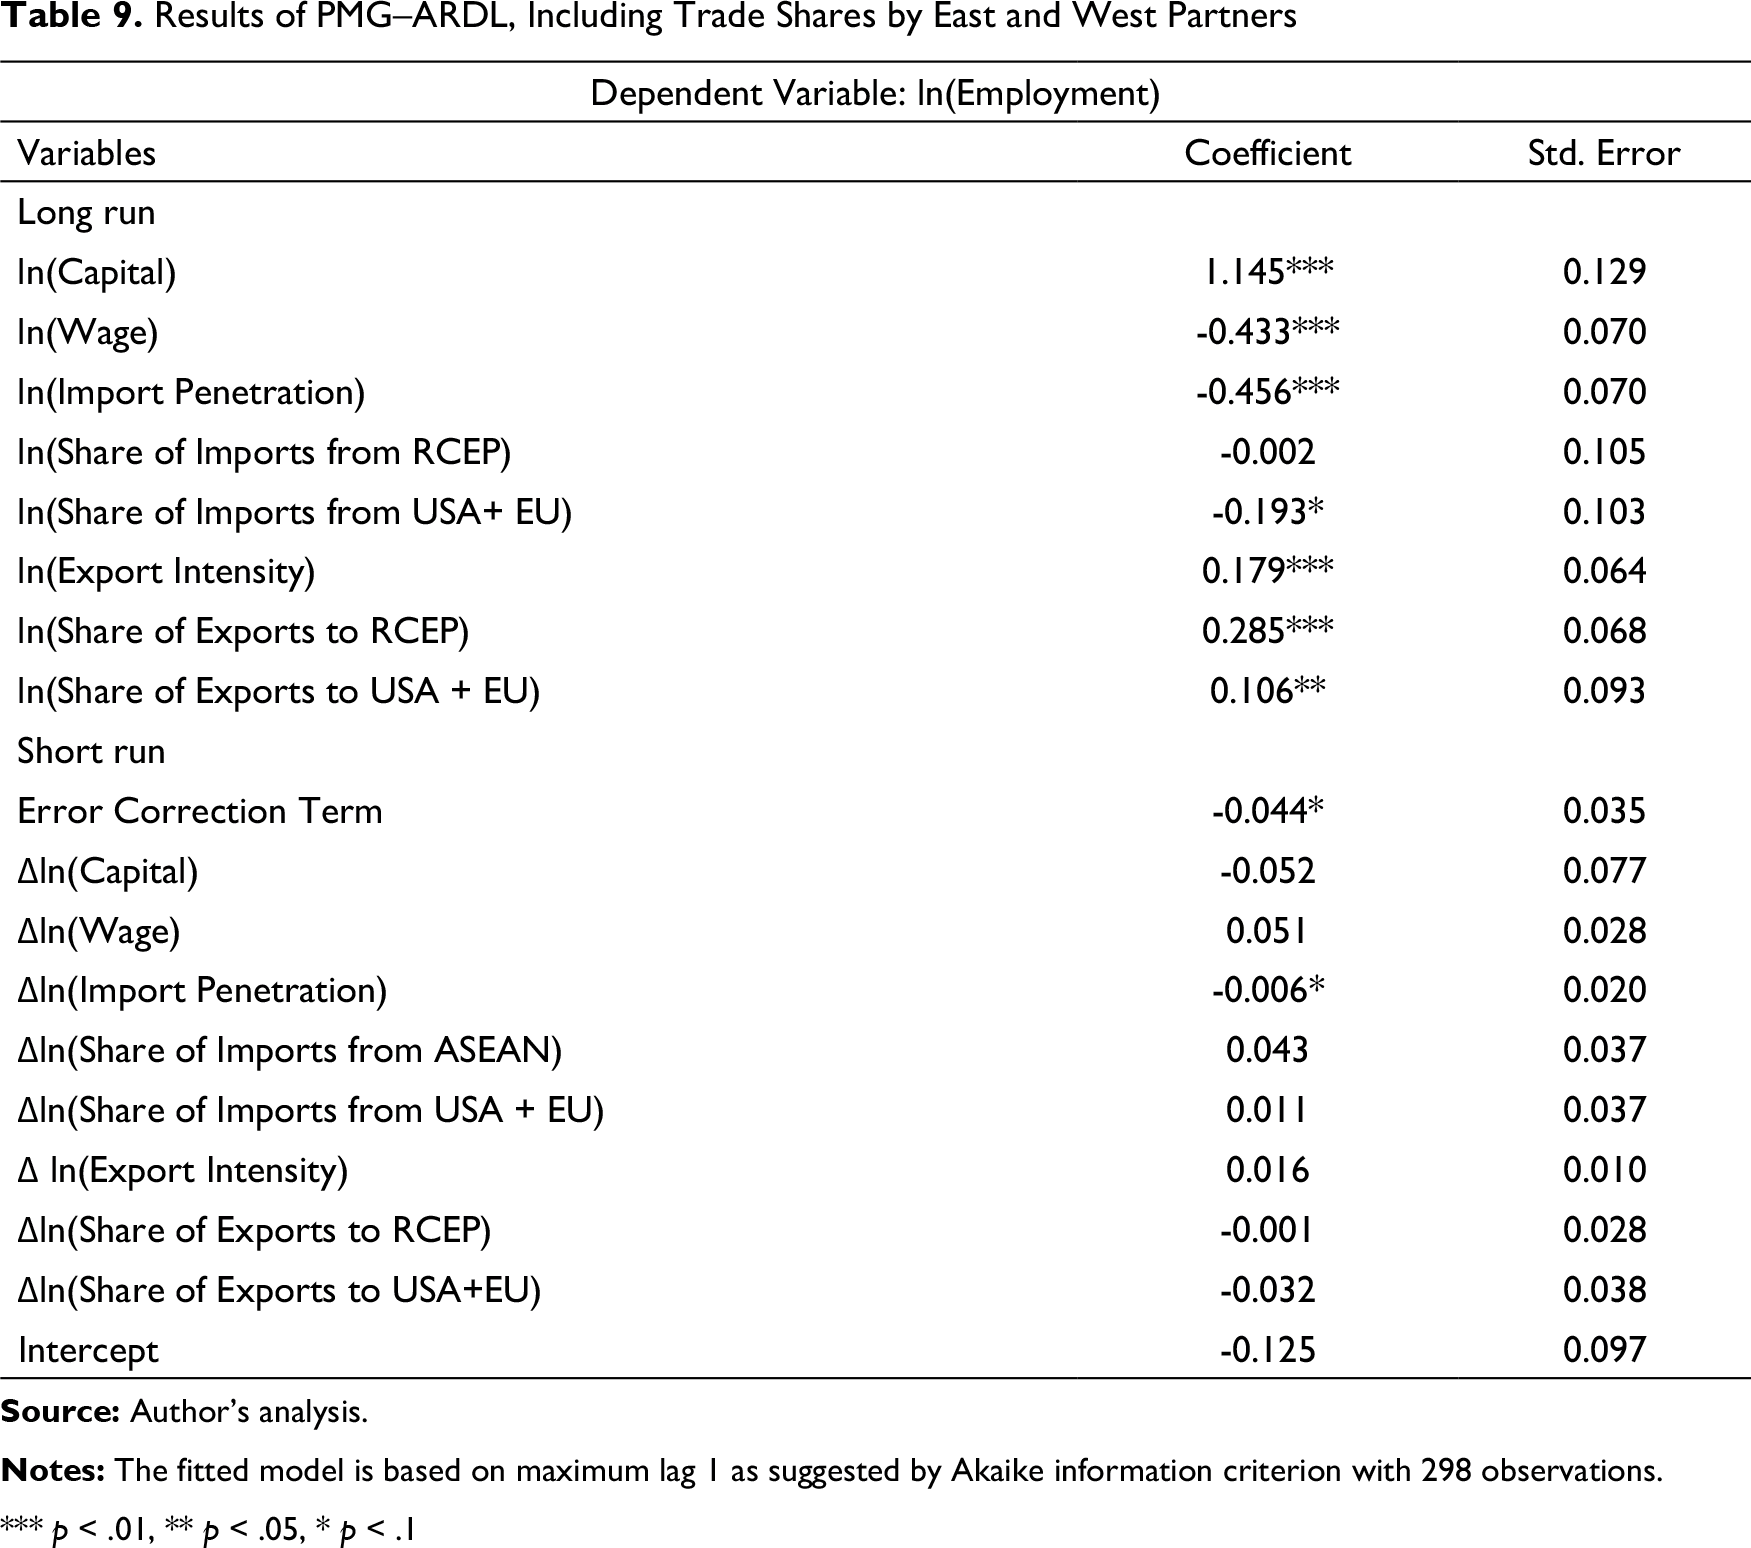
Apropos to the policy debate on whether India should open its market, going forward, to its Eastern partners or the Western partners, an analysis of impact of India’s trade with major Eastern and Western partners on employment is carried out. Table 9 reports the findings of the analysis of India’s trade with RCEP (East) versus EU plus USA (West). We have taken RCEP because India was in negotiation with this group for the last few years before plugging out of RCEP in December 2019. In the West, USA and the EU are the most important trading partners of India and India is currently negotiating trade deals with the EU and the USA.
Results of PMG–ARDL, Including Trade Shares by East and West Partners
*** p < .01, ** p < .05, * p < .1
Furthermore, it is observed that the inclusion of trade shares of India’s East and West partners does not lead to any change in the results related to wage rate and physical capital stock. Akin to the PMG results reported in Tables 7 and 8, an increase in wage rate is associated with a decline in industrial-level employment whereas an increase in physical capital stock is associated with an increase in industrial-level employment. Again, in line with results reported in Tables 7 and 8, while the estimated coefficient for import penetration negative and significant, that for export intensity is positive and significant in the long run. Also, the independent variables converge to their long-run path.
This study investigates the impact of overall trade as well as the effect of India’s trade with its major Eastern and Western partners on employment outcome in the India’s industrial sector. With regard to overall trade, the results reveal that while import penetration has a negative and significant impact, export intensity has a positive and significant impact on industrial sector employment in India in the long run. This finding is in line with earlier studies on this issue, namely, Banga (2005), Goldar (2009) and Paul (2014). The analysis of the differential effect of India’s trade with ASEAN, China, EU and the USA provides some interesting results. The long run impact of India’s trade with the ASEAN has been employment enhancing mainly because of the manifestation of upstream import penetration in the food products, beverages and tobacco industry which is a labour-intensive industry. However, the growth in share of exports in this industry, like other industries, has been slow as compared to imports in this industry. Thus, the potential of employment generation via exports has not been harnessed fully.
Both import competition from and share of exports to China have had a detrimental effect on India’s industrial sector employment. This could be a reflection of trade induced preference for skilled labour in industries exporting to China, thus dislocating unskilled labour. Similarly, share of imports from the EU too had a negative impact on the employment primarily because of the competition faced by labour-intensive industries. Nevertheless, share of exports to EU had insignificant impact on employment. As far as trade with USA is concerned, imports from USA do not seem to have any significant impact on the employment as they are mostly in non-labour-intensive industries. On the contrary, share of exports to USA has had a positive impact on employment as USA is India’s export market in labour-intensive industries.
On the East versus West looking trade policy debate, analysis suggests that the long run impact of exports, to both the West (EU plus USA) and the East (RCEP) partners, on India’s industrial employment is positive and significant, with the impact imposed by exports to RCEP has higher magnitude as compared to that imposed by exports to EU and USA combined. Also, contrary to the mainstream view, the negative effects of imports from RCEP appears to be less noticeable than that associated with imports from the EU plus USA.
The findings of this study have some policy implications. First, as opposed to protectionist stance, India has to ramp up trade engagement and not shy away from it. In general, exports have the potential to create employment opportunities. That said, India can reap benefits form trade agreements only if builds capacity in terms of producing goods at competitive prices for the export market. But this does not mean that exports should be considered in isolation and export promotion should be seen as sole policy objective. Instead, policy outlook should aim at promoting both exports and imports. In addition, structural policy reforms in labour-intensive industries in terms of removing supply side bottlenecks, namely, infrastructure, credit, energy deficit, inferior logistics, rigid land and labour laws are needed.
Second, as far as engagement with East and West is concerned, it is in India’s interest to pursue look East policy as trade partnership with countries having common border, culture and ethnicity (Anderson & Van Wincoop, 2004; Guiso et al., 2004) is likely to be more successful. In fact, our results support this fact from employment point of view. Eastern Asia is resilient regional value chain hub. Strategically, India should consider deeper integration with ASEAN and import intermediate and capital goods at internationally competitive prices. This, in turn, will improve productive capacity of India’s industrial sector and can make Indian exports competitive, thereby generating employment opportunities in the industrial sector. India is also looking to build closer trade ties with the West, especially after pulling out of RCEP trade deal owing to huge trade deficit with China and other members of RCEP. However, it would be very difficult for India to get trade agreement with EU and USA exclusively on its terms. Trade agreements with the EU and the US cannot be a substitute for dis-engaging with the resilient Eastern partners. Hence, India should reconsider RCEP option and strengthen its trade prospects with the ASEAN, even while negotiating FTA with the US and the EU. As our results suggest, to make trade beneficial for employment, India should strengthen intra-industry trade with its East Asian partners and simultaneously look for export market in the West. Looking West can never be complete without strengthening India’s Eastern trade ties.
Footnotes
Declaration of Conflicting Interests
The author declared no potential conflicts of interest with respect to the research, authorship and/or publication of this article.
Funding
The author received no financial support for the research, authorship and/or publication of this article.
Notes
Appendix A
| Percentage Share in Total Imports | Percentage Share in Total Exports | |||||||
| Industries | 1996–97 | 2003–04 | 2010–11 | 2016–17 | 1996–97 | 2003–04 | 2010–11 | 2016–17 |
| Agriculture, hunting, forestry and fishing | 2 | 4 | 1 | 5 | 21 | 20 | 18 | 15 |
| Mining and quarrying | 11 | 7 | 2 | 3 | 15 | 10 | 4 | 7 |
| Food products, beverages and tobacco | 4 | 3 | 4 | 4 | 22 | 19 | 15 | 13 |
| Textiles, textile products, leather and footwear | 18 | 14 | 11 | 10 | 40 | 37 | 34 | 29 |
| Wood and products of wood | 4 | 4 | 6 | 8 | 16 | 26 | 26 | 20 |
| pulp, paper, paper products, printing and publishing | 34 | 30 | 28 | 24 | 13 | 15 | 13 | 12 |
| coke, refined petroleum products and nuclear fuel | 1 | 0 | 0 | 1 | 0 | 11 | 20 | 7 |
| Chemicals and chemical products | 22 | 21 | 14 | 14 | 25 | 22 | 20 | 18 |
| Rubber and plastic products | 32 | 31 | 19 | 18 | 26 | 20 | 21 | 20 |
| other non-metallic mineral products | 46 | 36 | 23 | 17 | 21 | 26 | 26 | 20 |
| Basic metals and fabricated metal products | 51 | 36 | 14 | 12 | 18 | 14 | 11 | 13 |
| Machinery, nec. | 49 | 33 | 31 | 25 | 19 | 22 | 22 | 21 |
| electrical and optical equipment | 36 | 27 | 21 | 13 | 23 | 28 | 29 | 24 |
| Transport equipment | 25 | 22 | 31 | 32 | 27 | 34 | 19 | 19 |
| Manufacturing, nec; recycling | 20 | 19 | 10 | 4 | 35 | 26 | 6 | 27 |