
Abstract
Survey methodology has been and continues to be a pervasively used data-collection method in social science research. To better understand the state of the science, we first analyze response-rate information reported in 1014 surveys described in 703 articles from 17 journals from 2010 to 2020. Results showed a steady increase in average response rate from 48% in 2005 to 53% in 2010 to 56% in 2015 and 68% in 2020; a marked increase in the number of surveys per published article from 1.27 in 2015 to 1.79 in 2020; and that variables that predict response-rate fluctuations over time are related to research design (e.g. data-collection medium), participant motivation (e.g. incentives), and researcher motivation (i.e. number of surveys per article). Second, we propose complementary information on contemporary response-rate norms and benchmarks with a response-rate validity assessment framework to gather evidence on accuracy of inferences based on a particular response-rate level. Implementing this validation process involves gathering information on the researcher–participant relationship, participant qualifications and motivation, survey length and complexity, and cultural and national context. Future survey research should implement the validity assessment framework in addition to reporting the response-rate value to better indicate a sample’s quality, appropriateness, and representativeness.
Producers (i.e. authors), evaluators (e.g. editors and reviewers), and consumers of survey-based research (i.e. other researchers, practitioners) routinely rely on response-rate (RR) benchmarks to determine the quality and appropriateness of a particular sample (e.g. Austin et al., 2008; Bainbridge et al., 2016). Accordingly, it is not surprising that a study’s reported response rate figures explicitly (Green et al., 2016) or implicitly (Carley-Baxter et al., 2013) in reviewers’ and editors’ assessments of rigor and validity. The importance of RR in the review process was highlighted by Green et al. (2016), who examined the statistical and methodological issues raised in 304 reviewers’ and editors’ letters for 69 submitted manuscripts. They found that sampling, and a low response rate in particular, is one of the three most frequently raised concerns regarding research design. Thus, higher response rates influence editors’ and reviewers’ publication decisions. Consequently, under conditions of rising competition for scarce journal space, we expect a rise in response rates over time (Campanario, 1996; Youk and Park, 2019). Moreover, the dramatic expansion of electronic tools and support for gathering survey data more easily also support the expectation of an increase in response rates (Walter et al., 2019). But there remains an open question regarding whether the level of a response rate is, in and of itself, an indicator of sample quality. Furthermore, despite frequent admonitions against the use of simple heuristics to evaluate research quality (Vandenberg, 2006), as a field we do not have a practice for systematically evaluating whether a high or low response rate is a valid one that goes beyond evaluating it against a single “benchmark” number.
The purpose of this article is to critically assess survey response rates over time, enhance our understanding of contextual factors that contribute to the trends, and offer a new theory-based RR validity assessment framework to better understand a sample’s quality, appropriateness, and representativeness. To do this, we collected information about response rates and reporting practices from surveys conducted in research published in 17 major journals in the fields of management and applied psychology in the years of 2010, 2015, and 2020. This work was analyzed to arrive at average reported response rates over time and also to determine the extent to which reporting of response rates followed or deviated from best practices regarding the practice that have been set over the years. In doing so, we make three contributions. First, from a theory standpoint, we identify factors associated with different RR levels, thereby improving our understanding of when response rates fluctuate. Second, we document contemporary trends in survey response rates and provide benchmarks useful not only for authors but also for journal editors and reviewers. Third, we contribute to the ongoing debates about research integrity by discussing a framework for gathering validity information about response rates in future research that will allow for a more accurate and comprehensive assessment of RR appropriateness.
Need to examine RR trends over time
The need to examine RR trends over time is motivated by three significant developments that have influenced the nature of survey research in the past decade. First, consider technological advances in survey administration. In their review, only 17 (i.e. 4%) of the 446 studies analyzed by Baruch and Holtom (2008) in applied psychology and management journals between 2000 and 2005 used surveys distributed electronically (i.e. by email or posted online). In contrast, most survey data are now collected electronically as opposed to using paper-and-pencil methods (Coppock and McClellan, 2019; Walter et al., 2019). The use of online interfaces such as SurveyMonkey and Qualtrics, along with the emergence of proprietary technologies, has greatly facilitated the construction and administration of surveys. Whereas researchers used to invest effort and take the risk of coding their own survey into a user interface, survey vendors now provide easy-to-use tools to design and administer a wide variety of scales by simply emailing or texting links to potential respondents.
The second development is the increasingly rich conceptual and empirical literature on survey design and administration. Specifically, this body of work has helped researchers apply emerging technological tools as well as motivational methods to increase sample sizes and response rates. For example, Dillman et al.’s (2014) influential Tailored Design Method utilizes insights from social exchange theory to increase respondent desire to reciprocate based on advance notice of the coming survey, clear instructions, reminders, and incentives. Additional research on survey design and administration across diverse cultural settings (e.g. De Leeuw, 2005; Park and Tsuchiya, 2021) or specific disciplines (Anseel et al., 2010) has also been influential in guiding researchers to make effective use of emerging tools to increase response rates by decreasing respondent burden.
The third major development is the emergence of panel administrators including Amazon’s Mechanical Turk (MTurk), Qualtrics Panels, and Study Response Project, which enable researchers to administer more studies to more narrowly tailored samples (Aguinis et al., 2021; Walter et al., 2019). In the past, most researchers recruited participants through a connection to a particular organization, which is often a laborious and time-consuming process (Cunliffe and Alcadipani, 2016). Also, many of these studies faced external validity threats as this limitation in sample diversity generated critiques of “convenience sampling” (Peterson and Merunka, 2014), resulting in concerns about a low level of generalizability (Berinsky et al., 2012). Although using panel administrators potentially carries additional validity threats (Aguinis et al., 2021), outsourcing the recruitment of study participants means researchers can address multiple facets of interesting questions with potentially larger and more diverse samples. Moreover, this can be done over a shorter period of time from participants who researchers would not have been able to access otherwise, as long as they are ready to trust the platform that provides these participants.
In sum, based on the above discussion, we speculate that response rates may have increased over time. So, we ask the following question:
Research Question 1: Have survey response rates changed since 2005 and by how much?
RR predictors
There are several factors that are likely to contribute to fluctuations in response rates over time. We group these factors into three categories: (1) research design, (2) participant motivation, and (3) researcher motivation. Next, we offer research questions pertaining to specific variables in each of these three RR predictor categories.
Research design
Data-collection medium
On the one hand, past empirical research comparing response rates for online surveys relative to traditional mail surveys demonstrates that the response rates are typically similar (Fleming and Bowden, 2009; Sexton et al., 2011) or that online response rates are lower (Manfreda et al., 2008; Shih and Fan, 2008; Yetter and Capaccioli, 2010). A meta-analysis of 39 studies comparing online and mail surveys reported that email response rates were on average 10% lower than mail response rates (Shih and Fan, 2008). The reason is that some respondents may not be familiar with online surveys and others are concerned that information provided online may not be kept private (Hildén, 2017), thereby lowering response rates compared with mail surveys.
On the other hand, three factors cause us to believe that response rates for data collected online may now exceed traditional methods. First, internet penetration rates across the globe have increased dramatically. In Europe, the percentage of people with access to the internet exceeds 95% (Statista, 2021). While there are clearly regions with lower rates of access, worldwide internet penetration is now over 60% (Statista, 2021). Second, over time, people have become more comfortable sharing personal opinions online (Manfreda et al., 2008). Third, more online activity takes place on mobile devices than ever before. For example, in the USA in 2019, 79% of smartphone owners used their device for an online purchase and 75% used a mobile device to check their bank balance (DataProt, 2021). The increased availability, comfort, and convenience associated with online activity causes us to believe that online survey response rates will now exceed mail surveys. Thus, we offer the following research question:
Research Question 2: Are survey response rates higher for data collected online or via mail surveys?
Data source
Given a dramatic increase in the availability of online panel administrators such as MTurk, Prolific Academic, Qualtrics, StudyResponse, and Zoomerang, the resulting convenience to researchers, and the potential to quickly identify and access targeted populations of interest, we believe it is critical to understand whether response rates are different for researcher-collected data compared with panel administrators. Walter and colleagues (2019) found that online panel data have similar psychometric properties and produce evidence about criterion validity that generally falls within the credibility intervals of existing meta-analytic results from conventionally sourced data. But, they did not compare response rates. Thus, we ask:
Research Question 3: Do response rates vary based on whether the data were collected by the researcher or a panel administrator (e.g. MTurk, Qualtrics Panels)?
Level of analysis and hierarchical organizational position
Prior research has demonstrated differences in propensity to respond depending on a study’s level of analysis and respondents’ hierarchical organizational position (Baruch and Holtom, 2008). There are two primary explanations for this. The first explanation is that many organization-level surveys request that an executive respond. In such cases, Cycyota and Harrison (2002) found the tactics used to influence response rates among members of the general public and employees do not have the same effectiveness among executives. The primary explanations are the intense time demands on executives (Solarino and Aguinis, 2021) coupled with the many requests for information from academic researchers, industry analysts, external stakeholders, internal stakeholders, and a variety of other sources (Eisenhardt, 1989). The second explanation relates to the potential sensitivities in reporting firm-level data for competitive reasons (Solarino and Aguinis, 2021). For this reason, it is unlikely response rates for such studies will be as high as for studies at other levels (e.g. individual, dyad, group). Thus, in studying organization-level issues, researchers who seek organization-level data may face systemically lower response rates. Accordingly, we pose the following research question:
Research Question 4: How do response rates vary across levels of analysis?
Participant motivation
Incentives
In general, relying on the norm of reciprocity to help increase response rates through the use of incentives has been shown to be effective (Dillman et al., 2014; Groves et al., 2009). However, Baruch and Holtom (2008) found that the inclusion of an incentive did not make a difference in response rates. Further, Bosnjak and Tuten (2003) showed that pre-paid monetary incentives apparently do not work for web surveys if the incentive is transferred electronically (e.g. via PayPal). While certainly not conclusive, the use of incentives may not hold the same promise in the electronic context as it has in more traditional data-collection efforts. Moreover, Manfreda et al. (2008) found no differences between response rates for online or mail surveys based on the use of incentives. In comparing email- with mail-based surveys, Shih and Fan (2008) found that the presence of incentives increased response rates for both. Further, the amount of response-rate improvement did not differ between data-collection modalities. Given the mixed evidence presented above, we ask the following question:
Research Question 5: Are response rates for surveys using incentives higher or lower than those not using incentives?
Reminders
Many studies have tested Dillman et al.’s (2014) Tailored Design Method including the recommendation to use reminders to improve response rates. They generally report a positive impact when reminders are used (e.g. Greer et al., 2000). For example, the use of reminders increased response rates for both mail- and email-based surveys (Shih and Fan, 2008). However, the use of more than one reminder (i.e. two or three) was not associated with higher response rates. Additionally, Manfreda et al.’s (2008) meta-analysis found that the response rate for web-based surveys was actually lower the more reminders that were sent. Specifically, sending one to two reminders had a nominal effect on response rates; however, sending three to five reminders had a significant negative impact on response rates. Similarly, Baruch and Holtom (2008) found that the use of reminders was associated with lower response rates. Causality, though, is uncertain because researchers who observe surveys with low initial response rates may be more likely to send reminders. This may be especially true in the electronic context where the cost to send a reminder is negligible. It seems that there may be a risk in this as researchers who send multiple reminders may alienate respondents and induce lower responses (Kittleson, 1997). In sum:
Research Question 6: Are response rates for surveys using reminders higher or lower than those not using reminders?
National origin of study participants (USA and China)
Given the dramatic increase in the number of published social-science studies conducted outside of the USA, we believe it is important to better understand how this may impact response rates. According to the Web of Science database, the USA and China are now the leading and most influential producers of journal publications across scientific fields (Highly Cited Researchers, 2021), a state of affairs that has changed dramatically over the last 25 years (May, 1997). Similarly, the two countries in our sample where the most research was conducted were the United States and China.
Research on survey response has focused in the past on aspects of national culture as a potential driver of differing response rates and patterns (Schwarz et al., 2010). Earlier studies conducted using US samples had a higher response rate than those with samples from outside the USA (Baruch and Holtom, 2008). However, cross-cultural research has shown that East Asian societies, such as China, are more collectivistic than many western societies, such as the United States. Collectivistic cultures are characterized by an emphasis on interdependence and an orientation toward society, whereas individualistic cultures are characterized by an emphasis on independence and autonomy (Triandis, 1989). Prior research shows that identification motivation is stronger for employees with higher collectivist orientation than those with low collectivist orientation (Zhao et al., 2019). Thus, at an individual level, employees with a collectivist orientation will be more likely to react positively to a perceived request from their organization or someone identified with the organization and comply with the desired behavior than employees with a more individualistic orientation (Wei et al., 2014). Indeed, recent research on published survey response rates in hospitality management found that those from samples based in the USA were significantly lower than those based in China (Ali et al., 2021). To better understand differences across countries, we ask the question:
Research Question 7: Are response rates for surveys with respondents from the USA higher or lower than those with respondents from China?
Researcher motivation
Number of surveys per published article
Some researchers have written about a replication and credibility crisis across the social sciences (e.g. Aguinis et al., 2020; Bergh et al., 2017; Hensel, 2021; LeBel et al., 2018). One way to overcome this concern is to include more surveys or samples in each study. The degree to which authors include more than one data-collection effort in developing each publication would represent a constructive response to general or specific criticisms (Köhler and Cortina, 2021). In addition, given the increasing pressure to publish in top journals (Rasheed and Priem, 2020), researchers may seek to increase relevance or generalizability by increasing the number of data collections in each published article. Thus, we ask the following question:
Research Question 8: Did the number of surveys per published article increase over time?
Method
Journal and article selection
We examined all articles published in 2010, 2015, and 2020 in the same 17 journals investigated by Baruch and Holtom (2008) as listed in Table 1. We selected these journals for three reasons. First, to examine trends in response rates going back to 2005 and ensure that journal was not a confound, we needed to analyze the same set of journals. Second, the 17 journals include the majority of the most prestigious journals that regularly publish research in management and related fields (Highhouse et al., 2020). Third, to enable examination of response rates at higher levels of analysis, our list includes journals that do not focus exclusively on the individual level but nevertheless are considered highly prestigious and relevant in management and related fields (e.g. Administrative Science Quarterly; Highhouse et al., 2020).
Journals examined, number of surveys and articles, and response rate percentages.
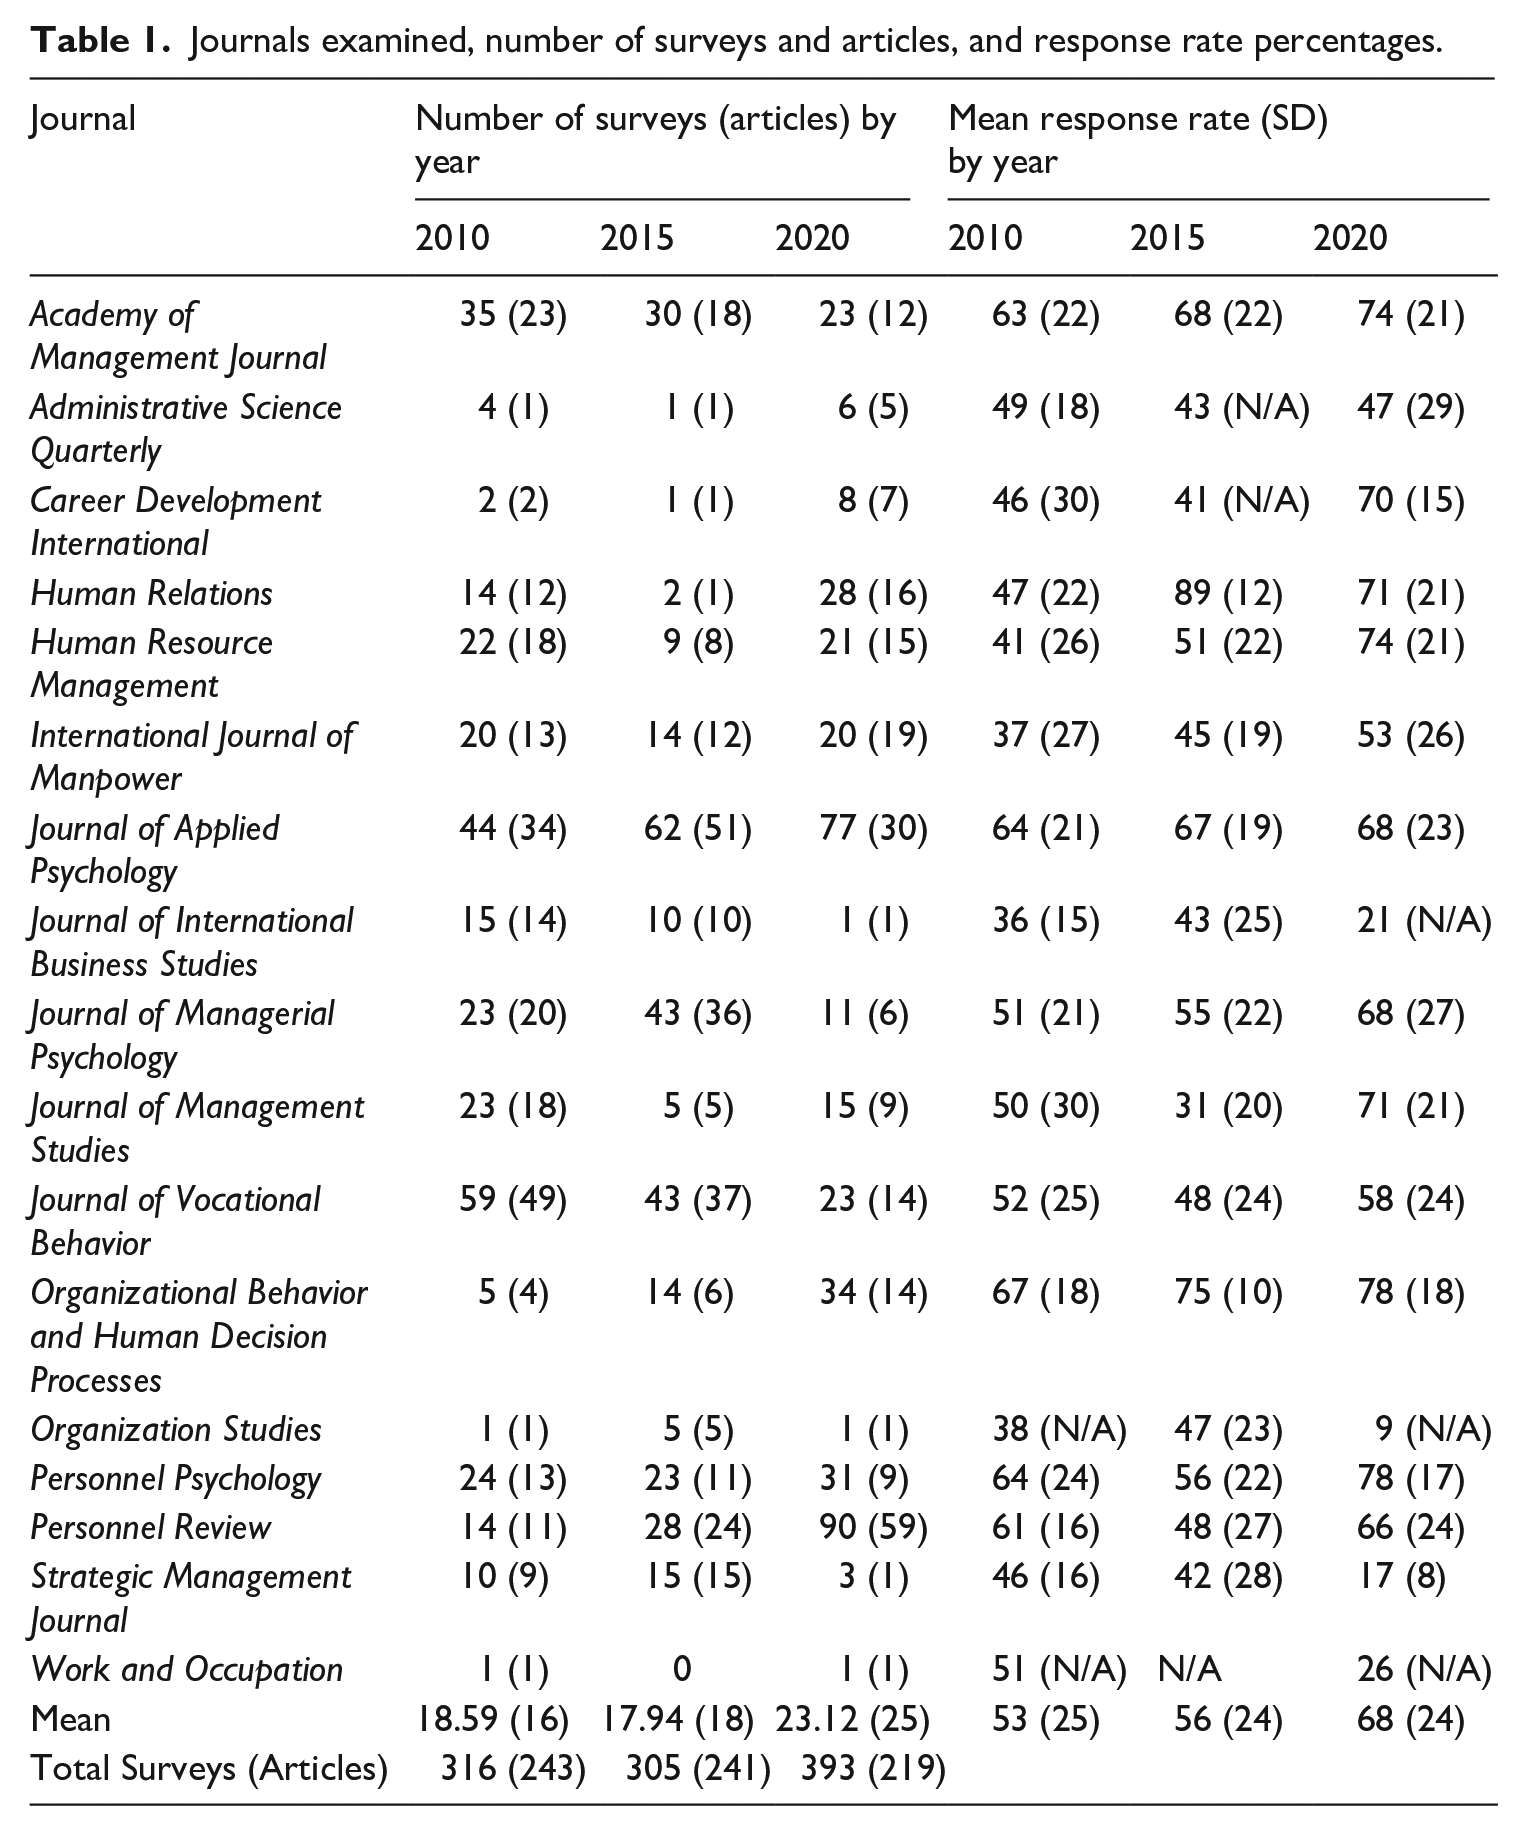
Combining the years 2010, 2015, and 2020, 1 our initial database included a total of 3902 studies published in 2838 articles. Consistent with Baruch and Holtom’s (2008) methodology, we initially included articles where researchers reported the use of a voluntary-response questionnaire. This resulted in a total of 364 articles (483 studies), 409 articles (558 studies), and 622 articles (919 studies) published in 2010, 2015, and 2020, respectively. We then excluded those surveys where there was evidence to believe that participants were compelled to complete the survey (e.g. “respondents were required to complete this survey as a part of their certification process”). We further excluded from analysis those surveys where researchers did not include sufficient information to calculate a response rate (i.e. did not provide the number of surveys distributed and returned or actual response rate). The total number of studies excluded under these two criteria were 100, 170, and 405 in 2010, 2015, and 2020, respectively. Finally, to promote comparability with prior findings on researcher-collected survey response rates, we considered separately those surveys where there was evidence to believe the researchers employed a panel administrator (e.g. “we used MTurk to collect the data”). We analyze the response rates in those surveys to answer Research Question 3. The total number of studies using panel administrators were 67, 83, and 121 in 2010, 2015, and 2020, respectively. In all, 1014 surveys published in a total of 703 articles met the inclusion criteria and were considered, as summarized in Table 1.
Measures
We examined the Method section of every article and gathered the following information: number of surveys administered, responses returned, and usable responses. In assessing the data-collection medium, we noted whether a survey was distributed in person, by mail, by phone, or via the web (e.g. email or browser). If it was not explicit, contextual clues supported classification (e.g. “four surveys were returned by the post as undeliverable”). In coding level of analysis and organizational hierarchical position, we examined who received the surveys as well as the subsequent analysis to confirm that the level was individual, dyad, group/team, firm, or multiple. To determine data source, we looked for explicit evidence that the data were collected by a researcher or panel administrator. When the data came from a panel administrator, the typical language used noted the firm (e.g. “We aimed to collect a sample size of 200 MTurk workers” or “We partnered with StudyResponse to survey 400 nurses”). In contrast, researcher-collected data were signaled by language such as, “We sent an e-survey to 500 employees of a Fortune 100 firm.”
To identify the use of incentives or reminders, we looked for explicit evidence of their presence (e.g. “we provided a reward of $5 to each respondent” or “we reminded potential respondents after one week”). If the use of incentives or reminders was not explicitly stated, we coded as none. The national origin of the sample was coded if specifically stated. If not, as was done by Shen et al. (2011), the sample was coded based on the institutional location of the article’s lead author. Finally, when more than one survey was reported in an article, it was treated as a separate study. The first author supervised three graduate student assistants who identified the data included in our analyses for each article. Because the data being extracted were generally objective, they experienced a very high level of initial agreement (99%). All differences were resolved through discussion with the first author. The first author also audited 5% of studies. There were no cases where all graduate assistants misinterpreted data.
Results
RR trend over time: Research Question 1
Table 1 includes information on response rates over time. Across all articles and all journals combined, results showed a significant trend from 2010 to 2020, F(2, 1011) = 36.16, p < .001, η2 = 0.07. A follow-up pairwise comparison revealed an increase in survey response rates in 2020 (M = 68%, SD = 24%) when compared with 2015 (M = 56%, SD = 24%); t(696) = 6.33, p < .001, d = .48. The mean response rates in 2010 (M = 53% SD = 25%) and 2015 were not significantly different from each other. To be able to draw conclusions over a longer period of time, Figure 1 includes mean response rates from our study (2010–2020) as well as those reported for 2005 based on the same journals (Baruch and Holtom, 2008). As shown in this figure, the answer to Research Question 1 is that the overall average response rate increased substantially from 48% in 2005 to 53% in 2010 to 56% in 2015 and 68% in 2020.
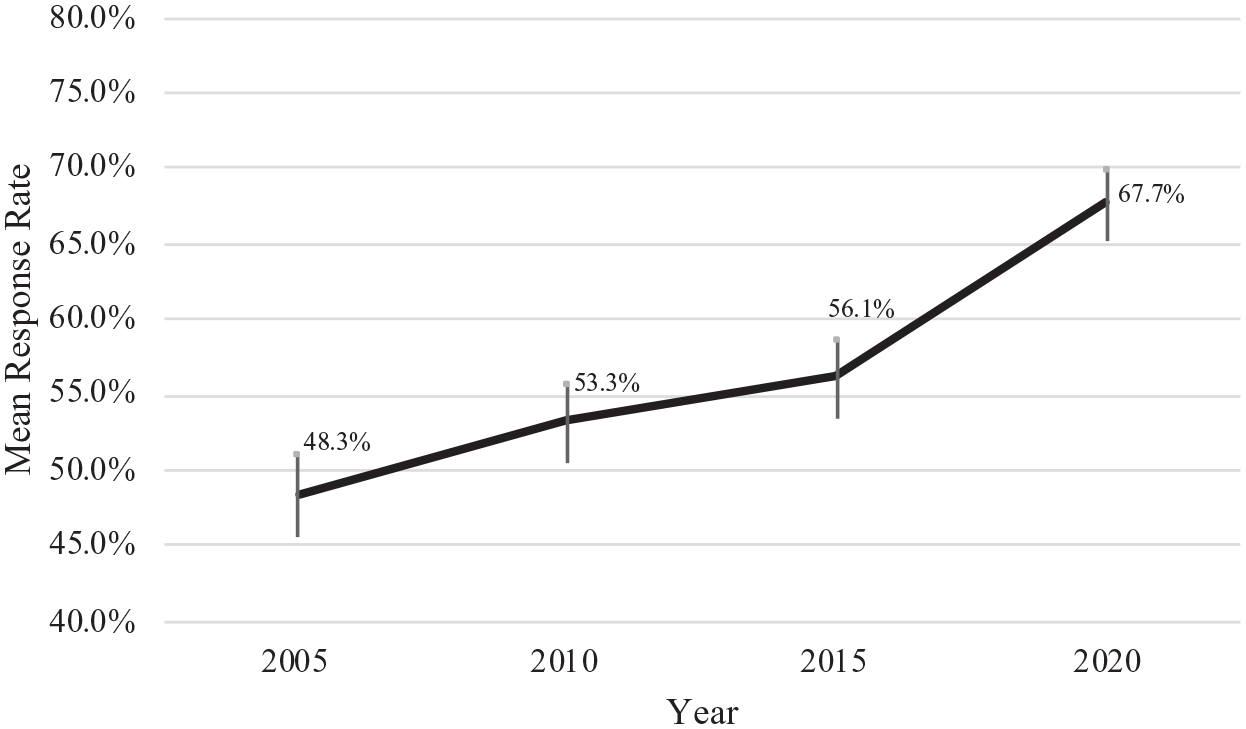
Mean response rates by year across the 17 journals listed in Table 1.
Research design: Research Questions 2–4
Data-collection medium
As summarized in Table 2, the number of surveys administered online has increased from 84 in 2010 to 148 in 2015 to 223 in 2020. During the same period, the number of in-person and mail surveys have decreased. Online surveys comprised 33% (i.e. 84 out of 256) surveys in 2010 and 65% (i.e. 223 out of 344) in 2020.
Response rates as a function of research design, participant motivation, and researcher motivation predictors.
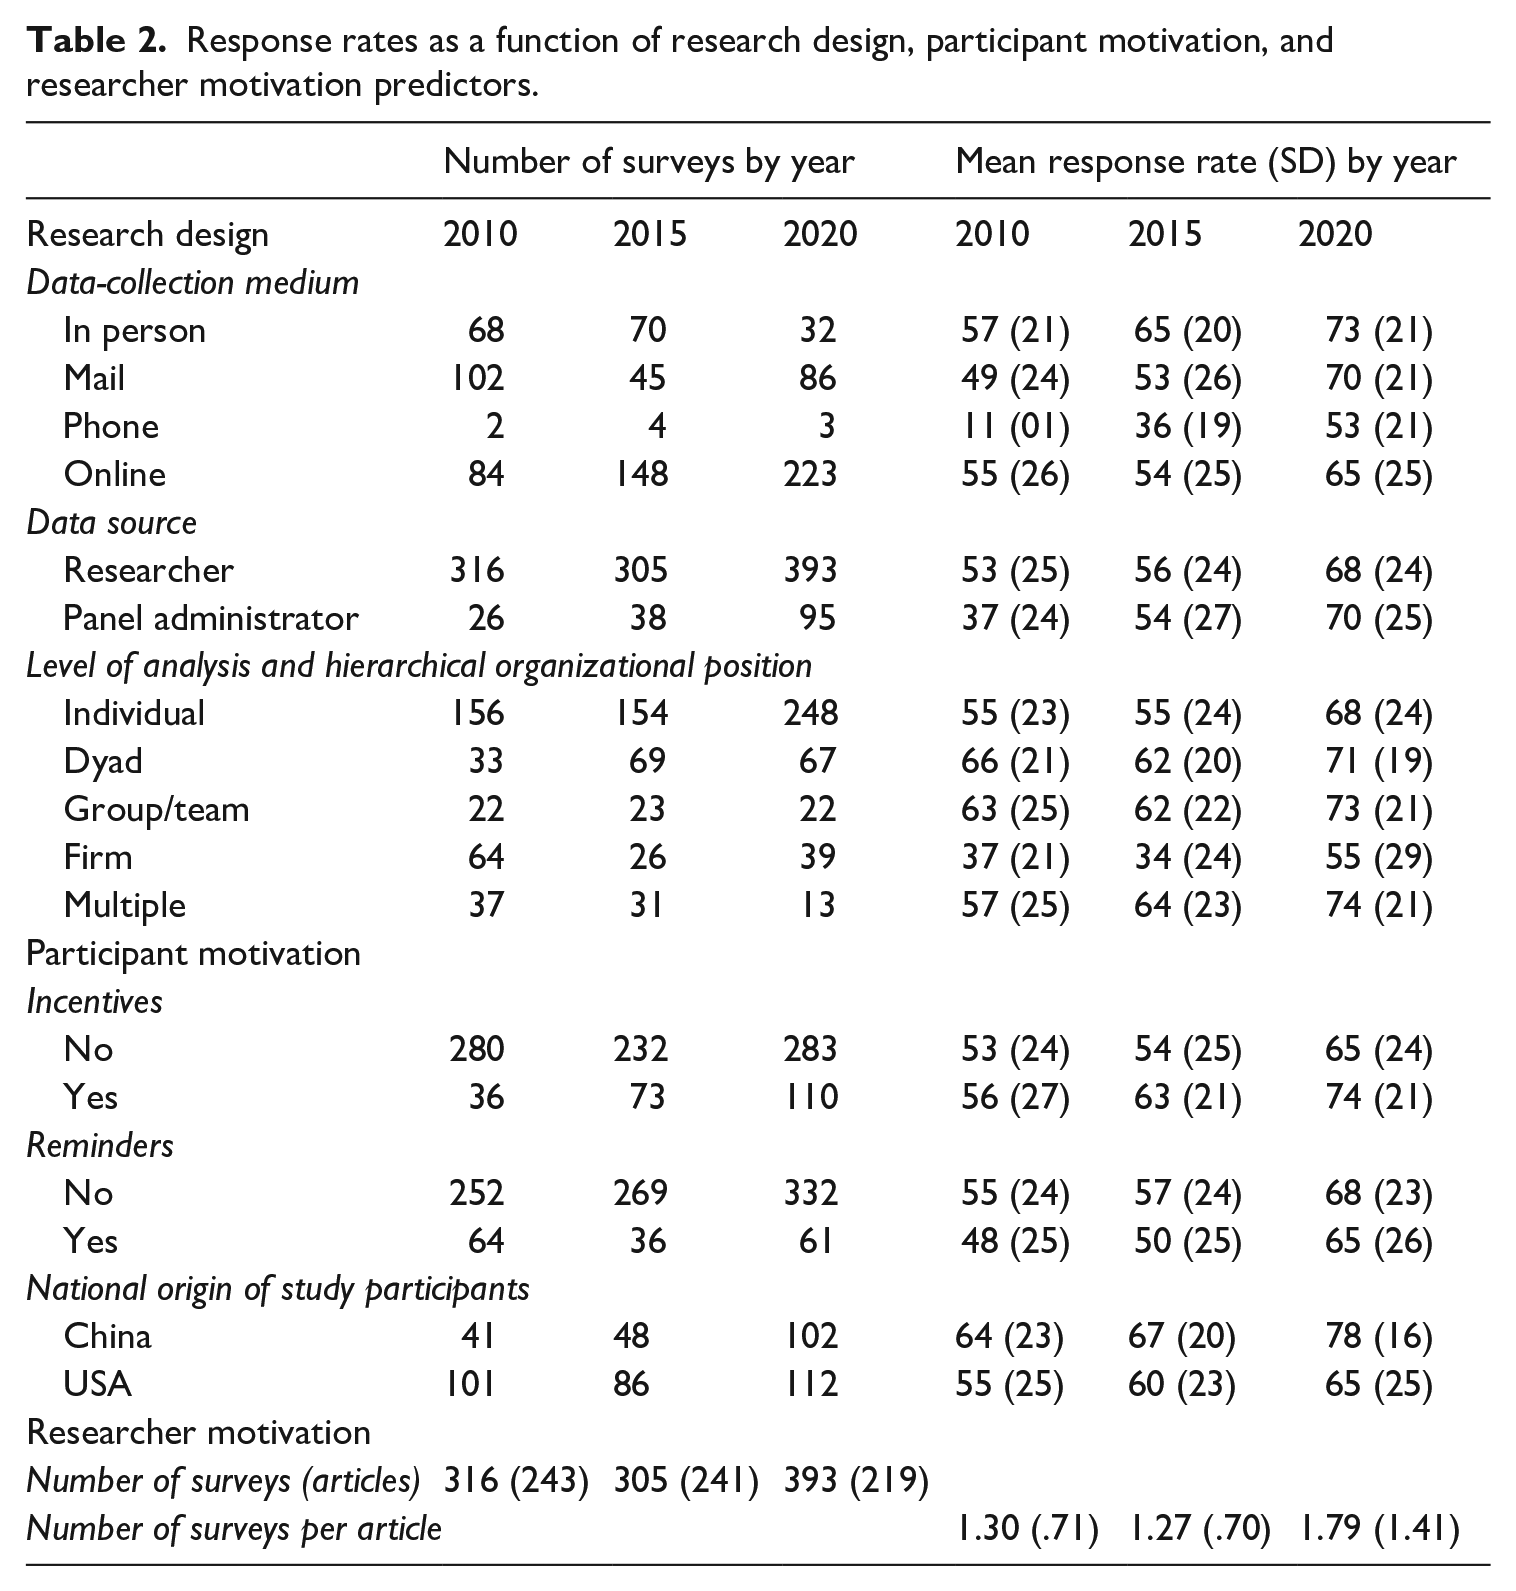
To understand if the increase in response rates in published research over time (Research Question 1) is related to changes in methodologies for survey delivery (Research Question 2), we conducted a fully crossed ANOVA including two factors: (a) data-collection medium (i.e. in-person, mail, phone, or web) and (b) year (i.e. 2010, 2015, and 2020). For the omnibus test, F(11, 855) = 8.28, p < .001, η2 = 0.10. As a follow-up, we examined each of the two main effects as well as the data-collection medium by year interaction. For data-collection medium, F(3, 855) = 7.27, p < .001, η2 = 0.03, and for year, F(2, 855) = 8.08, p < .001, η2 = 0.02, and for the interaction effect, F(6, 855) = 1.46, ns. There were statistically significant increases in response rates of 17% between 2015 and 2020 for mail, t(129) = 3.97, p < .001, d = .73) and of 11% for web, t(369) = 4.16, p < .001, d = .44). The difference was not significant for in-person surveys, t(100) = 1.89, ns. In sum, the response rate percentage increase from 2015 to 2020 appears to be driven by increases in both of the dominant data-collection media (mail and web). The response rate for surveys administered online were not significantly higher than those administered by mail in 2010, t(184) = 1.73, ns; 2015, t(191) = 0.24, ns; or 2020, t(307) = −1.43, ns.
Data source
As shown in Table 2, the number of published surveys using panel administrators increased from 26 in 2010 and 38 in 2015 to 95 in 2020. 2 In 2010, survey response rates for data collections by panel administrators were statistically significantly lower than those for data collections by researchers, t(340) = −3.29, p < .01, d = −.67. However, the difference in response rate percentages between the two data sources was not significant in 2015, t(341) = −0.52, ns nor in 2020, t(486) = 1.01, ns. Thus, to answer Research Question 3, while there were differences in 2010, there were no differences in response rate percentages in 2015 or 2020 based on who collects the data.
Level of analysis and hierarchical organizational position
As can be observed in Table 2, the highest response rates are generally seen for the individual level of analysis or situations involving multiple levels (e.g. dyad, group/team, multiple). Clearly, the lowest rates are observed at the firm level. To understand how changes in response rates at different levels might influence the overall trend (Research Question 1), we conducted a fully crossed ANOVA with two factors: level of analysis (i.e. individual, dyad, group/team, firm, and multiple) and year (i.e. 2010, 2015, and 2020). For the omnibus test, F(14, 989) = 12.18, p < .001, η2 = 0.15. As a follow-up, we examined each of the two main effects as well as the level of analysis by year interaction. For level of analysis, F(4, 989) = 21.05, p < .001, η2 = 0.08, and for year, F(2, 989) = 16.11, p < .001, η2 = 0.03. For the interaction term, F(8, 989) = 0.80, ns. Specific comparisons revealed changes in the response rates within levels of analysis over the 2015–2020 period. The increase in the average response rate for individuals between 2015 and 2020 of 13% is statistically significant (t(400) = 5.11, p < .001, d = .52). Further, the increase at the firm level from 2015 (34%) to 2020 (56%) (t(63) = 3.07, p < .001, d = .78) is significant. In sum, as regards Research Question 4, response rates vary across levels of analysis and the trends from 2015 to 2020 show a significant increase in the response rate for individual-level and firm-level surveys.
Participant motivation: Research Questions 5–7
Incentives
To test the influence of incentives, we conducted a fully crossed ANOVA with two factors: incentive use (i.e. yes and no) and year (i.e. 2010, 2015, 2020). For the omnibus test, F(5, 1008) = 18.18, p < .001, η2 = 0.08. As a follow-up, we examined each of the two main effects as well as the incentives by year interaction. For incentives, F(1, 1008) = 11.41, p < .001, η2 = 0.01, and for year, F(2, 1008) = 24.17, p < .001, η2 = 0.05. For the interaction term, F(2, 1008) = 0.65, ns. The response rate for surveys that reported the use of incentives was not significantly higher than those that did not report the use of incentives in 2010, t(314) = 0.72, ns, but the difference was significant in 2015, t(303) = 2.65, p < .008, d = .36. In 2020, the response rate for surveys that reported the use of incentives (74%) was higher than for those where no incentive was reported (65%), t(391) = 3.23, p < .01, d = .36. Thus, in 2015 and 2020, the use of incentives appears to increase response rates (Research Question 5).
Reminders
To test the influence of reminders, we conducted a fully crossed ANOVA with reminder use (i.e. yes or no) and year (i.e. 2010, 2015, 2020). For the omnibus test, F(5, 1008) = 16.05, p < .001, η2 = 0.07. As a follow-up, we examined each of the two main effects as well as the reminders by year interaction. For reminders, F(1, 1008) = 6.83, p < .01, η2 = 0.01, and for year, F(2, 1008) = 23.39, p < .001, η2 = 0.04. For the interaction term, F(2, 1008) = 0.37, ns. Similar to the Baruch and Holtom (2008) findings, in 2010 we observed the use of reminders is associated with lower response rates (t(314) = −2.07, p < .05, d = −.29) but this difference was not significant in either 2015, t(303) = −1.51, ns, nor in 2020, t(391) = 0.96, ns (Research Question 6).
National origin of study participants
Following the same general trend as in many other scientific fields, Table 2 shows that although the USA was clearly the leading source of study participants in 2010 (i.e. 101 studies compared with 41 from China), this difference has virtually disappeared in 2020 (i.e. 112 in the USA vs. 102 in China). To test differences in response rates, we conducted a fully crossed ANOVA with country (USA and China) and year (i.e. 2010, 2015, 2020). For the omnibus test, F(5, 484) = 11.52, p < .001, η2 = 0.11. As a follow-up, we examined each of the two main effects as well as the interaction. For country of study, F(1, 484) = 18.60, p < .001, η2 = 0.05, and for year, F(2, 484) = 12.16, p < .001, η2 = 0.05. For the interaction term, F(2, 484) = 0.68, ns. Surveys conducted with US-based participants reported mean response rates of 55%, 60%, and 65% in years 2010, 2015, and 2020, respectively, against mean response rates of 64%, 67%, and 78% for China-based surveys published in those same years. These differences are not significant in 2010, t(140) = −1.92, ns, or 2015, t(132) = −1.75, ns. Results did show a difference in 2020, t(212) = −4.35, p < .001, d = −.60. In short, response rates in China (78%) were significantly higher than the USA (65%) in 2020 (Research Question 7).
Researcher motivation: Research Question 8
Number of surveys per article
To examine a possible increase in surveys per article over time, we conducted a one-way ANOVA and the omnibus test showed an increase over time, F(2, 700) = 21.01, p < .001, η2 = 0.06. Pairwise comparisons showed that there was no change from 2010 to 2015, t(482) = 0.54, ns. However, a significant increase of number of surveys per article did occur from 2015 to 2020, t(458) = 5.22, p < .001, d = .49. In answering Research Question 8, we note no difference between the number of surveys per article from 2010 to 2015 and a jump in the average number of surveys per article from 1.27 in 2015 to 1.79 in 2020.
Discussion
We found a substantial increase in average response rates from 48% in 2005 to 53% in 2010 to 56% in 2015 and 68% in 2020. In addition, as shown in Table 1, response rates for journals that focus primarily on the individual and team levels of analysis were almost universally near or above 70%. In contrast, journals focusing on the firm and higher levels of analysis have much lower response rates. For example, for 2020 it was 17% for Strategic Management Journal and 21% for Journal of International Business Studies. Also, not surprisingly, the proportion of data collected online has increased notably from 33% of all surveys in 2010 to 65% in 2020.
Our inquiry into research-design issues hypothesized to influence response rates provided insights on when rates are higher. First, regarding data-collection medium, there was no difference in average response rate between mail or online surveys across any of the years. Second, regarding data source, while response rates for data-collection efforts by panel administrators in 2010 were lower than those for researcher-led collections, there were no differences in 2015 or 2020. Finally, regarding level of analysis, while the trends from 2015 to 2020 show a significant increase in the percentages for both individual- and firm-level data collections, the averages at the firm level continue to lag behind the individual, dyad, and group levels. In short, the improvement in response rate appears to be a relatively broad effect in that all collection modalities and sources as well as the vast majority of journals show increases.
Analysis of participant-motivation issues revealed the following. First, in 2015 and 2020, the use of incentives is associated with higher response rates. The difference in 2020 was nearly 10 percentage points higher for surveys promising incentives. Second, as has been seen in prior research (Baruch and Holtom, 2008), in 2010, the use of reminders was associated with lower response rates. However, there was no difference noted in 2015 or 2020.
Regarding researcher motivation, we found an increase from 2015 to 2020 in the average number of studies included in published articles. The ratios were most pronounced at more micro-oriented journals (e.g. Journal of Applied Psychology = 2.57; Organizational Behavior and Human Decision Processes = 2.43; Personnel Psychology = 3.44).
Second, we also found evidence that nation of origin for each study had a strong impact on response rates. In addition to the almost 150% increase in number of studies published from China, the response rate increased from 64% to 78% whereas the response rate for the USA increased from 55% to 65%. In sum, country of origin has become a prominent influence on response rates. The increasing number of social-science researchers based in China may well be improving the quality of survey administration to participants, which is generating higher response rates across the board. This has important implications for our theories. For example, this is a ripe opportunity to test the generalizability of our core theories across different cultures as well as develop new theories. It also calls for continued efforts to diversify the editorial teams and reviewer bases of management and applied psychology journals so as to better understand potential differences in research methodologies and survey construction.
Improving RR inferences by going beyond norms and benchmarks
Given the substantial increase in response rates reported above, should consumers of research feel more confident than ever in the survey-based knowledge being published? Our response is that high response rates do not guarantee validity. Instead, we believe it is imperative to know more about the data-collection effort to gather evidence about its validity. For example, Aguinis et al. (2018: 84) raised a concern regarding the “relative lack of methodological transparency about the process of conducting empirical research that eventually leads to a published article”. The reasons for enhanced methodological transparency have to do with issues regarding generalizability and in particular, reproducibility of the study (Bergh et al., 2017). Worse than transparency is neglecting to report response rate—a phenomenon identified by Baruch (1999: 426). Our review revealed a persistent problem in the reporting of survey-based research. Specifically, we found a growing number of articles with surveys where authors did not report a response rate at all (25 in 2010, 46 in 2015, and 74 in 2020). More importantly, we found that a number of authors did not include sufficient information on precise steps, decisions, and judgment calls made during their scientific inquiry (Aguinis et al., 2018). In each of the three years examined, a meaningful proportion of the surveys examined (28%, 18%, and 19%) did not include a discussion of their calculation of their response rate beyond the number of surveys received. This finding is consistent with past work that found significant failures to report sample sizes, information about population sizes, and discarded or unusable responses (Baruch and Holtom, 2008; Mellahi and Harris, 2016). In an encouraging sign, the percentage of articles in which authors justified their response rates and discussed potential response biases and gave a basis for comparison against response rates in other studies increased significantly in 2020 compared with 2010 and 2015 (from 38% and 43% to 58%).
Campion (1993) expressed three ultimate goals in reporting about the sample and setting for research. First, researchers should affirm that the sample, setting, and context are appropriate for the research question and adequately generalizable. Second, they should explain or justify the inevitable trade-offs that occur in obtaining responses (e.g. using an acceptable sampling strategy such as random, representative, or convenience; consider the timing of the study relevant to events that could influence results). Finally, authors should sufficiently describe the sampling strategy employed so as to determine the degree to which statistical inferences can be made (e.g. explain all efforts to increase response rates like reminders and incentives; explain sample attrition in multi-wave studies; address the potential influence of nonrespondents). It is therefore obvious that simply providing the aggregate number of surveys distributed, the total number of useful responses, and dividing the two to arrive at a RR value falls far short of these goals.
Before we explain what we believe is a more comprehensive and informative approach to assessing the adequacy of a particular RR, we first want to illustrate why a singular and exclusive focus on achieving a high RR does not guarantee an accurate depiction of the target population. Imagine a case where the population is divided 80%–20% across a certain characteristic (e.g. religion, nationality, or gender in a specific profession). The RR is 90% for those in the majority group (80% of population), but only 10% for the minority group (20% of population). Overall, the RR for this data collection is 74%, which would be considered to be high relative to generalized benchmarks. However, the responses are a very poor representation of the thoughts or opinions of the minority population. In contrast, a data-collection effort with a low response rate using a random sampling scheme may produce valid conclusions if the respondents are demonstrated to be representative of the broader population across a number of other relevant characteristics. Put differently, a high RR may not allow for valid inferences and a low RR might adequately represent the broader population. Thus, it would be a mistake to appreciate a study more simply because of its high RR or appreciate another article less because of its low RR.
In sum, to properly assess the adequacy of a reported RR, more information is needed. Thus, we offer a framework for assessing the validity of conclusions based on a particular RR. Building upon the measurement literature, we discuss RR validity as a matter of degree: the more evidence of validity that is presented, the more confident we are about the appropriateness of a particular sample.
Functional RR and dysfunctional RR
Our validity-based framework for a deeper understanding of response rates leads us to introduce two new concepts: functional RR and dysfunctional RR. We posit that functional RR is desirable and one from which we can derive conclusions with high confidence and allows us to make inferences about the targeted population (i.e. high validity). On the other hand, dysfunctional RR is undesirable because it leads to inaccurate conclusions and inferences about the targeted population (i.e. low validity).
Next, we discuss conditions under which a high RR may be functional or dysfunctional and do the same thing for a low RR, as summarized in Figure 2. For example, a study with a RR = 85% in which participants were coerced to participate fits in the High RR/Dysfunctional quadrant in Figure 2. Similarly, a study with a high RR in which participants are inattentive and filled out a survey as quickly as possible to be compensated (e.g. MTurk, Qualtrics) is also High RR/Dysfunctional. 3 In addition, a study with a low RR that involved random sampling and a careful check of responses including cleaning the data to remove inattentive responses (DeSimone and Harms, 2018) or false identities (i.e. participation of non-targeted individuals) (Bernerth et al., 2021) would be Low RR/Functional. As noted by Rogelberg and Stanton (2007), there is a need to understand WHY a study has the (low or high) RR that it has. This is what allows us to be more or less confident about a study’s conclusions rather than the RR value in isolation and without any additional supporting information on how that particular RR was reached.
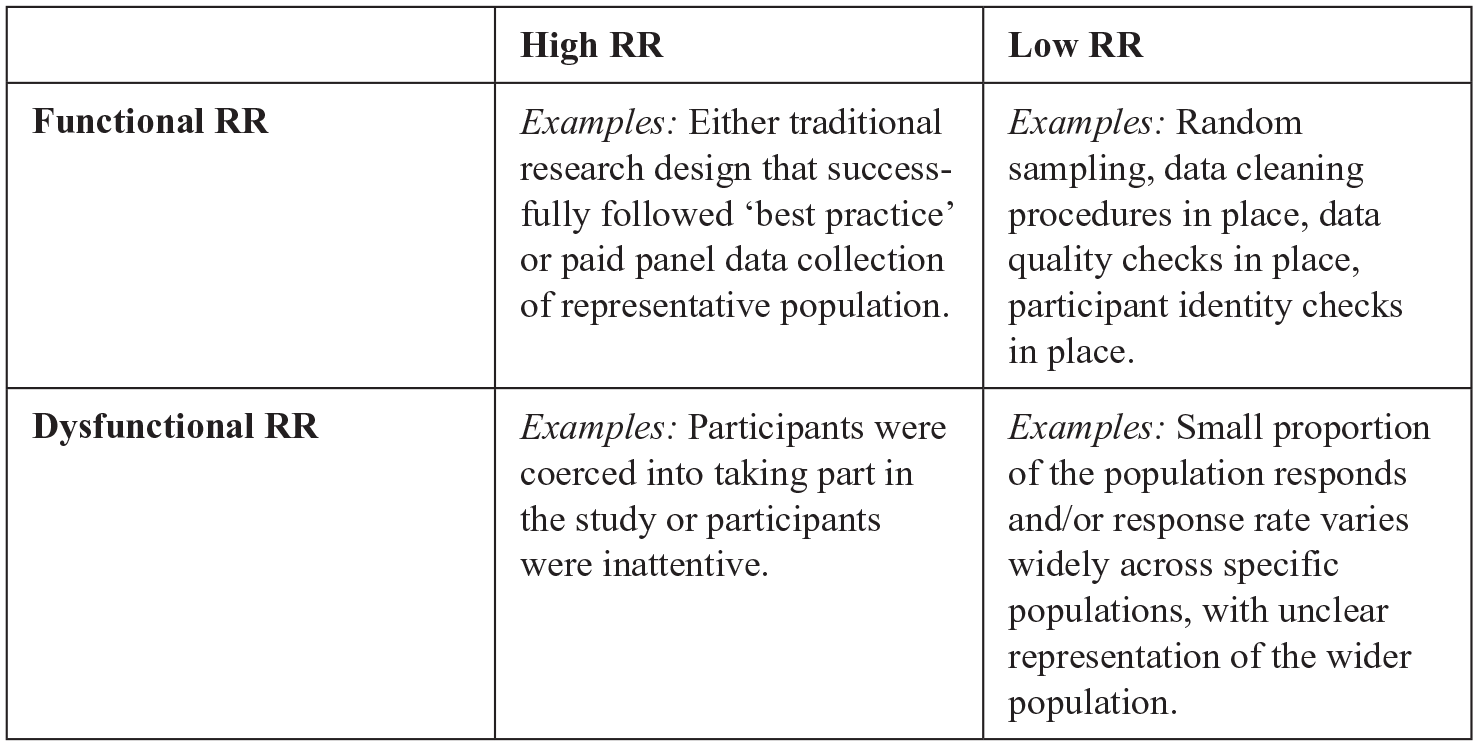
Functional RR and Dysfunctional RR.
A validity framework for evaluating response rates
One major factor changing the RR landscape is the creation of “professional respondents”—people who fill in questionnaires to make money. During the past decade, MTurk by Amazon has become one of the most important sources for surveys using their own cohorts of participants. MTurk enables the rapid collection of large amounts of worthy human subjects’ data (Aguinis et al., 2021). This may lead to an environment where even participants in studies not facilitated by these providers have begun to expect compensation for participating. Another potential reason for critically evaluating response rates is the use of electronic survey tools (e.g. Qualtrics or SurveyMonkey), which enable a professional approach and user-friendly design. They make it easy for respondents to complete the surveys where and when they want, but they may facilitate a less deliberate approach to reflecting upon and responding to survey items.
Another emerging issue is the difference in response rates in different parts of the world. In our analysis we noted that surveys administered in China had higher response rates than those in the USA. But, knowledge on the response rate values alone is not sufficient to understand the reasons for this difference.
We suggest a new theoretical framework for improving our understanding of RR. We propose the need to engage in a validation process much like we engage in a validation process to answer the question of whether inferences drawn from a measure are valid. We propose a RR validity assessment framework in conjunction with benchmarks to make judgments about the extent to which a sample is appropriate, namely that one can make an inference from it to the wider relevant population. In measurement theory, validity is a not a dichotomous variable (i.e. “valid vs. not valid”); rather, it is a matter of degree (Aguinis et al., 2001). We propose the same for RR: a particular RR per se is NOT good or bad, it is a matter of degree in terms of the validity and types of inferences that can be drawn from the sample that was collected. The more evidence we are able to gather pertaining to the conclusion that the sample is appropriate, the more confidence we have about the resulting RR—regardless of a study’s particular RR.
RRs are an “attention-driven” phenomenon (Hobfoll et al., 2000). It follows that response quality should be expected to be related to the amount of cognitive effort the participant is willing to invest in reflecting on and accurately responding to the survey they receive, as resources are limited. As attention increases, the validity of a response would be expected to increase. This should caution the field against an exclusive focus on RR benchmarks that cause researchers to believe they need to take shortcuts—perhaps in the form of excessive reminders or excessively incentivizing respondents—in such a way that response quality and survey response validity becomes questionable. If participants are only answering a survey just to get paid, or are doing so in the midst of taking lots of surveys or participating in lots of studies to generate an income stream, it is reasonable to assume that their attention to the items and their ability to reflect is reduced.
Our framework involves a validation-based RR assessment strategy. Overall, we view this process as subsuming a test validation strategy (Colquitt et al., 2019; Djurdjevic et al., 2017) and a nonresponse bias impact assessment strategy (Rogelberg and Stanton, 2007). In developing evidence for validity, each of several different types of evidence provides useful insights. Each approach has strengths and limitations. There is no one definitive approach and no particular piece of evidence that is sufficient to ward off all validity threats. Likewise, assessing a RR requires inspecting different types of evidence. The case for sample quality is built on multiple pieces of evidence that converge—what the measurement validation literature refers to as triangulation (Scandura and Williams, 2000).
We focus on content validity evidence as it is particularly relevant for our proposed RR validation process and provide suggestions on what questions researchers (and evaluators and consumers of research) need to answer to understand the appropriateness of inferences based on the RR in hand. Below, we identify six different factors that need to be balanced in evaluating a response rate so that readers can evaluate the appropriateness of inferences and Table 3 offers a summary.
A validity assessment framework for evaluating response rate.
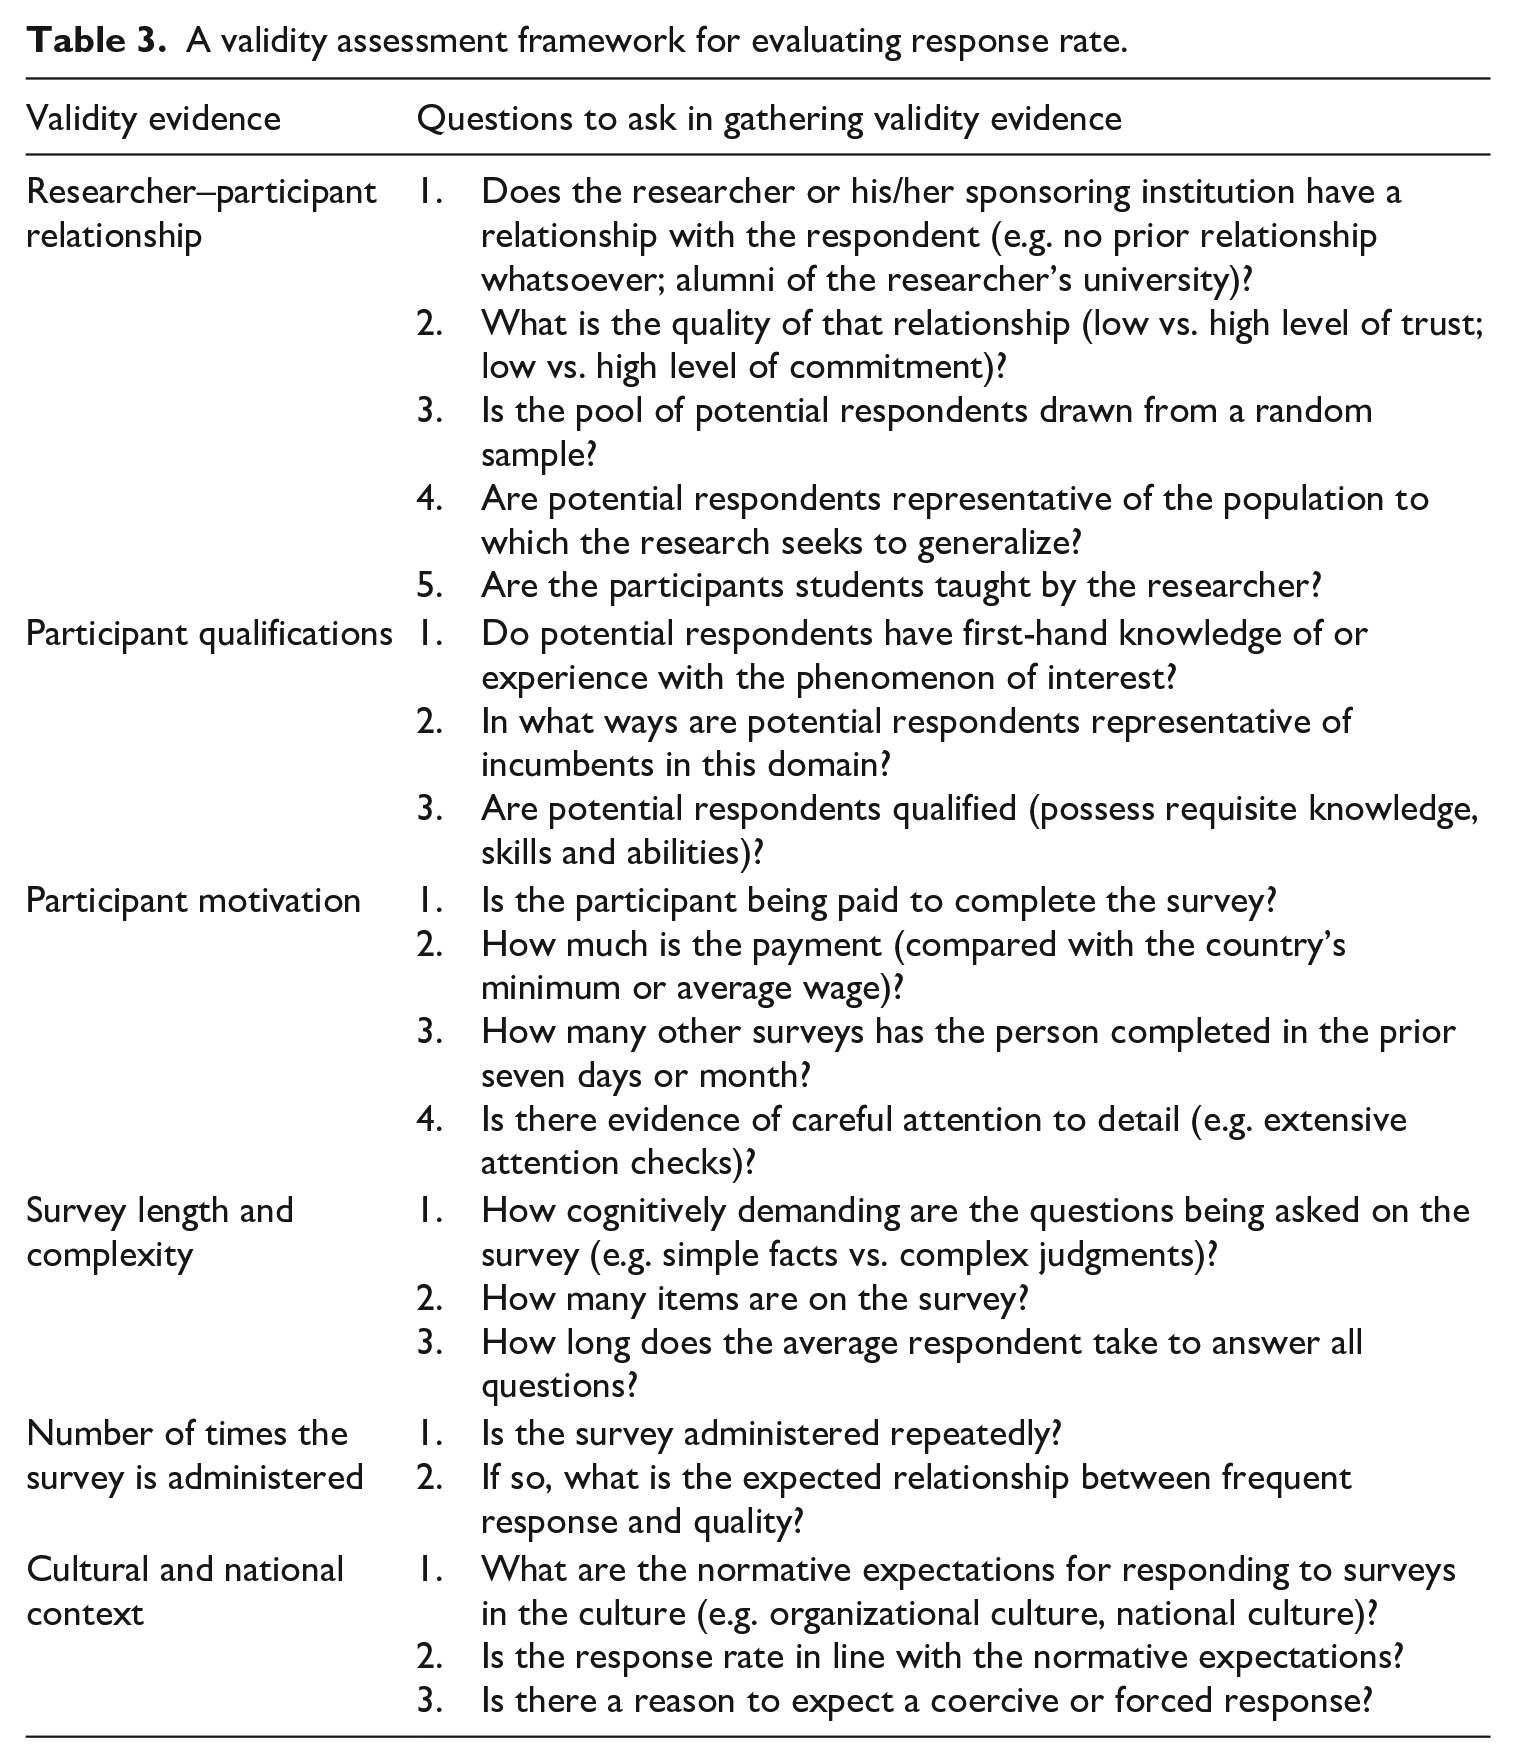
Researcher–participant relationship
There are two concerns here. The first is that a power or status difference may lead to a participant feeling coerced to respond, and this coercion may impact both the likelihood of response as well as the nature of the response. The second concern is that participants may want to help the researcher and thereby respond in a way that is socially desirable rather than accurate. In general, a response rate should be seen as more valid when the responses are freely given without a fear of coercion, and they should be seen as more valid when participants are less aware of the specific hypotheses being tested.
Participant qualifications
Sufficient information about who actually responds to a survey in relation to the questions asked is essential in determining whether inferences from survey research are valid. For surveys assessing personality or cognition, we can safely assume that the participant is qualified to respond. But there are other cases where some respondents may not be as qualified as others, and that would make a response rate less valid. As an example, if senior executives or top management team members are surveyed about a firm’s strategic choices and we can be sure that they respond, those responses would be more valid than those where we either cannot be sure who responded (i.e. where there is a firm-level response submitted by an unknown respondent) or where lower-level managers are asked those questions. Detailed information about team sizes and span of control as well as where the individuals sit within the organizational context is important to know as the person being surveyed may not have sufficient time or attention to observe the focal target of the survey. If a manager has 50 direct reports, for example, it is safe to assume that she is less able to truly differentiate between her team members on scales of behaviors than a manager with 10 direct reports only.
Participant motivation
A participant’s motivation to complete the survey may increase or decrease the validity of the RR for that survey. Researchers should be aware that the provision of tangible benefits as an incentive to participate may subtly coerce respondents and impact responses to screening items and eligibility checks. When a researcher provides pre-notification, reminders, nudges, additional incentives, and personalized feedback, the participant’s motivation may change from a more neutral one where the survey questions are reflected on and answered thoughtfully to one where the participant is simply responding to alleviate the pressure from the researcher, or to get a flattering piece of information back about themselves.
Participant motivation and incentives are particularly salient when those benefits are a high percentage of the income of the potential participant. While US$0.50 or US$5.00 may not seem to be a great deal of money in isolation or to a researcher based in a wealthy country, there is a subculture of professional participants who communicate with each other on the opportunities to complete MTurk tasks and surveys and on how to clear qualification barriers and generate significant income (Aguinis et al., 2021). While none of these developments invalidates the use of these data-collection outsourcing providers, the difficulty to observe and report on these potentially increases the risk to researchers and consumers of research that a reported response rate to a survey conducted with this methodology may be less valid than one where there was tighter control over and greater transparency into the participant recruitment, screening, and survey-administration processes.
Survey length and complexity
A number of researchers have documented an association between survey length and measurement error. This creates a tension between the amount of information that can be collected from respondents and the quality of these data (e.g. Peytchev and Peytcheva, 2017: Weisberg, 2005). In addition to fatigue concerns, in the case of longer surveys, some participants will pause the survey and complete it later. This means they may respond to different parts of the same survey in different moods (Egloff et al., 1995), which can affect responses.
Number of times the survey is administered
In general, a repeated measures design where the same scales are deployed more than once introduces the potential for some respondents to exhibit a psychological disposition to respond in a consistent manner (Podsakoff and Organ 1986; Steenkamp and Baumgartner, 1998). While there are many benefits of a multi-wave data collection (including but not limited to the reduction in common method variance), it is not a panacea. For example, as Podsakoff and colleagues (2003: 888) noted, temporal separation may allow contaminating factors to intervene and thus “could mask a relationship that really exists”.
Cultural and national context
There is no such thing as a “correct” or “perfect” cultural context. However, the cultural characteristics of participants may shape RR validity under certain contexts and, thus, should be reported. Indeed, there is research demonstrating different cultural norms can impact response styles (Baruch, 1999; Chen et al., 1995; Ross et al., 2002). Furthermore, there are cultural contexts where a participant may feel more compelled to “help” a researcher by participating (e.g. high collectivism). As well, there may be organizational culture effects that influence the rate or authenticity of responses (e.g. where a participant desires to “help” a researcher; the survey is considered an essential part of voicing concerns).
Conclusions
Researchers, evaluators of research including journal editors and reviewers, and consumers need to know whether a survey study’s sample is of high quality, appropriate, and representative. We analyzed RR information reported in 1014 surveys described in 703 articles from 17 journals from 2010 to 2020 and ascertained a steady increase in average response rate from 48% in 2005 to 53% in 2010 to 56% in 2015 and 68% in 2020. We also found a marked increase in the number of surveys per published article from 1.27 in 2015 to 1.79 in 2020; and that variables that predict RR fluctuations over time are related to research design (e.g. data-collection medium), participant motivation (e.g. incentives), and researcher motivation (i.e. number of surveys per article).
At present, researchers rely on reporting a study’s RR and finding a benchmark value to be able to justify the appropriateness of their sample. For researchers, being able to report a response rate that seems appropriate is key because it signals a study’s publication deservingness. With that said, the practice of relying on RR as a unitary and exclusive indicator has many problems—beginning with the fact a low RR does not necessarily mean low quality and a high RR does not necessarily mean high quality and appropriateness, as described by our analysis of functional and dysfunctional RR. In our view, understanding whether a sample is of high quality involves considering contemporary norms, but going beyond comparing a simple RR value against a benchmark. Based on the measurement validity and nonresponse bias literatures, we offer a validity assessment framework consisting of gathering evidence on the extent to which a sample is of high quality, appropriate, and representative. Certainly, reporting RR is a necessary step. But, there is a need to go beyond a dichotomous “yes/no” evaluation to a deeper understanding on the degree of confidence we can place on a particular sample, and this requires gathering information on the researcher–participant relationship, participant qualifications and motivation, survey length and complexity, and cultural and national context, as detailed in Table 3.
We hope our review and proposed validity assessment framework will positively influence the evaluation of response rates by research producers, evaluators, and consumers. The goal is not always to secure the highest RR possible, but to obtain the highest quality responses possible that result in a sample that is appropriate for a study’s goals. We also hope to dispel the view that a “low” RR study should immediately be considered untrustworthy. Similarly, a study with a high RR should not be automatically applauded with no further checks needed. The key indicators are, in addition to considering norms, how much validity evidence has been gathered regarding a sample’s quality, appropriateness, and representativeness.
Footnotes
Acknowledgements
The authors sincerely appreciate the excellent research assistance rendered by Scott Kelly, Hannah Evans, and Jayme Cloninger, who are students at Georgetown University. We also thank the Editor and the anonymous reviewers for their constructive support.
Funding
The authors received no financial support for the research, authorship, and/or publication of this article.
Notes
![]() . [Email:
. [Email: