
Abstract
Objective
To identify eye movement patterns that are correlated with spatial disorientation (SD) events during flights in a flight simulator that induces SD.
Background
Spatial Disorientation is one of the main causes for aviation mishaps. It can result from illusions caused by misinterpreted vestibular or visual sensory cues, leading to an incorrect perception of an aircraft’s position, attitude, or motion. SD prevention is of great importance, as there is currently no objective tool to identify its occurrence.
Method
Eye movements of 45 participants (30 aircrew members, 15 cadets) were recorded using Tobii Pro Glasses 2 in a Gyro-IPT SD flight simulator. Illusions were either vestibular or visual. Gaze metrics such as fixations, saccades (rapid gaze shift between two points), and visits were compared between subjects who experienced SD and those who did not. Statistical analyses were conducted to identify significant differences.
Results
Among 284 flight profiles, 136 SD occurrences were recorded (48%). During visual illusions the participants who more frequently checked the instrument panel had a higher chance of avoiding SD. In contrast, during vestibular illusions, participants who examined the head-up display (HUD) more frequently had a lower probability of SD occurrence.
Conclusion
Mitigating SD requires distinct eye-movement strategies tailored to the illusion type. Our results suggest that to mitigate visual illusions, there is a need for greater instrument panel focus, whereas to mitigate vestibular illusions, increased HUD engagement is needed, as opposed to the current instructions.
Application
Our findings may inform training programs to enhance performance in high-risk SD flight profiles. Additionally, results support the potential development of a real-time SD alert system for aircraft, aiming to mitigate or prevent SD-related incidents.
Keywords
Background
Spatial orientation refers to an individual’s ability to accurately perceive their position and motion relative to a reference, such as the earth. Spatial orientation relies on visual and vestibular cues or is intellectually constructed from focal visual, verbal, or other symbolic data (Gillingham, 1992). In aviation, spatial orientation pertains to an aircrew member’s ability to recognize the aircraft’s velocity, altitude, heading direction, roll, and pitch angle. Spatial Disorientation (SD) occurs when these elements are misperceived, leading to errors in interpreting motion, position, or attitude due to absent or misleading cues, primarily from the visual or vestibular systems (B Cheung & Hofer, 2003).
SD in flight is a leading cause of aircraft mishaps attributable to operator error (Gillingham, 1992). It is responsible for 5 to 10% of all mishaps, 90% of which are fatal (Antunano, 2005). A U.S. Air Force report found SD contributed to 30% of mishaps from 1990 to 1999 and 26% from 1999 to 2009 (R. Gibb et al., 2011). Similarly, SD was a factor in 20% of fatal mishaps in the U.S. Navy between 1990 and 2000 and 38% between 2000 and 2017 (Meeks et al., 2024). SD-related mishaps are frequently caused by undetected illusions, with 80% of incidents occurring without aircrew awareness (Gregg, 1955).
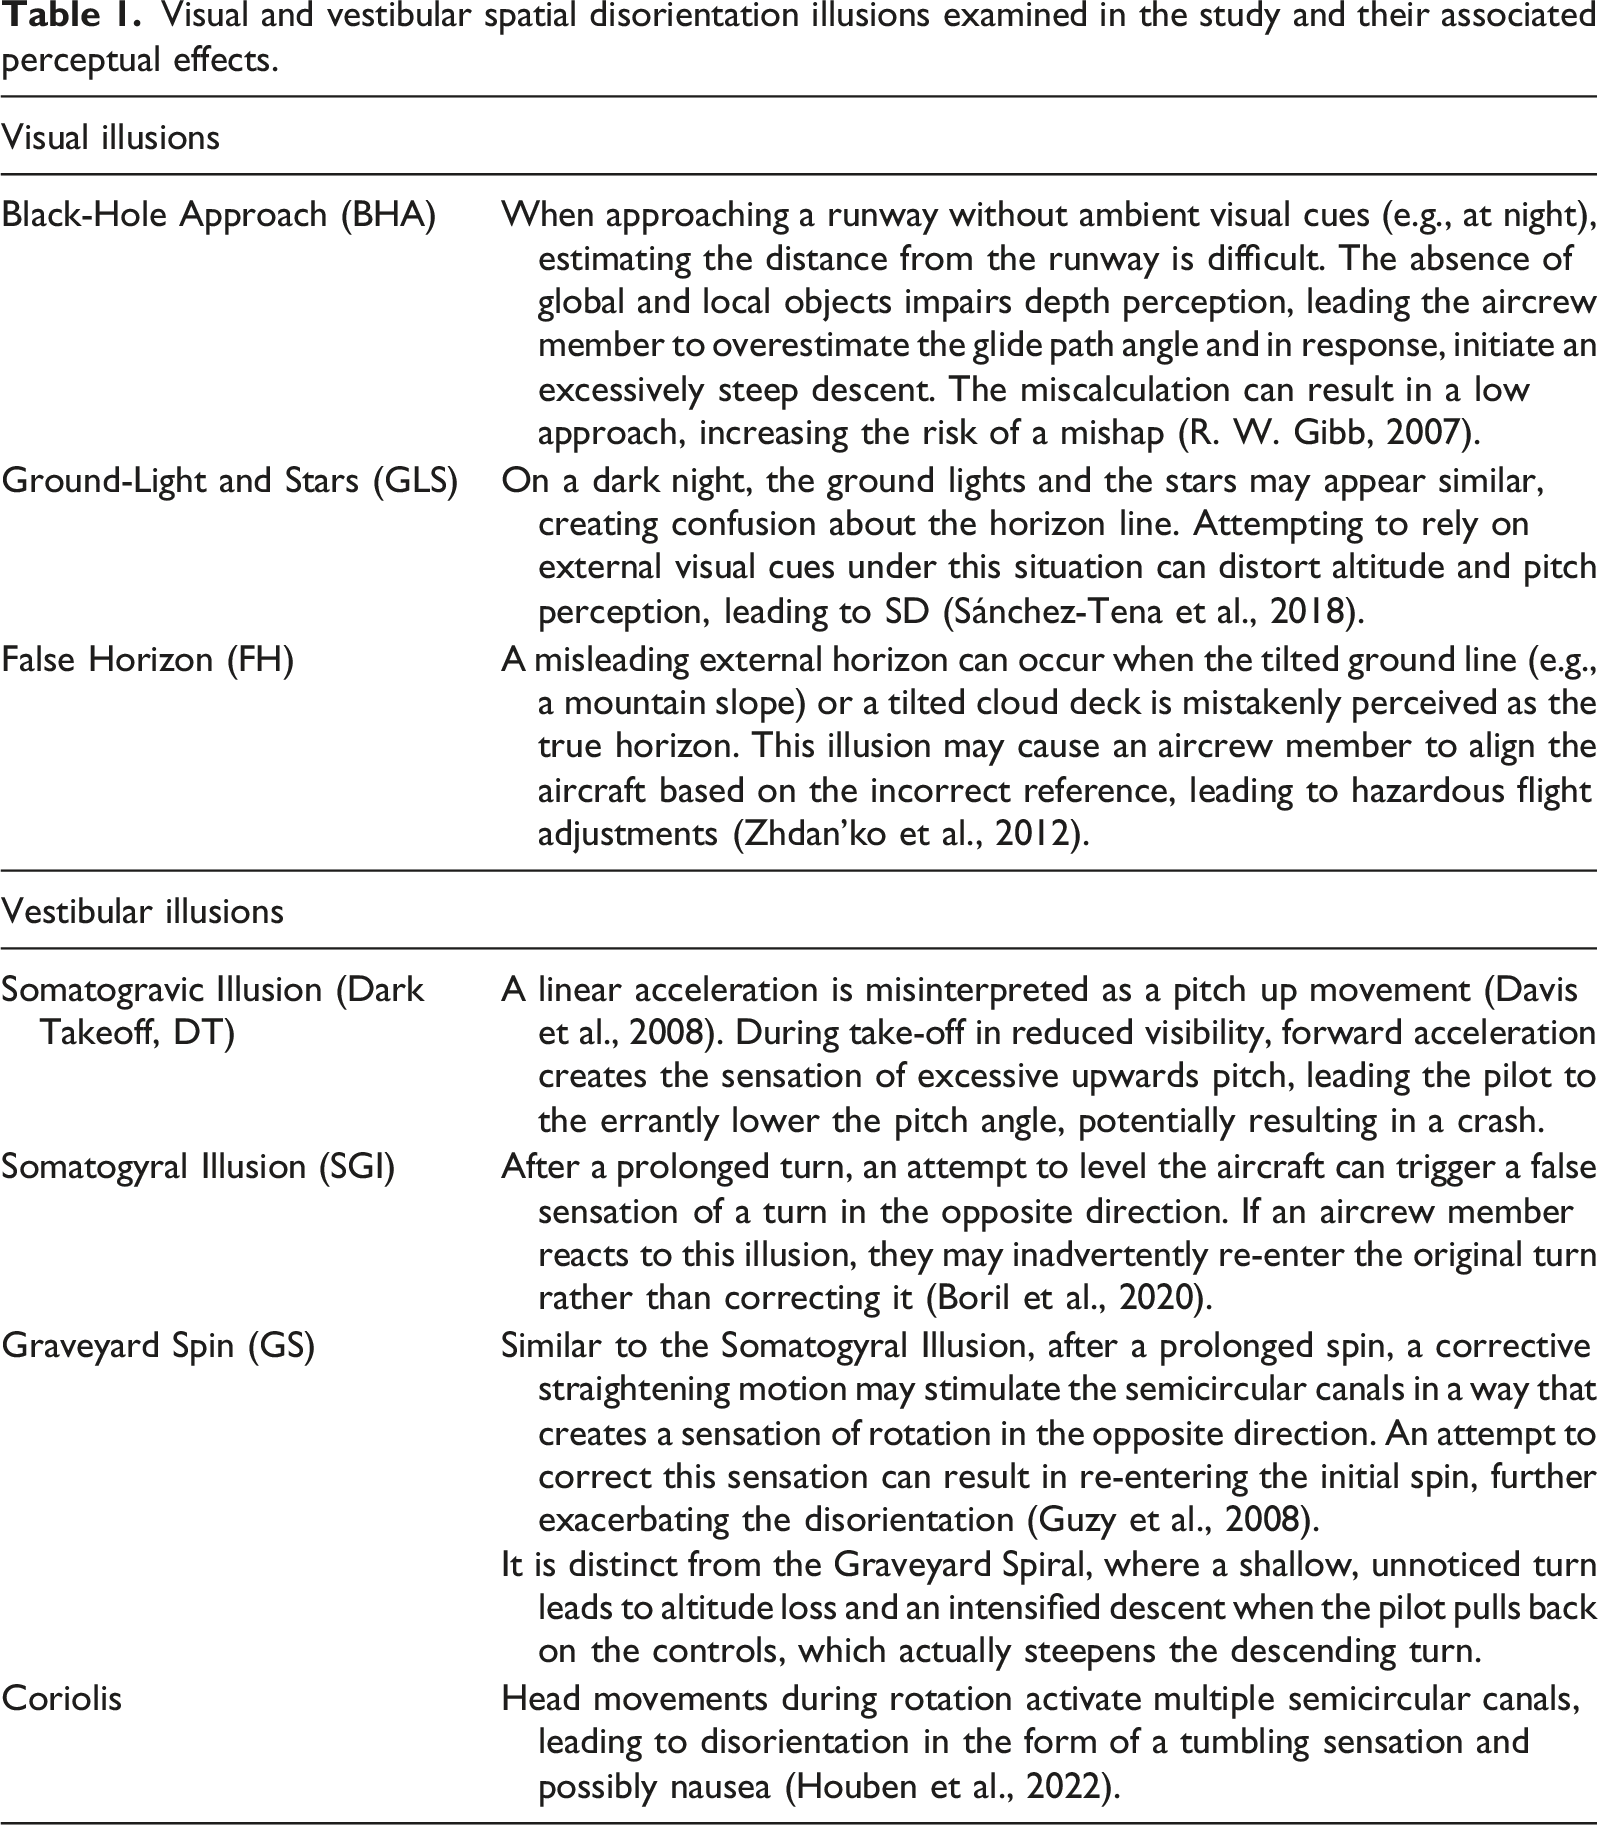
These illusions can lead to misperceptions of aircraft attitude, altitude, or motion, causing pilots to make inappropriate control inputs. For instance, the Somatogravic illusion may cause a pilot to believe the aircraft is pitching up during rapid acceleration and respond by pushing the nose down, potentially leading to controlled flight into terrain (CFIT). Similarly, Somatogyral Illusion can result in erroneous banking maneuvers while Coriolis illusions can lead to spatial confusion and disoriented escape attempts. These responses often occur without conscious awareness, especially when visual cues are degraded or ambiguous, increasing the risk of mishaps during instrument meteorological conditions, night flight, or high workload scenarios.
Visual and vestibular spatial disorientation illusions examined in the study and their associated perceptual effects.
Recent frameworks, such as the neural processing model proposed by Fudali-Czyż et al. (2024) (Fudali;Czyż et al., 2024), highlight how afferent visual, vestibular, and proprioceptive signals converge to support spatial orientation and how discrepancies between these channels may lead to unrecognized SD. This model emphasizes that when sensory conflict is high, pilots may unintentionally rely on maladaptive internal cues, increasing vulnerability to disorientation. Related research describes the “posture first principle”—the tendency for humans to prioritize balance and postural control over higher-level cognitive tasks when sensory load increases (Barra et al., 2006; Kerr et al., 1985). Under such conditions, attentional resources may shift away from instrument monitoring, creating conditions in which SD can occur without conscious awareness. Incorporating this perspective provides important context for our study, particularly the ways in which different gaze strategies during sensory conflict were associated with either increased or reduced susceptibility to SD across illusion types.
High-fidelity simulators replicating SD-inducing conditions are recommended for SD training (B Cheung & Wong, 1998). An SD simulator is a flight simulator specifically designed to induce and study spatial disorientation by integrating both visual and vestibular stimuli: (1) Visual stimuli—The simulator includes screens that replicate the aircraft’s external environment, simulating real-world flight conditions. Additionally, instrument panels are displayed, providing an objective representation of the aircraft’s accurate state for the aircrew member. (2) Vestibular stimuli—The simulator incorporates motion capabilities around the three principal axes of acceleration: pitch, roll, and yaw. The aircrew member actively controls these movements using the thrust lever and flight controls, creating a dynamic training experience. An SD simulator integrates visual and vestibular stimuli to replicate flight conditions, enhancing spatial disorientation training. These simulators allow researchers to examine physiological and perceptual phenomena that occur during SD events.
Additionally, participants consistently perceive rotation tilt during a turn, yet their pitch perception during takeoff is slower and less consistent (Tribukait et al., 2013). Furthermore, when no visual cues were available, attempts to straighten after a prolonged turn often led to an involuntary return to the original turn direction (Nooij & Groen, 2011). This occurs because the vestibular system detects angular acceleration through the semicircular canals but loses the sensation of rotation during sustained constant rate velocity turns. This can create the false perception of level flight. When the pilot exits the turn the reactivation of vestibular input is misinterpreted as a turn in the opposite direction, prompting an inappropriate “corrective” response back into the original turn.
Eye-tracking technology can provide valuable insights into pilots’ visual scanning patterns, approximating their attention to critical instruments and external cues. Eye-tracking research in aviation has shown that gaze behavior reflects workload, expertise, and situational awareness, and can reveal conditions that predispose pilots to SD (Peißl et al., 2018; van de Merwe et al., 2012; Ziv, 2016). However, it is worth mentioning that gaze position should be interpreted carefully, as eye movements do not always correspond directly to attentional allocation, as pilots may monitor elements using covert attention without fixating on them, or fixate on an element without actually processing the information that it provides (Dehais et al., 2017).
Fixations indicate sustained attention (Unsworth et al., 2020; Valliappan et al., 2020;) and may indicate cognitive processing of critical information (Just & Carpenter, 1976) or, conversely, suggest cognitive overload (Hauland, 2019). Still, research has shown that prolonged fixations on critical instruments were associated with better situation awareness building, as pilots dedicated more time to interpreting vital information needed for safe flight operations (Goldberg & Kotval, 1999). Meanwhile, the Visit measure provides a broader perspective on how often a pilot re-engages with complex visual stimuli, suggesting the re-visited areas contain necessary information for decision making (McLaughlin et al., 2017). A visit is defined as a sequence of fixations and saccades within a specific Area of Interest (AOI); multiple fixations within a single AOI during one entry count as one visit. Thus, while fixations reflect how long attention is sustained in one place, visits reflect how frequently attention returns to the same region, capturing both initial and repeated cognitive engagement with visual elements relevant to the task (Holmqvist et al., 2011).
Saccades, or rapid eye movements between fixations, are crucial for active scanning (Barfield & Furness, 1995). Frequent and well-directed saccades can indicate good situation awareness, whereas reduced saccadic activity may signal a narrowed focus or cognitive tunneling, where a pilot becomes overly reliant on a single instrument and may neglect other critical information (Di et al., 2013). Saccadic patterns are also influenced by mental effort, with increased task demand often resulting in fewer or slower saccades (Joshi et al., 2016). Furthermore, unexpected sensory outcomes, such as sudden movement errors (unexpected discrepancies between intended and perceived motion) or reversals in force field direction (unexpected changes in the sensed direction of applied forces), which signal environmental changes and trigger surprise or uncertainty, can also disrupt normal saccadic behavior, reflecting the pilot’s struggle to resolve conflicting spatial information (Yokoi & Weiler, 2021).
Thus, eye-tracking can help us understand how aircrew members respond to situational changes, such as SD illusions. Eye-tracking serves as both an objective physiological response indicator—providing information about saccades and visual scanning patterns—as well as a subjective indicator of experience, as fixation areas reveal which areas of interest received prolonged attention. When examining visual movement patterns in pilots using imagery that simulated the external visual environment of the cockpit, Thomas and Wickens (Thomas & Wickens, 2016) found that efficient movement across multiple AOIs, supported by well-timed saccades, was crucial for maintaining situation awareness and preventing SD. Similarly, prolonged fixations and visits on critical instruments were associated with better situation awareness, as pilots spent more time interpreting vital information needed to maintain safe flight operations (Goldberg & Kotval, 1999).
Research conducted in the Korean Air Force examined differences between movement patterns across flight instruments between a group where a verbal report of their flight data was required and one that wasn’t (Kang et al., 2021). That study found that the verbal report group focused more on specific AOIs and had a higher fixation frequency on altitude in the Head-Up Display (HUD) in both types of SD: Vestibular (Coriolis, GS) and Visual (GLS). A study conducted by the Japanese Air Force found that during simulations of the dark takeoff (DT) illusion, participants exhibited an involuntary downward eye movement. This was in response to the upward pitch motion, likely a reflex aimed at stabilizing the visual scene (Tamura et al., 2016). When comparing experienced pilots and non-pilot participants in Vestibular illusions (SGI and Coriolis), research found that experienced pilots were equally susceptible to SD as non-pilots (Bałaj et al., 2018).
Previous studies focused on a limited range of AOIs and illusions. A broader range of scenarios is required to gain a more comprehensive understanding of SD mechanisms. As Cheung (2013) claims, there is a need for renewed training that will improve pilots’ physical and mental performance during sensory conflict (Bob Cheung, 2013). Previous studies have also focused only on one aircrew member population: the pilot. Comparing experienced pilots to navigators and cadets can help us create better learning paradigms to help prevent SD mishaps. A broader model including different populations can add a data-driven approach to identify underlying mechanisms.
Therefore, based on existing literature, we aimed to use eye-tracking to study the mechanisms leading to SD events. Specifically, we aimed to compare eye movement patterns of aircrew members during both visual and vestibular illusions that have the potential to create an SD event. To simplify the multiple variants of analysis we focused on several factors: role (pilot and navigator), experience (cadets vs. more experienced pilots) and two main AOIs (HUD vs. head down instruments). This aimed to separate aircrew members who experienced the SD effect from those who maintained correct situational orientation. The overreaching goal was to lay the foundations for data-driven, targeted SD-mitigation training and to contribute toward the development of an evidence-based procedural guidance. By identifying which visual-scanning strategies are most effective for different classes of illusions, our findings expand the literature beyond prior illusion- or AOI-specific studies and provide applied insights grounded in operationally realistic flight scenarios.
Methods
Study Design
We recruited participants from their pre-existing training program. The participants were from two groups: flying cadets and experienced pilots. The study was approved by the Ethics Committee of the Israeli Defense Forces based on the ICH-GCP principles. This is an exploratory study and was not preregistered; therefore, the hypotheses, methods, sample size, and analysis were not submitted to an online open-science repository (like OSF) prior to conducting the study. Yet the procedure and sample size were preapproved by the ethics protocol, and the sample size was determined based on recruitment feasibility.
Apparatus and Measurement
SD simulator
Participants
Aircrew members (n = 30): operational experienced high-performance aircrew members: pilots and navigators, 30-50 years old (average 37.74 ± 5.46 years, 1 SD), with 12-22 years of experience.
Flying cadets (n = 15): pilot cadets and navigator cadets, in their second year of the flying academy (average age 19.84 ± 0.01 years, 1 SD; low variability due to uniform course timing) At the time of testing, pilot trainees had approximately 2-3 months more hands-on flight experience than navigator trainees, as their training tracks had split 3 months prior. The training profile for cadets included only 4 out of the 7 illusions, 2 visual (GLS and BHA), and 2 vestibular (SGI and Coriolis), as elaborated in Figure 2. This is due to the reliance on the HUD, which is not available in the T-6 aircraft used by cadets, for generating the remaining illusions (DT, GS, and FH). Training procedure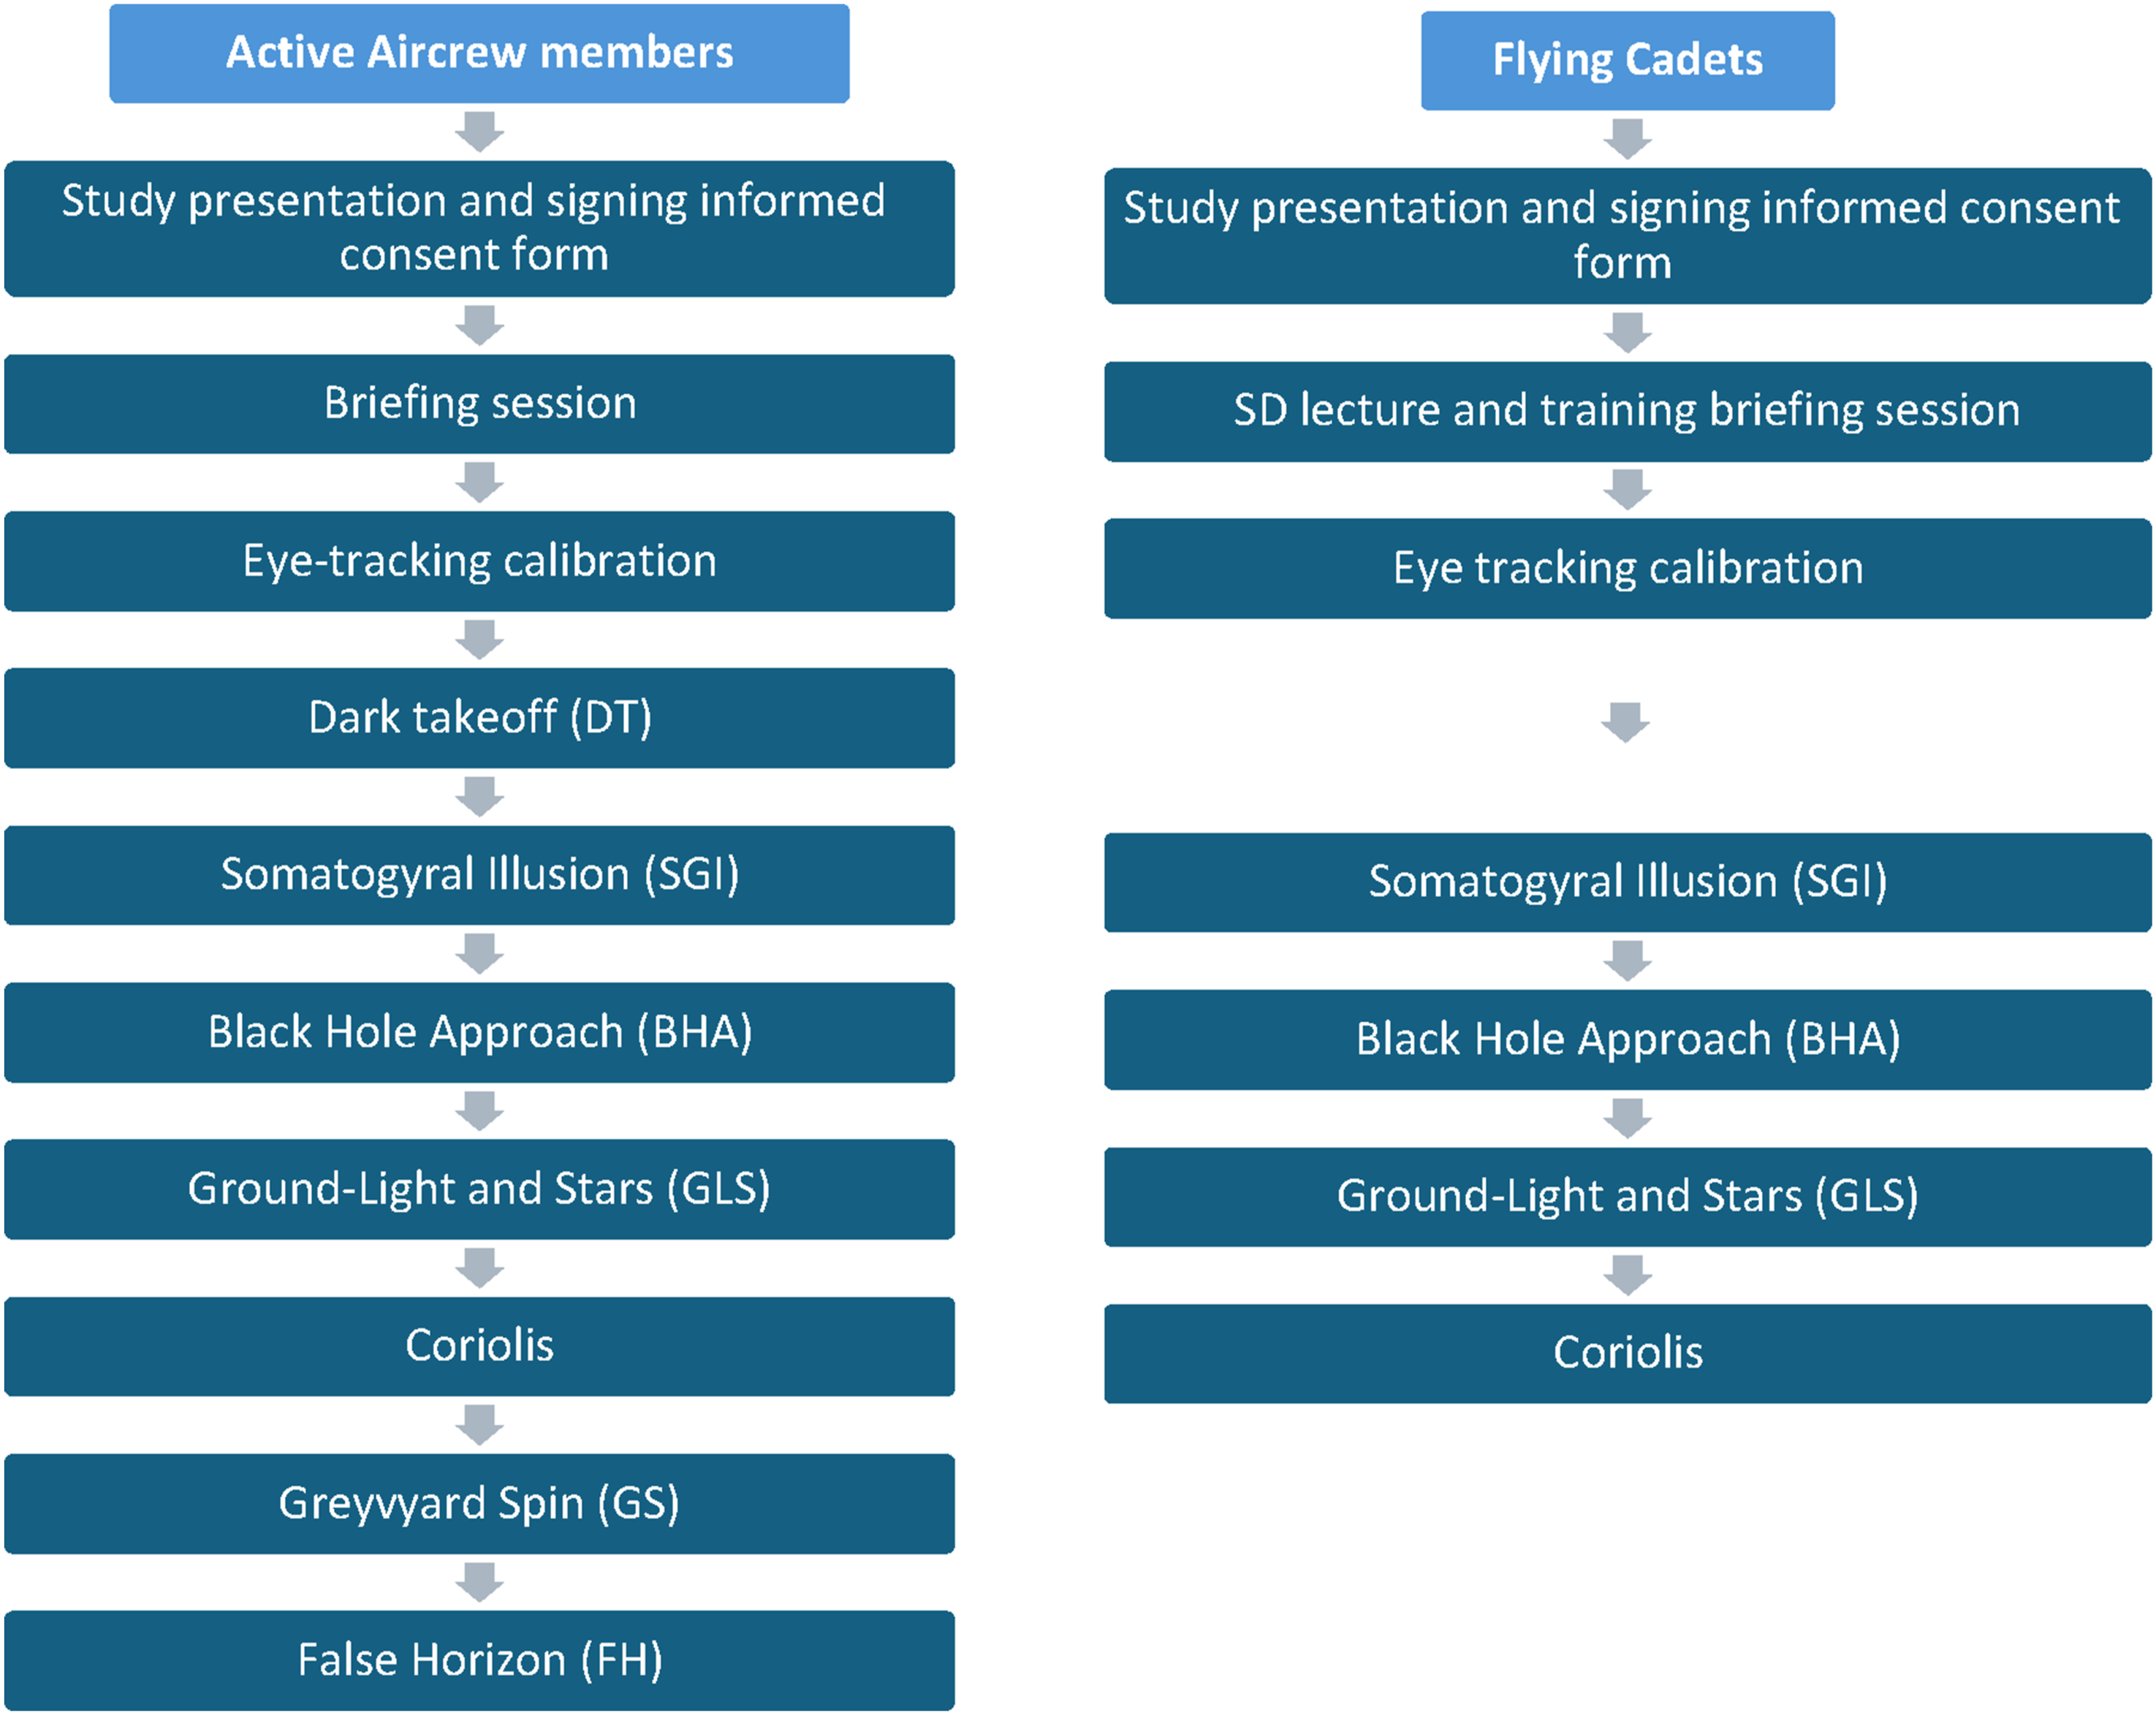
All participants had normal or corrected-to-normal vision. None of the participants had prior experience with the Gyro-IPT simulator, and this was their first exposure to this specific SD-training platform.
Variables
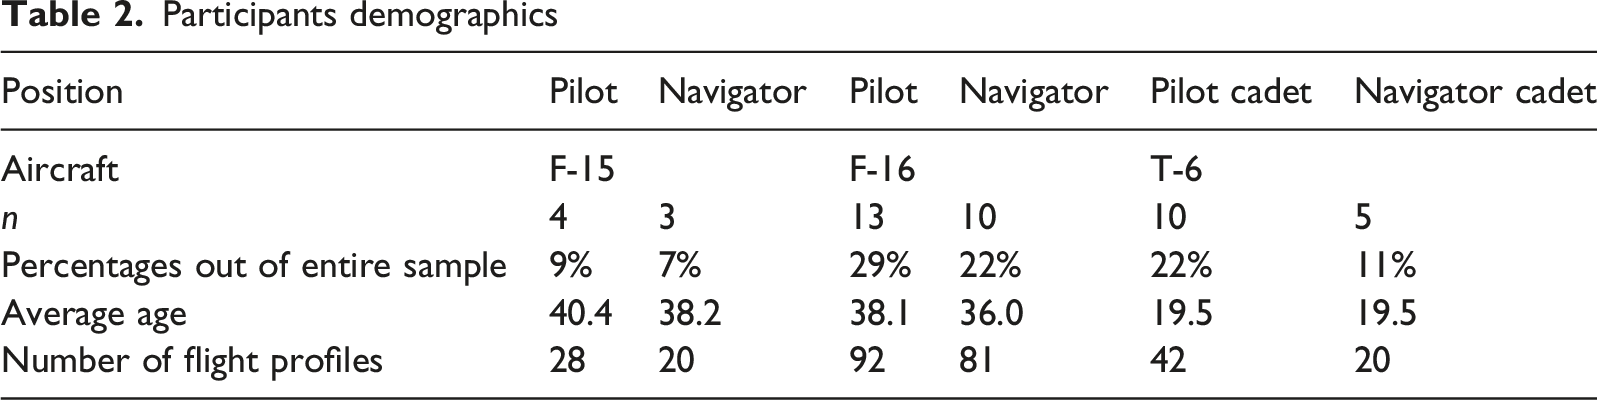
Participants demographics
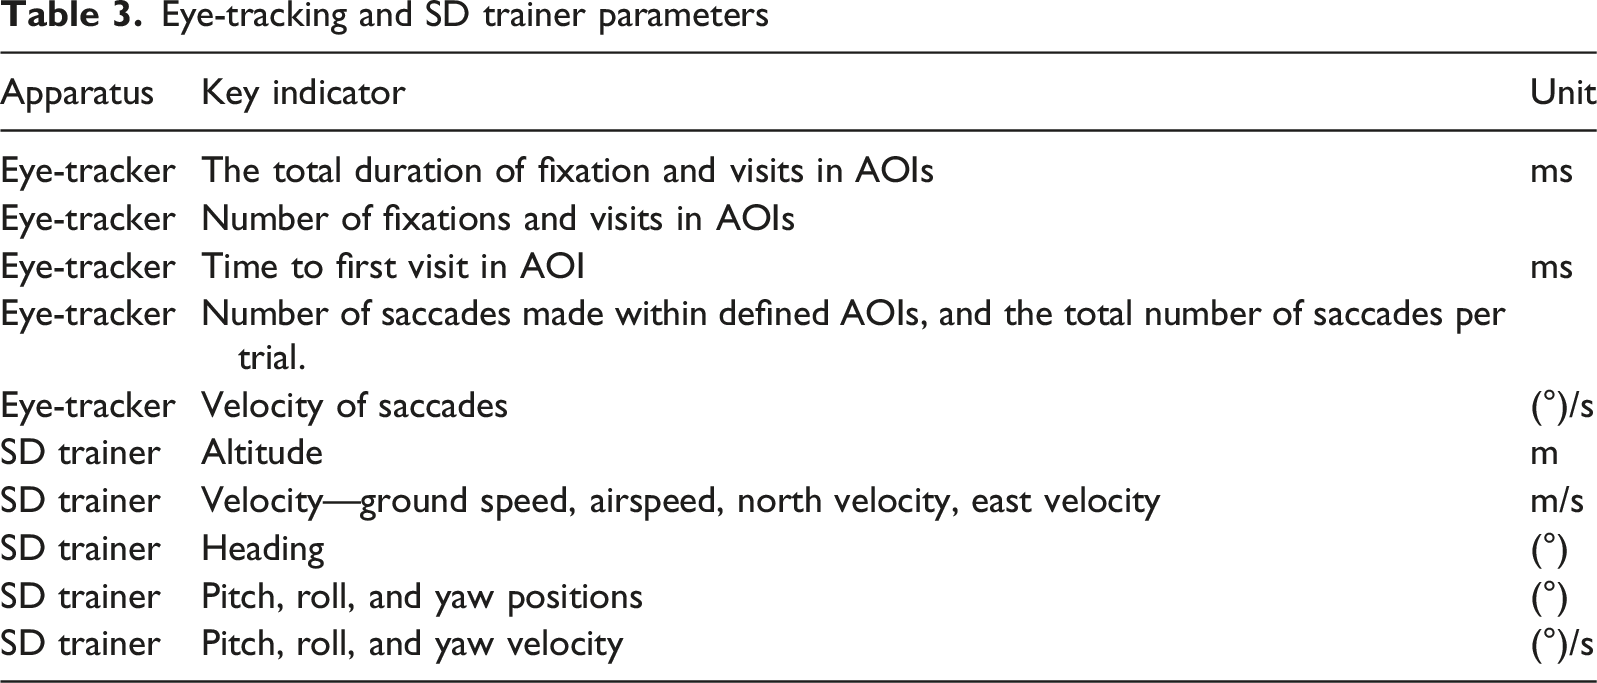
Eye-tracking and SD trainer parameters
SD Events Determination
SD events were identified throughout the flight profiles based on data collected from the SD trainer, using illusion-specific criteria detailed in the supplementary materials. All available flight-performance parameters from the simulator were recorded (see Table 3) and were used to calculate the objective SD criteria for each illusion profile as detailed in the supplementary material. CFIT events also counted as SD event.
For each illusion, sorties with no marked SD events were categorized as part of the non-SD group, while those with at least one SD event were placed in the SD group.
Procedure
Participants were approached when they arrived at the SD simulator according to the Israeli Air Force training regulations. Prior to the beginning of the training session, they were presented with the study’s aims and the procedure, but not specific gaze metrics to avoid biasing natural scanning. It was explained that the study would not change the course of the mandatory training they arrived for and would only add the eye-tracking glasses. Those who agreed to participate signed the informed consent form. Then, a briefing session was provided for each participant about the simulator and the training procedure. The participants were equipped with the Tobii glasses, and the standard Tobii Pro Glasses 2 calibration process was conducted as described in the supplementary material.
Then the participants entered the SD trainer and underwent the training procedure, which included up to 8 flight profiles, elaborated in the supplementary material. All subjects underwent the same illusions ordered as presented in Figure 2. Each profile lasted 1 to 3 minutes, and between profiles the subjects remained inside the SD trainer while the instructor debriefed them about the SD illusion they experienced. For subjects who showed SD response the instructor explained what they should have done differently. All training sessions were conducted during the regular operational training window, between 09:00 and 14:00. The training procedure is summarized in Figure 2.
For each illusion the training profile, the SD window, criteria for identifying SD response, and a visual example of the profile timeline are presented in the supplementary material.
AOIs
An AOI was marked for each instrument, HUD element, and external aircraft display (Figure 3): AOI list and mark over aircraft’s display.
Statistical Analyses
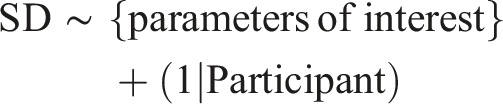
The initial analysis of the eye-tracking data was performed using Tobii Pro Lab (Tobii PRO LAB), which produced the eye-tracking parameters outlined in Table 3 for each Time of Interest (TOI) and Area of Interest (AOI) (Figure 4). We used a mixed-effects logistic regression model to predict whether an SD response was made, including the calculated parameters and demographic variables as fixed effects, and participant as a random effect (see Equation (1)). Analyses were conducted using Python 3.11 and R-packages (lme4 and lmerTest). Statistical significance was set at 0.05, and the Holm-Bonferroni multiple comparison correction was applied. Tobii PRO Lab
Equation 1
The data analysis code and the row data are attached in the git-hub repository: https://github.com/mayahar/Harel-et-al.
Results
Demographics
Data from active aircrew members and flying cadets were divided into pilots and navigators (Table 2).
Within F-15 pilots all four participants performed all 7 profiles (summing to 28 sorties). Within the F-15 navigators two of the participants performed all 7 profiles, one performed BHA twice, one performed DT twice, and one performed only 4 profiles (DT, SGI, GLS, and BHA) due to an eye-tracker malfunction (summing to 20). Within F-16 pilots all 13 participants performed the 7 profiles, and one performed DT twice (summing to 92). Within F-16 navigators all 10 participants performed the 7 profiles, seven performed BHA twice, and four performed DT twice (summing to 81). Within the pilot cadets all 10 participants performed the 4 profiles and two performed BHA twice, (summing to 42). Within the navigator cadets: all 5 participants performed the 4 profiles (summing to 20). Some participants repeated profiles to re-experience the illusion, or if a trial resulted in CFIT.
Active aircrew members (n = 30, average age = 37.74 ± 5.46) performed all 7 profiles. Some participants performed BHA and DT twice, and one did not complete the entire procedure (as elaborated above in Table 2), summing to 221 sorties. Flying cadets (n = 15) performed only 4 of those profiles (two of each type: the visual illusions BHA and GLS, and the vestibular illusions SGI and Coriolis) and two pilot cadets performed the BHA profile twice, summing to 62 profiles. Overall, 283 profiles were used in analyses. The flight experience of the aircrew members was deduced from their age, as they started pilot training at 18. The flight experience of the flying cadets during the SD training course is 1.5 years.
Out of the 283 profiles, 136 profiles contained an SD response (i.e., it managed to induce SD). One flying cadet did not experience SD in any sorties. Two cadets experienced SD in one sortie, while the rest experienced SD in either two or three of the four sorties. Every aircrew member experienced SD in at least one and up to five of the seven sorties with the majority experiencing SD in 3 sorties. The percentages of flight profiles containing an SD response were calculated per group (Figure 5). Percentages for SD responses by aircraft and position
The percentage of SD responses and the total number of flight profiles for each category is shown at the table below the graph.
We used logistic regression to examine the effects of experience and role within the aircraft on the probability of experiencing SD, while accounting for participant-level random effects. When tested separately, experience showed no statistically significant effects—neither when modeled as a continuous variable (years of experience: β = −0.001, p = 0.95) nor as a binary variable (cadets vs. active aircrew members: β = 0.105, p = 0.74). A marginal effect was found for role, with navigators experiencing more SD responses (β = −0.562, OR = 0.57, 95% CI [0.31, 1.04], p = 0.06) (Figure 6). No significant interaction between experience and role was observed. Effect of role on SD events
The graph shows the total number of SD events experienced by each participant, divided into navigators vs. pilots. Overall, navigators experienced more instances of SD response than pilots.
Eye-Movement Patterns
The eye gaze throughout the flight was analyzed to create heatmaps (see Figure 7). Gaze heat map
Heat map of each cockpit display as calculated in the Tobii pro lab program using the Tobii I-VT (Fixation) gaze filter, from left to right: T-6, F-15, F-16. On the right there is a color bar presenting a linear interpolation of number of fixations in each area.
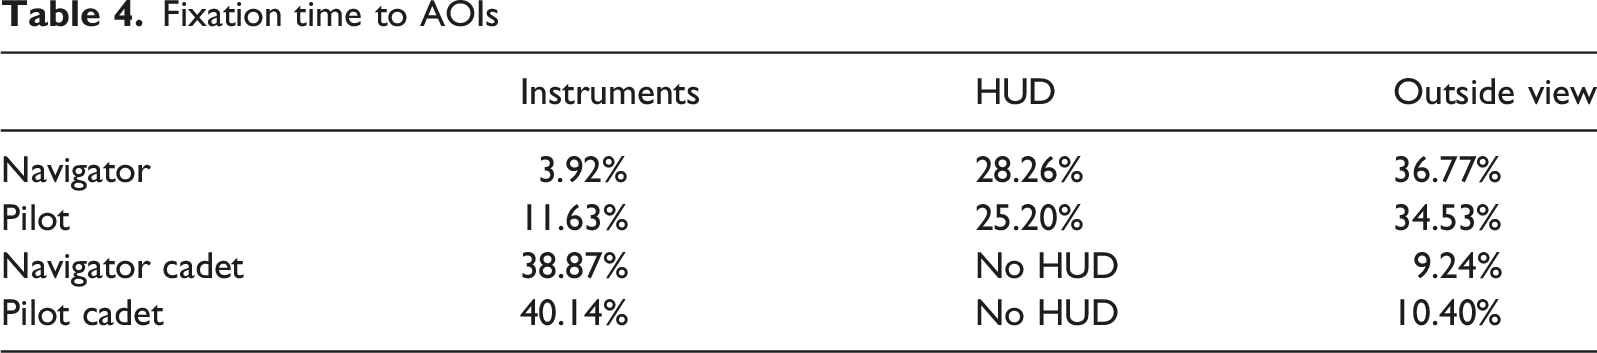
Fixation time to AOIs
SD Window Analyses
To simplify and focus our analyses we categorized the four illusions experienced by all participants into visual illusions (BHA and GLS) and vestibular illusions (SGI and DT). Additionally, we grouped the Areas of Interest (AOIs) into instrument AOIs and HUD AOIs and selected five key eye movement parameters for each AOI: number of visits, number of fixations, number of saccades, total duration of visits, and total duration of fixations.
Using these data, we conducted logistic regression analyses separately for vestibular and visual illusion sorties, and separately for eye movement parameters related to instrument and HUD AOIs. Each model predicted the likelihood of an SD response based on the eye movement parameter, the role of the participant (navigator vs. pilot), and their interaction, while accounting for participant-level random effects.
After correcting for multiple comparisons, two results remained significant: within the visual illusions, longer total durations of fixations and visits on the instrument AOIs were associated with a lower likelihood of SD responses (p < 0.001 for both; Figure 8). Total duration of eye-tracking parameter during visual illusions in instrument AOIs
Each additional second of fixation and visit in the instrument AOIs decreased the odds of experiencing SD by 12.9% and 11.3%, respectively (OR = 0.879, 0.894, respectively; CI [0.826, 0.936], [0.841, 0.949], respectively).
The Y-axis shows the number of SD events each participant experienced across all visual illusion profiles, separated by role (navigators vs. pilots). The X-axis represents the total duration (in milliseconds) of fixations or visits within all instrument AOIs. Each dot represents one participant.
To further explore the interaction between illusion type (visual vs. vestibular), display type (HUD vs. instruments), and the eye-tracking parameters, we ran a model testing a three-way interaction. The following effects were found (Figure 9): Combined effect in total duration of visits
A main effect for total duration of fixations and total duration of visits, with longer durations across all AOIs predicting increased SD responses (p < 0.001 for both).
Each additional second of fixation and visit across AOIs increased the odds of experiencing SD by 4.53%, 4.15% respectively (OR = 1.045, 1.042, respectively; CI [1.005, 1.008], [1.002, 1.083], respectively).
A two-way interaction between eye-tracking parameters and display type for total duration of visits, total duration of fixations, number of visits, and number of fixations: greater engagement with instrument AOIs was linked to higher SD occurrences, while greater engagement with the HUD was linked to lower SD occurrences across all illusion types (p < 0.001 for all; OR = 0.890, 0.877, 0.919, 0.959, respectively; CI [0.856, 0.926], [0.843, 0.912], [0.884, 0.956], [0.922, 0.998], respectively).
A two-way interaction between eye-tracking parameter and the illusion type for total duration of visits, total duration of fixations, and number of visits: greater engagement with all AOIs during vestibular illusions was linked to higher SD occurrences, while in visual illusions it was linked to lower SD occurrences (p < 0.001 for all; OR = 0.935, 0.931, 0.935, respectively; CI [0.899, 0.972], [0.895, 0.968], [0.899, 0.973], respectively).
A three-way interaction between the three arguments (AOI, illusion type and eye-tracking parameters) for total duration of visits, total duration of fixations, number of visits, and number of fixations: combining all the effects showed: increased HUD engagement increased SD probability in visual illusions and decreased in vestibular illusions, while increased instruments engagement increased SD probability in vestibular illusions and decreased in visual illusions (p < 0.001 for all; OR = 1.191, 1.215, 1.145, 1.066, respectively; CI [1.145, 1.239], [1.168, 1.264], [1.101, 1.191], [1.025, 1.108], respectively).
Discussion
In this study, we aimed to test if specific eye-tracking patterns were associated with susceptibility to spatial disorientation (SD) under visual and vestibular illusion conditions during simulated flight profiles among active aircrew and cadets. Our goal was to explore whether certain scanning strategies could be linked to SD resilience.
We analyzed 284 sorties and 7 illusion types, performed by 30 active aircrew members and 15 flying cadets, identifying 136 SD responses. The illusions were divided into
Illusion effects varied by aircraft type and crew role. SGI illusion was found mainly in navigators, and DT only in navigators. FH affected all F-15 aircrew, but only 62% of F-16 personnel. GLS affected only active aircrew members as opposed to cadets. Notably, none of the participant groups, regardless of experience level, completely avoided SD, underscoring its persistent challenge. Using eye-tracking we found that for visual illusions, participants who focused more on the instrument panel (altitude, pitch, and turn indicators) were less likely to experience SD than those who relied more heavily on the HUD. However, for vestibular illusions, the opposite result was found: greater HUD engagement was associated with better SD resilience.
The study shows that no population avoided SD responses completely, as they affected cadets (in 50% to 52.4% of the sorties) and active aircrew members (in 37.2% to 55% of sorties), and GLS and BHA (visual) illusions even affected active pilots to a greater degree than cadets. This result is similar to a previous study (Bałaj et al., 2018) that showed that SD cues affected pilots and non-pilots similarly in their ability to fly the aircraft as per instructions, showing that expertise alone does not prevent SD. The current study also expanded this work to operational aircrew and additional illusion types.
During the vestibular SGI profile, we found that increased time spent examining the HUD and decreased time examining the instrument panel was related to better SD resilience. This finding is supported by a former comparison of how experts’ and novices’ eye movement patterns change between easy and difficult routes during flight (Yang et al., 2013). That study found that on more difficult flight paths, experts adapted to difficult routes by shortening their dwell times on the out-the-window (OTW) view, while still maintaining frequent OTW fixations. In contrast, novices showed longer OTW dwell durations and fewer fixations. This suggests that experts used a more efficient scanning strategy, with rapid, repeated glances OTW rather than prolonged focus, which may help detect spatial inconsistencies earlier. The HUD allowed aircrew members to scan their flight parameters without looking down, while keeping the outside view available.
Focused attention on the HUD, rather than general outside-the-window (OTW) scanning, has been shown to be related to improved situational awareness in expert pilots. For instance Yu et al. (2016) found that experienced pilots allocated more attention to the HUD and less to the outside view compared to novices, suggesting that HUD engagement could support more efficient perceptual strategies. Similarly Kang et al. (2021) demonstrated that during the vestibular illusions, Coriolis and GS, pilots fixated more frequently on HUD regions associated with attitude information, especially when performing verbal reports. That study found that the pattern of increased HUD fixations was also observed during the visual FH illusions. While subjective attentional load ratings did not significantly differ between reporting and non-reporting groups, the increased frequency of HUD fixations suggests that certain vestibular illusions may drive pilots to rely more heavily on HUD information for spatial orientation. These studies support the interpretation that HUD use plays a critical role during vestibular-driven illusions. This interpretation aligns with our own findings linking greater HUD engagement to better SD resilience during vestibular illusions. However, our results diverge in the context of visual illusions, where increased HUD use was associated with higher SD occurrence, particularly during FH illusions. This apparent contradiction may reflect differences in the informational value of the HUD under varying perceptual conditions, facilitating orientation when vestibular inputs are misleading, but potentially reinforcing erroneous visual cues under deceptive visual conditions.
Ledegang & Groen (2018), who did not use an HUD in their study, found that pilots’ instrument scanning differed by illusion type, with visual illusions prompting focused instrument use and vestibular illusions causing more erratic scanning. Similarly, our results showed that instrument fixation reduced SD in visual illusions but was linked to increased SD in vestibular illusions. This suggests that instrument reliance affects SD differently depending on the sensory conflict. Our study adds novel evidence by directly connecting specific gaze patterns to SD occurrences across illusion types and experience levels, shedding new light on optimizing training for managing visual versus vestibular illusions (Ledegang & Groen, 2018).
While our general model indicated that longer total fixations across all areas correlated with increased SD probability, our interaction analysis clarifies that this effect is driven by the specific sensory conflict. Increased instrument focus is protective during visual illusions but may be counterproductive during vestibular ones, and vice versa for HUD engagement. This highlights that the effectiveness of a scanning strategy is not universal but must be tailored to the specific illusion type.
No significant differences were found in our study across groups or illusion types in saccadic parameters. Saccadic patterns, such as frequent or prolonged eye movements, were previously associated with less efficient scanning, depending on context. A previous study (Leandro L. Di Stasi, Marchitto, Antolí, Baccino, & Cañas, 2010) showed that saccadic peak velocity decreased under increased cognitive load, indicating that eye movement dynamics could reflect mental workload. In our study, although we did not detect statistically significant differences in saccadic parameters, the overall association between greater HUD engagement and better SD resilience with vestibular illusions may still reflect more structured or adaptive scanning strategies. It is therefore plausible that intentional and task-directed eye movements, rather than the frequency or amplitude of saccades per se, contribute to performance under SD conditions.
Applications
Repeated spatial training using a simulated environment has been shown to be beneficial to reduce SD, as was shown by a study conducted on neurologic patients (Kober et al., 2013), as well as in pilots (Landman et al., 2018; Qiu et al., 2023). It was found that training eye movements based on knowledge of which eye movement patterns were most effective for a specific task could improve performance in said task (Shapiro & Raymond, 1989). Thus, implementing the knowledge and training based on the current results may potentially improve performance in flight profiles with high SD risk.
Another study (Peysakhovich et al., 2018) highlighted the need for real-time alert systems based on differences in eye movement patterns associated with spatial disorientation (SD). Their study demonstrated that such systems, when installed in aircraft during real flights, could help mitigate SD-related incidents by providing timely alerts and reducing the likelihood of fatal responses. Our findings offer a novel contribution: HUD use during vestibular illusions was linked to fewer SD responses, while instrument fixation during vestibular illusions was linked to more SD. This suggests that real-time systems could be improved by tailoring alerts based on illusion type and gaze behavior.
Limitations
Since the procedure and sample size were pre-determined in the ethics protocols, the study was exploratory and not preregistered; therefore, the hypotheses, methods and analysis were not submitted to a registry (e.g., OSF) before conducting the study. This led to multiple comparisons, limiting the ability to assess replicability. Using the knowledge gained in this study, future research could create a more accurate procedure to induce stronger effects and means to address them, also addressing larger sample size.
Our study did not directly assess physiological responses such as heart rate and respiration, which are known to be influenced by vestibular input. Stimulation of the semicircular canals and otolith organs can alter respiration and pulse rates through vestibulorespiratory and vestibulocardiovascular reflexes (Ilbasmis & Yildiz, 2017). Similarly, we did not isolate the influence of reflexes like the VOR and COR, which can affect nighttime aircraft climbing perception and contribute to illusions such as head-up during flight (Barra et al., 2006; Gresty et al., 2008; Maurice & Gioanni, 2004; Tamura et al., 2016; Webb et al., 2012). These unmeasured physiological and sensorimotor factors may modulate SD susceptibility and limit the scope of our findings.
Additionally, the study did not distinguish between recognized and unrecognized SD. All SD events were classified solely based on objective behavioral criteria derived from simulator parameters, rather than participants’ subjective awareness.
While simulators provide a safe and controllable environment to elicit SD, their fidelity to in-flight vestibular and somatosensory cues is limited. Differences in G-force, proprioception, and environmental stressors may affect responses. That said, the patterns of HUD and instrument engagement observed here likely reflect real-world scanning behaviors due to the fidelity of visual and cognitive workload elements in the simulation. Nonetheless, caution is warranted when generalizing to actual aircraft performance, especially under high-stakes operational stress.
Another factor that may have influenced the results is the potential for fatigue and motion sickness during the simulator session. Participants completed multiple illusion profiles in a single training sequence, which may have introduced cumulative physical or cognitive fatigue, potentially affecting both visual-scanning patterns and susceptibility to SD (Barra et al., 2006). Because fatigue and motion sickness were not measured or controlled for, their influence on performance and eye movement patterns cannot be ruled out. Future studies should incorporate standardized assessments of simulator sickness and workload to better quantify these effects, as well as control for sleep quality.
In addition, due to the transparent nature of the HUD, some fixations labeled as “HUD” may have actually reflected attention directed through the HUD towards the outside view. As a result, outside view fixations may be underrepresented. However, this does not undermine our interpretation, as this dual function is inherent to the HUD’s design. This aligns with the HUD’s operational design and intended use of the HUD and its practical application.
Finally, although both pilot and navigator trainees had received training in spatial disorientation (SD) recognition and mitigation, pilots had approximately 2–3 months more experience at the time of testing, as the training tracks split 3 months earlier. Navigators did receive two additional weeks of “stick time” in the T-6 aircraft, but this asymmetry in recent hands-on flight experience may have influenced how each group responded to SD scenarios.
Conclusions
This study highlighted the role of targeted eye movement behaviors underlying SD. Our results suggest that dynamic, broad scanning across instruments could reduce SD experienced in various flight illusions. Specifically, we found that flight profiles involving limited visual cues and thus a potential for visual illusions require higher attention to the instrument panel to avoid visually induced SD. By contrast, prolonged turns that induce a higher potential for vestibular illusions, required greater attention to the HUD to avoid SD. We also found that SD risk remains throughout all experience levels from flight cadets to experienced pilots. Based on our findings, we propose a revision to the current training guidelines. While previous protocols emphasized relying on head-down instruments at all times to mitigate SD risk, our results suggest a more nuanced approach. Specifically, during vestibular illusions, increased reliance on the HUD was associated with better performance and reduced SD occurrences. Therefore, future training programs should incorporate differentiated guidance, emphasizing HUD engagement in vestibular scenarios and reinforcing head-down instrument use during visual illusions. These conclusions should be interpreted in light of the study’s methodological constraints. While our results provide valuable direction for training refinements, they should be viewed as preliminary and requiring validation in controlled studies and operational settings, as data were collected within the limits of an operational military training environment. Future research should extend these findings beyond combat aircrew and investigate whether implementing targeted eye movement training improves SD resilience. Key Points • • • • • •
Footnotes
Funding
The authors received no financial support for the research, authorship, and/or publication of this article.
Declaration of Conflicting Interests
The authors declared no potential conflicts of interest with respect to the research, authorship, and/or publication of this article.