
Abstract
Objective
In usability studies, the subjective component of usability, perceived usability, is often of interest besides the objective usability components, efficiency and effectiveness. Perceived usability is typically investigated using questionnaires. Our goal was to assess experimentally which of four perceived-usability questionnaires differing in length best reflects the difference in perceived usability between systems.
Background
Conventional measurement wisdom strongly favors multi-item questionnaires, as measures based on more items supposedly yield better results. However, this assumption is controversial. Single-item questionnaires also have distinct advantages and it has been shown repeatedly that single-item measures can be viable alternatives to multi-item measures.
Method
N = 1089 (Experiment 1) and N = 1095 (Experiment 2) participants rated the perceived usability of a good or a poor web-based mobile phone contract system using the 35-item ISONORM 9241/10 (Experiment 1 only), the 10-item System Usability Scale (SUS), the 4-item Usability Metric for User Experience (UMUX), and the single-item Adjective Rating Scale.
Results
The Adjective Rating Scale represented the perceived-usability difference between both systems at least as good as, or significantly better than, the multi-item questionnaires (significantly better than the UMUX and the ISONORM 9241/10 in Experiment 1, significantly better than the SUS in Experiment 2).
Conclusion
The single-item Adjective Rating Scale is a viable alternative to multi-item perceived-usability questionnaires.
Application
Extremely short instruments can be recommended to measure perceived usability, at least for simple user interfaces that can be considered concrete-singular in the sense that raters understand which entity is being rated and what is being rated is reasonably homogenous.
Keywords
Introduction
When evaluating user interfaces of systems such as computer programs or online stores, objective metrics such as error rates and the time taken to complete a task are important, but so are the impressions resulting from using the system, collectively referred to as user experience (ISO-9241-210, 2010). Among other things, the user experience can influence buying intentions (Fedele et al., 2017) and how likely users recommend a system to others (Brooke, 2013). A fundamental component of the experience of users with a system is captured by the construct of perceived usability (Lewis, 2018). In addition to the objective aspects, effectiveness and efficiency, the subjective component of usability forms a large part of the construct of usability (ISO-9241/11, 1998). A cost-efficient approach to measuring perceived usability is to use standardized questionnaires. An array of pertinent questionnaires is available which vary in length and complexity. The goal of the research presented here is to test experimentally which of several such questionnaires best reflects the difference between a good and a poor system in terms of perceived usability.
One rather long questionnaire is the 35-item ISONORM 9241/10 (Prümper, 1993). It is based on the corresponding ISO norm (ISO-9241/10, 1995) and thus has a solid theoretical foundation. Seven sets of five items were designed to measure the extent to which a system fulfills the seven design requirements formulated in the ISO 9241/10 norm (Table A1 in the appendix). The ISONORM 9241/10 has been shown to be a valid instrument to measure the subjective component of usability (Prümper, 1997, 1999).
The 10-item System Usability Scale (SUS, see Brooke, 1996, 2013) was developed as a quick instrument for assessing perceived usability (Table A1 shows the version of the SUS with exclusively positive wording, see below). Over the years, the SUS has become the gold standard among perceived-usability questionnaires, most likely in large part because Bangor et al. (2008) showed, based on data collected in over a decade, that the SUS is a valid and very robust instrument, has the ability to measure changes in usability during an iterative design cycle and is suitable for a wide range of systems and types of technology. In the standard form of the SUS, items have alternating positive and negative wording. Sauro and Lewis (2011) changed the negative wording to positive wording to avoid errors such as misinterpretations of negative items. As the standard and the positively worded SUS yield essentially the same results, the positively worded SUS is recommended especially for nonsupervised studies (Kortum et al., 2021; Sauro & Lewis, 2011).
Even shorter than the SUS, the Usability Metric for User Experience (UMUX; Table A1) consists of only four items. These are based on the ISO-9241/11 (1998) definition of usability (Finstad, 2010) and have alternating positive and negative wording. Research indicates acceptable levels of concurrent validity of the UMUX, which is why it is often considered a shorter alternative to the SUS (Berkman & Karahoca, 2016; Finstad, 2010; Lewis, 2013).
Bangor et al. (2009) added an item to the SUS with an adjective-anchored Likert scale, the Adjective Rating Scale (Table A1). They administered the SUS together with this single item to 964 participants. The single-item measure correlated highly with the SUS (r = .822). A priori it may seem inadequate to use a single-item questionnaire to arrive at a measure of perceived usability but given the high correlation with the SUS, the Adjective Rating Scale might be an economical alternative to multi-item perceived-usability questionnaires.
However, conventional measurement wisdom strongly favors the use of multi-item questionnaires because, for instance, measures based on many items are often considered to be more reliable than measures based on few items. Then again, long questionnaires can also have disadvantages. First, measuring perceived usability with a complex multi-item questionnaire may require participants to rate irrelevant or unknown aspects of a system. We will get back to this issue in the General Discussion. Second, long survey instruments are time-consuming, require a considerable investment of motivation and effort and may even overload the respondents (Wanous et al., 1997), leading to a decline in data quality and quantity (Dillman et al., 1993), particularly in online surveys (Baumgartner et al., 2019b; Evans & Mathur, 2005).
From this perspective, single-item measures have several advantages. They require little time and are easy to administer (Pomeroy et al., 2001) which may increase the willingness to complete a questionnaire (Wanous et al., 1997). What is more, it has been shown repeatedly that single-item measures can have acceptable psychometric properties that are often equivalent to those of their multi-item counterparts. For instance, Himmels et al. (2021) have shown that an ad-hoc single-item measure can be as good as, or better than, the SUS and the UMUX when assessing user reactions to an automated driving system, and Christophersen and Konradt (2011) have found strong indications for the reliability, validity and sensitivity of a single-item measure of online store usability. Research in other disciplines has yielded similar findings. For instance, single-item measures yield valid measures of stress symptoms (Eddy et al., 2019; Wong et al., 2021), overall job satisfaction (Dolbier et al., 2005; Nagy, 2002) and life satisfaction (Cheung & Lucas, 2014; Jovanović & Lazić, 2020). Single-item measures have also been validated in fields as diverse as health care (de Boer et al., 2004), sports (Bruton et al., 2016; Kwon & Trail, 2005), marketing (Ang & Eisend, 2018; Bergkvist & Rossiter, 2007, 2009) and organizational psychology (Matthews et al., 2022). Thus, valid single-item measures are not uncommon (for principled arguments in favor of single-item measures, see Allen et al., 2022; Fuchs & Diamantopoulos, 2009).
Rossiter (2002) has argued that, in general, single-item measures are appropriate whenever the to-be-measured construct and its attribute can be considered to concern entities that are concrete and singular in the sense that (a) all raters understand which entity is being rated and (b) what is being rated is reasonably homogenous. With respect to perceived usability, it seems possible that systems with relatively simple user interfaces such as automated driving systems or web shops may be considered concrete-singular (Bangor et al., 2009).
Given these considerations, the question arises whether questionnaires with more or fewer items are optimal for measuring the construct of perceived usability. To answer this question, the ISONORM 9241/10, the SUS, the UMUX and the Adjective Rating Scale were compared experimentally. As prior experience with a system can influence the evaluation of the system’s perceived usability (Berkman & Karahoca, 2016; Borsci et al., 2015), we designed two systems that were novel for all participants. Specifically, we designed two simulated web-based mobile phone contract systems that differed in usability, resulting in what we term here a good-usability system and a poor-usability system. Participants worked with one of the systems and then completed the ISONORM 9241/10 (only in Experiment 1), the positively worded SUS, the UMUX and the Adjective Rating Scale. The aim of the study was to assess which of these four instruments best reflects the difference in perceived usability between the good-usability system and the poor-usability system.
Experiment 1
Method
Statistical power considerations
We used data published by Finstad (2010, p. 326) to guide our statistical power considerations. However, for the population correlations ρsystems,SUS and ρsystems,UMUX (the correlations between the variable coding the type of system [good-usability system vs. poor-usability system] and the SUS and the UMUX, respectively) and ρSUS,UMUX (the correlation between the SUS and the UMUX), we chose values below those of the corresponding sample correlations reported by Finstad (2010) for two reasons. First, sample correlations tend to overestimate population correlations. Second, we used a commercial research panel and therefore expected our data to be noisier than the data obtained by Finstad with Intel® employees. On this basis, an a priori power analysis using G*Power (Faul et al., 2007, 2009) suggested that given α = .05, a power of 1 – β = .95 and assumed population correlations of ρsystems,SUS = .70, ρsystems,UMUX = .65 and ρSUS,UMUX = .80 we needed data from N = 1009 participants for the statistical comparisons of the sample correlations rsystems,SUS and rsystems, UMUX. We stopped collecting data at the end of the day at which the number of valid data sets surpassed this goal.
Participants and Design
In total, 1920 participants living in Germany were recruited using the research panel of Respondi AG, Cologne, Germany, and gave informed consent, but 825 did not complete the study. Of these 345 dropped out while working with the good-usability system and 398 while working with the poor-usability system. Six data sets had to be excluded because of multiple participation. The final sample included 1089 participants (546 male, 541 female, two diverse) with a mean age of 46 years (SD = 15). Participants received a small monetary compensation for their participation. They were randomly assigned to the good-usability system (n = 569) or the poor-usability system (n = 520). All participants filled out four usability questionnaires.
Materials
All experiments reported here were conducted online, implemented using SoSci Survey (Leiner, 2022) and made available via https://www.soscisurvey.de. Participation was possible only with a laptop or desktop computer. We designed two simulated web-based mobile phone contract systems with two goals in mind. First, the systems should require user input. Second, it should be possible to complete the interactions with the system within the time tolerable in an online study. The good-usability system was implemented so that it complied with a common standard of the dialog principles of human–system interaction (ISO-9241-110, 2008). The poor-usability system violated many of these principles (Figure 1). We selected those principles that were easy to comply with or violate in an online study. The differences between the systems concerned, for instance, the text-background polarity (Buchner & Baumgartner, 2007; Piepenbrock et al., 2013, 2014), the spatial arrangement of the dialog elements and the comprehensibility of error messages and instructions (screenshots of all pages of the systems’ user interface of both Experiment 1 (translated into English) and 2 are available online, see the Data Availability Statement). Illustration of displays for the good-usability system (top) and the poor-usability system (bottom) used in Experiment 1 (the original interface language was German).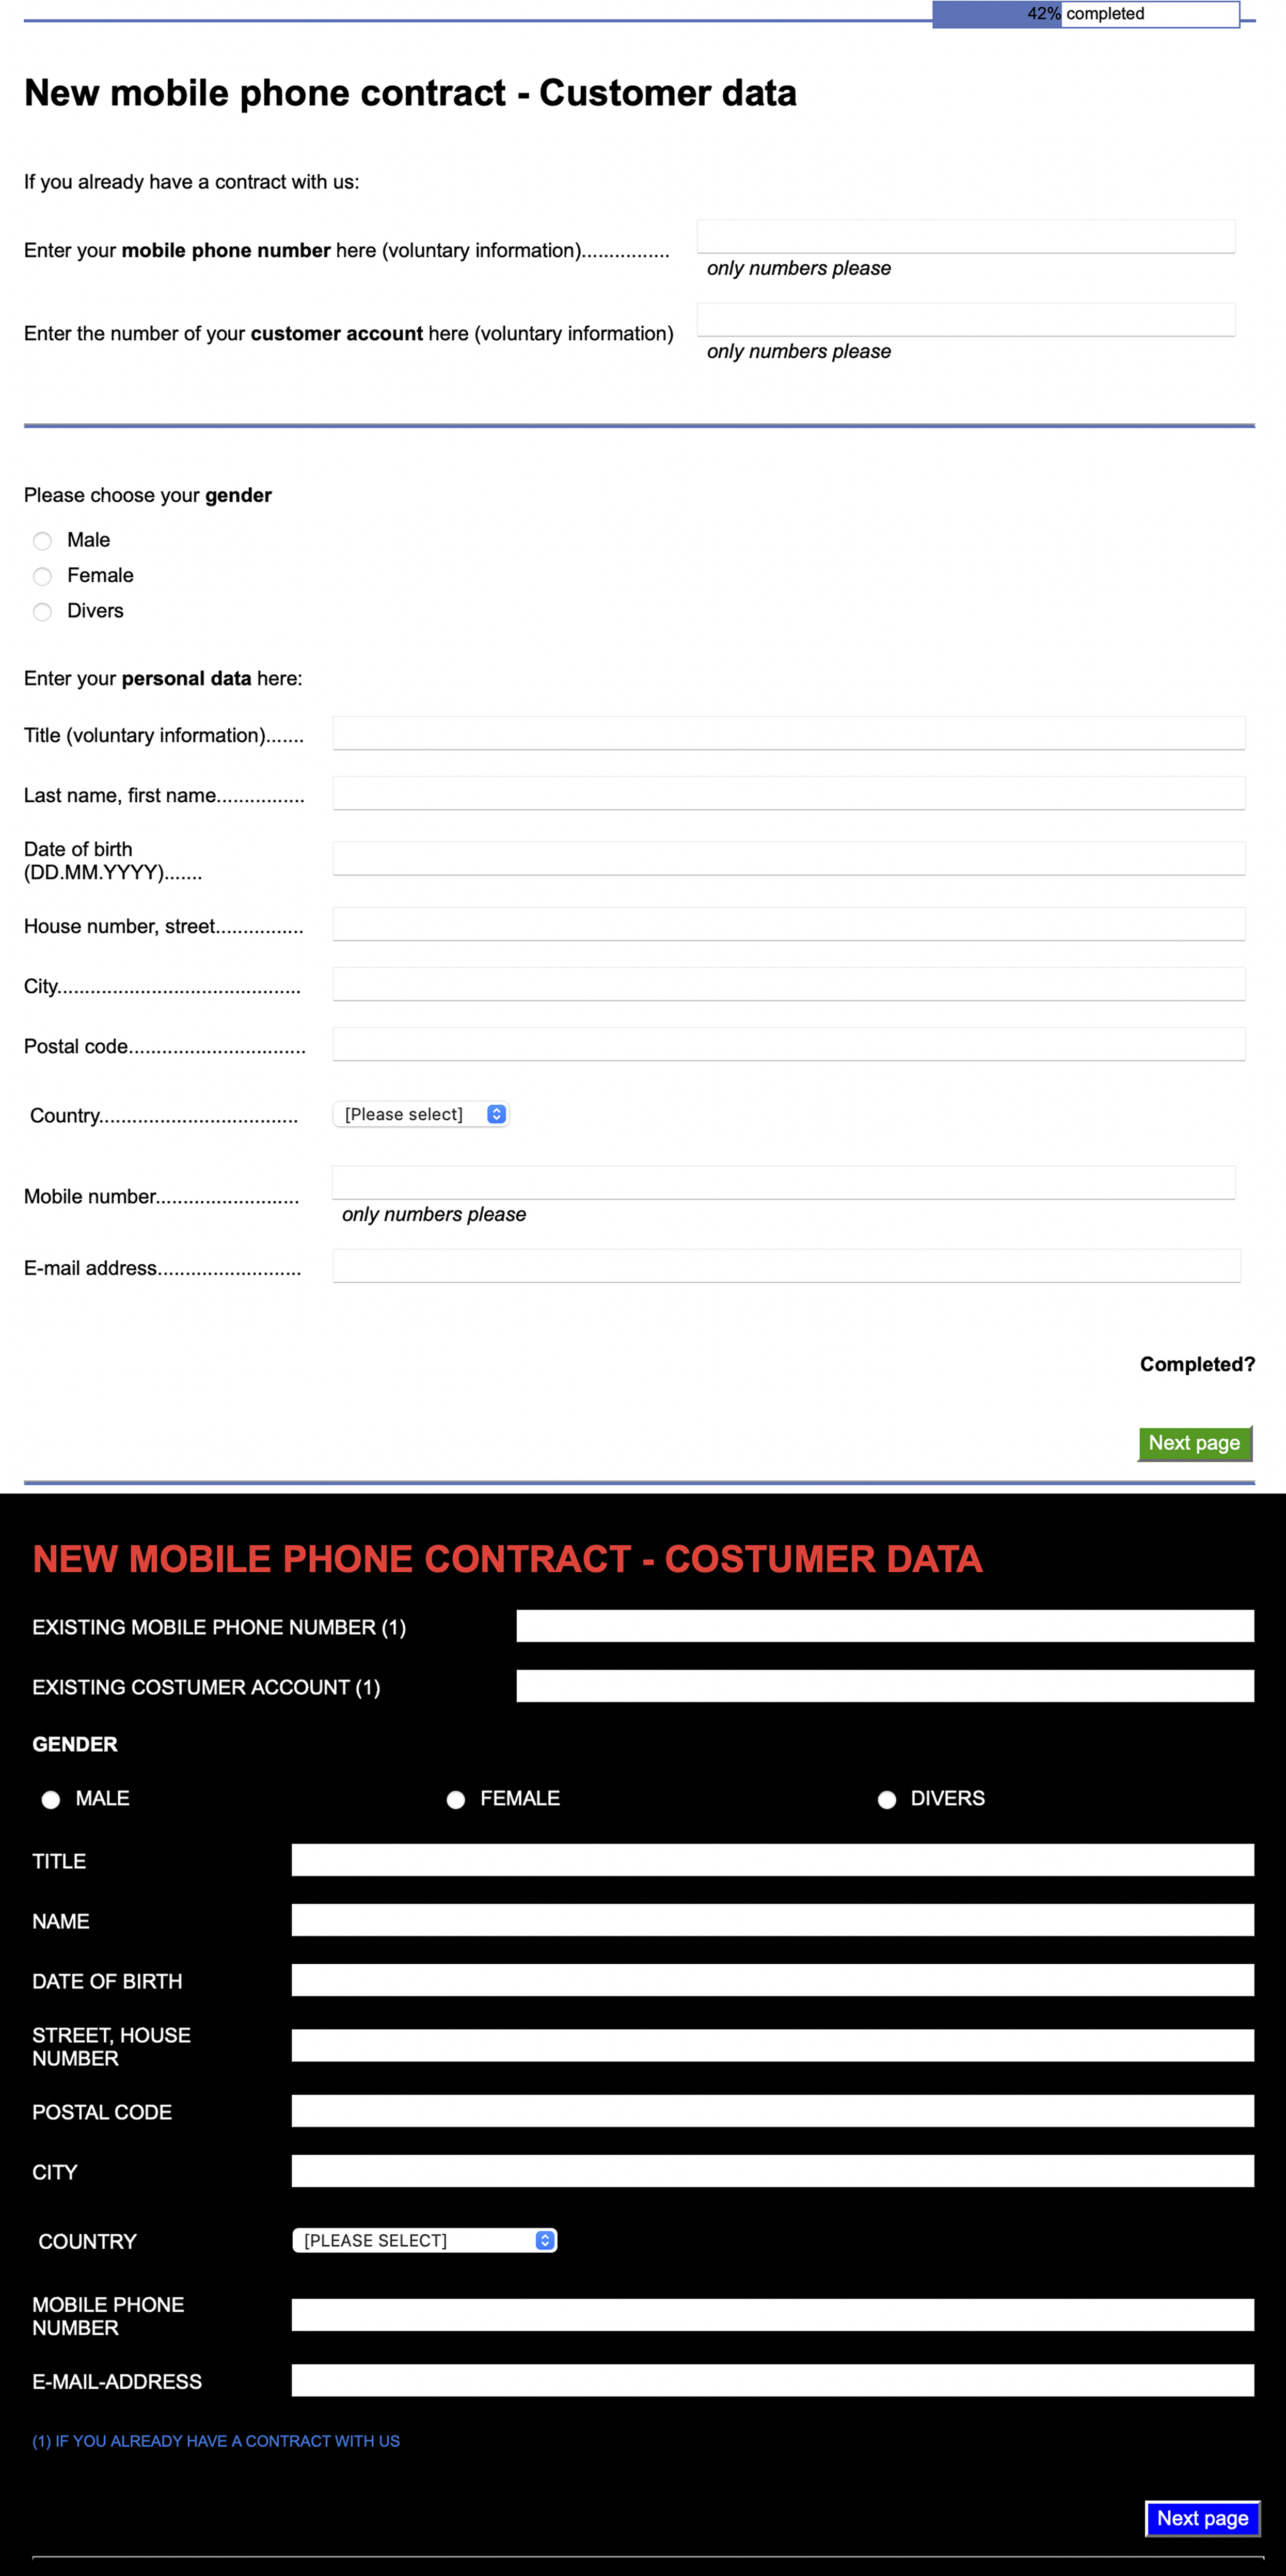
To measure perceived usability, the ISONORM 9241/10 (Prümper, 1993), the positively worded SUS (Sauro & Lewis, 2011), the UMUX (Finstad, 2010) and the Adjective Rating Scale (Bangor et al., 2009) were implemented in SoSci Survey. The ISONORM 9241/10 was available in German. The SUS, the UMUX and the Adjective Rating Scale were translated into German by us.
Procedure
At the beginning of each experiment, written informed consent was obtained from all participants. They knew that they could withdraw their consent at any time by closing their browser window. The experiments were carried out in accordance with the Declaration of Helsinki. If participants decided to continue, they entered their age, gender and education level. Next, they worked with one of the two simulated web-based mobile phone contract systems. Participants knew that they interacted with a mock system. Their task was to perform the actions necessary to purchase a mobile phone contract using this system. They selected a particular plan, could select optional items (e.g., they could choose a second SIM card) and entered data of a fictitious person (what was entered was not recorded) and so on. This took about 5 minutes. Afterward, participants evaluated their experience with the system using the ISONORM 9241/10, the SUS, the UMUX and the Adjective Rating Scale which were presented in a different random order to every participant.
Results
Means (and Standard Deviations in Parentheses) of the Perceived-Usability Measures for the Four Perceived-Usability Questionnaires (Possible Range of Values in Brackets) Separately for the Good-Usability System and the Poor-Usability System, the Effect Size r Representing the Size of the Difference Between the Good-Usability System and the Poor-Usability System, the 95% Confidence Intervals of r, the p Values Associated With the Test of the H0 That r = 0 (i.e., That the Two Systems do Not Differ in Perceived Usability) and, for Convenience, the Effect Size Measure d Representing the Size of the Difference Between the Good-Usability System and the Poor-Usability System (Experiment 1).
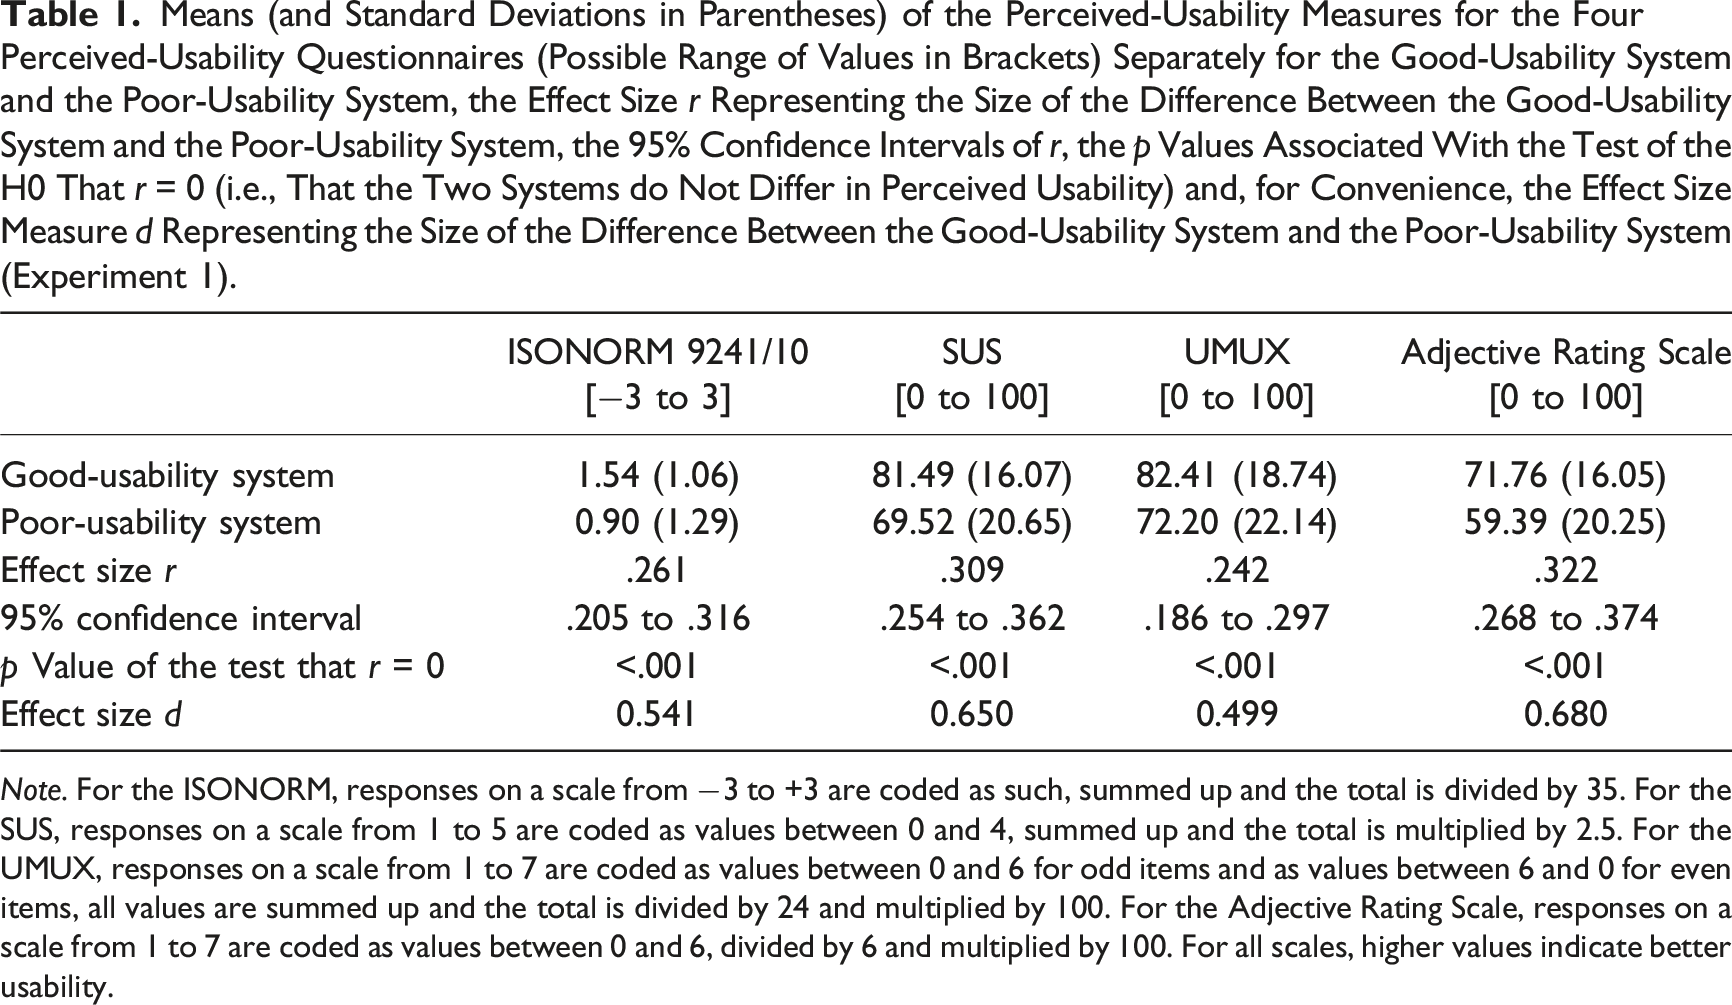
Note. For the ISONORM, responses on a scale from −3 to +3 are coded as such, summed up and the total is divided by 35. For the SUS, responses on a scale from 1 to 5 are coded as values between 0 and 4, summed up and the total is multiplied by 2.5. For the UMUX, responses on a scale from 1 to 7 are coded as values between 0 and 6 for odd items and as values between 6 and 0 for even items, all values are summed up and the total is divided by 24 and multiplied by 100. For the Adjective Rating Scale, responses on a scale from 1 to 7 are coded as values between 0 and 6, divided by 6 and multiplied by 100. For all scales, higher values indicate better usability.
First, these correlations represent sample effect size measures, that is, measures of the size of the difference between the good-usability system and the poor-usability system as reflected in a particular perceived-usability measure (for convenience, the size of the perceived-usability difference between the two systems is also shown in terms of the effect size measure d in Table 1). All correlations are significantly different from zero, that is, all four measures represent the difference in usability between the good-usability system and the poor-usability system.
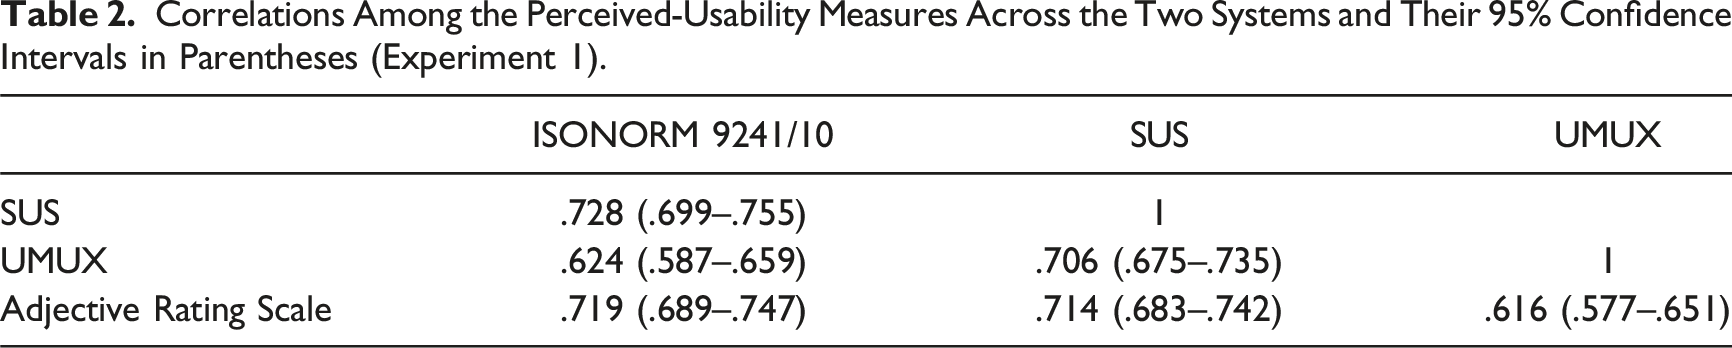
Correlations Among the Perceived-Usability Measures Across the Two Systems and Their 95% Confidence Intervals in Parentheses (Experiment 1).
Results of the Tests of Differences Between the Perceived-Usability Measures in How Well They Reflect the Difference in Perceived Usability Between the Good-Usability System and the Poor-Usability System (Steiger’s [1980] Test of Differences Between Dependent and Overlapping Correlations; Experiment 1).
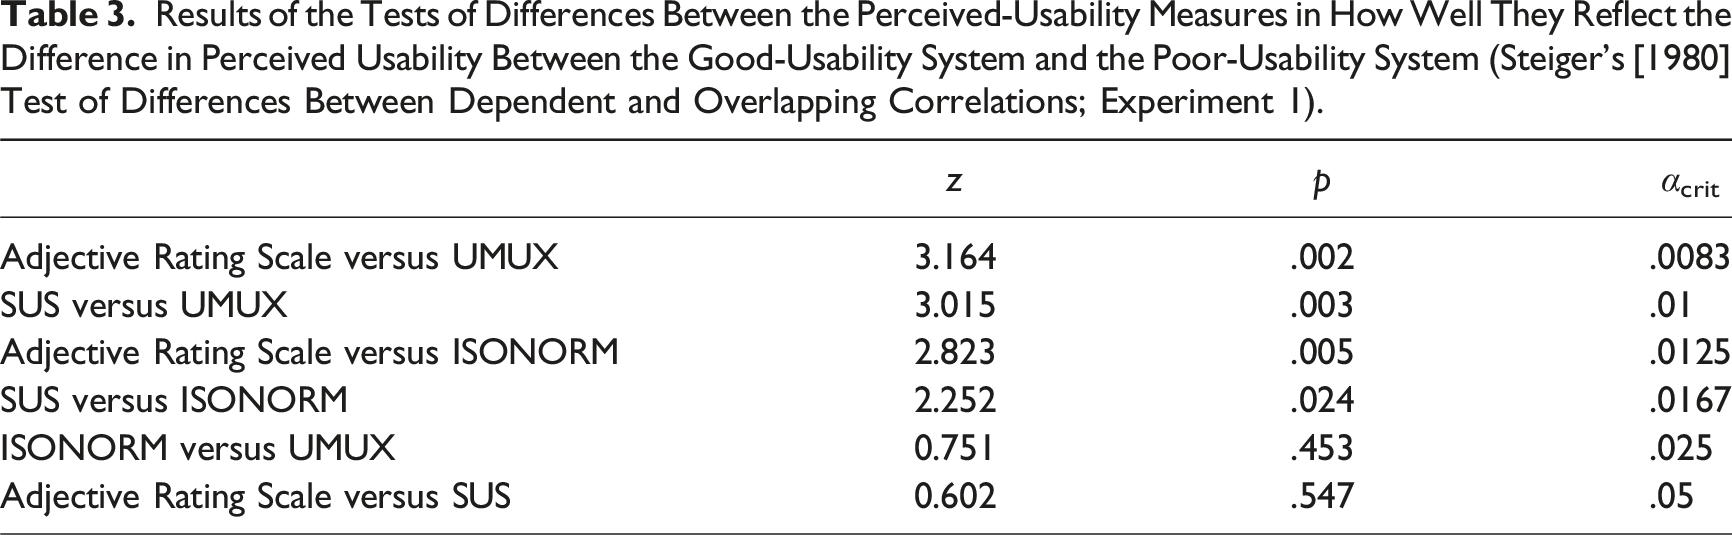
First, the Adjective Rating Scale reflected the difference in perceived usability between the good-usability system and the poor-usability system significantly better than the UMUX. Second, the SUS was better than the UMUX at representing this difference. Third, the Adjective Rating Scale was better than the ISONORM. Fourth, although the SUS would be classified as significantly better than the ISONORM 9241/10 without control for alpha error accumulation, this difference must be regarded as not statistically significant within the present family of tests. Finally, the ISONORM 9241/10 was not significantly better than the UMUX and the Adjective Rating Scale was not better than the SUS at representing the perceived-usability difference.
Discussion
One half of the results of Experiment 1 is rather unsurprising: The SUS is significantly better than the UMUX at representing the differences between a good-usability system and a poor-usability system. Similar results have already been presented by Finstad (2010) when he introduced the UMUX. His “System 2” was more usable than his “System 1” and the SUS (r = .89) was better than the UMUX (r = .86) at representing the difference in usability between these systems. Finstad did not evaluate this difference statistically. When this is done, the results show that the SUS is significantly better than the UMUX at representing the difference between the two systems used in that study, z = 5.36, p < 0.001.
The other half of the results is more surprising. The 35-item ISONORM 9241/10 is no better than the 4-item UMUX at representing the difference between systems. This is the opposite of what would be expected based on conventional measurement wisdom. The ISONORM 9241/10 thus seems to be the least efficient choice for measuring perceived usability, delivering no better discriminability than shorter questionnaires at a higher cost (with more items). We thus decided not to consider the ISONORM 9241/10 any further.
The biggest surprise is that the single-item Adjective Rating Scale reflected the usability differences between the two systems used in Experiment 1 so well. At a descriptive level, the Adjective Rating Scale reflected the difference between the good-usability system and the poor-usability system better than the other measures with more items. When evaluated statistically, the Adjective Rating Scale was significantly better than the UMUX and the ISONORM 9241/10 and as good as the SUS. This result confirms that, at least under certain circumstances, single-item measures may be better at capturing perceived usability than previously thought.
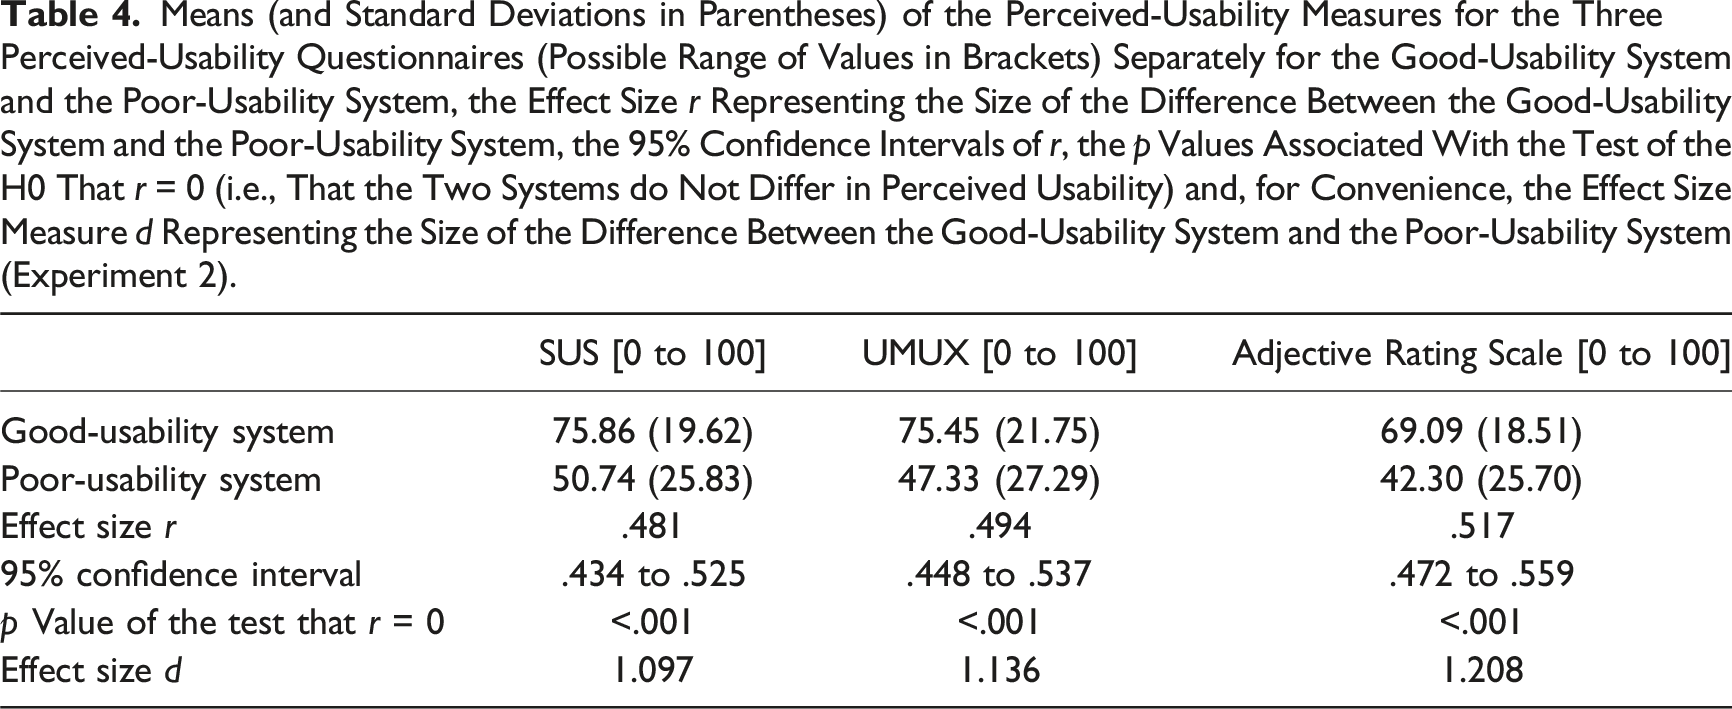
Means (and Standard Deviations in Parentheses) of the Perceived-Usability Measures for the Three Perceived-Usability Questionnaires (Possible Range of Values in Brackets) Separately for the Good-Usability System and the Poor-Usability System, the Effect Size r Representing the Size of the Difference Between the Good-Usability System and the Poor-Usability System, the 95% Confidence Intervals of r, the p Values Associated With the Test of the H0 That r = 0 (i.e., That the Two Systems do Not Differ in Perceived Usability) and, for Convenience, the Effect Size Measure d Representing the Size of the Difference Between the Good-Usability System and the Poor-Usability System (Experiment 2).
Experiment 2
Method
Statistical power considerations, participants, and design
The statistical power considerations were the same as those of Experiment 1. A total of 2644 participants living in Britain were recruited using the research panel of Respondi AG, Cologne, Germany, and gave informed consent, but 1549 did not complete the study. Of these 554 dropped out while working with a system with good usability and 833 while working with a system with poor usability. The final sample included 1095 participants (693 male, 395 female, 7 diverse) with a mean age of 54 years (SD = 15). Participants received a small monetary compensation for their participation. They were randomly assigned to the good-usability system (n = 688) and the poor-usability system (n = 407). All participants filled out three perceived-usability questionnaires.
Materials, procedure, and design
Materials, procedure, and design were the same as those of Experiment 1 with the following exceptions. The user interfaces of the simulated web-based mobile phone contract systems were translated into English. Additional measures were taken to increase the difference in usability between the two systems. For instance, the poor-usability system was made even less usable by reducing the font-background contrast and by mixing right-justified and left-justified text. Finally, the ISONORM 9241/10 was dropped due to its undesirable properties (see above).
Results
The average usability scores calculated for the three perceived-usability questionnaires are shown in Table 4, as are the correlations between the variable coding the type of system on the one side and the usability scores of each of the three perceived-usability questionnaires on the other. All correlations are significantly different from zero, that is, all three measures represent the differences in usability between the good-usability system and the poor-usability system.
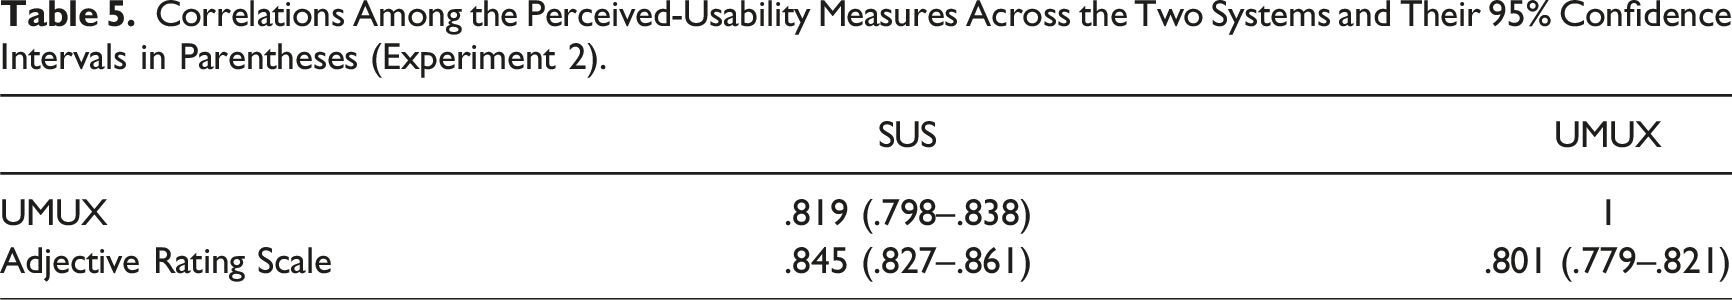
Correlations Among the Perceived-Usability Measures Across the Two Systems and Their 95% Confidence Intervals in Parentheses (Experiment 2).
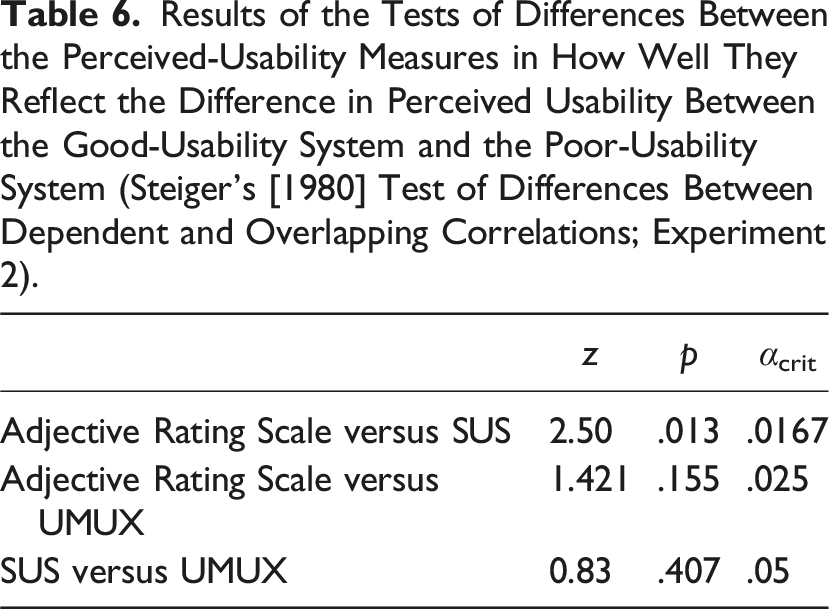
Results of the Tests of Differences Between the Perceived-Usability Measures in How Well They Reflect the Difference in Perceived Usability Between the Good-Usability System and the Poor-Usability System (Steiger’s [1980] Test of Differences Between Dependent and Overlapping Correlations; Experiment 2).
Discussion
As in Experiment 1, the Adjective Rating Scale reflected the difference between the good-usability system and the poor-usability system descriptively better than the other measures. However, the difference was statistically significant only for the comparison between the Adjective Rating Scale and the SUS, not for the comparison between the Adjective Rating Scale and the UMUX. The fact that the Adjective Rating Scale reflected the perceived-usability differences so well twice in the present series of experiments strengthens the assumption that the Adjective Rating Scale may be appropriate, if not optimal, for perceived-usability assessments at least in some circumstances, as will be discussed below.
General Discussion
The most prominent aspect of the data obtained in the present experiments is that the most economical measure of perceived usability, the single-item Adjective Rating Scale (Bangor et al., 2009), reflected the differences in usability between two systems at least as good as, and in some cases even significantly better than, established multi-item measures. At a descriptive level, the Adjective Rating Scale was better than all other measures considered here in both Experiment 1 and Experiment 2. In Experiment 1 the Adjective Rating Scale was significantly better than the UMUX and the ISONORM 9241/10 and was as good as the SUS. In Experiment 2, the Adjective Rating Scale was significantly better than the SUS and as good as the UMUX. Considering this and the fact that measurements of perceived usability cannot be any simpler than with a single item, we conclude that the Adjective Rating Scale seems to be the most efficient instrument for assessing perceived usability.
As mentioned in the introduction, successful single-item scales are not uncommon and have been found to yield valid measurements in many areas. Rossiter (2002) has argued that a single-item measure may be appropriate whenever the to-be-measured construct and its attribute can be considered to concern entities that are concrete and singular in the sense that (a) all raters understand which entity is being rated and (b) what is being rated is reasonably homogenous.
In the case considered here it seems plausible that condition (a) is fulfilled (Bangor et al., 2009). The next question is whether perceived usability is a reasonably homogeneous construct. As an indicator of homogeneity, we analyzed whether the SUS and the UMUX can be considered unidimensional measures by conducting an exploratory factor analysis, assuming that a single-factor solution to the factor extraction problem would indicate unidimensionality of the measures and, hence, the measured construct. A parallel analysis (Horn, 1965) using principle-component extraction and retaining all factors corresponding to eigenvalues greater than the 95th percentile of the reference eigenvalues (Auerswald & Moshagen, 2019) consistently revealed one significant dimension for both the SUS (Experiment 1: eigenvalue = 6.37, explaining 64% of the variance; Experiment 2: eigenvalue = 7.19, explaining 72% of the variance) and the UMUX (Experiment 1: eigenvalue = 2.49, explaining 62% of the variance; Experiment 2: eigenvalue = 2.84, explaining 71% of the variance). We conclude that both the SUS and the UMUX can be treated as essentially unidimensional which is consistent with recent conclusions by others (Berkman & Karahoca, 2016; Kortum et al., 2021; Lewis, 2019; Lewis & Sauro, 2017). We consider this to be an indicator of the homogeneity of the construct of perceived usability in the sense of Rossiter (2002).
Given the success of the single-item Adjective Rating Scale it seems appropriate to speculate about why this is the case. A possible reason is that a single-item text such as that of the Adjective Rating Scale (“Overall, I would rate the user-friendliness of this product as…”) is relatively general and open to interpretation. This may enable users to particularly flexibly focus on the aspect of the system which is the most salient determinant of perceived usability in a given context (e.g., the high clarity of the good-usability systems and the particularly bad legibility of the all-capitals negative polarity text in the poor-usability systems used here), thereby maximizing the difference between systems in terms of perceived-usability ratings. Whether this really is the case is a question that affords an empirical answer in an independent study.
Furthermore, as mentioned in the Introduction it seems possible that with longer perceived-usability questionnaires participants are required to respond to items that cover irrelevant or unknown aspects of the system in question. For instance, after having interacted with an online store interface, participants may not have a basis for answering items aiming at the possibilities to automate frequently recurring operations (Table A1, ISONORM 9241/10, Item 3), the controlling of information presented on the screen (Table A1, ISONORM 9241/10, Item 24), the integration of functions in the system (Table A1, SUS, Item 5) or the correcting of things with a system (Table A1, UMUX, Item 4). It is not clear what happens in such cases. Some participants may respond to such items with ratings they already gave to more relevant items. Alternatively, some participants could opt for a neutral response option. However, what really determines the responses in such cases is ultimately an empirical question. At this stage it seems plausible that such responses do not increase, and may in fact weaken, the ability of a perceived-usability questionnaire to discriminate between systems with good and bad usability.
Probably the biggest limitation of single-item measures of perceived usability is that they only inform about the level of perceived usability of a system or the difference in usability between systems while the reasons for this evaluation remain obscure. Therefore, such single-item measures are of limited utility during formative evaluation. Here, multi-item questionnaires consisting of several dimensions should be more useful than a single item because multi-item questionnaires should provide more information about where usability weaknesses might be located (Baumgartner et al., 2019a). However, the Adjective Rating Scale may turn out to be useful as a quick indicator of whether newly added features or changes made to a system in response to user feedback represent progress or regression in perceived usability, similar to what Bangor et al. (2008) have demonstrated for the SUS (see Table 12 in Bangor et al., 2008).
The next question is how one would predict precisely which perceived-usability measure—single-item or multiple-item—best reflects the difference between good and poor usability for a specific system. At present it seems that a precise answer to this question is not possible and that, in the end, the best answer will have to be given at an empirical level. However, as a heuristic for practitioners it seems reasonable to expect that single-item measures of perceived usability may be appropriate whenever the to-be-evaluated system is so simple that its interface can be considered concrete-singular, as defined by Rossiter (2002). This seems to apply, for example, to interfaces with only a main navigation and no help system (Bangor et al., 2009) such as the simulated web-based mobile phone contract systems used here. However, how well this heuristic works is an empirical question that needs to be answered in future studies.
An obvious limitation of the present experiments is that every participant filled out all perceived-usability questionnaires, albeit this occurred in a different random order for each participant. Such an approach is efficient, but the downside could be the risk of carry-over effects in the sense that the completion of earlier perceived-usability questionnaires may influence the way in which later questionnaires are completed. However, the chances of finding statistically significant carry-over effects within the present experimental design are close to zero even if carry-over effects existed. There were 24 and 6 different groups defined by the random sequences in which participants completed the perceived-usability questionnaires in Experiments 1 and 2, respectively. This would result in 276 and 15 statistical tests of pairwise group differences in Experiments 1 and 2, respectively. The statistical power of each test of a group difference would be minimal given the small sample sizes of the groups and the extremely small levels of alpha needed to control for alpha error accumulation within these large families of statistical tests. To avoid carry-over effects, one person should complete only one perceived-usability questionnaire. However, in this case the sample size requirements can easily become very large which means that such investigations will realistically be limited to a comparison of two perceived-usability questionnaires.
Another limitation of the present study is that the well-evaluated, positively worded SUS was used, whereas the UMUX contained two positive and two negative items. The reason for this is that no evaluated version for the UMUX with only positive items was available. Therefore, the question remains as to whether a version of the UMUX with exclusively positive items would perform better in nonsupervised perceived-usability studies than the version of the UMUX used here.
Conclusion
Less may be more in measuring perceived usability. The single-item Adjective Rating Scale (Bangor et al., 2009) is the shortest of the perceived-usability measures considered here which at the same time reflected the difference in perceived usability between systems at least as well as the UMUX (Finstad, 2010), the SUS (Brooke, 1996) and the ISONORM 9241/10 (Prümper, 1993). In Experiment 1 the Adjective Rating Scale was significantly better at representing the difference in usability between a good-usability system and a poor-usability system than the UMUX and the ISONORM 9241/10, in Experiment 2 it was significantly better than SUS and at a descriptive level it was better than all other measures of perceived usability in both experiments.
It thus seems that the Adjective Rating Scale can be recommended as an efficient and valid alternative to the total scores of subjective-usability questionnaires (i.e., when more detailed feedback is not needed or helpful for the design of the interface) and when the to-be-rated interfaces can be considered concrete-singular (Rossiter, 2002).
Footnotes
Key Points
• Four common perceived-usability questionnaires were experimentally validated and compared: the 35-item ISONORM 9241/10 (only in Experiment 1), the 10-item System Usability Scale (SUS), the 4-item Usability Metric for User Experience (UMUX) and the single-item Adjective Rating Scale. • The Adjective Rating Scale was as good as, and sometimes significantly better than, all other measures of perceived usability considered here at representing the difference in usability between a good-usability system and a poor-usability system. • The Adjective Rating Scale can be recommended as a particularly efficient and valid measure of perceived usability, at least for interfaces that are considered concrete-singular (Rossiter, 2002) such as the simulated web-based mobile phone contract systems used here (Bangor et al., 2009).
Declaration of Conflicting Interests
The author(s) declared no potential conflicts of interest with respect to the research, authorship, and/or publication of this article.
Funding
The author(s) received no financial support for the research, authorship, and/or publication of this article.
Data Availability Statement
Appendix A
All Items of the Four Usability Questionnaires used: the ISONORM 9241/10 (Translated Into English by the Authors of This Article), the Version of the SUS With Positively Worded Items, the UMUX, and the Adjective Rating Scale.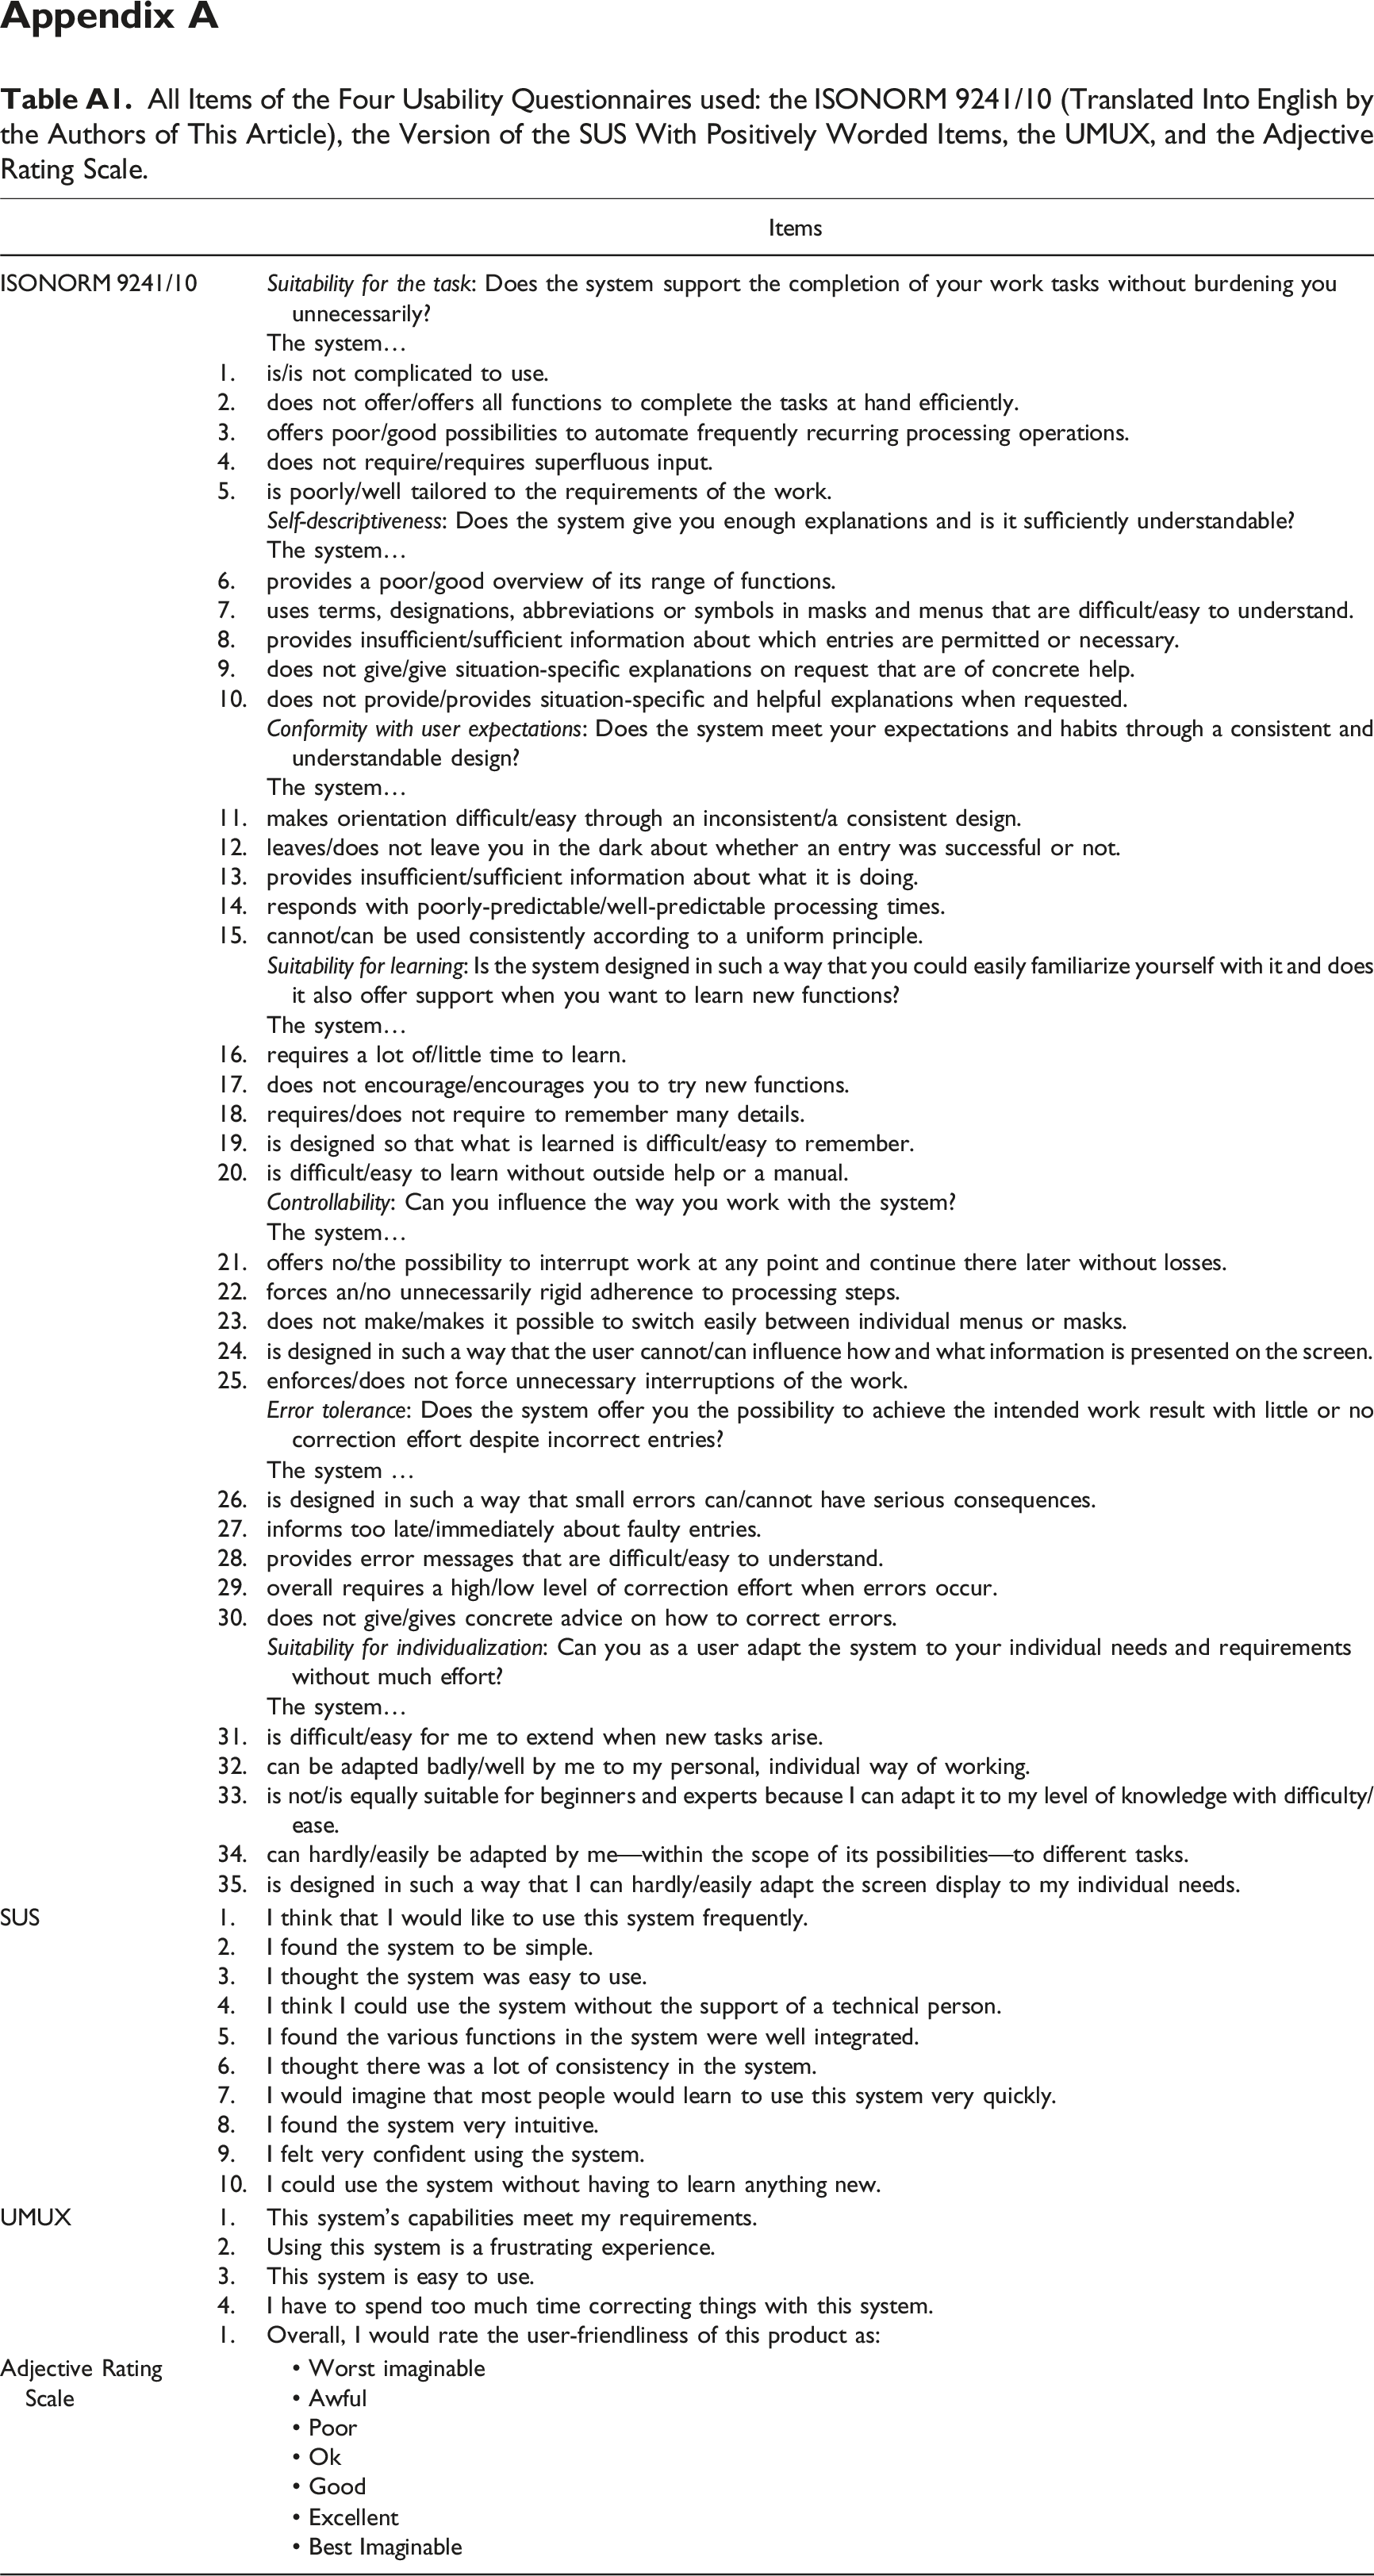
Items
ISONORM 9241/10
Suitability for the task: Does the system support the completion of your work tasks without burdening you unnecessarily?
The system…
1.
is/is not complicated to use.
2.
does not offer/offers all functions to complete the tasks at hand efficiently.
3.
offers poor/good possibilities to automate frequently recurring processing operations.
4.
does not require/requires superfluous input.
5.
is poorly/well tailored to the requirements of the work.
Self-descriptiveness: Does the system give you enough explanations and is it sufficiently understandable?
The system…
6.
provides a poor/good overview of its range of functions.
7.
uses terms, designations, abbreviations or symbols in masks and menus that are difficult/easy to understand.
8.
provides insufficient/sufficient information about which entries are permitted or necessary.
9.
does not give/give situation-specific explanations on request that are of concrete help.
10.
does not provide/provides situation-specific and helpful explanations when requested.
Conformity with user expectations: Does the system meet your expectations and habits through a consistent and understandable design?
The system…
11.
makes orientation difficult/easy through an inconsistent/a consistent design.
12.
leaves/does not leave you in the dark about whether an entry was successful or not.
13.
provides insufficient/sufficient information about what it is doing.
14.
responds with poorly-predictable/well-predictable processing times.
15.
cannot/can be used consistently according to a uniform principle.
Suitability for learning: Is the system designed in such a way that you could easily familiarize yourself with it and does it also offer support when you want to learn new functions?
The system…
16.
requires a lot of/little time to learn.
17.
does not encourage/encourages you to try new functions.
18.
requires/does not require to remember many details.
19.
is designed so that what is learned is difficult/easy to remember.
20.
is difficult/easy to learn without outside help or a manual.
Controllability: Can you influence the way you work with the system?
The system…
21.
offers no/the possibility to interrupt work at any point and continue there later without losses.
22.
forces an/no unnecessarily rigid adherence to processing steps.
23.
does not make/makes it possible to switch easily between individual menus or masks.
24.
is designed in such a way that the user cannot/can influence how and what information is presented on the screen.
25.
enforces/does not force unnecessary interruptions of the work.
Error tolerance: Does the system offer you the possibility to achieve the intended work result with little or no correction effort despite incorrect entries?
The system …
26.
is designed in such a way that small errors can/cannot have serious consequences.
27.
informs too late/immediately about faulty entries.
28.
provides error messages that are difficult/easy to understand.
29.
overall requires a high/low level of correction effort when errors occur.
30.
does not give/gives concrete advice on how to correct errors.
Suitability for individualization: Can you as a user adapt the system to your individual needs and requirements without much effort?
The system…
31.
is difficult/easy for me to extend when new tasks arise.
32.
can be adapted badly/well by me to my personal, individual way of working.
33.
is not/is equally suitable for beginners and experts because I can adapt it to my level of knowledge with difficulty/ease.
34.
can hardly/easily be adapted by me—within the scope of its possibilities—to different tasks.
35.
is designed in such a way that I can hardly/easily adapt the screen display to my individual needs.
SUS
1.
I think that I would like to use this system frequently.
2.
I found the system to be simple.
3.
I thought the system was easy to use.
4.
I think I could use the system without the support of a technical person.
5.
I found the various functions in the system were well integrated.
6.
I thought there was a lot of consistency in the system.
7.
I would imagine that most people would learn to use this system very quickly.
8.
I found the system very intuitive.
9.
I felt very confident using the system.
10.
I could use the system without having to learn anything new.
UMUX
1.
This system’s capabilities meet my requirements.
2.
Using this system is a frustrating experience.
3.
This system is easy to use.
4.
I have to spend too much time correcting things with this system.
1.
Overall, I would rate the user-friendliness of this product as:
Adjective Rating Scale
• Worst imaginable
• Awful
• Poor
• Ok
• Good
• Excellent
• Best Imaginable
Appendix B
Correlations Among the Usability Measures Within the Good-Usability System and Their 95% Confidence Intervals in Parentheses (Experiment 1).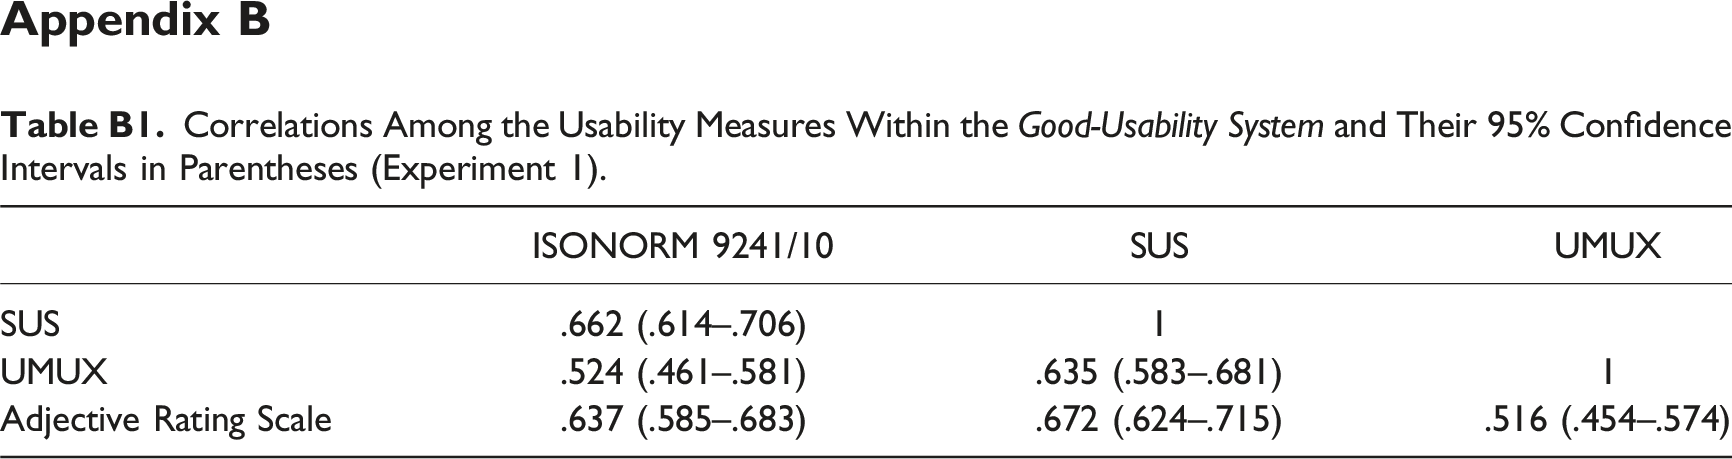
ISONORM 9241/10
SUS
UMUX
SUS
.662 (.614–.706)
1
UMUX
.524 (.461–.581)
.635 (.583–.681)
1
Adjective Rating Scale
.637 (.585–.683)
.672 (.624–.715)
.516 (.454–.574)
Correlations Among the Usability Measures Within the Poor-Usability System and Their 95% Confidence Intervals in Parentheses (Experiment 1).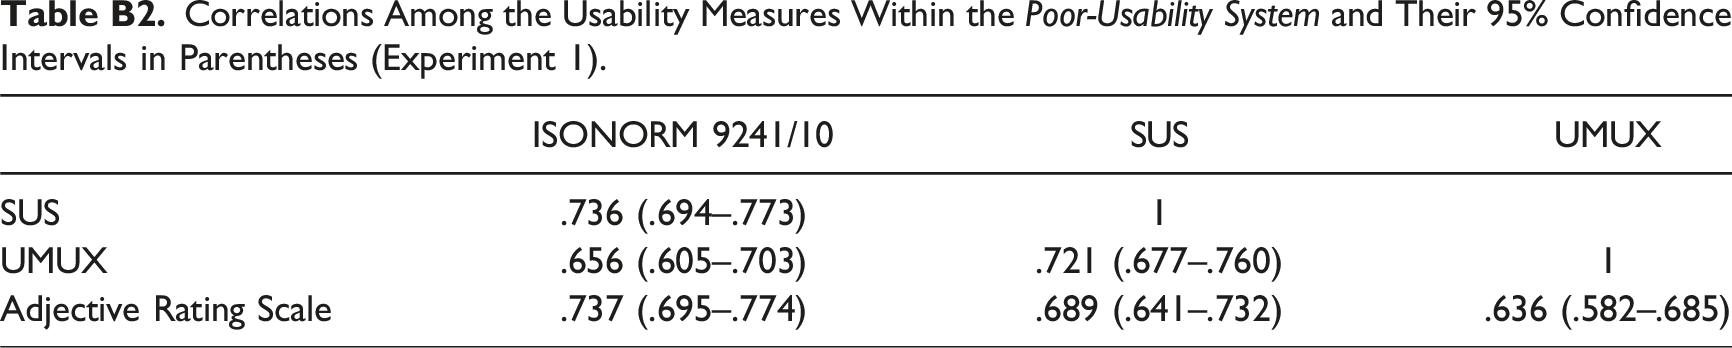
ISONORM 9241/10
SUS
UMUX
SUS
.736 (.694–.773)
1
UMUX
.656 (.605–.703)
.721 (.677–.760)
1
Adjective Rating Scale
.737 (.695–.774)
.689 (.641–.732)
.636 (.582–.685)
Correlations Among the Usability Measures Within the Good-Usability System and Their 95% Confidence Intervals in Parentheses (Experiment 2).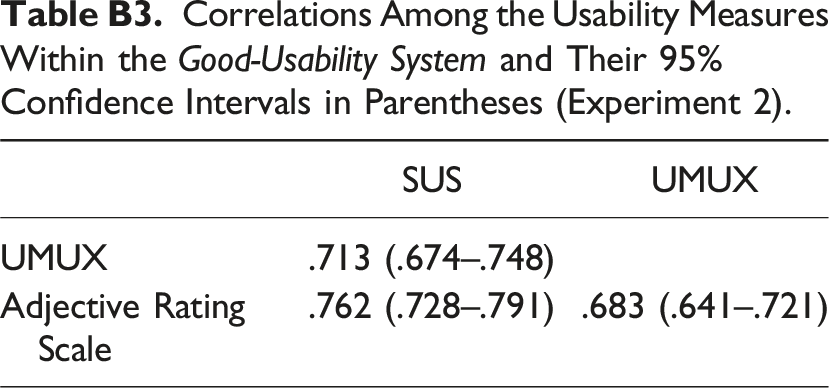
SUS
UMUX
UMUX
.713 (.674–.748)
Adjective Rating Scale
.762 (.728–.791)
.683 (.641–.721)
Correlations Among the Usability Measures Within the Poor-Usability System and Their 95% Confidence Intervals in Parentheses (Experiment 2).
SUS
UMUX
UMUX
.814 (.778–.844)
Adjective rating scale
.825 (.791–.853)
.784 (.743−.819)
Author Biographies
Elisa Gräve is a PhD student in the Department of Experimental Psychology at Heinrich Heine University Düsseldorf in Düsseldorf, Germany.
Axel Buchner is a full professor in the Department of Experimental Psychology at Heinrich Heine University Düsseldorf in Düsseldorf, Germany. He received his PhD in psychology from Bonn University in 1992.