
Abstract
Background
Previous research has shown that experiencing motion stimuli negatively impacts cognitive performance.
Objective
In the current study, we investigate whether this impact relates to Type-II spatial disorientation (SD), to motion stimulus magnitude, or to an interaction of these factors.
Method
Stimuli for participants (n = 23) consisted of Earth-vertical yaw rotations on a rotating chair in a completely darkened room. In the surprise condition, the stimulus started with subthreshold acceleration, followed by suprathreshold deceleration to a non-zero velocity, inducing a sensation of rotation that is opposite to the actual rotation revealed when the lights were switched on. In the no-surprise condition, the same changes in velocity were used, but starting from (almost) zero velocity, which induced a sensation of rotation in the same direction as the actual rotation. Participants performed a self-paced arithmetic task and measurement of their cognitive performance started after the environment was revealed. Stimulus magnitude was operationalized through higher or lower peak suprathreshold deceleration.
Results
The results revealed that counting speed decreased significantly when participants were surprised, constituting a large effect size. The proportion of counting errors likewise increased significantly when participants were surprised, but only in the high-magnitude condition.
Application
The findings suggest that surprise caused by the recognition of SD has an involuntary disruptive effect on cognition, which may impact performance of piloting tasks. These results are relevant when modeling motion stimuli effects on performance, and when developing SD awareness training for pilots.
Introduction
Spatial disorientation (SD) in flight involves an erroneous sense of the aircraft attitude and motion relative to the earth. SD is primarily caused by confusing vestibular or visual motion cues, or by misinterpretation of the instruments (Benson & Stott, 2006; Gillingham, 1992; Previc & Ercoline, 2004). The definition excludes the erroneous sense of lateral position relative to fixed points on earth, which is categorized as navigational error. SD continues to be a serious safety risk in aviation. It was determined to have contributed to 12% of fatal loss of control in flight (LOC-I) accidents in transport and commuter aircraft between 1996 and 2010 (Belcastro et al., 2017). More recently, Newman and Rupert (2020) reported that 17% of LOC-I accidents in 1981–2016 were caused by SD, and they noted an increasing trend. Similar rates are reported for military aviation, where SD was found to be the major contributor in 12% of serious accidents between 1993 and 2013 in the U.S. Air Force (Poisson et al., 2014).
SD constitutes a mismatch between assumed spatial orientation and actual orientation. Gillingham (1992) formulated three categories of SD based on the impact on the pilot’s functioning: Type-I, where the pilot remains unaware of the mismatch, leading to inappropriate control responses and, worst-case, to controlled flight into terrain (CFIT); Type-II where the pilot becomes aware of the mismatch; and Type-III, where the pilot becomes confused, or even incapacitated, upon becoming aware of the mismatch. However, the borders between these categories are vague, seeing that awareness, confusion, and the impact on performance caused by erroneous sensations is not dichotomous but may vary from low to high.
Type-I SD in particular may lead to erroneous control inputs based on incorrect perceptions, which are termed “orientation errors” (Benson & Stott, 2006). Indeed, Type-I SD is considered to be the most hazardous form of SD (Previc & Ercoline, 2004; Benson & Stott, 2006). Nevertheless, the impact of Type-II SD on flight safety may be underestimated if only orientation errors are considered. Type-II SD may impact performance in other ways, for instance, by causing “disorientation stress” (Benson & Stott, 2006) or by usurping attentional resources to regain or maintain spatial orientation, which then cannot be used for other tasks. In the majority of accidents involving SD, SD itself was not the primary cause, meaning that there were other problems which the pilots needed to manage besides SD (Belcastro et al., 2017; Newman & Rupert, 2020). Type-I SD is also most easy to identify in hindsight from pilot communications, control inputs and flight path data. In contrast, if a pilot was managing Type-II SD without displaying orientation errors, this may have impacted performance on other important tasks without showing any detectable signs of SD
The following example from the Aviation Safety Reporting System database (report number 1376835) illustrates that Type-II SD can severely impact a pilot’s ability to perform important flying tasks: “We entered the cloud layer at about 4,000 feet. I was hand flying the aircraft and almost immediately upon cloud entry began feeling disoriented with a distinct lean to the right. Trusting the instruments I held the aircraft wings level and levelled off at 3000. (…) Now a little stressed and still fighting the disorientation, I tried to reset the GPS to show the WITOK waypoint, but as I was working with the GPS, the aircraft began an actual turn to the right and a descent of about 500 feet, allowing a view of the ground. I recovered, stabilized and began climbing back to the assigned altitude but was already on a heading toward the final approach fix inside of WITOK. I decided that manipulating the GPS was a bad idea and asked the controller for a vector to ZUGNI. (…) The feeling of disorientation was a surprise and a great distraction. Coupled with the unexpected instructions, I was overwhelmed. I continued to fly the aircraft and we got safely to landing but the experience was not ideal.”
In this example, the awareness of being disoriented seemed to increase mental workload and stress, which interfered with the pilot’s ability to reconfigure the Global Positioning System (GPS), and eventually led to a deviation of the flight path. However, even if such deviation had not occurred, this “fighting” against the SD would still have had the same disruptive effect on performance of other tasks.
The idea that self-orientation requires attentional resources and can interfere with concurring cognitive tasks was named the “orientation first” principle by Gresty et al. (2008). This is an extension of the “posture first” principle, which is the similar principle referring to postural balance instead of to spatial orientation. The authors suggest that self-orientation is so fundamental for our functioning that directing attention to it is automatically prioritized over other tasks. In a broader sense, it is thought that any realization of incorrect assumptions regarding the world (i.e., surprise) may automatically draw attentional resources. This is due to an evolutionary benefit of evaluating such discrepancies, correcting one’s assumptions about the world, and improving one’s ability to predict and make sense of future events (Meyer et al., 1997). In several experimental studies, it was shown that vestibular or visual motion stimuli indeed impair performance on concurrent cognitive tasks, thus supporting the orientation-first principle (Green et al., 2010; Gresty et al., 2008; Johnson, 1956; Sen et al., 2002; Van Elk & Blanke, 2014; Webb et al., 2012; Yardley et al., 2002 [experiment 4]; Yardley et al., 1999; Stróżak et al., 2018; see also a review by Gresty & Golding, 2009). Interestingly, performing a cognitive task was also found to increase the impact of a SD stimulus on pilots’ flying performance (Lewkowicz et al., 2019), suggesting that both compete for the same resources.
However, the existing literature is not conclusive about whether the impact of these motion stimuli on cognitive performance was caused by distraction, or by other effects related to the stimulus, such the need to correct for more perturbations of balance or orientation, or increased motion sickness. In Webb et al. (2012) SD was manipulated by varying the maneuvering intensity during formation flight, and this intensity may have induced additional workload by itself. Stróżak et al., (2018) found an effect of SD stimuli in one of six flight profiles which they tested, but they did not find evidence of increased Type-II SD in this profile.
With the current study we aim to address a gap in the existing literature by specifically manipulating Type-II SD and measuring its effect on the performance of a concurrent cognitive task. A secondary goal was to test whether motion stimulus magnitude had an effect or an interaction effect with Type-II SD. The hypotheses were the following: 1) Type-II SD occupies attentional resources, leading to decreased performance on a parallel cognitive task; 2) A motion cue of a higher magnitude (i.e., peak acceleration) is experienced as more relevant and therefore impacts cognitive performance more than a motion cue of lower magnitude, independently from Type-II SD; and 3) when Type-II SD is caused by a higher magnitude motion cue, there is a larger mismatch between expected and actual motion. We therefore also expect an interaction effect between Type-II SD and motion cue magnitude on cognitive performance.
Method
Participants
A group of 24 participants were tested, but one participant was excluded from analysis due to an inability to perform the tasks at a level that is required to obtain valid data. The remaining sample consisted of 10 men and 13 women, mean age = 39.7 years, SD = 14.4. The participants were recruited through a pool of registered participants at TNO Soesterberg, The Netherlands, under voluntary participation. To be eligible for participation, participants should not have consumed drugs or alcohol the previous or same day, should not have any health issues related to impairments to their vestibular system, should judge themselves to not have excessive sensitivity to motion sickness, and be confident about their general ability to perform the cognitive (arithmetic) task, which was described to them. This research complied with the tenets of the Declaration of Helsinki and was approved by the Ethical Review Boards of the Faculty of Social and Behavioural Sciences of Utrecht University and of TNO Soesterberg. Informed consent was obtained from each participant, and participants received a standard compensation for participating (i.e., 30 euros for 2 hours).
Design
The experiment had a within-subject design, as participants performed a cognitive task in three conditions that consisted of different motion stimuli. Type-II SD was manipulated by inducing surprise or no-surprise by the motion stimuli. This factor of surprise (yes or no) was combined with a second factor of motion cue magnitude (high or low) to create four types of motion stimuli. A separate condition was a baseline condition without motion, which was only used to make additional comparisons between surprise, no-surprise and baseline. The stimuli were presented in a number of “runs”. The average of each run type (e.g., “surprise and low magnitude”) was used for data analysis.
Materials
As shown in Figure 1, the motion stimuli were delivered using an electrically driven, servo-controlled “Barany chair,” which can reach a maximum acceleration of 90°/s2 and velocity of 260°/s. MATLAB (The Mathworks, Inc., Natick, Massachusetts, US) was used to create velocity profiles, which were sampled at a rate of 10 Hz. The chair’s surfaces were covered with three cm thick foam, to limit participant movement and absorb potential undesired motion cues, for example, due to vibrations. An adjustable, padded head fixator was used to prevent head movements, which could cause Coriolis sensations during the motion stimuli. A four-point harness was used for safety. A camera (Hero8, GoPro, San Mateo, California, US) for recording audio and the lights switching on was attached to the chair close to the participant’s head, facing away from them. Participants wore a ski mask which partly blocked incoming light. It blocked undesired light cues when the lights were off, while allowing participants to see the environment when the lights were on. Over-ear headphones, over which white noise was played, were used to mask auditory cues from the rotating chair. Finally, participants held a small switch in their lap, which they operated with their dominant hand. It has three possible positions. With no input, the switch automatically took a neutral position. Active inputs could move the switch either left or right. Experimental setup with a participant demonstrating the position used while performing the tasks. a: camera for sound and light recording, b: handheld switch, c: ski mask and headphones, d: fluorescent lamps.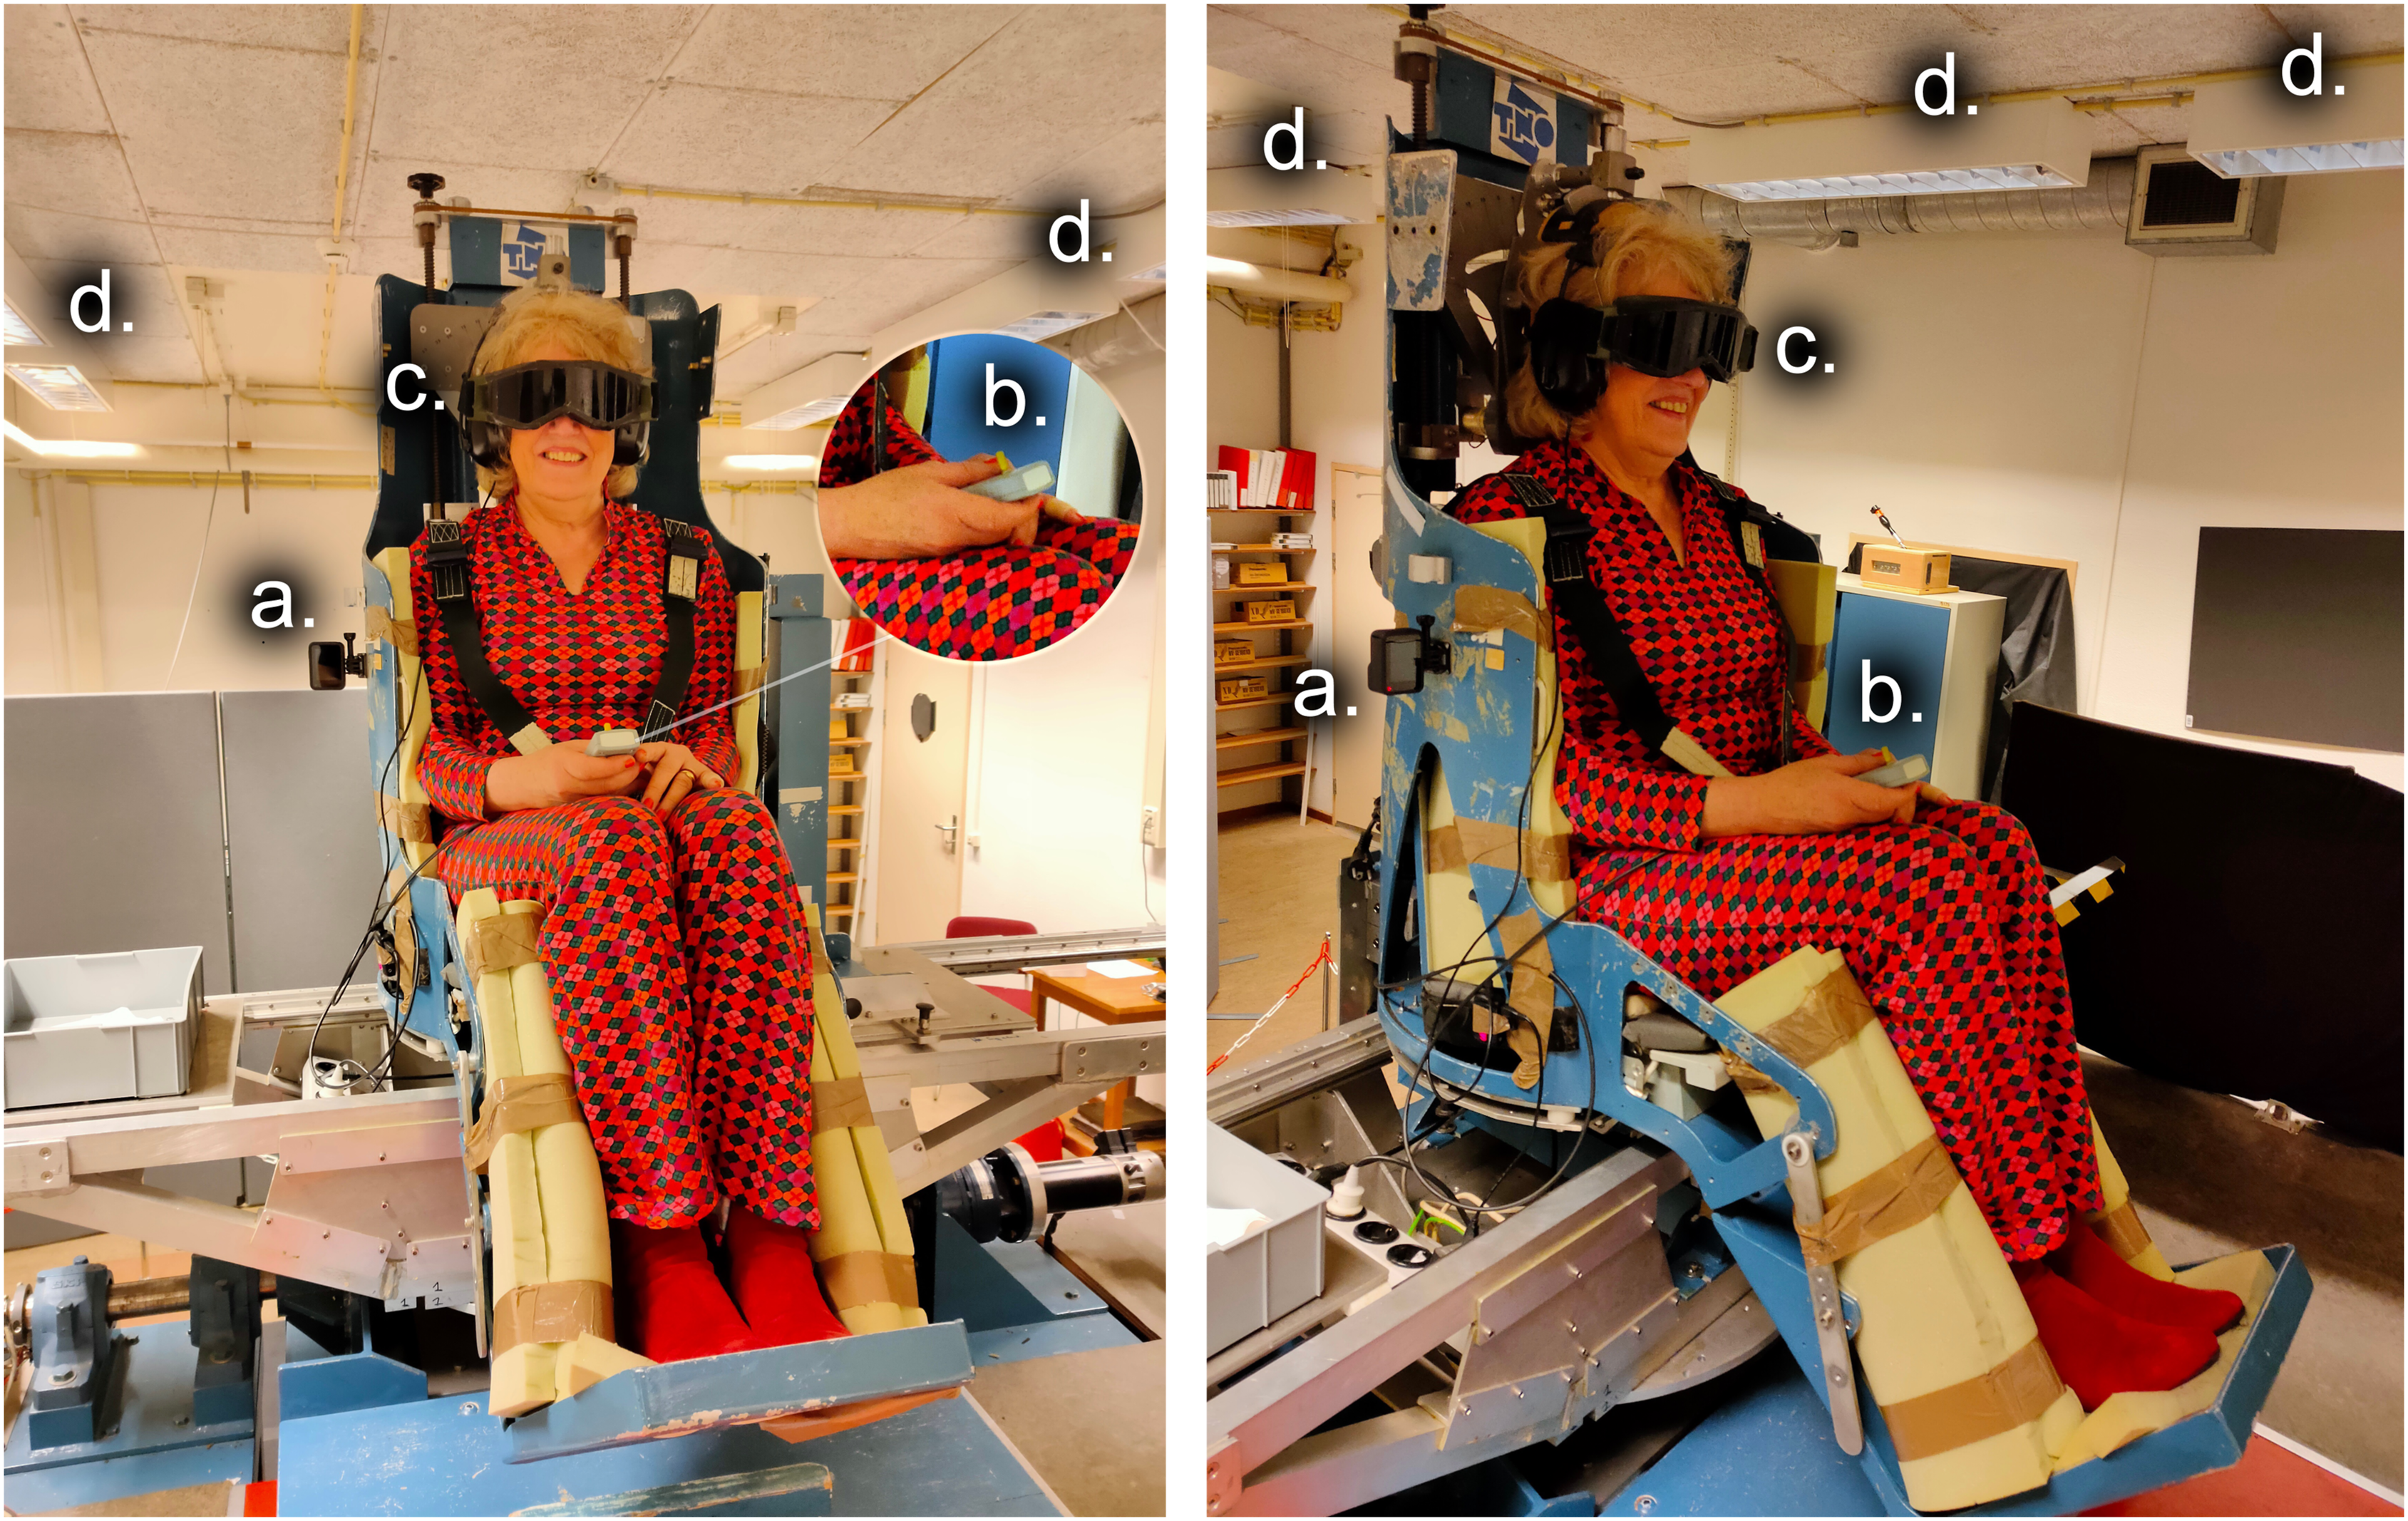
Procedure
The total duration of the experiment for one participant was 2 hours. Participants were given the time to get comfortable in the chair, adjust the head fixator, and learn to unbuckle. Before the actual test runs started, the task was practiced in six practice runs, incrementally adding different elements of the task until the task was performed fully.
The test runs were divided into two sets of 12 runs, with a 15-minute break in between the sets, and a short two-minute break between every four runs. Each set consisted of an equal amount of high- and low-magnitude runs, and of left- and right-directed runs. In each set, there were eight no-surprise runs, two surprise runs and two baseline runs. There were thus in total four baseline runs, four surprise runs (two high and two low magnitude) and 16 no-surprise runs (eight high and eight low magnitude). The order of no-surprise and baseline runs was counterbalanced between participants. Every surprise and baseline run was preceded by two no-surprise runs to equally distribute the run types over the sessions (see Figure 2). The ratio of surprise runs to no-surprise runs was kept purposefully low to induce surprise in the surprise runs. Using a Wilcoxon signed rank test we did not find a significant difference between the mean counting speed (p = 0.403) and counting errors (p = 0.943) in the first no-surprise runs of the sets and that of the other no-surprise runs. An example of the order of the run types in the first set of runs.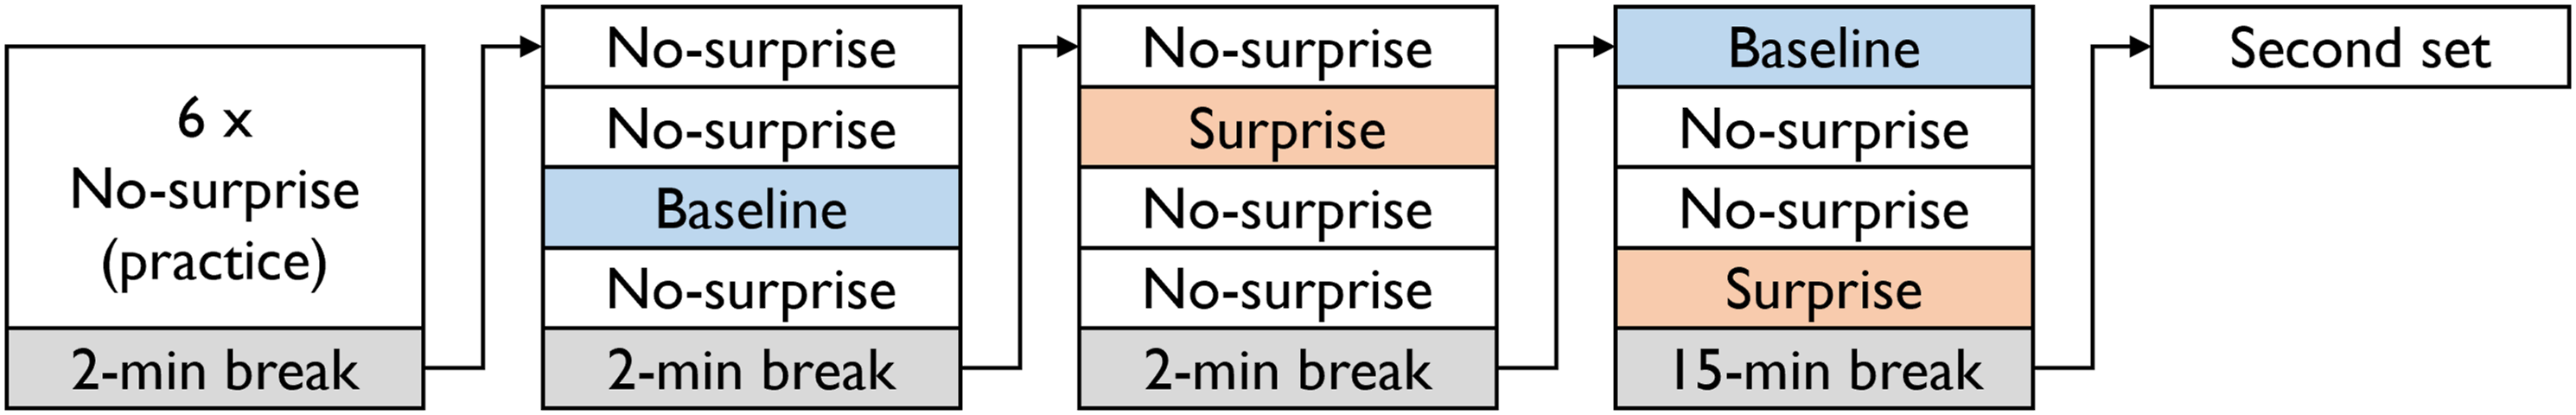
To ensure that performance was not influenced by motion sickness, halfway into the experiment and at the end, participants were asked to report motion sickness, on a Dutch version of the Misery Scale (MISC) ranging from 0 to 10 (Bos et al., 2005). If a participant reached a score of six (i.e., any nausea) or higher, the experiment would be stopped, and data would be discarded. One participant (who had participated in a motion sickness experiment earlier that day) had to stop the experiment, and a new participant was recruited instead.
Tasks and Dependent Measures
Cognitive Task
Continuous cognitive performance was measured using a “serial-threes” subtraction task. Participants were instructed to count backward both quickly and accurately in steps of three from a randomly selected starting number between 400 and 500. Similar versions of the task have been used previously to assess the workload of postural stability (Burcal et al., 2014; Book & Garling, 1980). A serial-sevens task was found to be too difficult to perform in parallel with the other experimental tasks in pilot testing. The starting number was displayed at the start of each run on a laptop screen which the experimenter held up. Participants were instructed to start the task as soon as the white noise sounded in their headphones, and to continue until the white noise stopped. From the audio recordings of the counting task, two measures were determined. First, counting speed was the number of counts in the 10 seconds after lights were switched on. Second, the proportion of errors within this number of counts was measured. An error was registered if participants uttered a wrong number and did not immediately correct themselves.
Orientation Task and Surprise Rating
Participants were also instructed to use the handheld switch to indicate whether they perceived chair rotation or not, and if so, in which direction (i.e., left or right). If they did not perceive rotation or if they were unsure about the rotation direction they were asked not to give an input, which caused the switch to automatically go to the neutral position. Both the orientation task and the cognitive task were said to be equally important. If participants gave no input with the switch during a run which had suprathreshold cues, they were reminded of the orientation task by the experiment leader after the run ended.
After the white noise had stopped playing, a surprise indication was collected verbally, by asking the participants: “Where you surprised by the motion when the lights were turned on?” They could answer this question only with “yes” or “no.”
Stimuli and Conditions
The motion stimuli consisted of rotations about an Earth-vertical (yaw) axis through the center of the participant’s head. The velocity profiles for a run of each condition are displayed in Figure 3. The goal of these profiles was to create vestibular sensations that were indistinguishable between the surprise and no-surprise condition, whereas the actual turn direction revealed at the end of the run was either matching this sensation in the no-surprise condition, or opposite to it in the surprise condition. Whether the surprise manipulation was successful was checked for each run, and unsuccessful runs were removed from analysis (see section: 2.6 Manipulation check and exclusion of runs). Motion profiles for the conditions with numbers indicating the phases described in the text.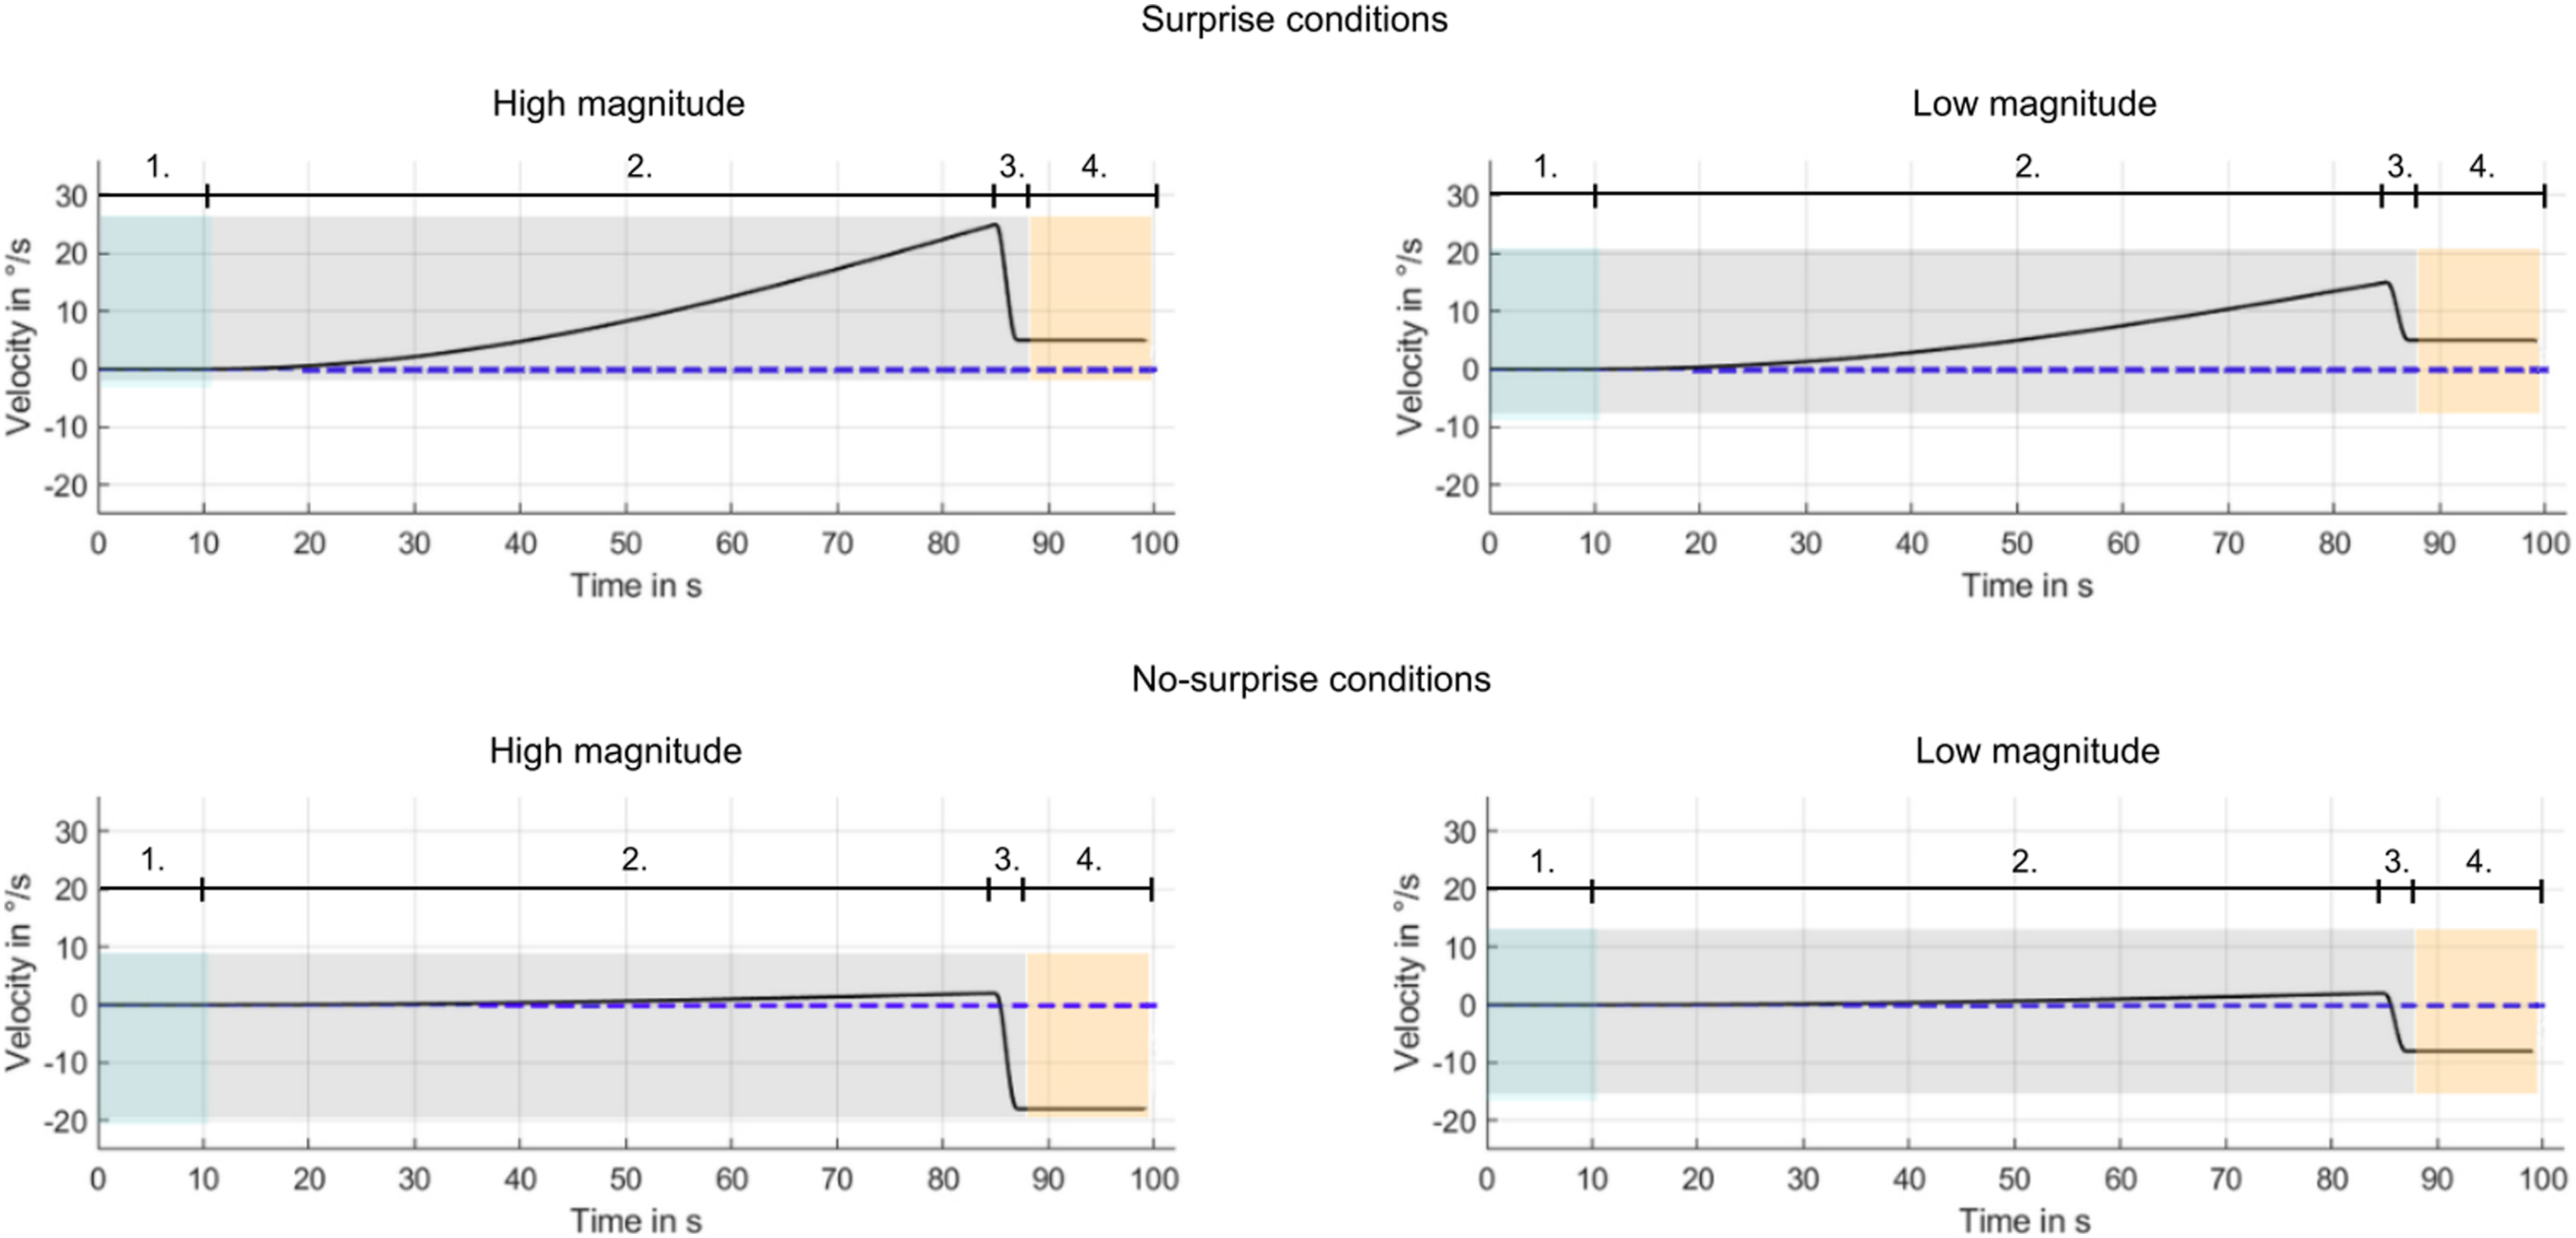
An overview of the parameters used for the motion stimuli in the conditions
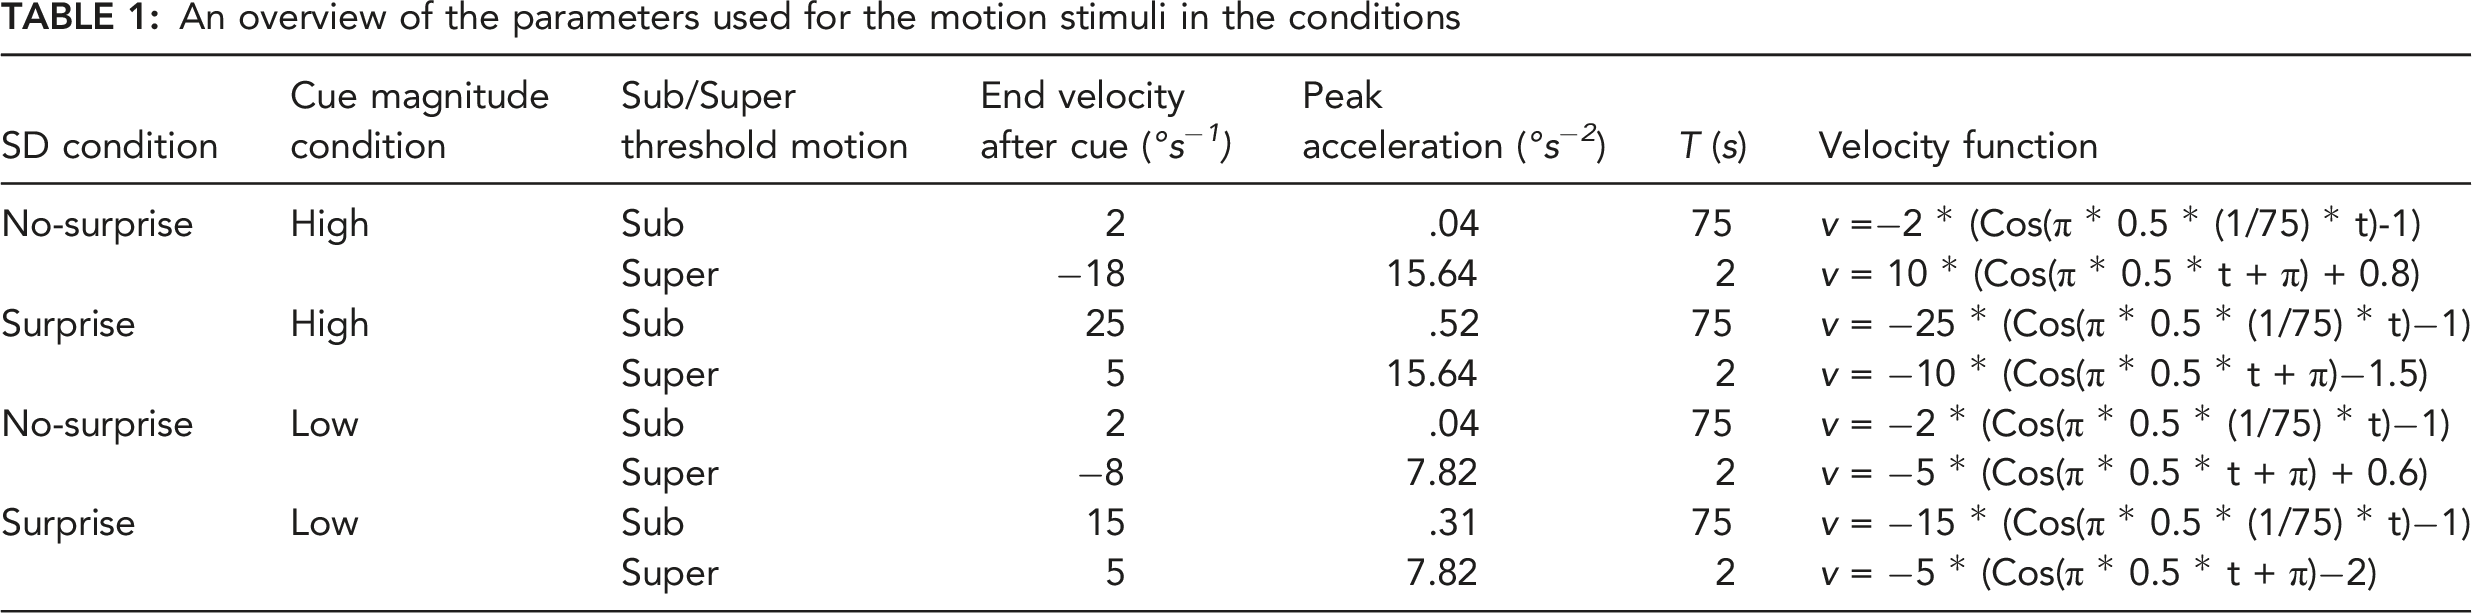
Phase 3 was a two-seconds suprathreshold angular acceleration toward the final turn rate. The change in turn rate, and thus the peak acceleration, differed between conditions of low and high magnitude (see Table 1). The suprathreshold acceleration was either in the same direction as the final turn rate in the no-surprise condition, or opposite to the final turn rate in the surprise condition (see Figure 3). In phase 4, the final turn rate was maintained and revealed to the participants by switching on the lights. Participants were instructed to keep their eyes open throughout the run. The lights were switched on 2 seconds after the end of the suprathreshold acceleration cue, to give participants time to react with the handheld switch. In the next 10 seconds with the lights on, cognitive performance was measured (see Tasks). At the end, the white noise stopped and the chair was gently brought to a stop.
A baseline condition without chair rotation was also included to obtain a baseline measure of the participants’ cognitive performance. Participants were informed that there would be no motion before each baseline run to prevent surprise. Participants performed the baseline runs without holding the orientation switch.
Manipulation Check and Exclusion of Runs
Runs were excluded from analysis if both the orientation task and verbal task indicated unsuccessful surprise manipulation. Thus, no-surprise runs were excluded if participants verbally indicated surprise and if their indicated rotation direction with the orientation switch did not match the actual rotation direction when the lights were switched on. Surprise runs were excluded if participants indicated no-surprise verbally and if their indicated rotation direction was not opposite to the actual rotation direction when the lights were switched on. Baseline runs were excluded if participants verbally indicated surprise.
Data Analysis
To assess the effect of surprise and motion magnitude on counting speed and proportion of errors, we used a 2 × 2 repeated-measures ANOVA with two within-subject factors, i.e., surprise (yes/no) and magnitude (high/low). Paired-samples t-tests were used for post hoc analyses. If data was not normally distributed, an ordinal logistic model for Generalized Estimating Equations (GEE) was used, with Wilcoxon signed rank for post hoc comparisons. A main effect of surprise (i.e., performance in no-surprise > performance in surprise) would support hypothesis 1, a main effect of motion magnitude (i.e., performance in low > performance in high magnitude) would support hypothesis 2, and a surprise × motion magnitude interaction effect (i.e., in surprise, the difference between high and low > in no-surprise) would support hypothesis 3.
As an additional check, we also compared the performance in the surprise condition (both magnitudes combined) and in the no-surprise condition (both magnitudes combined) with that in the baseline condition using a repeated-measures ANOVA, with Bonferroni correction for two comparisons for the post hoc test. If data was not normally distributed, a Friedman test was used instead, with Wilcoxon signed rank for post hoc comparisons. We expect to find lower performance in surprise than in baseline, and no significant difference between no-surprise and baseline.
Results
Manipulation Check and Exclusion of Runs
One surprise run, one baseline run (1.0% of respective condition runs), and seven no-surprise runs (1.8% of no-surprise runs) were excluded because the verbal response and orientation switch inputs both did not confirm successful surprise manipulation. Interestingly, in the surprise condition, in 35.3% of the runs the participants indicated surprise but seemed to forget changing the indicated rotation direction with the switch. A Wilcoxon signed rank revealed no effect of magnitude, Z = 1.07, p = 0.284.
Counting Speed
The results on counting speed are shown in Figure 4. The repeated-measures ANOVA revealed a main effect of surprise on counting speed, F(1,22)= 122.42, p < .001, η
2
= 0.85. The post hoc pairwise comparison revealed that less counts were made in the surprise condition, M = 3.02 counts, SD = 1.58, than in the no-surprise condition, M = 4.37 counts, SD = 1.25, t(1,22) = 11.06, r = 0.940, p < 0.001, supporting hypothesis 1. There was no significant effect for motion magnitude to support hypothesis 2, F(1,22) = 1.52, p = 0.231, nor was there a significant interaction between surprise and motion magnitude to support hypothesis 3, F(1,22) = 0.57, p = 0.459. Tukey boxplots of the number of counts in 10 s after the reveal in each condition. High variance within conditions is mainly caused by inter-individual differences, as correlations between conditions is very high (r’s > 0.9, see text).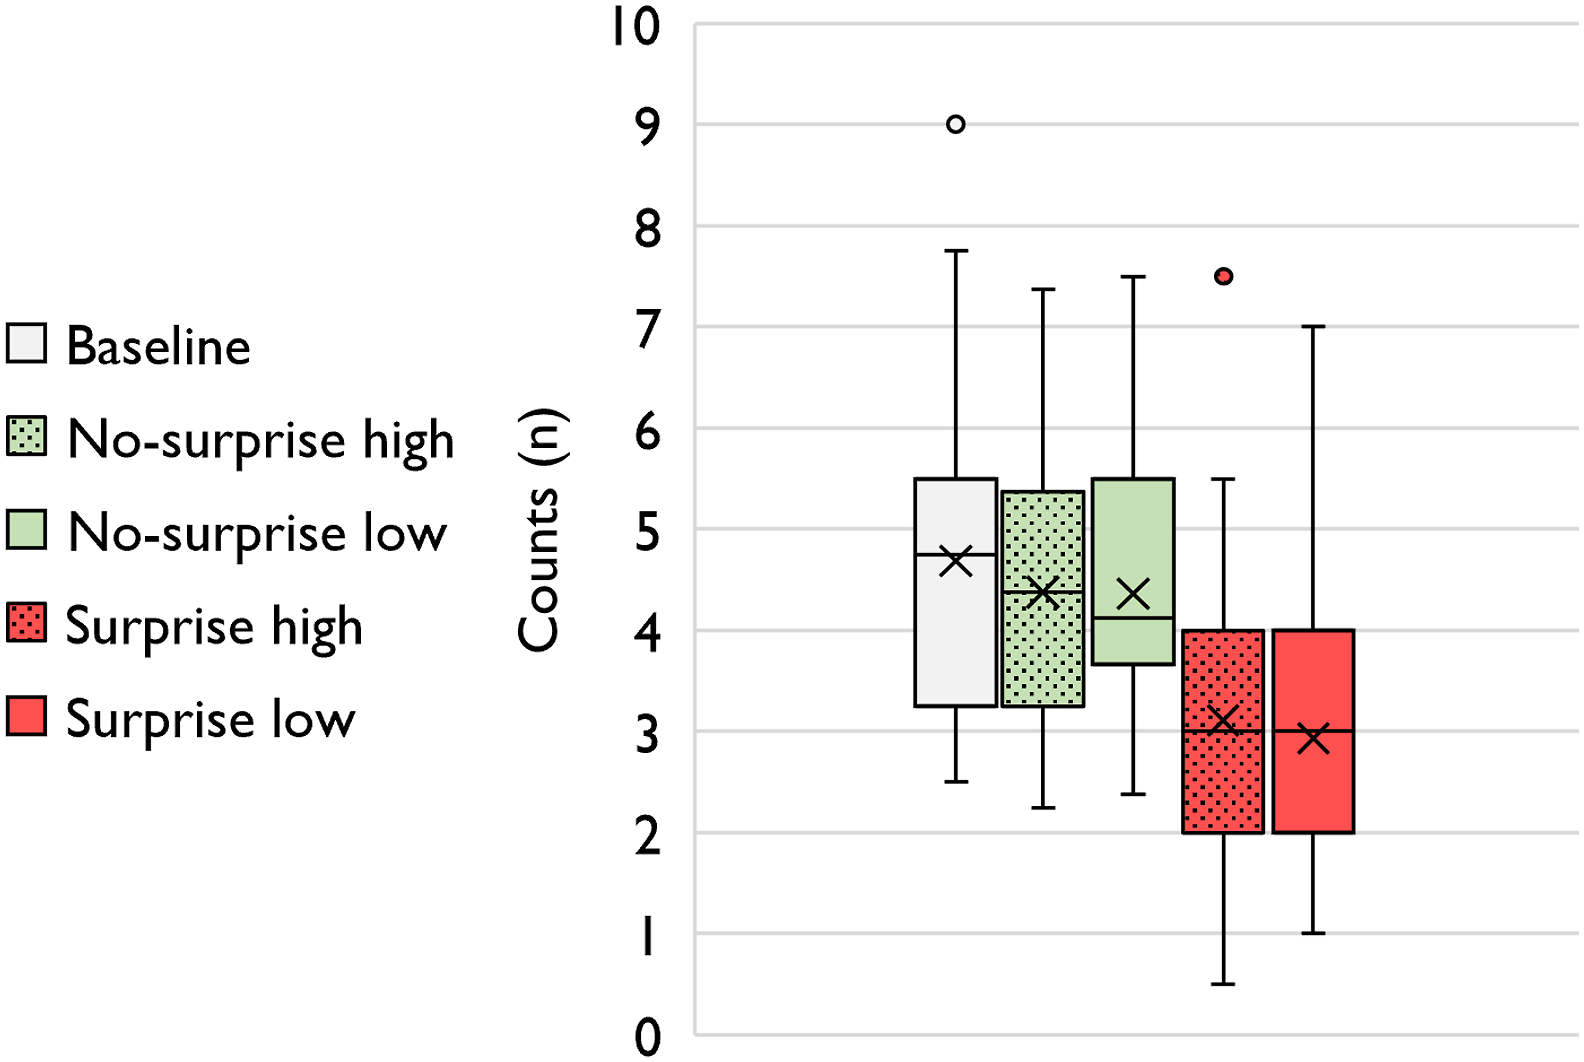
When comparing the surprise condition, no-surprise condition and baseline condition, there was a significant main effect, F(2,21) = 74.79, p < 0.001. Performance was significantly lower in the surprise condition than in baseline, t(1,22) = 10.50, r = 0.889, p < .001, while there was no significant difference between the no-surprise condition and baseline, t(1,22) = 2.14, r = 0.917, p = .086.
Proportion of Errors
The proportions of errors are visualized in Figure 5. The normality assumption for proportion of errors was not met, therefore an ordinal logistic GEE analysis was performed. This revealed a main effect of surprise, and of motion magnitude, which were both overruled by a significant surprise × motion magnitude interaction effect so that only hypothesis 3 was supported, B = 2.07, SE = 0.71, CI = 0.68–3.45, p = .003. The post hoc Wilcoxon signed rank revealed that there were significantly more errors in the surprise condition than in the no-surprise condition if the magnitude was high, Z(1,22) = 2.20, p = 0.028, but not when magnitude was low, Z(1,22) = 1.00, p = .320. Tukey boxplots for the proportion of errors in each condition. The boxplot of the Surprise-low condition shows that all values except for four outliers were zero.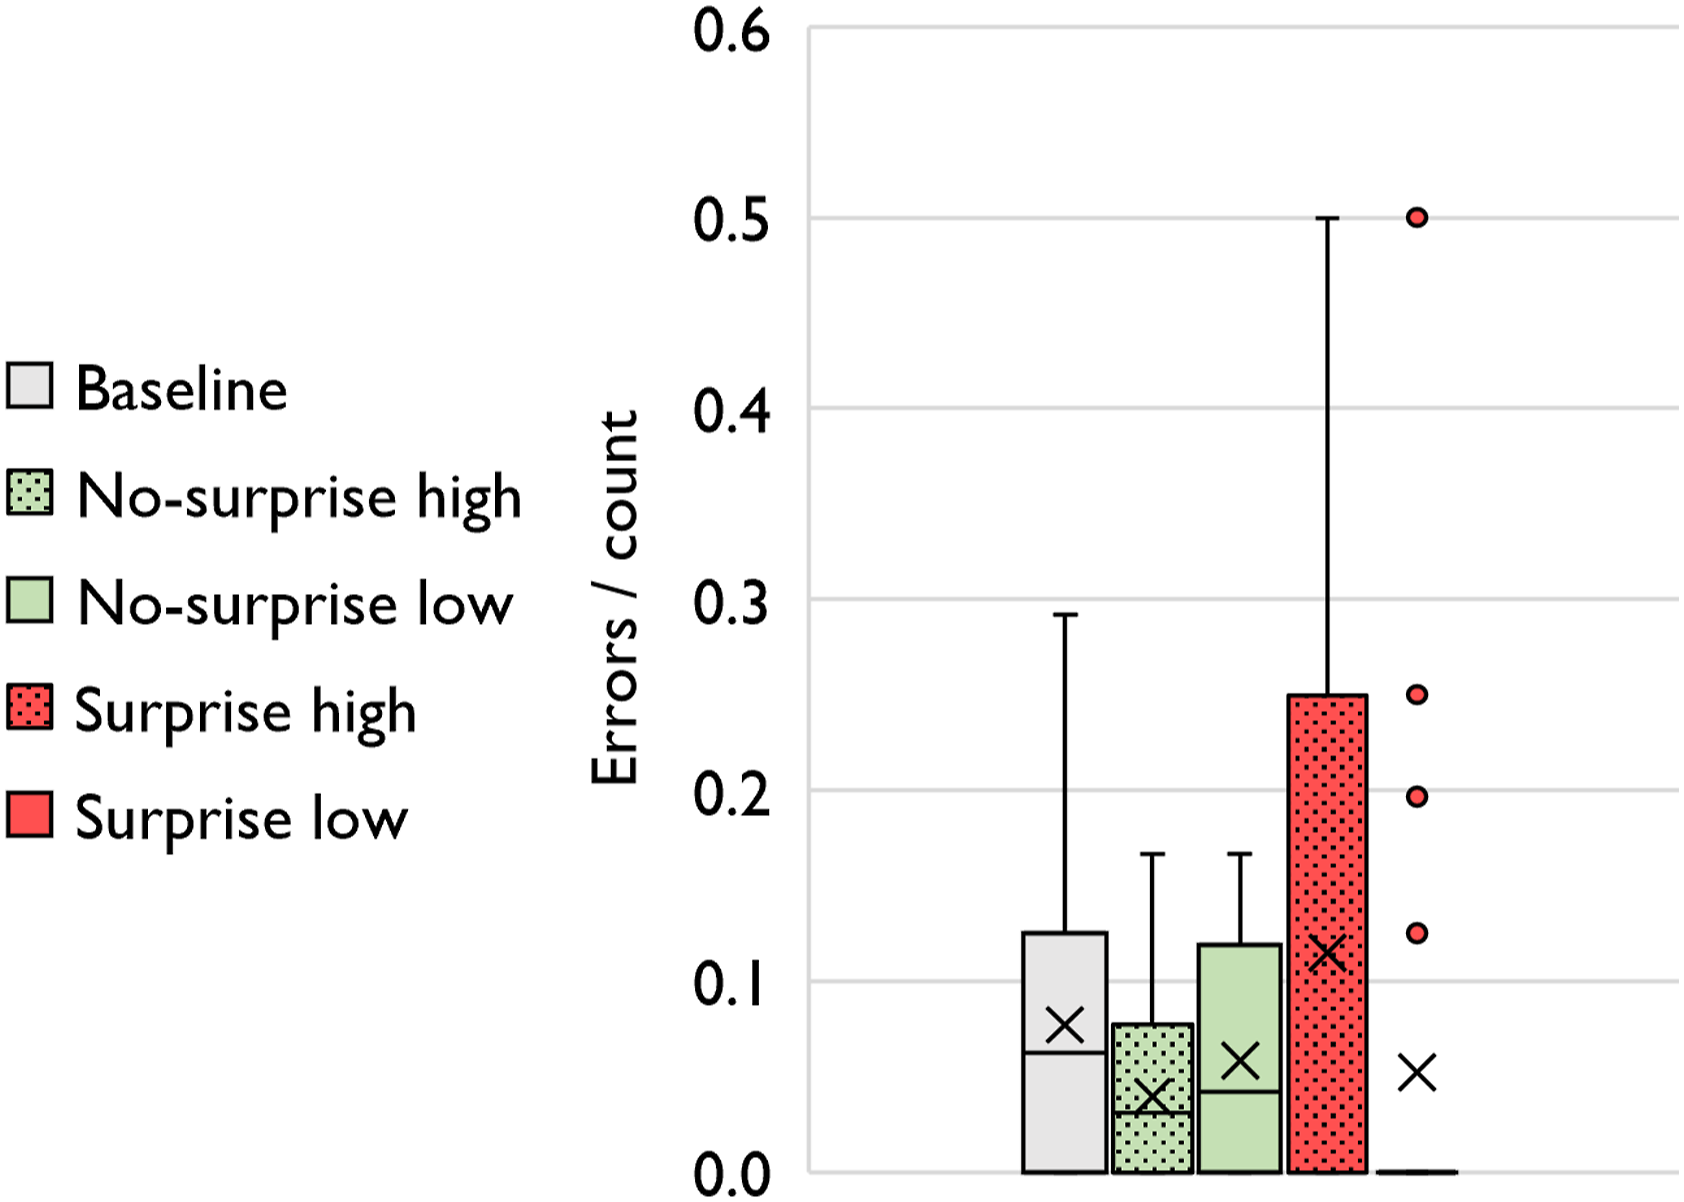
When comparing the surprise condition, no-surprise condition and baseline condition, the Friedman test revealed no significant main effect, x 2 = 0.76, p = 0.685.
Motion Sickness
The participants scored on average near the lowest end on the MISC (range of 0–10), halfway into the experiment, M = 0.8, SD = 1.0, and at the end of the experiment, M = 0.9, SD = 1.2.
Discussion
We found that a mismatch between a vestibular sensation of motion and the visually revealed actual motion had a detrimental effect on the performance of a concurrent cognitive task. The observed effect size for counting speed (i.e., η 2 = 0.85) is well above what is considered large (i.e., 0.14). On average, counting speed was reduced by 31% when participants became aware that they were disoriented as compared to a control condition. Furthermore, not only the counting task was impaired, but participants also had difficulty with remembering to manually indicate the rotation direction when they became aware of SD, as their inputs matched with their verbal indications in only 64.7% of the runs. These outcomes indicate that the realization that one is disoriented (i.e., Type-II SD) draws attentional resources away from a parallel cognitive task, which is in line with the orientation-first principle.
The proportion of errors was not significantly affected by Type-II SD, but there was a significant interaction effect with motion magnitude, suggesting that the surprise caused by a high-magnitude motion cue was more detrimental to cognitive performance than surprise caused by a low-magnitude motion cue. We indeed expected that surprises caused by higher magnitude motions would be experienced as more disturbing, as these would involve a larger mismatch between the perceived and actual motion. However, it could also very well be that errors when the environment was revealed were a delayed effect of distraction related to motion cue magnitude in the dark. The serial-threes subtraction task includes many basic subtractions which can be performed relatively automatically (see, Raghubar et al., 2010). The realization that one is making an error could interrupt this automatic process, and participants were sometimes indeed observed to make several errors in sequence. Why counting speed was not similarly affected by motion magnitude is not clear. Perhaps, the magnitude would need to be higher, or in a different axis, before it is considered alarming enough to significantly impair cognitive performance.
A limitation of the study is that there was an undesired difference in absolute rotation velocity between the surprise and no-surprise condition when the lights were switched on (see Figure 2). This difference was unavoidable because we found it to be impossible to use higher subthreshold rotation rates in our setup. However, if higher velocity of the visual field would decrease performance, then this effect would be in the opposite direction to the findings, making it unlikely to be a confounder. Furthermore, we found no significant difference between the no-surprise condition and a baseline condition without motion, suggesting that the velocity of the visual field itself had very little impact.
Another limitation is that our study only involves rotations around the yaw axis, which may have affected the findings. It remains to be investigated if the effect is present when linear motions, or rotations around different axes are used. In-flight, the most prevalent form of spatial disorientation, “the leans”, is also caused by rotations, but these occur around the roll axis (Pennings et al., 2020). Type-II SD concerning the roll axis could potentially be more disturbing, as this axis is important for postural stability. Besides using one type of motion, the specific modalities we used may have influenced the findings as well. The expectation was created using vestibular cues, and the reveal was achieved with visual cues. To rule out that this mediated the effect, (combinations of) different cues can be used, such as symbolic information (e.g., flight instruments), tactile information or sound.
This leads us to another limitation, which is that the SD in our experiment was easy to resolve in comparison to SD in operational practice. The real motion direction was obvious for participants as soon as the lights were switched on. In contrast, actual SD situations often occur at night when there are limited motion cues, and different information sources may seem to conflict with each other. Therefore, pilots may sometimes have difficulty trusting their instruments. An additional issue in practice is the presence of stress. Stress may seriously impair cognitive functions necessary to make sense of a situation and thus may cause a state of incapacitation known in the domain of aviation as a “startle” (see, Landman et al., 2017). In future research, a more accurate view of the effect of Type-II SD can be obtained by investigating the effect in a more practical setting. Follow-up research may also focus more on the potentially involuntary nature of the effect by instructing participants to ignore vestibular sensations.
In conclusion, the current study addresses a gap in the literature with regards to the impact of SD on cognitive performance by specifically creating conditions with and without Type-II SD, and measuring whether Type-II SD was successfully induced. Our setup of using vestibular illusions of rotation to induce SD are in line with the most prevalent occurring illusions in-flight. We found that our manipulation strongly affected cognitive performance, but we may still underestimate the effect of Type-II SD in practice, as the SD was quickly resolved and the situation was not stressful. The study shows that SD can impact pilot performance without leading to observable control errors. This underlines the importance of analyzing the presence of disorienting stimuli in accident investigations using SD modeling tools (e.g., Mumaw, et al., 2016). The distractive effect of Type-II SD may be a relevant topic to incorporate in pilot SD education. Taking the time to manage the additional workload imposed by SD, stabilizing the situation, falling back to procedures to “sort oneself out” (see e.g., Landman, et al., 2020) could all possibly be useful countermeasures, but their effectiveness in the current context remains to be investigated.
Key points
The current study is the first to specifically investigate the effect of recognized (Type-II) spatial disorientation on cognitive performance while controlling for other factors. Type-II spatial disorientation was found to have a large detrimental effect on ongoing cognitive performance. The results suggest that Type-II spatial disorientation impairs performance of piloting tasks through distraction. This impairment may occur without any observable control errors, underlining the importance to analyze the presence of SD stimuli in accident analyses. The findings indicate a need for interventions to improve flight safety.
Footnotes
Funding
The author(s) disclosed receipt of the following financial support for the research, authorship, and/or publication of this article: This research was funded by the Dutch Ministry of Defense, under Programme: V1917 5thGenStressors.
Dimitris Kalogeras received his MSc degree in Applied Cognitive Psychology at Utrecht University, The Netherlands in 2021.
Annemarie Landman received her MSc in Human Movement Sciences from the VU University Amsterdam in 2011, and her PhD at the faculty of Aerospace Engineering at the TU Delft in 2019. She is currently working as a Medior Scientist in the Human Performance group at TNO.
Eric L. Groen earned his PhD in Biology in 1997 from Utrecht University. He is currently working as a Senior Scientist in the Human Performance Group at TNO and an Assistant Professor at Cranfield University.
Mark Houben earned his MSc degree and PhD in Biomedical Engineering at the Eindhoven University of Technology in 1997 and 2002, respectively. He is currently working as a Senior Scientist in the Human Performance Group at TNO.