
Abstract
Objective
A driving simulator study was conducted to test the effect of directions pavement markings (DPMs) on drivers’ performance.
Background
The perception of traditional direction signs may be less efficient than that of DPMs because drivers allocate more attentional resources to the road than to any other location.
Method
Two experimental conditions of DPMs were tested: (a) the name of the lane’s destination town, inscribed in white letters; (b) red and white shields enclosing the name of the lane’s destination town. In both conditions, the name or shield was preceded by a white arrow and traditional road signs were presented as well. The experimental conditions were compared to a baseline condition, which consisted of traditional road signs only. Various scenarios of three-lane highways were simulated and the number of vehicles on the road was manipulated, forming a 2 × 3 design (two load conditions × three experimental conditions). Twenty-two participants took part in the experiment.
Results
Pavement markings in both configurations were highly beneficial. Compared with the baseline condition, in both experimental conditions, the drivers noticed the correct lane sooner and moved to the correct lane earlier. Results also suggested that white markings are more beneficial than shield markings; however, this finding should be further confirmed.
Conclusion
Lane DPMS are desirable as they are likely to improve traffic safety at relatively low cost.
Application
Regulations demanding the presence of DPMs, at the very least in low visibility decision sites, would increase traffic safety.
Keywords
INTRODUCTION
The current study claims that pavement markings designating important information, specifically regarding the lane direction, increase drivers’ perception, prevent unnecessary lane shifts, and improve traffic safety. Presenting important information via pavement markings consisting of written words or symbols may be very effective, on some occasions more than using traditional traffic signs solely. Since traditional signs are usually located on the side of the road (side signs) or above the road (overhead signs), they may be easily overlooked, as these locations are less attended while driving. Naturally, drivers allocate a vast amount of resources to the road, while only a small portion of resources is allocated to the sides or to the upper field of vision. Harbluk et al. (2007) found that drivers spent only three percent of the driving time looking at the sides of the road. Others found that many drivers failed to perceive specific road signs, and some signs were totally overlooked by all drivers (Ghasemi et al., 2020; Shoman et al., 2018). These findings confirm previous results that have been reported time and again, whereby drivers detect only a small portion of road signs (Costa et al., 2014; Milošević & Gajić, 1986; Shinar & Drory, 1983).
Kadar et al. (2011) found that most of the time drivers gaze at a distant point ahead, while aiming sporadic glances at the sides of the road only from time to time. When the vehicle speed increased from 30 to 110 kph, the point toward which the driver was normally looking became farther and the likelihood of the glances to the sides substantially decreased. Such findings suggest that all types of traditional road signs are harder to perceive at higher speeds. It can be assumed that side signs may be totally ignored at higher speeds. In addition, it can be assumed that the probability of missing overhead signs is increased as well because drivers’ attention is directed at a more distant point ahead, which may suggest that the ideal angle for perceiving these signs may occur when the sign is too far away to be read. This argument may explain the results of a study on overhead signs, in which participants made many unnecessary lane changes, changed to the correct lane at the last moment, or even missed the correct exit altogether (Upchurch et al., 2005). Likewise, the current study is focused on high speed driving in highway scenarios.
The most common usage of pavement markings, to designate the dividing line between lanes or road edge lines, have important known implications for road safety (Bektas et al., 2016; Donnell et al., 2009; Park et al., 2017). Arrow pavement markings defining the direction of each lane at decision sites are also prevalent, and shown to have a critical positive effect on traffic safety. Chrysler and Schrock (2005) reported a 90% reduction of wrong-way movements after such arrows were added at a freeway exit. Another study found a positive effect on road safety of arrow markings at roundabouts (Chong & Al-Mamari, 2020). Pour-Rouholamin et al. (2015) concluded that careful and accurate pavement markings in general, and particularly at problematic locations, can reduce the probability of collisions linked to inappropriate lane selection.
In many countries, pavement markings that provide information, aside from lane markings, edge markings, and arrows, are prevalent. The marked information may consist of safety or transportation instructions, for example, the words “Stop” designating a stop line or “Bus” designating a bus lane. Using pavement markings to designate information regarding route numbers or towns that can be reached via each lane (henceforth “direction pavement markings,”
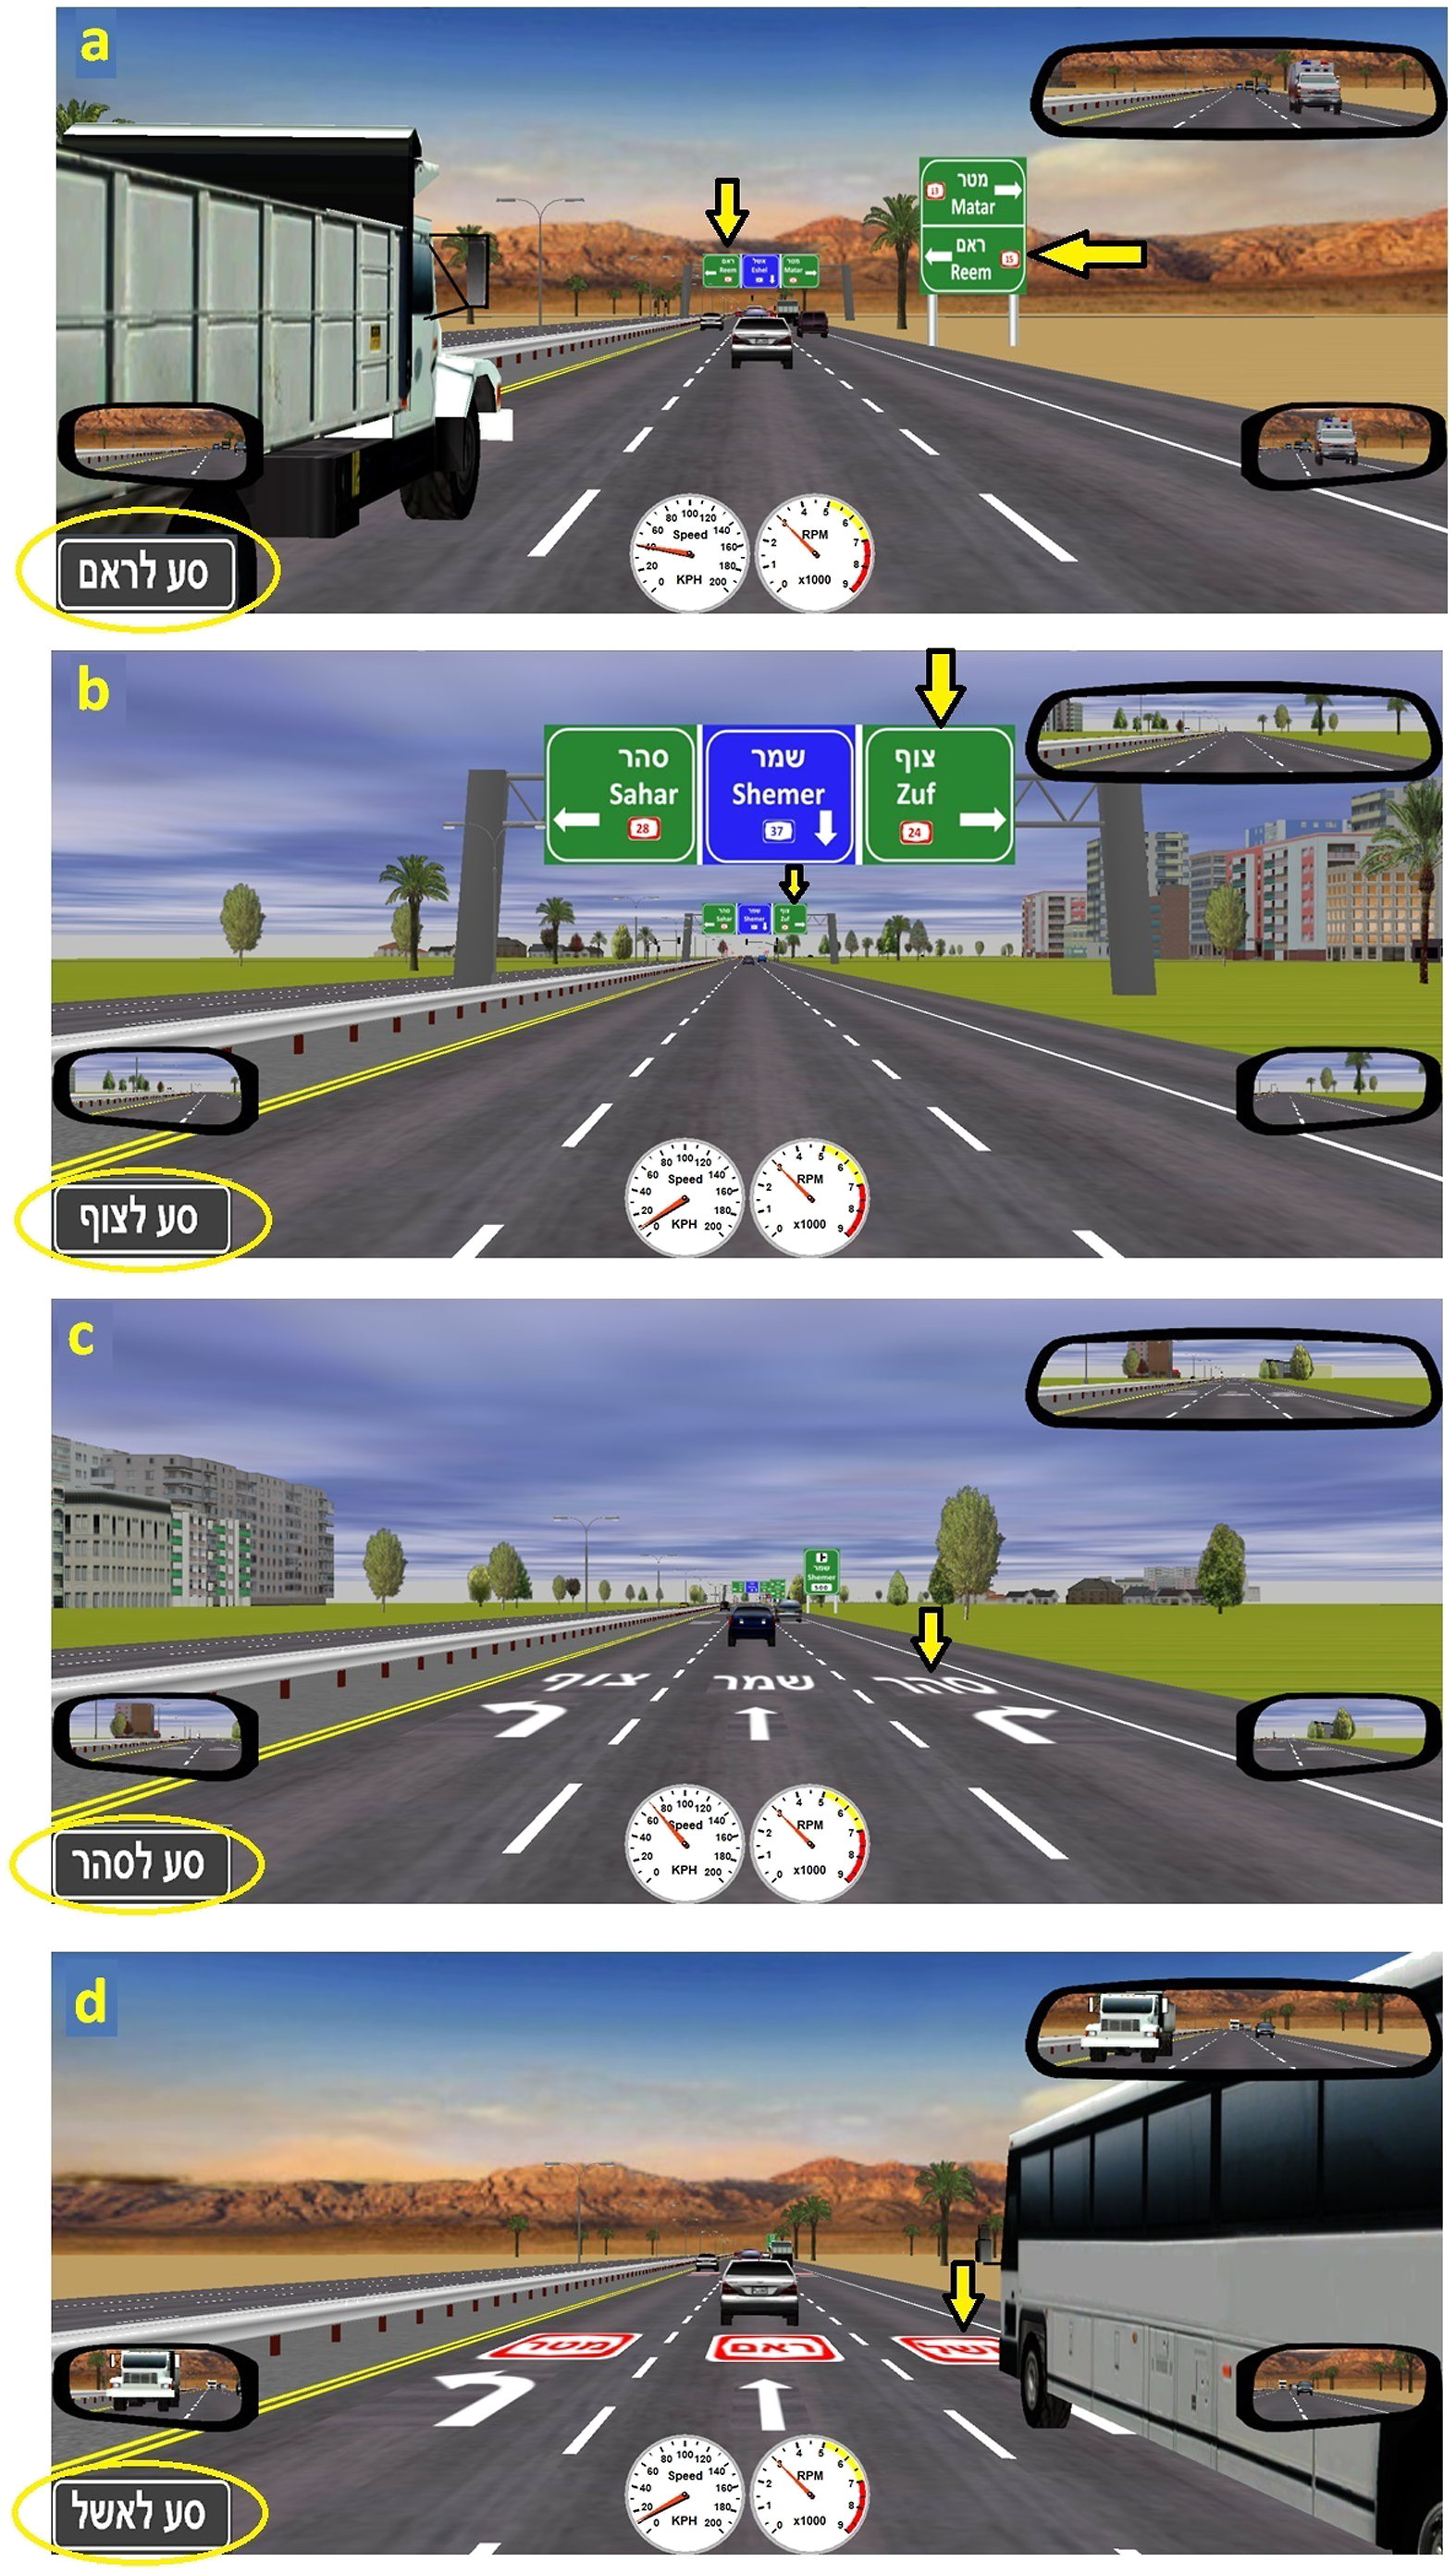
The current driving simulator study explored whether adding DPMs would facilitate notice and choice of the correct lane (in other words, channel the driver to the correct lane). Three different conditions were tested: Different types of decision sites: (a) four-way intersection along a highway with three lanes in each direction; and (b) four-way intersection after a tunnel along a highway with two lanes in each direction. The yellow ellipses around the destination instructions and the yellow arrow near the correct lane in the signs were added here for Non-Hebrew readers. Experimental conditions examples. (a) Baseline condition: first sign at the right side, overhead sign as a second sign, high road load; (b) Baseline condition: two overhead signs, low road load; (c) White markings condition, low road load; and (d) Shield markings condition, high road load. The yellow ellipses around the destination instructions and the yellow arrow near the correct lane in the signs or pavement markings were added here for Non-Hebrew readers.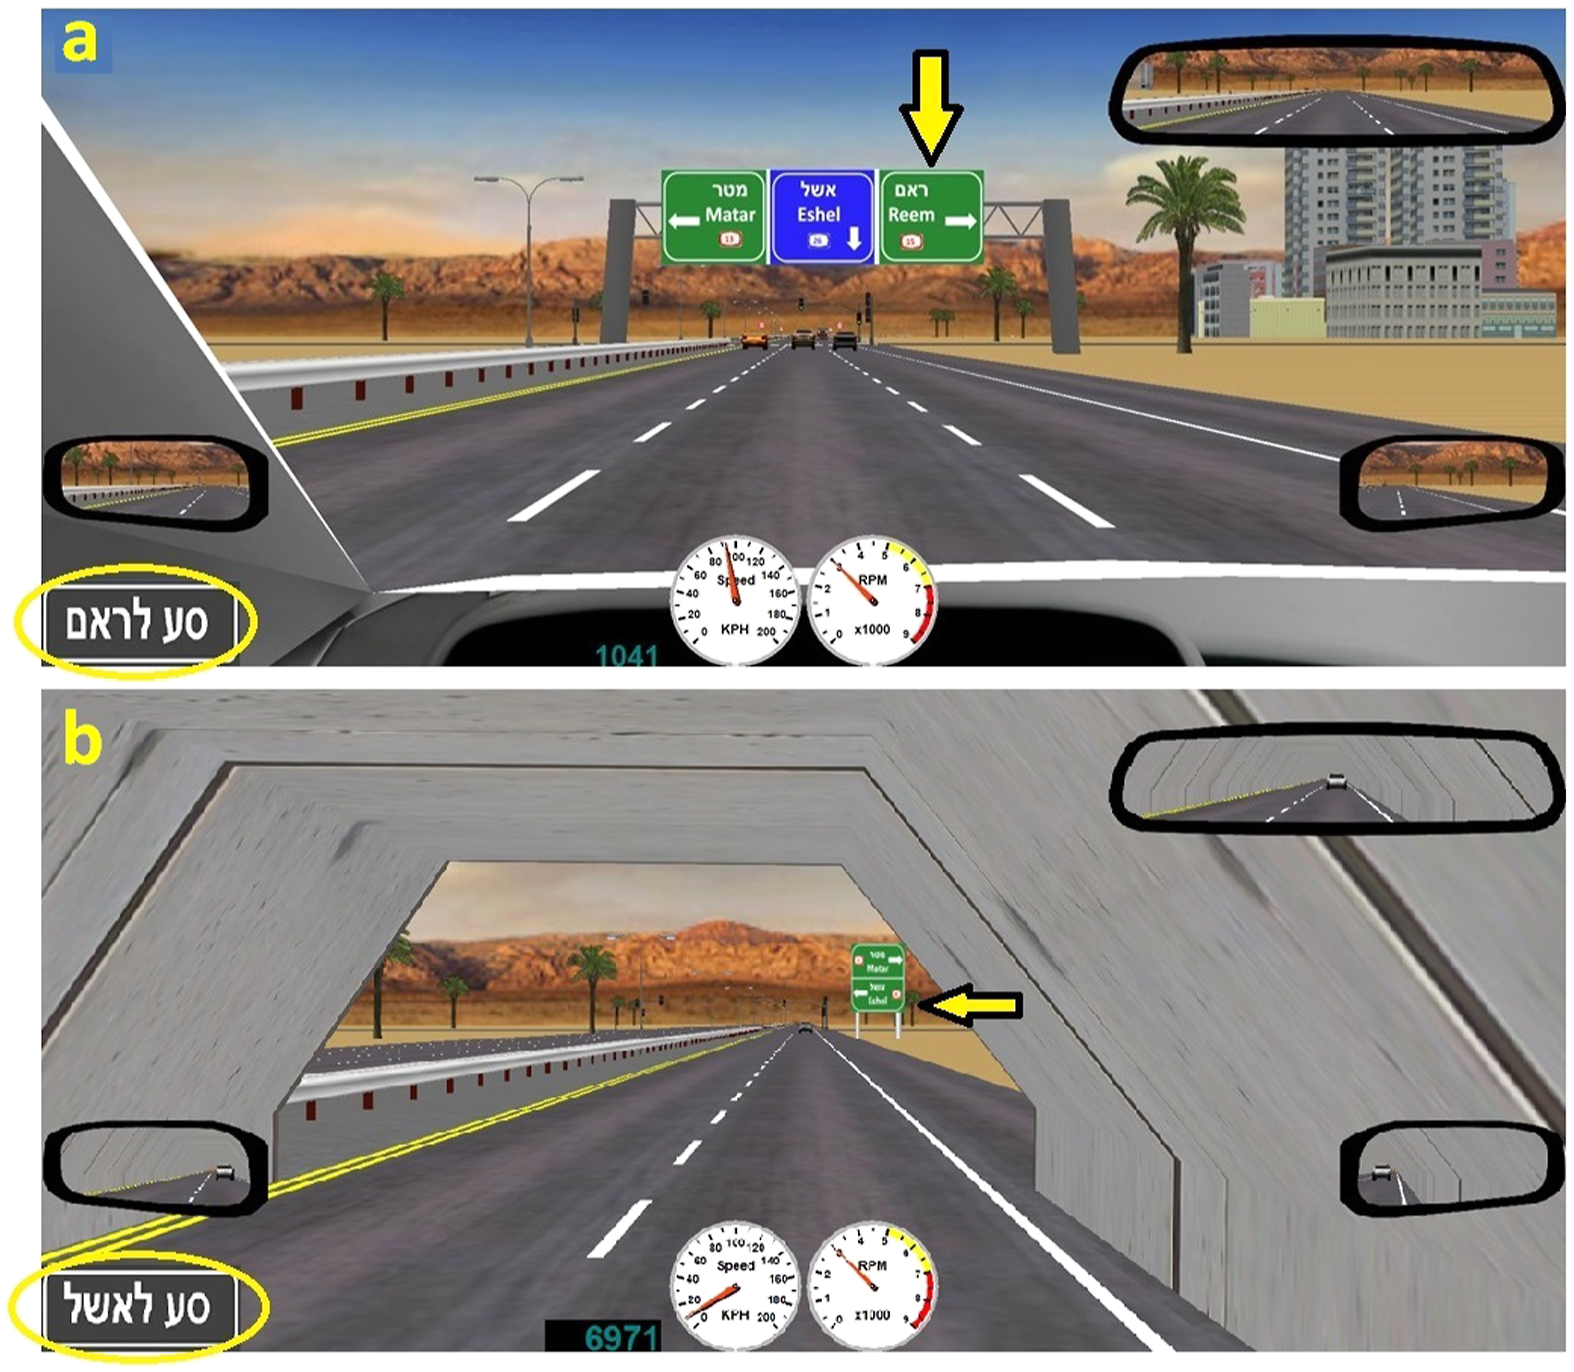
Both DPMs conditions were assumed to result in better safety measurements than the baseline condition. This hypothesis is based on the fact that the location of these DPMs (on the road) is more attentive then the locations of the traditional signs, and on their repetition along 1 km, before each turn. In addition, in line with former studies (Babić & Brijs, 2021; Ullman et al., 2010), it was assumed that the shield condition would be more effective than the white condition. Finally, a specific assumption was derived for intersections that appeared immediately after a tunnel. Due to the restricted visibility inside a tunnel, it was assumed that in these areas the benefit of both DPMs' conditions would be even greater.
METHOD
Participants
Twenty-two participants (12 women), all students at the University of Haifa, took part in the experiment in return for a monetary reward. The mean age of the participants was 28.2 years (ranging from 22 to 38, SD = 4.06). All the participants had normal or corrected-to-normal vision and driving experience of at least 5 years (mean of 9.9, SD = 3.6). All but two reported that they drive on regular basis. This research complied with the APA Code of Ethics and was approved by the Ethics Committee of the University of Haifa.
Tools
The study took place in a driving simulator using STISIM Drive® software on a PC computer. A Logitech steering system, which included a steering wheel and gas and brake pedals, was used. The participants sat on a stationary office chair, 2.5 m in front of a wide screen (2.3 × 3 m) subtending 62° of visual angle. A speaker (Studiophile BX5a Deluxe) providing background sounds was placed behind them.
Driving Scenarios and Task
The name of the travel destination was presented in Hebrew throughout the entire scenario, in the lower left-hand corner (Figures 1 and 2), phrased as follows: “drive to ‘name of town’”. The participants’ main task was to drive to the specified destination while indicating, for each decision site in the scenario, the first time they observed a direction instruction designating the correct lane leading to their current target. To indicate the correct lane observed, they were asked to press one of six buttons located on the steering wheel (any one of three right buttons, to designate the right lane, and any one of the three left buttons, to designate the left lane). In addition, the participants were asked to move the vehicle to the correct lane (either by shifting lanes or by staying in the current lane if it was already the correct one) in order to prepare for the upcoming turn. Due to technical limitations of the software, the participants were asked not to actually perform the turns themselves. Instead they were ordered to continue straight ahead and look for the next direction instructions. Note that the measurements were detection time and distance of the direction instructions, as well as the time and distance of positioning the vehicle in the correct lane, and not the actual turning maneuvers. Therefore, the influence of this technical limitation on the current data is negligible.
Each of the six experimental scenarios was simulated in two different versions with regard to the vehicles load on the road. In the low road load condition, only three to four vehicles (on average) were presented at once in the vicinity of the driver in the driver’s headway lanes (i.e., in the driver sight ahead as well as in the mirrors; see Figures 1, 2b and c). In contrast, in the high road load condition this number was much larger, 10 to 15 vehicles (on average, Figure 2a and d). These vehicles were evenly divided between the three lanes. This experimental design resulted in 12 different combinations of scenario×road load.
In the
The combination of six different scenarios, two road load conditions, and three types of conditions, yielded 36 different versions of the scenarios. This amount was necessary to prevent learning and familiarity effects, since each driver could drive to a specific destination in a specific condition only once. Finally, two similar practice scenarios with different town names, both including traditional road signs only, one with low road load and the other with high road load, were also developed.
Procedure
The participants took part in one session, which took about an hour and a half. After listening to the experimenter read aloud the instructions of the experiment, they drove in two practice scenarios. During the practice session, the experimenter verified that the participants pressed a button at the first time they encountered information regarding the directions and that they moved the vehicle to the correct lane, as instructed. Then, the participants drove in six scenarios of the baseline condition and were asked to take a ten-minute break before driving in twelve more scenarios of the experimental blocks. To control for fatigue or practice effects, the order of these two experimental blocks was counterbalanced between participants. Counterbalancing was also employed in the order of the scenarios within each block, ensuring that different participants would drive the scenarios in different order, and that low and high road load scenarios would be presented in alternate order.
DATA PROCESSING AND ANALYSES
Turns at intersections with traffic lights along the highway and turns at traffic lights that appeared after a tunnel were analyzed separately. The data for each combination of road load×experimental condition of each participant included twelve traffic lights along the highway and three traffic lights that appeared after a tunnel. The analyses averaged the responses of each participant to each of these two different decision sites.
Two measurements were analyzed for all cases: (1) Mean distance (m) between the location in which the driver pressed a correct button on the wheel and the turn itself (henceforth “
Descriptive Data: Means, SDs, Minimum and Maximum Values of the Different Experimental Conditions × Road Load Combinations of all Four Measurements at Intersections with Traffic Lights Along the Highway
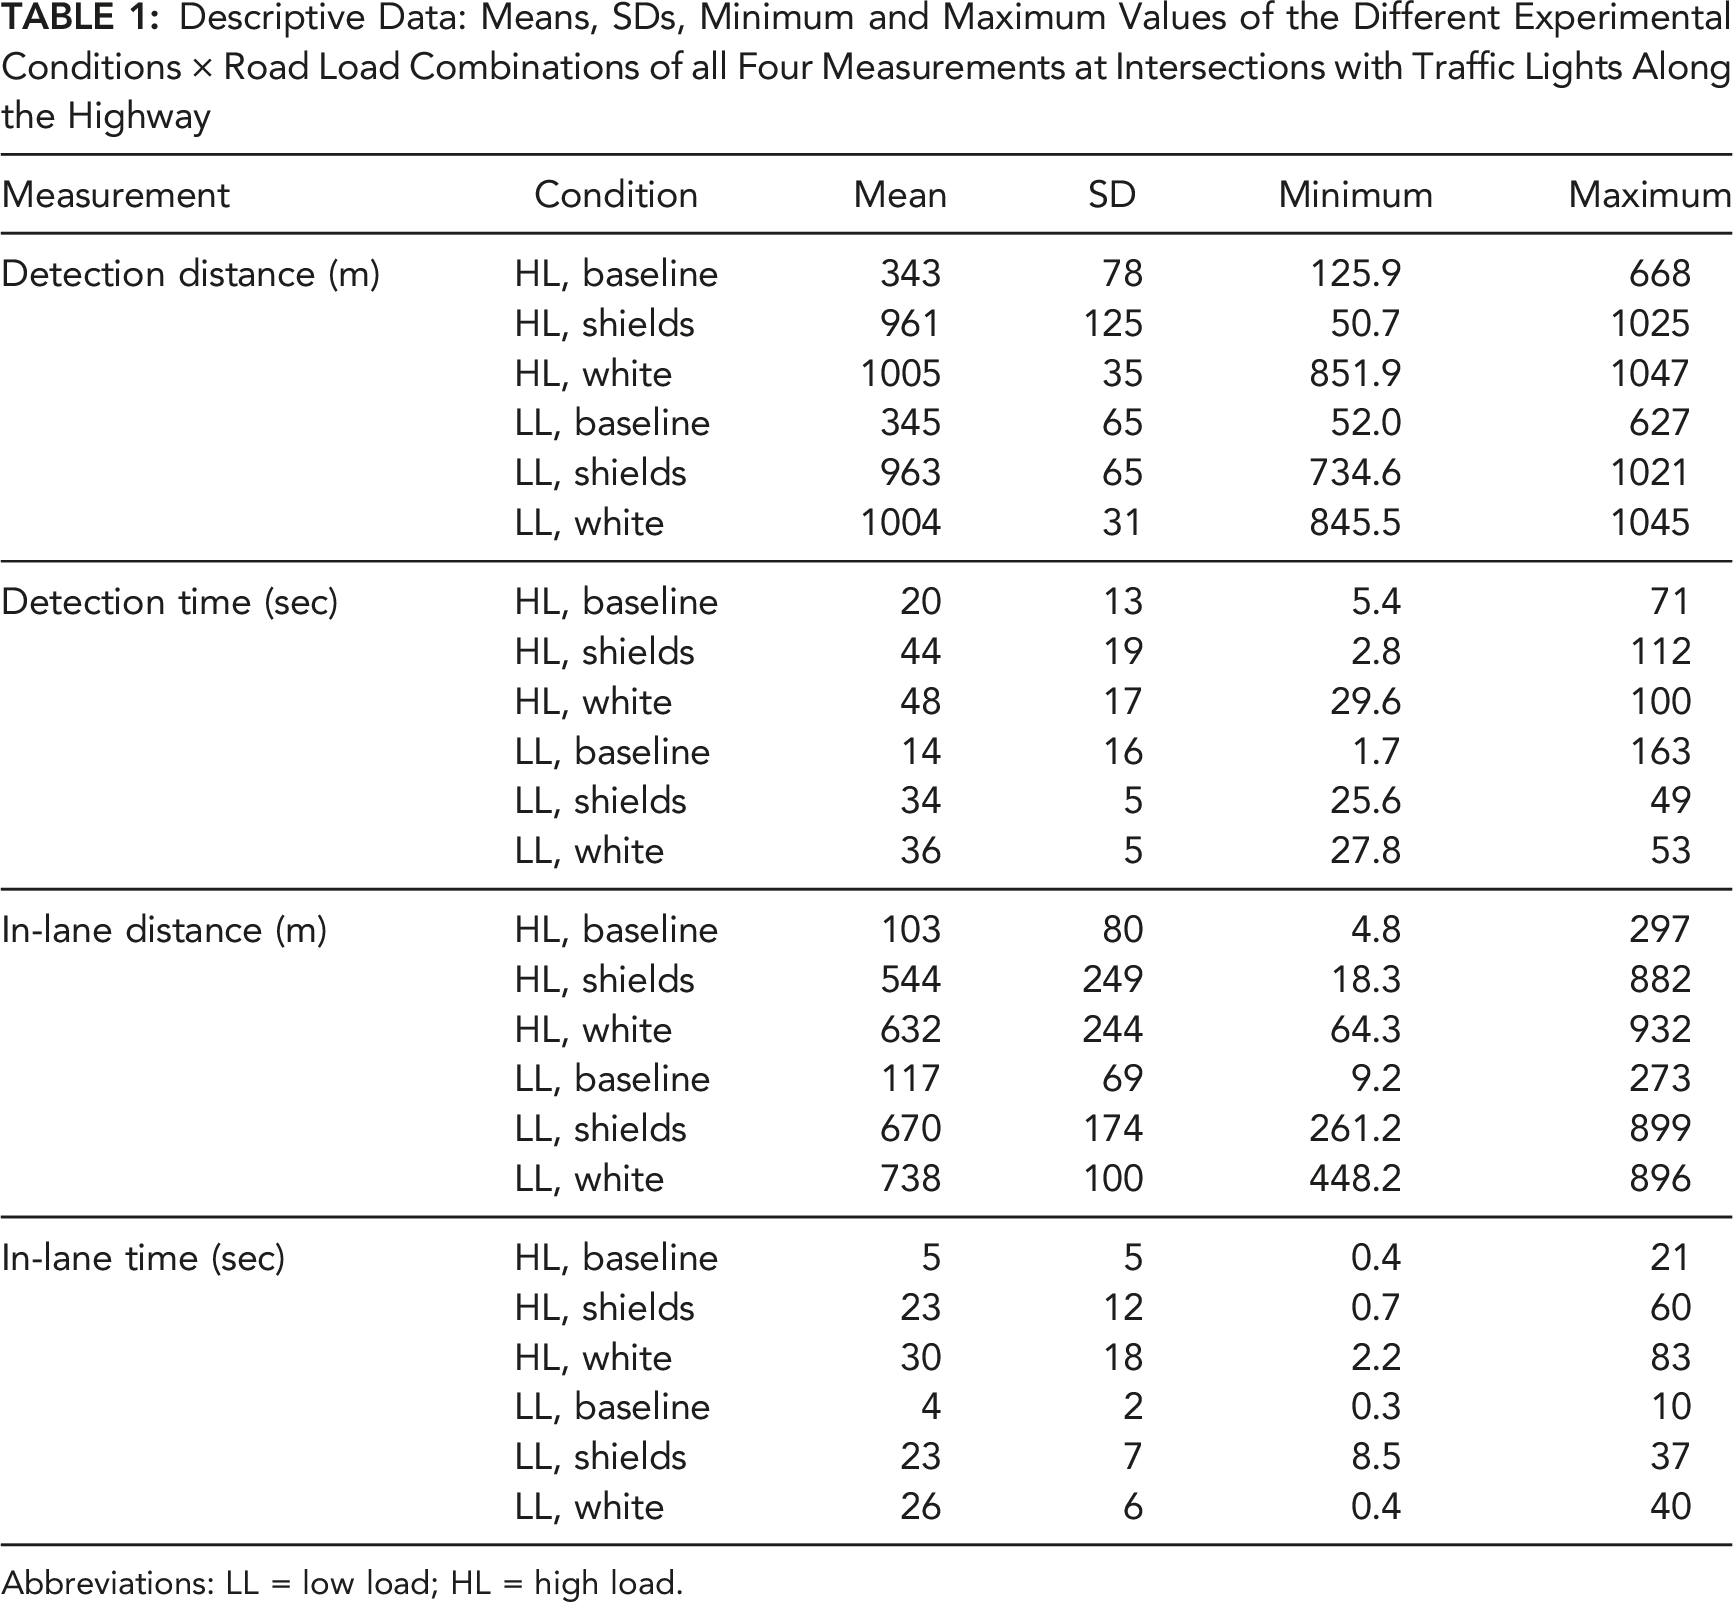
Abbreviations: LL = low load; HL = high load.
Descriptive Data: Means, SDs, Minimum and Maximum Values of the Different Experimental Conditions × Road Load Combinations of Detection Distance and Time Measurements at Intersections After Tunnel
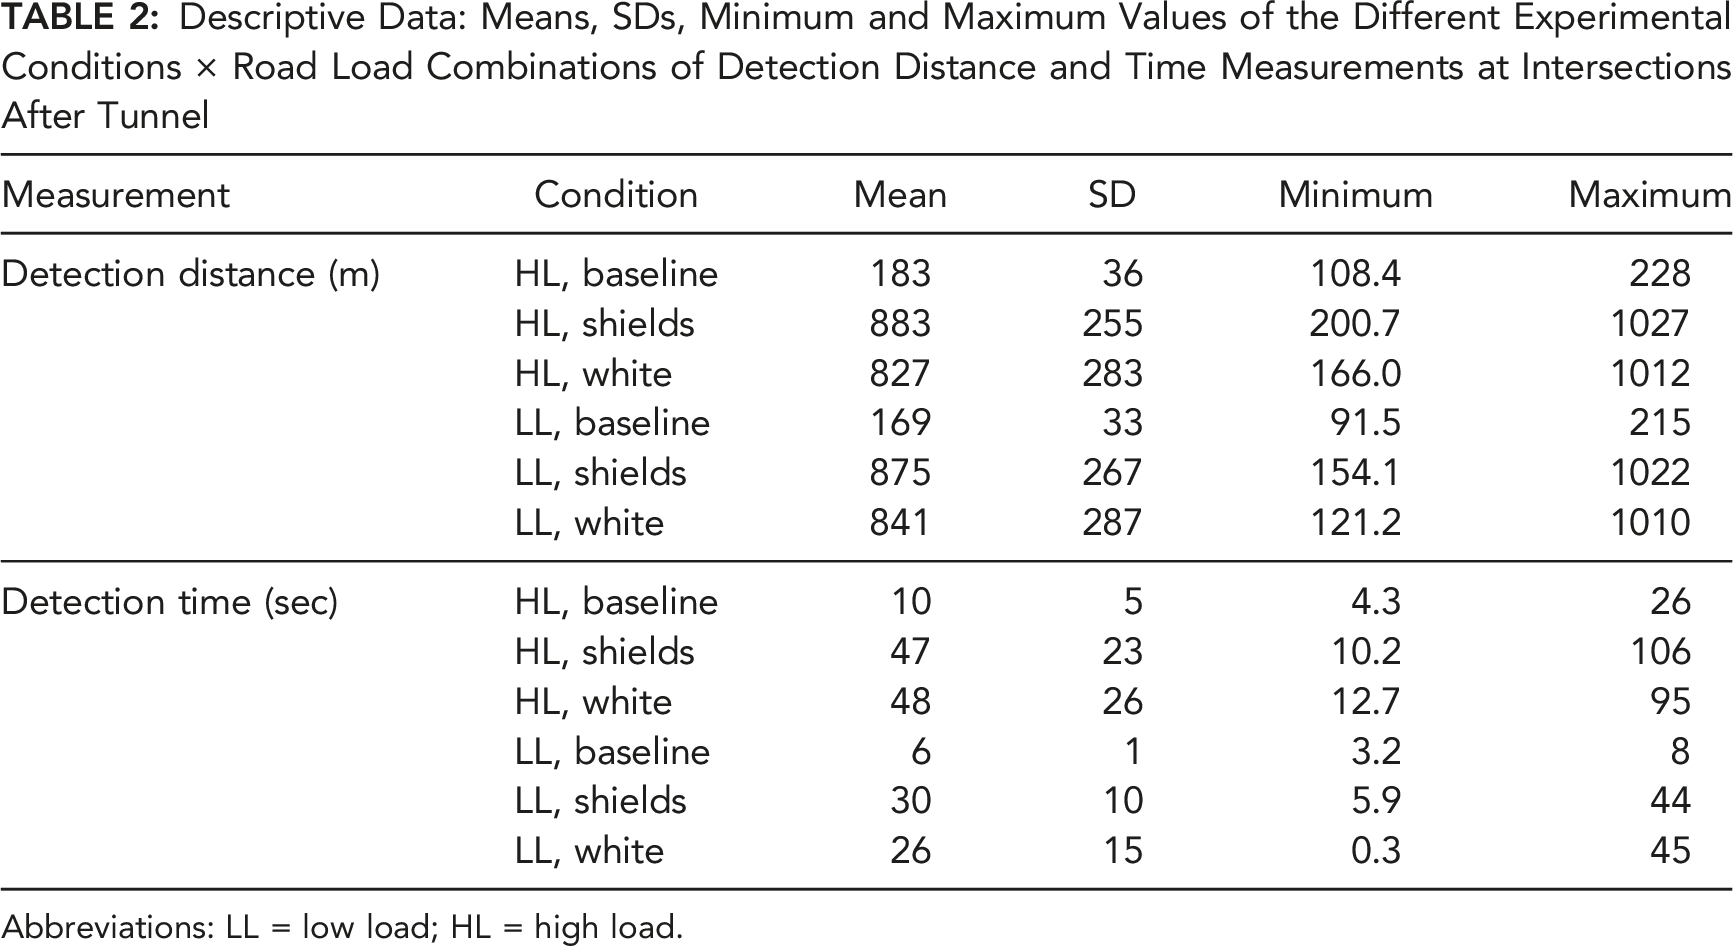
Abbreviations: LL = low load; HL = high load.
To overcome the missing data issue and further test the effect of the experimental condition on shifting to the correct lane, two-way GLMs tested the mean minimum values of in-lane measurements, for all sites together. Note that minimum value is a measure of the most extreme case, pertaining to the lowest distance or time of moving to the correct lane.
RESULTS
Intersections Along the Highway
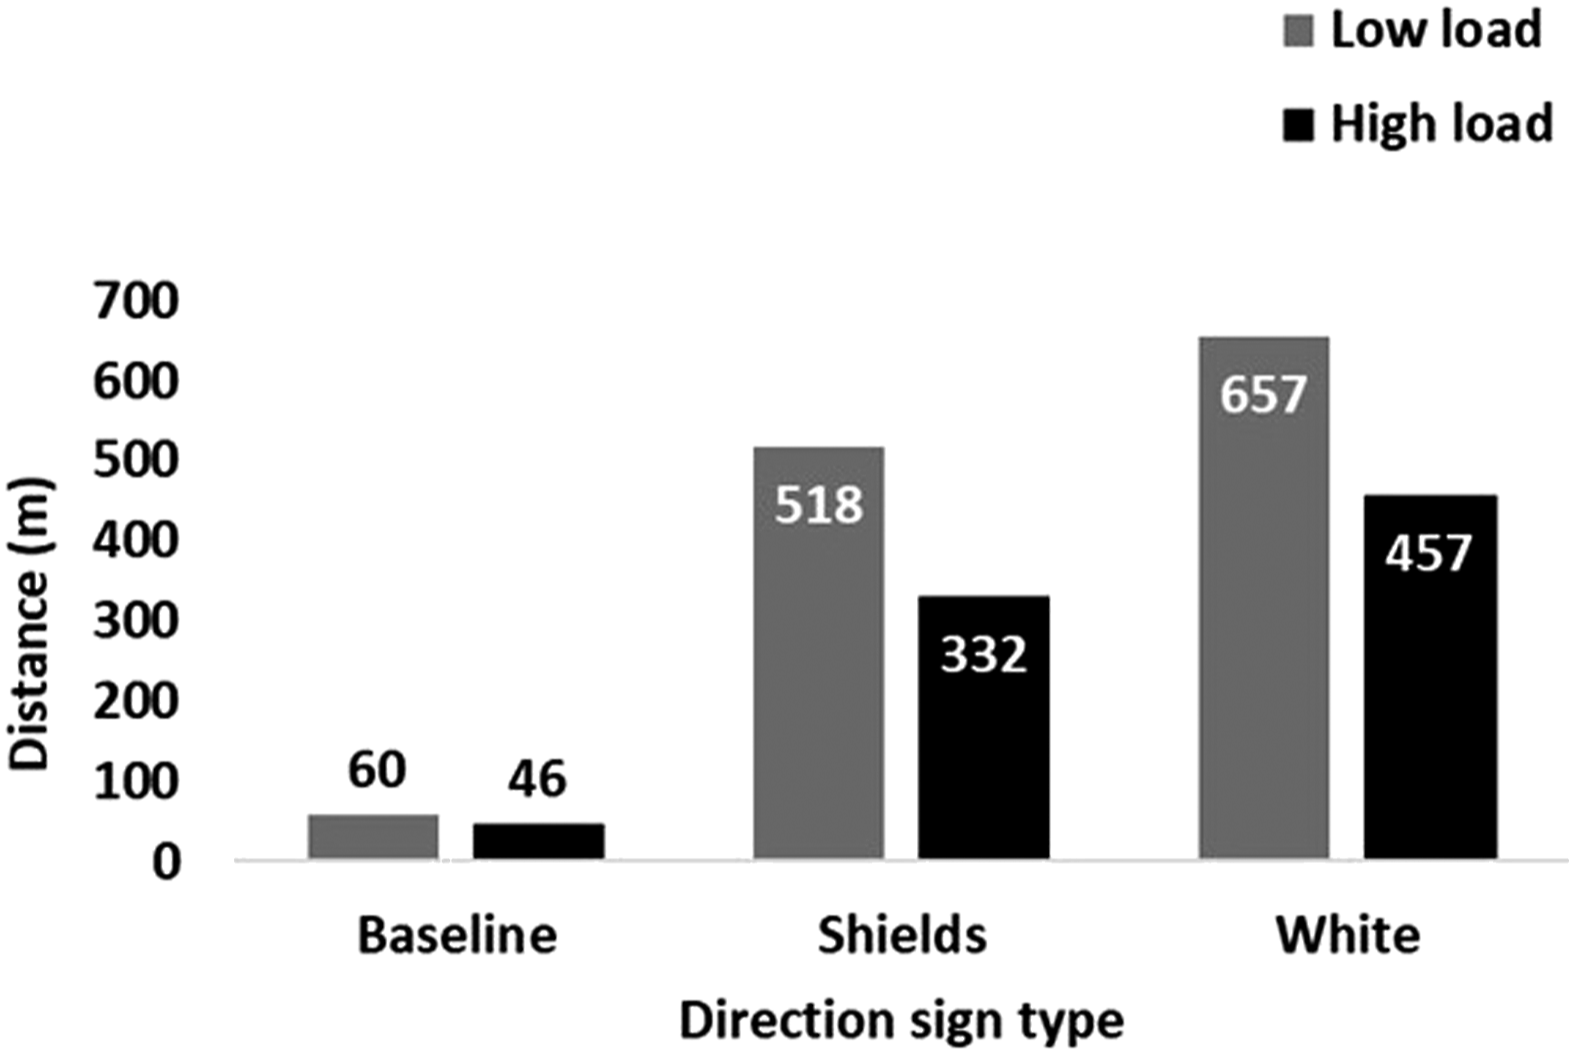
Averaged mean of (a) detection distance (m); (b) detection time (sec); (c) in-lane distance (m); and d. in-lane time (sec) as a function of experimental condition at intersections along the highway. *—significant effect of the simple pairwise comparisons at p < 0.005.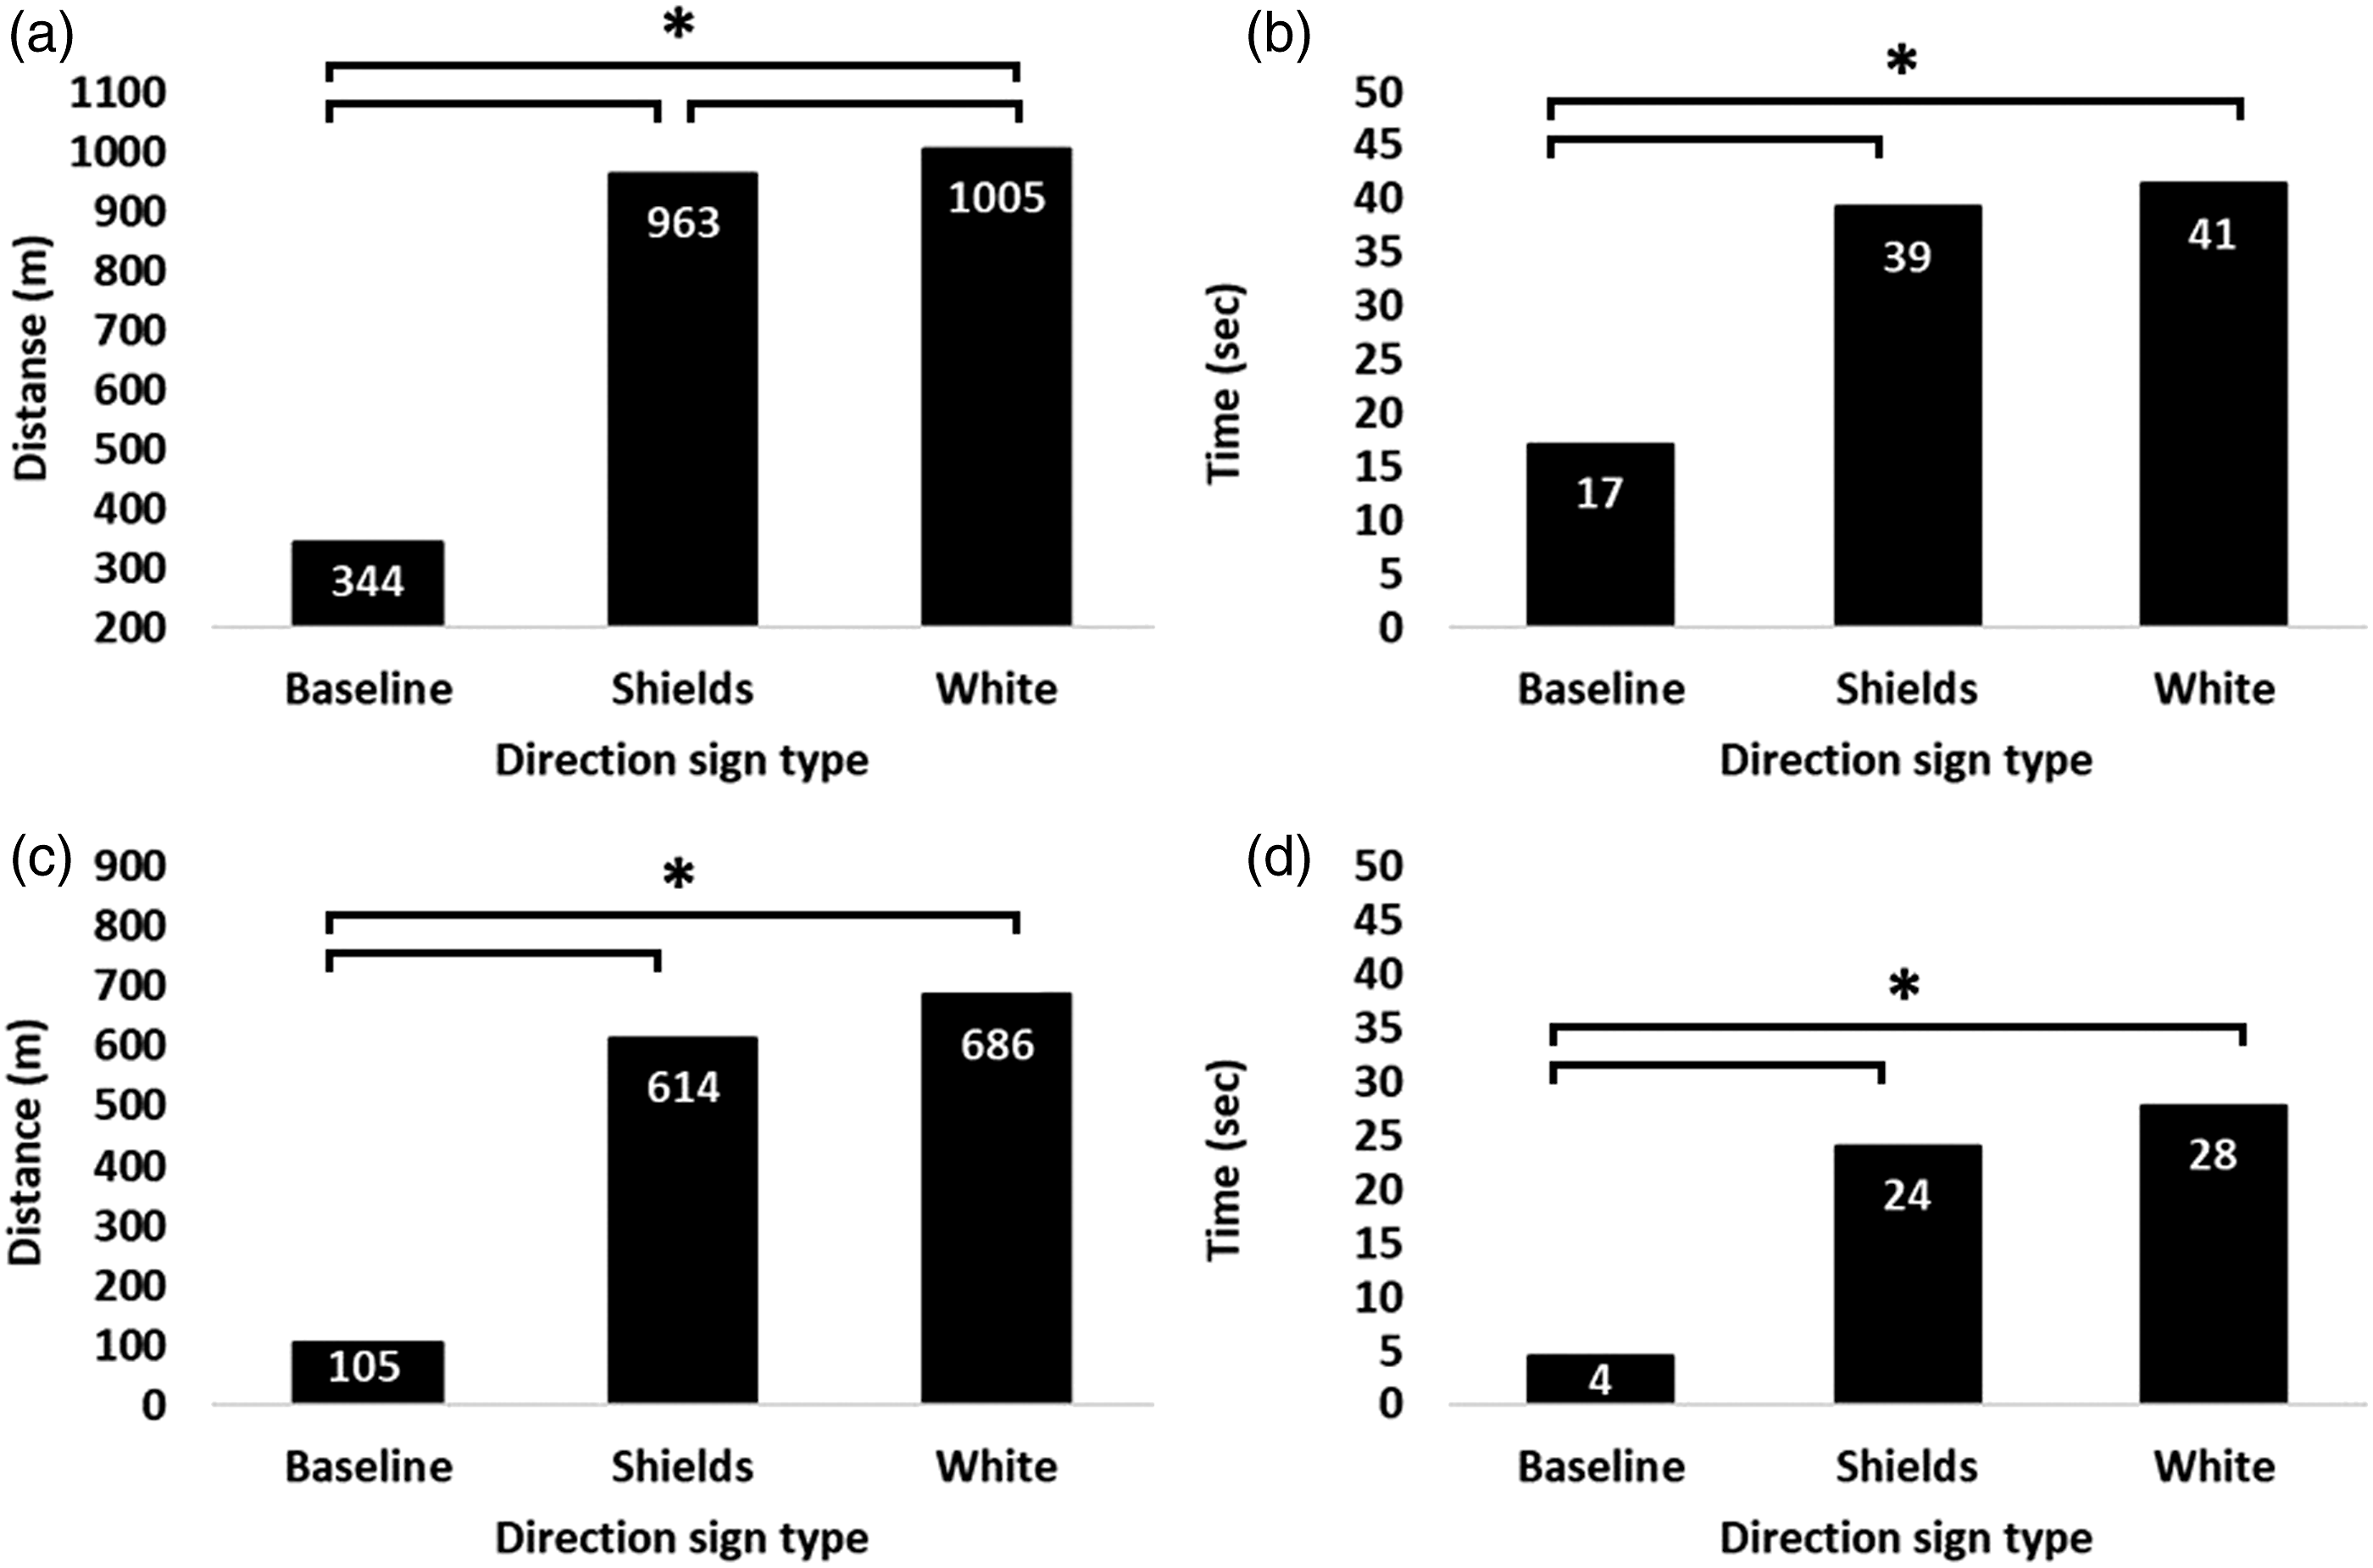
Intersections After Tunnel
Averaged mean of (a) detection distance (m); (b) detection time (sec) as a function of the experimental condition at intersections after a tunnel. *—significant effect of the simple pairwise comparisons at p < 0.05.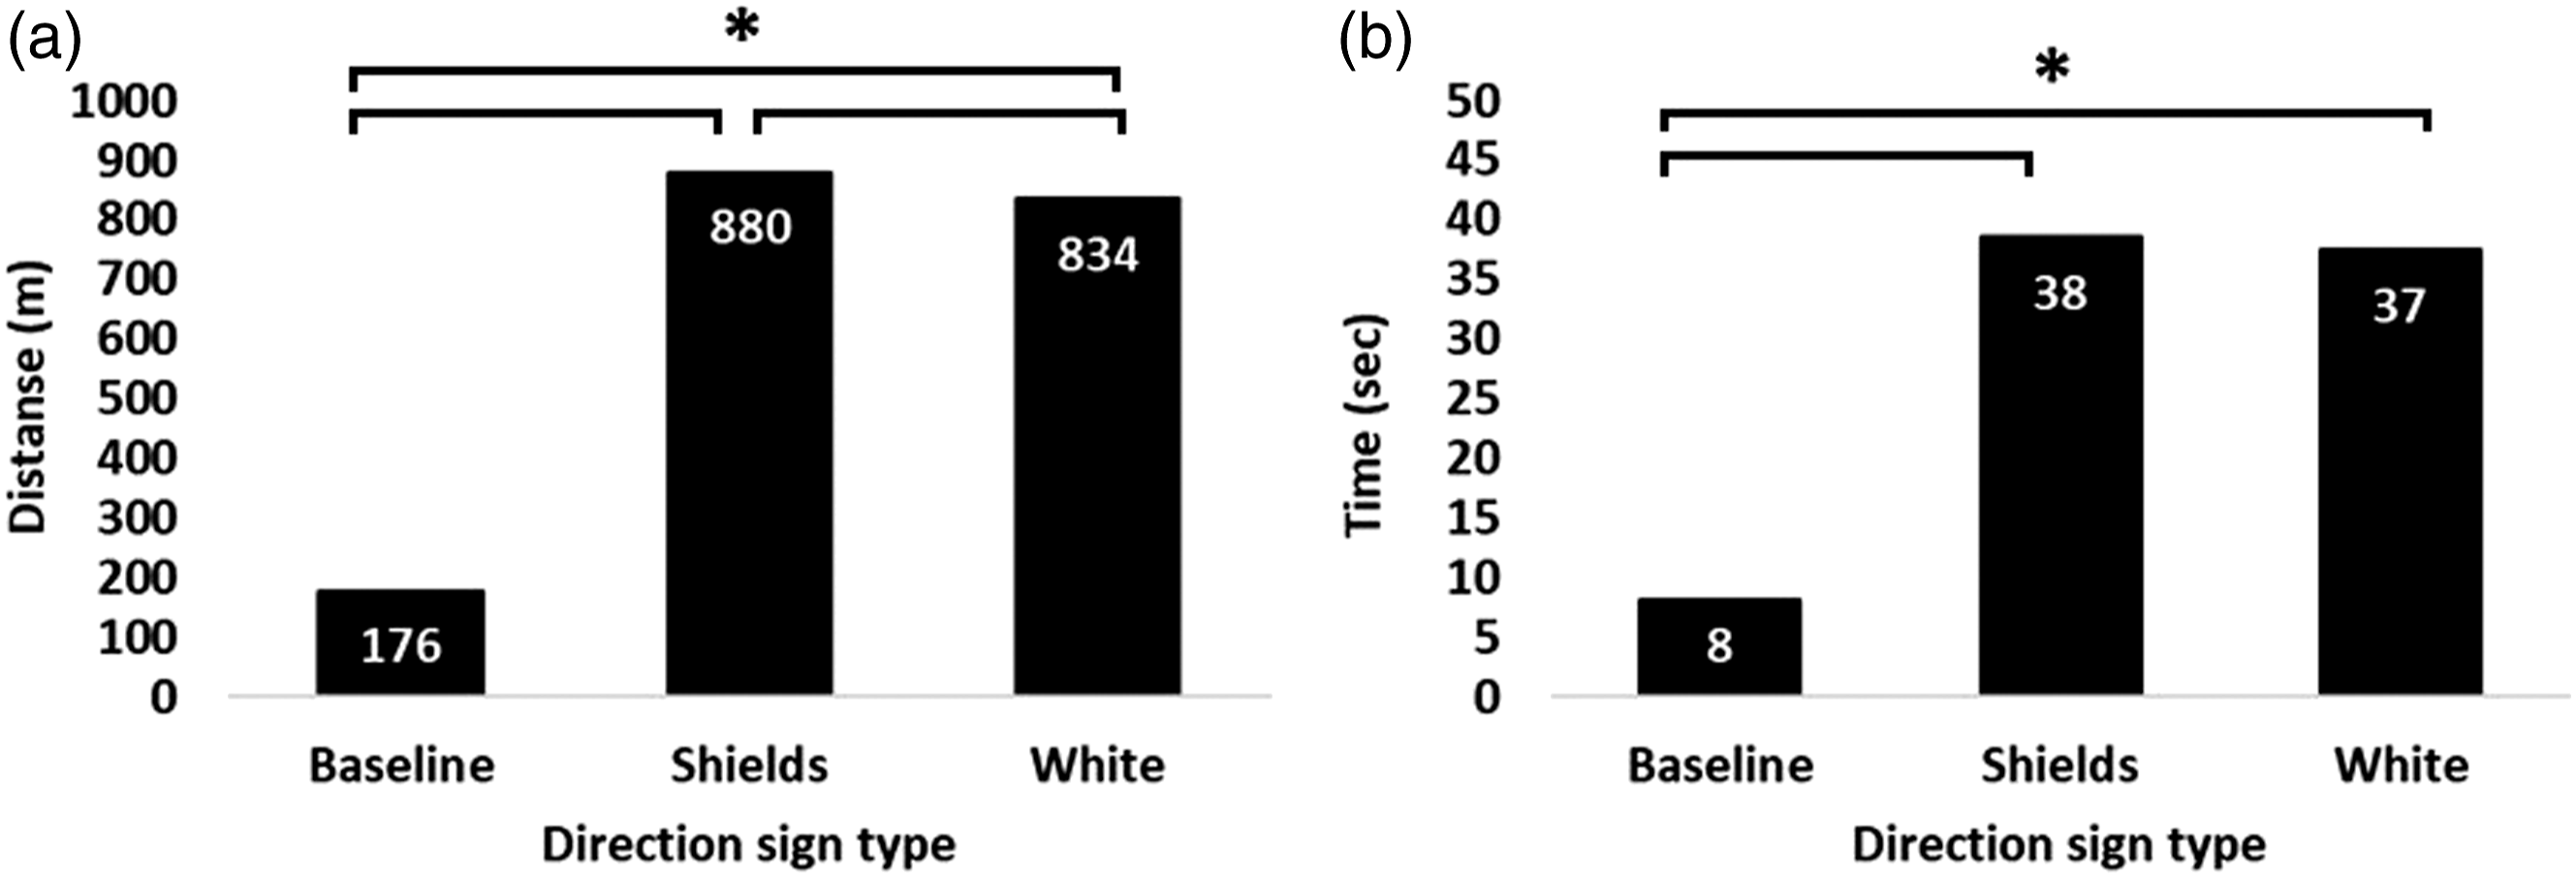
Averaged mean detection time (sec) as a function of the experimental condition and of road load at intersections after a tunnel.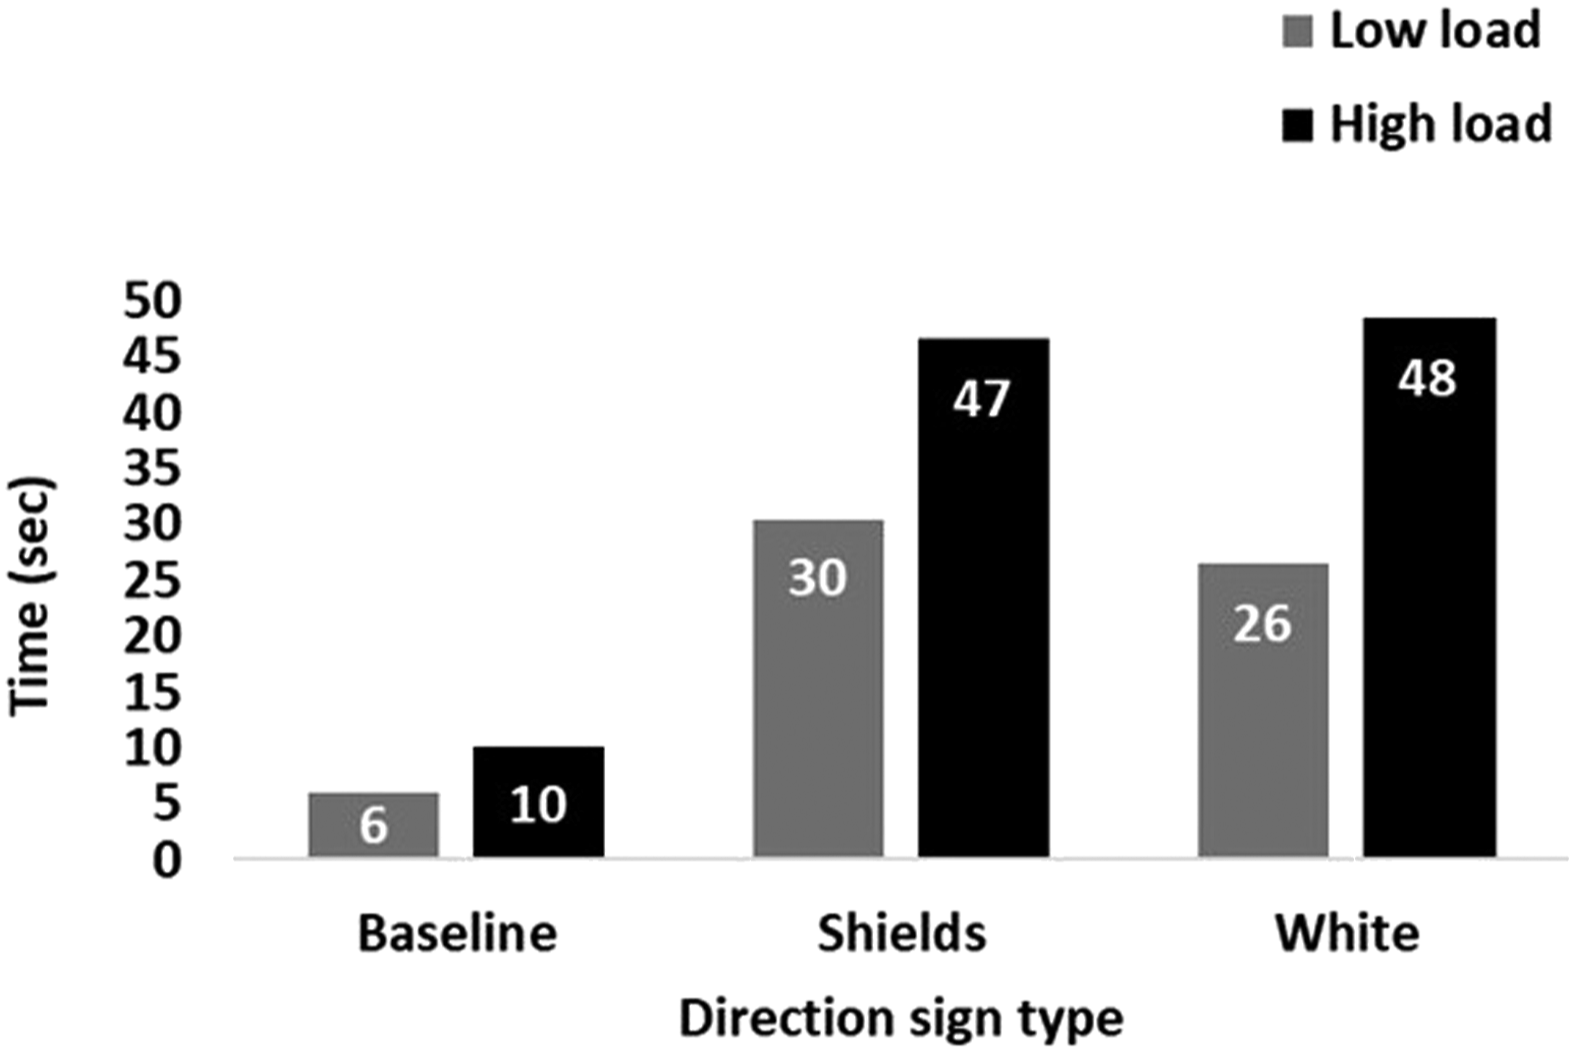
All Intersections
In this analysis the measurement was the minimum in-lane distance or time (rather than the mean), a measure of the most extreme cases, that is, the lowest distance or time of moving to the correct lane, for each condition of each participant.
Averaged (a) Minimum in-lane distance (m) and (b) Minimum in-lane time (sec) as a function of the experimental condition at all intersections. (*): significant effect of the simple pairwise comparisons at p < 0.05. Averaged mean in-lane distance (sec) as a function of the experimental condition and of road load at all intersections.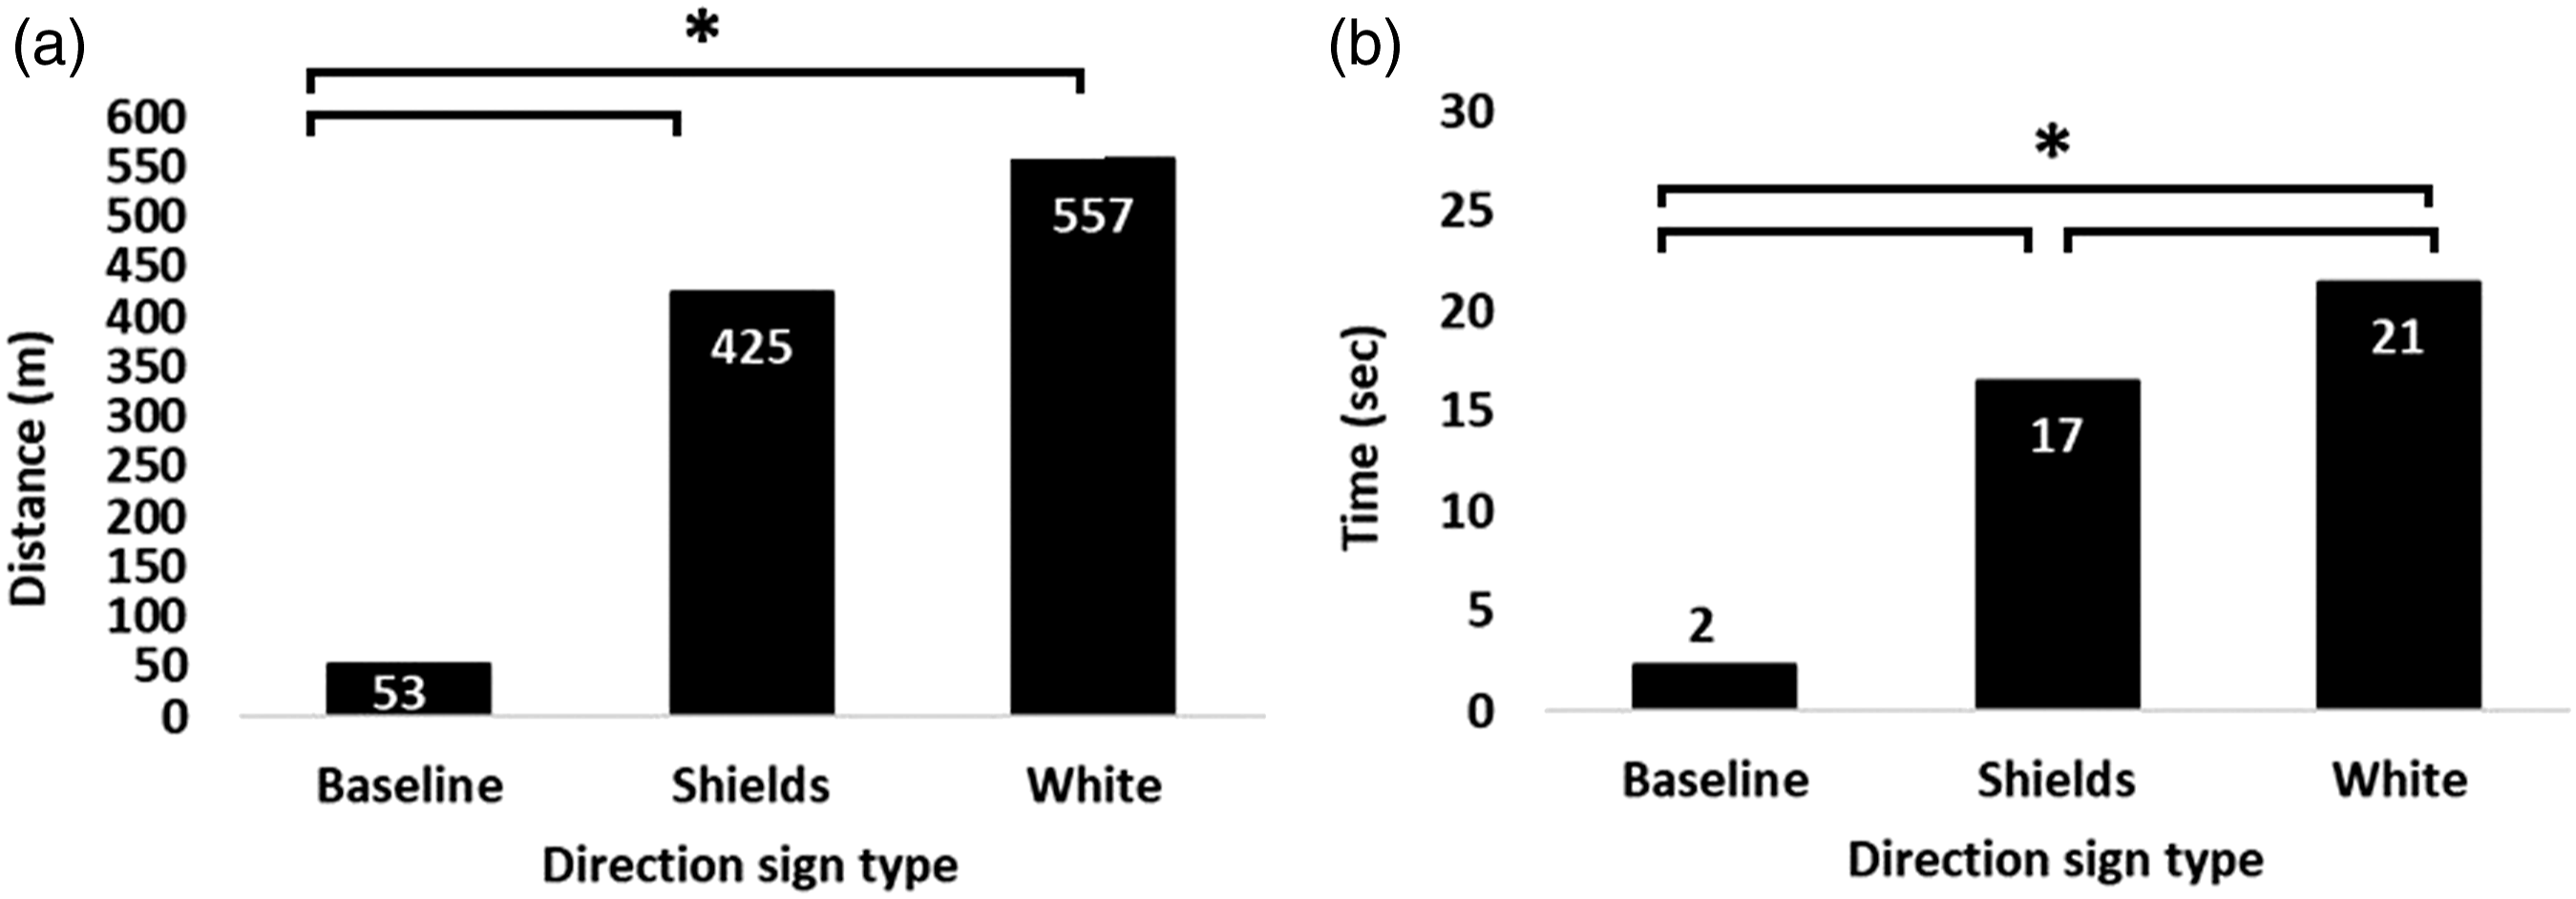
DISCUSSION
The effect of DPMs on noticing and choosing the correct lane was explored. Two different pavement marking configurations were tested: The name of the town that the lane leads to in a) white letters, or b) red and white shields containing the name of the town. In both conditions the name was preceded by a white arrow. These DPMs were always combined with traditional direction traffic signs, (roadside and overhead signs), and were compared with a baseline condition consisting of these traditional signs only. These conditions were tested with the aid of scenarios that simulated three lanes highway (in each direction), in which the road load was manipulated, yielding two conditions, high versus low (Marciano & Yeshurun, 2015).
In all analyses, both DPMs conditions showed greater values in comparison with the baseline condition. In their presence, drivers detected the correct lane sooner and moved to the correct lane earlier. The advantage of DPMs was further exhibited when only intersections after tunnel were investigated. In these cases, the mean detection time of the baseline condition was quite short and the mean minimum detection time was even shorter, suggesting that perhaps insufficient time is left for safe maneuver to the correct lane, especially when traffic on the road is heavy. This situation might lead to last minute lane shifts, which may increase the probability of accidents. In contrast, the mean detection time of the DPMs conditions was much longer (5 times longer), as was the mean minimum detection time (2 times longer). It can be concluded that the general beneficial effect of DPMs is even greater in the case of turns that appear immediately after a tunnel. Considering the low longitudinal and horizontal visibility within a tunnel, it is suggested that this DPMs advantage should be generalized to other low visibility conditions, such as night, rain, snow, or fog. Therefore, it is proposed that DPMs would be specifically beneficial in any low visibility condition, but this assumption should be empirically tested in the future.
In some cases, the measurements of white markings were significantly greater than those of the shield markings, and in other many cases this white advantage emerged but did not reach significance. Moreover, in some analyses the benefit of white over shields was further influenced by the road load. When only intersections after a tunnel were taken into consideration, shield markings improved performance compared with white markings, but when the interaction between road load and the experimental condition is considered, this pattern seems to be influenced by the load on the road. Drivers detected the lane markings sooner in the high load than in the low road load condition, but this simple effect was more pronounced in the white marking condition, influencing the main effect of the experimental condition.
The above discussion suggests that, contrary to the assumption concerning a benefit of shields over white markings, an opposite pattern, of advantage for the white over shields, was detected. This may be explained by the human visual system’s sensitivity to high contrasts (Wang et al., 2021), suggesting that white over black is more salient then red over black. This explanation fits the findings of a study reporting a benefit for white delineators over many other colors (Abou-Senna et al., 2021). In contrast, this explanation cannot be reconciled with former findings, in which, colored markings were more beneficial than white markings (Babić & Brijs, 2021; Ullman et al., 2010). It is suggested that the familiarity of drivers with a specific marking may explain the current finding. In the study conducted by Ullman et al. (2010) in the US, shield markings were most beneficial. While most drivers in the US are familiar with the common shield symbols that designate route numbers, this may not be true for the typical Israeli driver. It is important to distinguish between these two explanations, due to their different implications regarding the optimal pavement markings, therefore, this claim should be empirically tested.
LIMITATIONS
The limitations of the study offer opportunities for future studies. Due to STISIM driving simulator’s technical limitations, drivers could not perform real turns. Though this limitation had no practical effect on the current measurements, exploring the same question in a driving simulator that allows performing actual turns may add important insights. Additionally, simulator studies do offer close to real settings (Matowicki & Přibyl, 2017; Wynne et al., 2019), yet it is recommended to perform field studies to validate the results in a real driving setting.
CONCLUSION AND PRACTICAL RECOMMENDATION
According to the current results, it can be concluded that additional DPMs, consisting of either white or shields markings, would significantly improve traffic safety. They enhance earlier detection of the correct lane before arrival at a decision site and improve maneuvers to the correct lane, by channeling the driver to the correct lane, allowing sufficient time and distance to safely plan and execute the desired shift. This behavior leads to safer driving and prevent last minute lane shifts. Though the current findings also suggest white over shield advantage, this effect may be influenced by a familiarity effect of the shield, hence it may be inverted in other countries, where drivers are more familiar with route number shields (as was reported in former studies, e.g., Babić & Brijs, 2021; Ullman et al., 2010). This explanation should be further tested. To sum, DPMs are fairly cheap measures with evident added value for traffic safety. Promoting regulations demanding their presence, preferably in all decision sites but at the very least in low visibility decision sites, should be considered.
KEY POINTS
The effect of two different configurations of directions pavement markings (DPMs) on drivers’ performance was tested via driving simulator study. Both configurations were highly beneficial, leading to earlier noticing and earlier movements to the correct lane in comparison with baseline (traditional signs) condition. Lane DPMs are recommendable as they are likely to improve traffic safety at relatively low cost.
Footnotes
Acknowledgments
This work was supported by the Research Fund on Insurance Matters in Israel. The signs development was guided by eng. Yaakov Karni, road engineer expert.