
Abstract
Objective
Evaluating the ability of a Gibsonian-inspired artificial intelligence (AI) algorithm to reduce the cognitive workloads of military Unmanned Aerial Vehicle (UAV) operators.
Background
Military UAV operators use the command-and-control (C2) map for developing mission-relevant situation awareness (SA). Yet C2 maps are overloaded with information, mostly irrelevant to the mission, causing operators to neglect the map altogether. To reduce irrelevant information, an intelligent filtering algorithm was developed. Here we evaluate its effectiveness in reducing operators’ cognitive workloads.
Method
Two-stage operational scenarios were conducted with professional ex-military UAV operators, using two filter protocols and a no-filter control. High-end real-time techniques were used to continuously assess workload from muscle behavior and machine learning models.
Results
Lower cognitive workload was found when applying the algorithm’s protocols, especially when fatigue started to accumulate (Stage II). However, concerns about the quality of SA arose.
Conclusion
The algorithm was positively evaluated for its ability to reduce operators’ cognitive workloads. More evaluations of operators’ SA are required.
Application
The algorithm demonstrates the possibility of integrating AI to improve human performance in complex systems, and can be applied to other domains where spatial-temporal information needs to be contextually filtered in real time.
Keywords
1. Introduction
Operators of military Unmanned Aerial Vehicles (UAVs) work in dynamic environments with high responsibility. In many systems, point-to-point flight planning and route navigation are becoming autonomous, allowing operators to focus less on controlling the flight path. Instead, they focus more on controlling and making sense of the payload’s feed into intelligence (Cooper & Goodrich, 2008; Jenkins, 2012; Oron-Gilad & Minkov, 2010; Peschel & Murphy, 2013). Operating tasks can be overwhelming for a single operator, and most systems require operating in teams. However, in small micro-systems, a single operator must compensate for cognitive overload by prioritizing some tasks over others (Back et al., 2021; Chen et al., 2008; Dixon et al., 2004; Everaerts, 2008; McCarley & Wickens, 2004). A micro-UAV is a low-altitude, low-endurance system that can be carried and launched manually by operators from within the mission site. Usually, the operational mission is handled by a single highly trained operator (Watts et al., 2012).
This study aims to introduce artificial intelligence (AI) into the workstation of a micro-UAV to reduce the cognitive workload of the operator. A typical workstation includes a joystick to control the vehicle and/or the payload, a multi-function display showing indicators related to the flight and vehicle, the payload’s video feed, and a command-and-control (C2) map that assists the operator in gaining mission-relevant situation awareness (SA), like the locations of hostile and friendly forces (Back et al., 2021). With good SA, operators can provide navigation support to friendly forces and generate accurate intelligence reports. Lack of SA can lead to fatal results. For example, in a well-known incident in Afghanistan in 2010, a false intelligence report lead to an airstrike on a group of civilians, ending with the death of 23 innocents (Filkins, 2010). A later report highlighted information overload as the major contributor to the incident (Shanker & Richtel, 2011). C2 maps, being common across forces, do not differentiate between information relevant to different forces, and tend to be overloaded with information irrelevant to UAV operators’ missions. Map users can manually filter the information, based on certain dimensions or layers of information item types (e.g., friendly forces), or time. But filtering dimensions are limited in granularity, causing operators to trade-off between hiding layers with potentially relevant information and showing more irrelevant information on the map (Zak et al., 2018). For example, the “enemy” layer controls the visibility of all the enemy force elements on the map. Operators may decide to show it, and cope with possible clutter caused by irrelevant markings, or hide it, and lose the ability to integrate enemy information into their SA. Moreover, manual filtering manipulations take time and require multiple clicks, which interferes with the operational mission. Second, due to dynamic changes, any chosen filter may quickly become irrelevant without the operator realizing it. Clutter, irrelevant information and the need to filter layers manually increase operators’ workloads, and can lead overloaded operators to neglect the C2 map and rely solely on the payload’s feed for gaining SA (Back et al., 2021). Developers of UAV map systems must address cognitive load in their system design, as Adams (2015) emphasized the importance of human cognitive capabilities in the development of UAV systems. To avoid fatal results and support operators, techniques that reduce cognitive workloads without impacting mission performance must be considered. Here we are presenting such a technique, an intelligent filter for C2 maps developed specifically for micro-UAV operators’ needs.
AI refers to models that attempt to adopt human-like responses to events. By taking advantage of computers’ abilities to perform complex manipulations on large volumes of data, AI models may have the potential to take more complex decisions than humans. AI often uses machine learning (ML) techniques, for example, neural networks, to achieve its goals (Bao, 2016; Hew, 2011; Russell & Norvig, 1995). AI has been used before to reduce operators’ cognitive workloads, by introducing assistive automation (Choi & Cha, 2019). Although not aiming directly to reduce cognitive workload, some studies integrated AI with C2 systems. For example, Azak and Bayrak (2008) introduced an ML-based threat-recognition system, Bao (2016) and Rapaport (2015) detailed how some countries use big data in their intelligence decision-making process, and Gahegan (2003) called for using ML in geographical analysis for C2 systems. However, to date, no known research has used AI to reduce information clutter in C2 maps and intelligently filter the information presented on them. Focusing on micro-UAV operators, we demonstrate that it is possible to reduce the information clutter of C2 maps dynamically with AI techniques. Section 2 details the intelligent filter that we have developed. What remains to be examined is whether implementing the filter reduces operators’ cognitive workloads and improves their SA and performance. To answer this, one must assess operators’ workloads continuously in real time. Section 3 details how the empirical evaluation of the implementation was conducted. We also address how cognitive workload was assessed in real time. Section 4 shows the results of the evaluation considering the operational scenario development (Stage I and Stage II), and the specific dynamic filter protocols or control (no filter). Sections 5 and 6 are dedicated to the discussion and conclusions where we also address how our findings and methodology can be applied in other domains.
2. The Intelligent Filter—GiCoMAF
The Gibsonian Command-and-Control Map AI Filter (GiCoMAF) aims to reduce information overload in C2 maps that serve UAV operators (Zak et al., 2020a, 2020c). By adopting Gibson and Crooks’ (1938) notion of the field of safe travel, and using AI models, the algorithm is built in three tiers. Tier I defines the importance of each information item on the map (Figure 1a). Positive values indicate important information items that should appear on the map. Non-important information items are marked as either not distracting to the operators (neutral), or distracting (i.e., negative). Tier II defines the field of relevance (Figure 1b), marking the areas of the map that are and are not within the operator’s area of interest (AOI). Tier II predicts, for each spatial point (a 50x50 m area on the map), the probability of being inside the operator’s AOI. The decision of whether to show or hide an information item may depend solely on the item’s importance, as derived in Tier I, or also on its location, considering both Tiers I and II (Figure 1c). For example, if an AOI must be decluttered, operators may want the areas adjacent to it to show more non-important information items, to foresee possible operational developments. Both Tiers I and II can change frequently based on circumstances affecting cognitive workload. Tier III defines the filter update protocol, that is, the time rate at which the filter should be updated. The process of finding the correct filter update rate is detailed in Zak et al. (2020d). The exact update rate depends on the operational context and on the system’s ability to provide quick predictions. Yet, higher update rates (around 20 seconds) may outperform lower rates. Construction of the AI models that define Tiers I and II are detailed in Zak et al. (2020a, 2020c). A policy of how to combine Tiers I and II, that is, a filter protocol, must define the required importance level for information items to be shown, given the relevance of their spatial points. The implemented filter protocol may differ by mission type, environment, and even between organizations. Thus, deciding upon the most suitable filter protocol (i.e., how to combine the tiers) must be based on an empirical evaluation of the operator’s workload, SA and performance. Tiers I and II of the GiCoMAF algorithm. (a) Tier I, showing the predicted importance of information items. (b) Tier II, showing categorized fields of relevance. (c) Illustration of the combination dilemma involving Tiers I and II. A neutral information item (not important but not disturbing) in the AOI can be hidden, to reduce the information clutter. However, outside the AOI, the same item may be shown to allow operators to foresee battlefield developments. The combination dilemma refers to the decision of what is considered a sufficient importance for an information item to be shown, considering the spatial point’s relevance.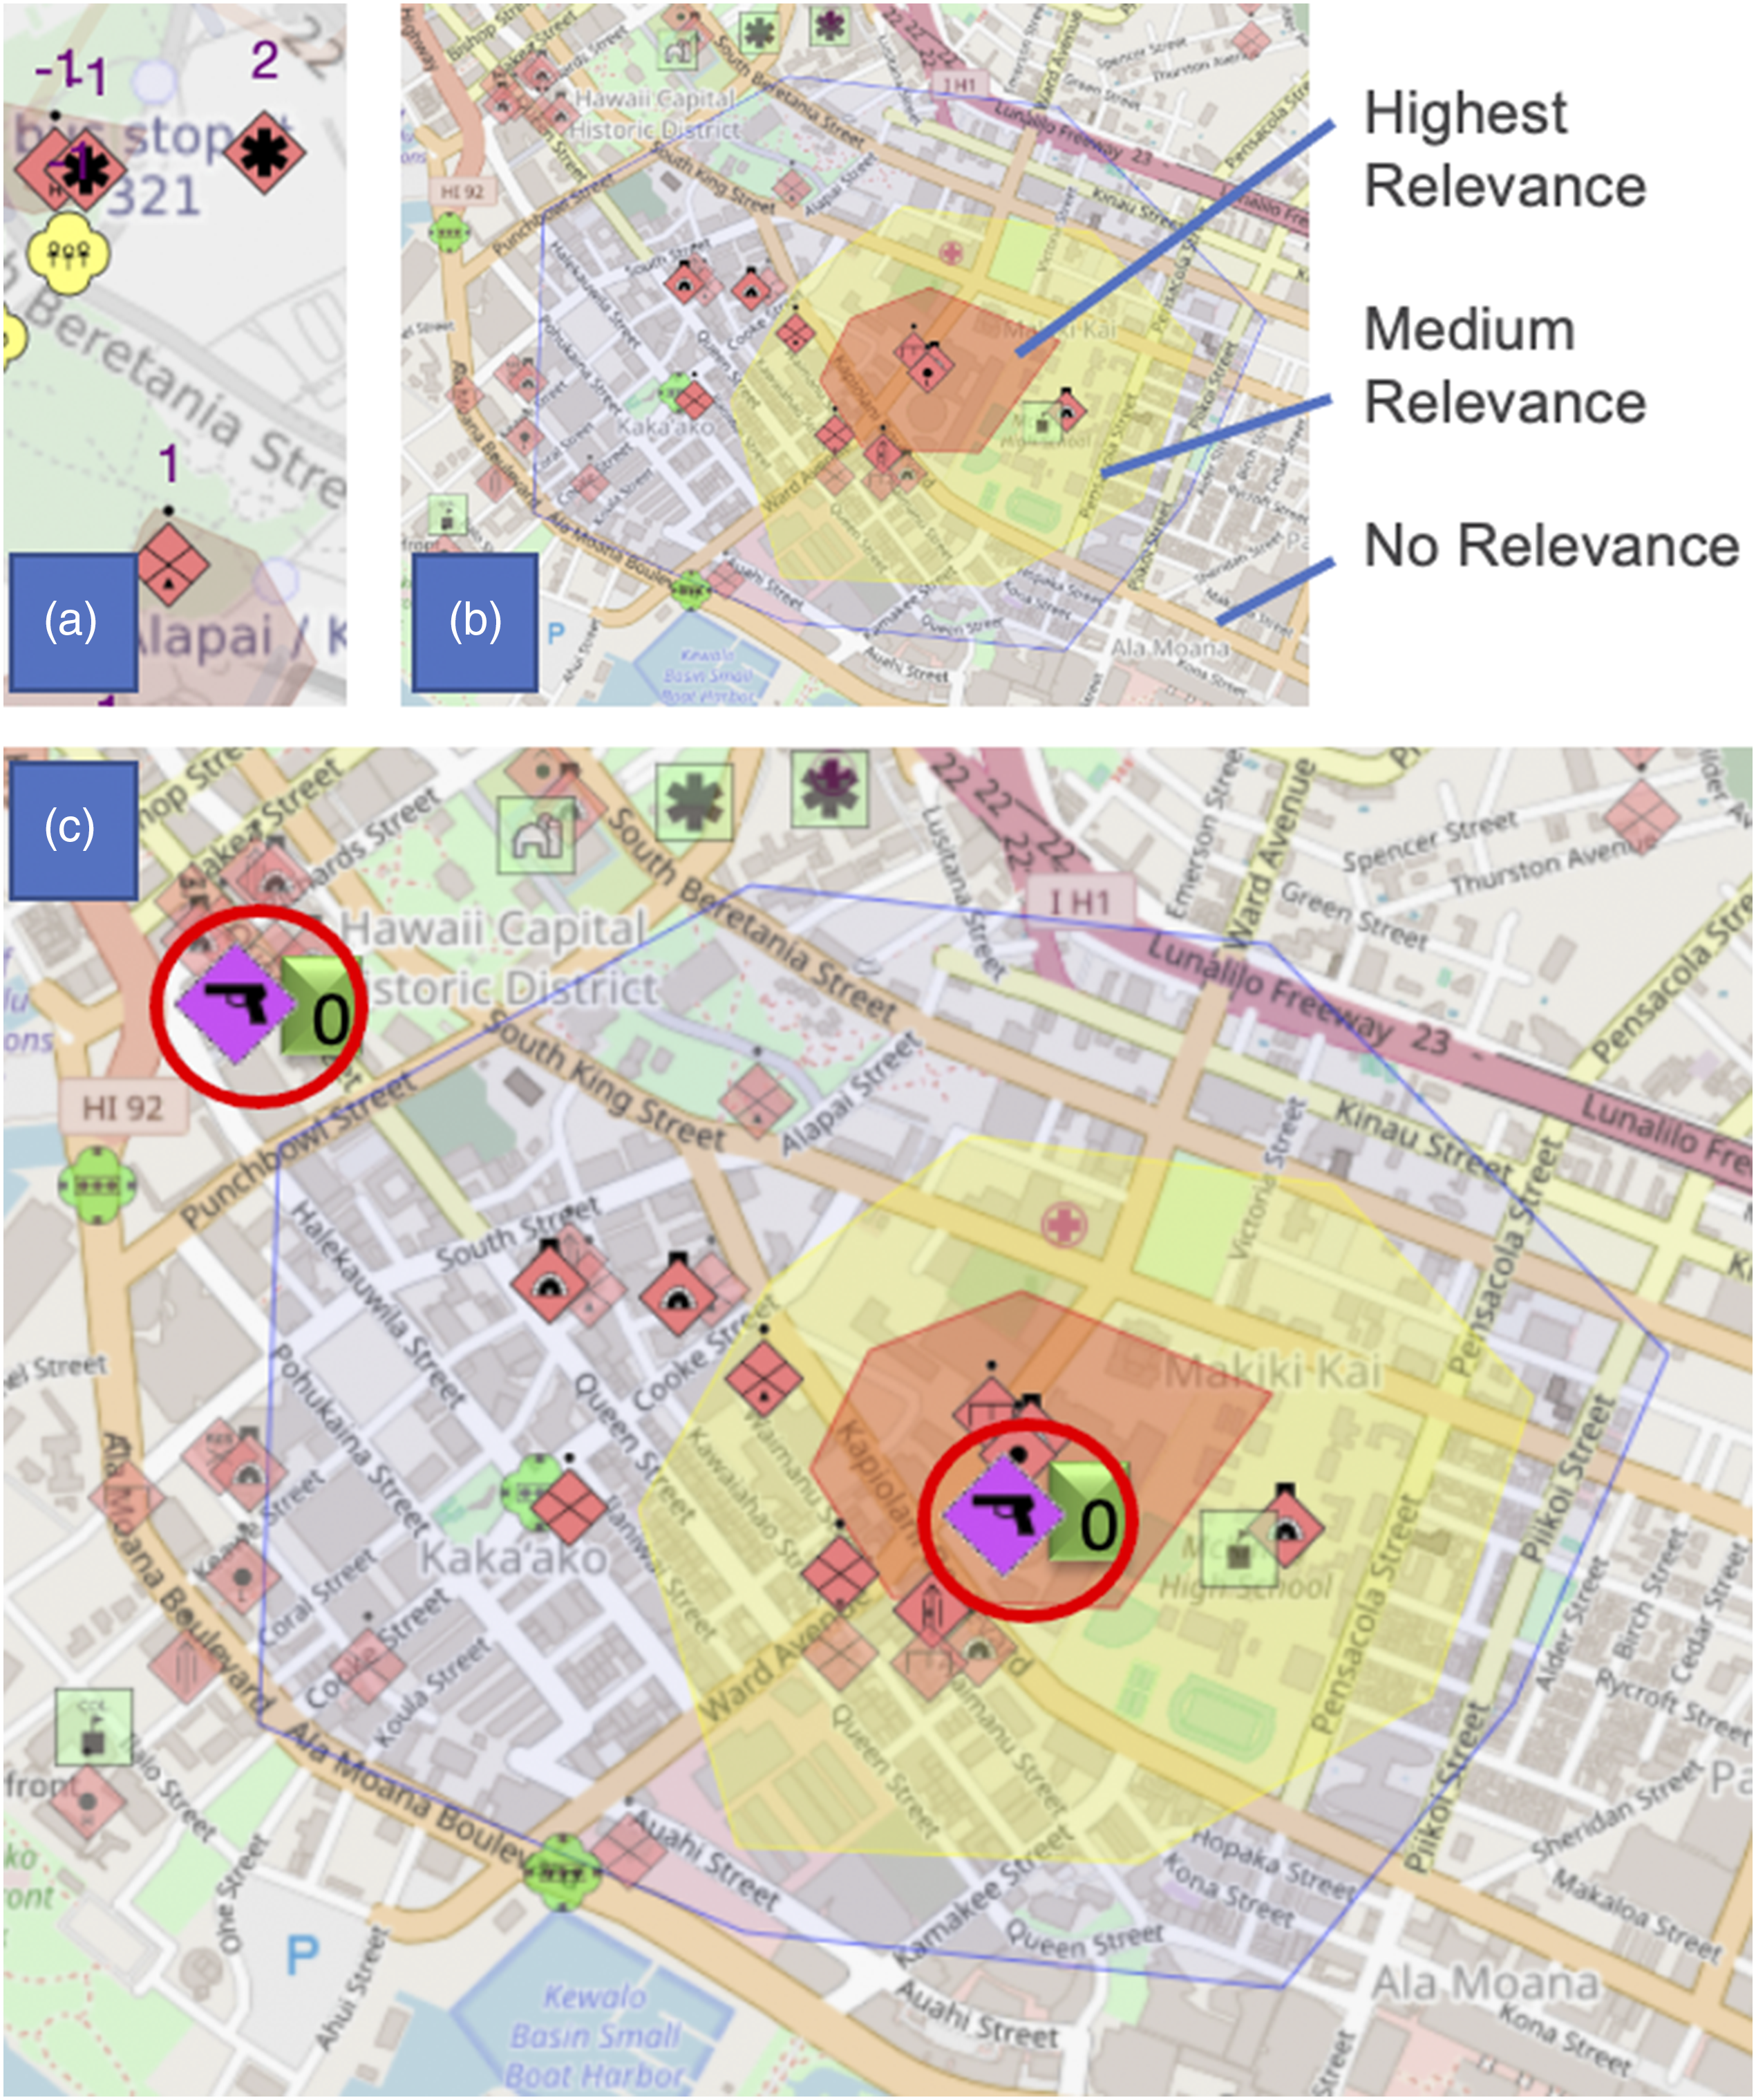
The current study has two aims. First, to explore filter protocols for combining Tiers I and II, and to identify exemplars of filter protocols for a given context (a two-staged simulated operational scenario). Following this exploration, two filter protocols were chosen for empirical evaluation. Second, to empirically investigate whether implementing a specified GiCoMAF reduces an operator’s cognitive workload relative to the control (no filter), and how sensitive the filter is to the operational context and time. The operational scenario for this investigation consisted of an evolving two-staged operation, as detailed in the method section. It was hypothesized that applying GiCoMAF throughout the entire operational mission would yield lower workload relative to the control condition. No change in mission performance was expected, since all participants were experienced professional operators. No other hypotheses were made regarding the effect of either one of the two chosen filter protocols or their effectiveness over the two operational stages.
3. Exploring Filter Protocols for Combining GiCoMAF Tiers I and II
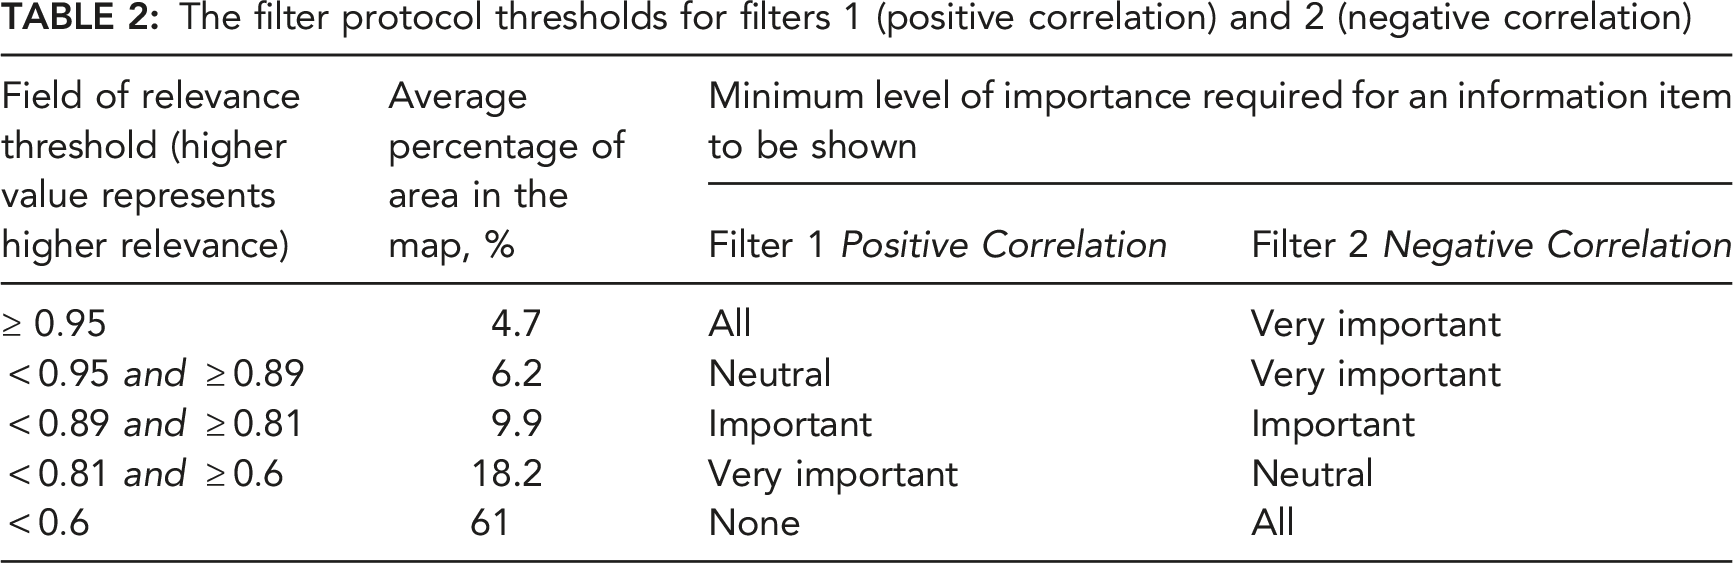
There is more than one way to operationally interpret the meaning of the field of relevance, and based on it to define, for each spatial point, the required importance level an information item on that point should have in order to be shown (Zak et al., 2020c). Hence, there are many possible ways to combine Tiers I and II using a filter protocol. Which filter protocol is most appropriate is yet unclear, as protocol effectiveness can vary by mission type, UAV type, environment, and even between organizational procedures. The SMEs interviewed for this research were not of one mind regarding the best filter protocol for their use-case. For evaluation, and based on our understanding of the SMEs’ confusion, two equally reasonable but opposing filter protocols were defined: (1) positive correlation (Figure 2a), assuming operators require as much information inside their AOI as possible, but fewer information items outside of it; and (2) negative correlation (Figure 2b), assuming operators require a clean, decluttered AOI, but in order to be able to foresee possible developments, require more information items outside the AOI. In the experiment, an average of 6% of all items was shown in the positive correlation filter protocol, and an average of 34% of the items was shown in the negative correlation filter protocol. The differences between the filter protocols were tested in an empirical experiment using operational scenarios that emulate the work of a UAV operator in the battlefield. Two opposite filter protocols. (a) Positive correlation, where more information is shown within the relevant AOI. (b) Negative correlation, where less information is shown within the relevant AOI and more information is shown in the surroundings. The AOI is marked as a heatmap, with the yellow center as the most relevant. Information items that are grayed out will not appear on the map.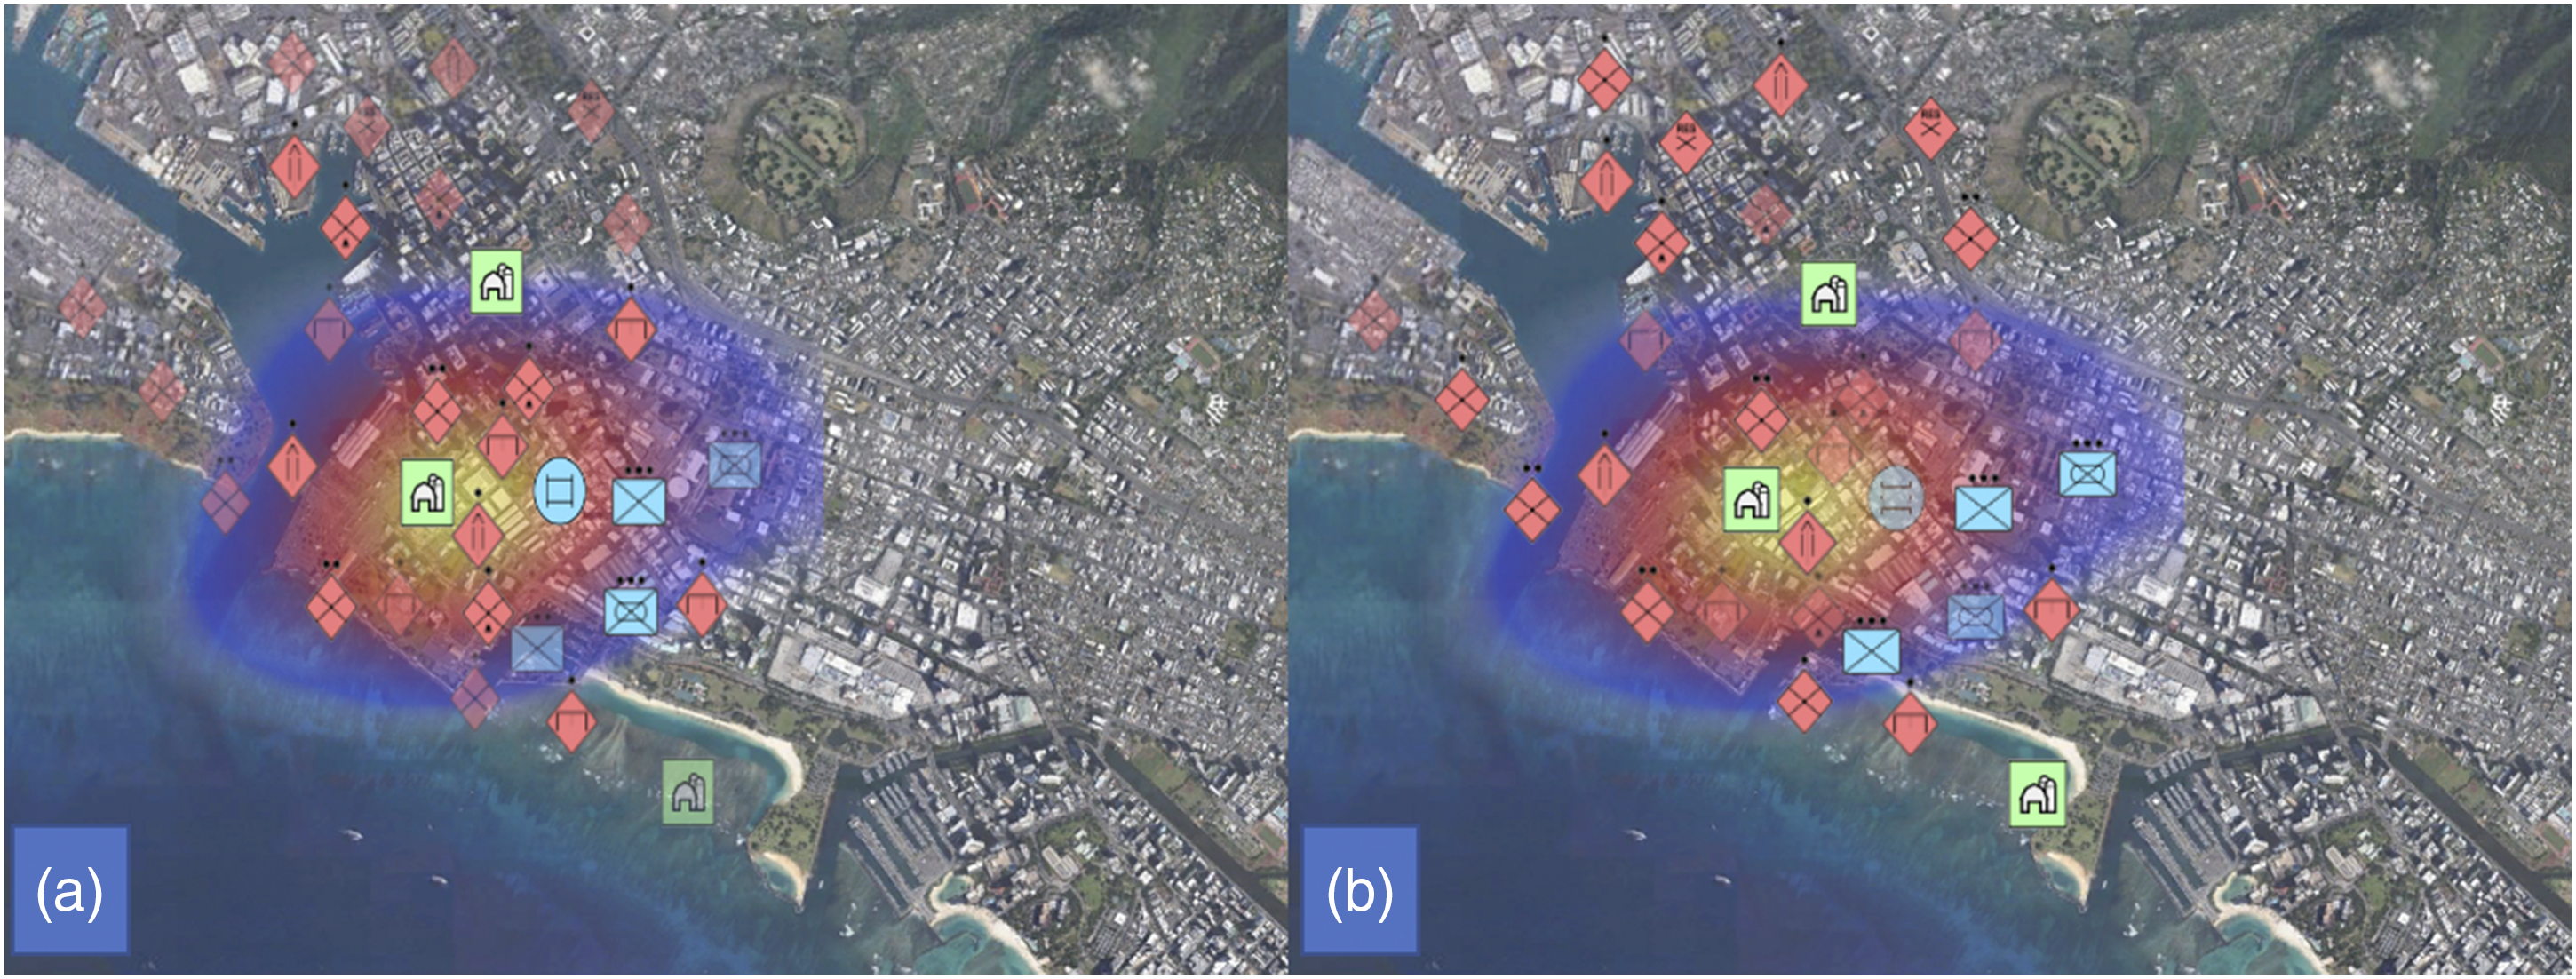
4. Empirical Evaluation and Results
To empirically investigate whether implementing a specified GiCoMAF reduces an operator’s cognitive workload relative to the control (no filter), and how sensitive the positive correlation and negative correlation filter protocols were to operational context and time, professional former military micro-UAV operators were asked to perform reconnaissance and guidance missions in a designated micro-UAV simulator. To achieve this, a continuous workload assessment technique was implemented, as detailed in the following.
4.1 Participants
Participants were military reserve micro-UAV (Skylark-I) operators. Six participants were recruited for the study. Average age was 25 years (std. 1.06). All had completed the mandatory 3 years military service, except for one participant (an officer), who had served 4.2 years. The average time since their last reserve duty was 3.33 weeks (std. 0.94). They were engineering or medicine students. Three of them participated in earlier stages of the GiCoMAF development studies (Zak et al., 2020b, 2020c). Participation was voluntarily, compensation was equivalent to 25 USD.
4.2 Apparatus
The self-developed UAS C2 Engine Simulator (UCES) was used for the evaluation (Zak et al., 2019a, 2019b). It has three components (Figure 3): (A) a stochastic battlefield emulation, generated with VT-MAK’s VR-Forces; (B) a self-developed back-end engine that collects environmental data from the simulator and decides which information items to show on the C2 map, based on the GiCoMAF predictions and protocol; and (C) a user interface that emulates the micro-UAV operators workstation. The interface includes a joystick (D) to control the payload, and two screens—a right screen with the payload’s feed, and a left screen with the C2 map. The C2 map interface provides the ability to change the map type (regular, terrain, or satellite). Two SA buttons appear below the map (as detailed in the procedure). Only the map and payload could be manipulated; the UAV flight route was pre-recorded and fixed. Experimental apparatus. (a) Example of a scenario coded into the VR-Forces. Blue represents allies, red represents the enemy, red lines represent movement routes of allies. (b) Screenshot of the GiCoMAF algorithm back-end. (c) Screenshot of the UAV operator workstation screens. (d) A participant in the UAV workstation, operating the UAV’s payload using the joystick.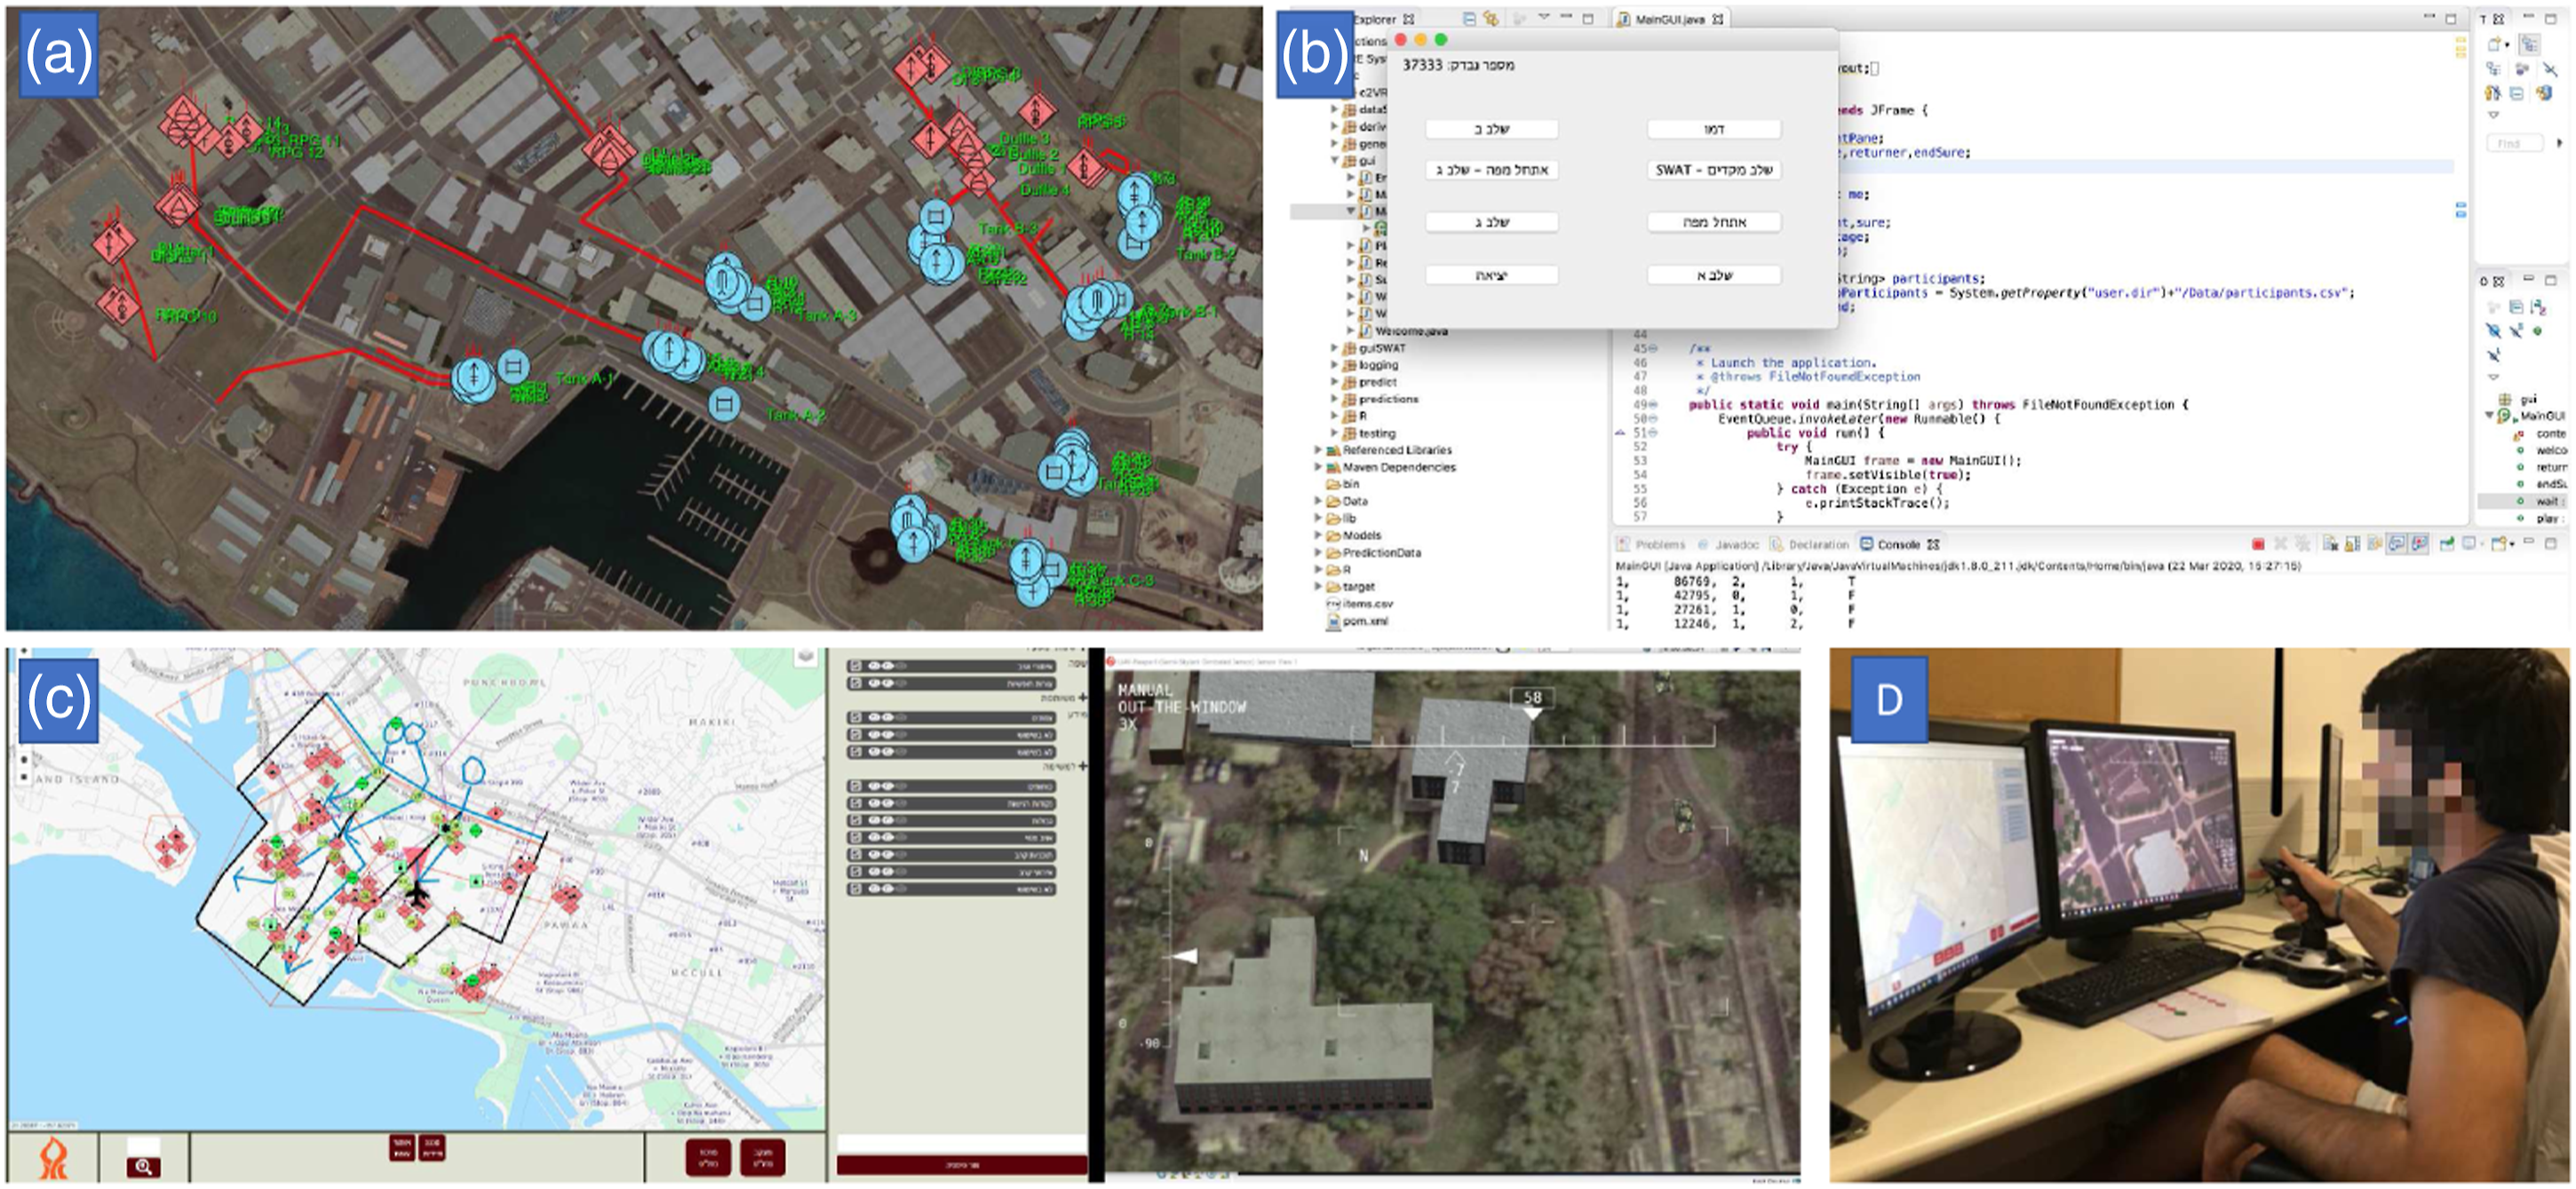
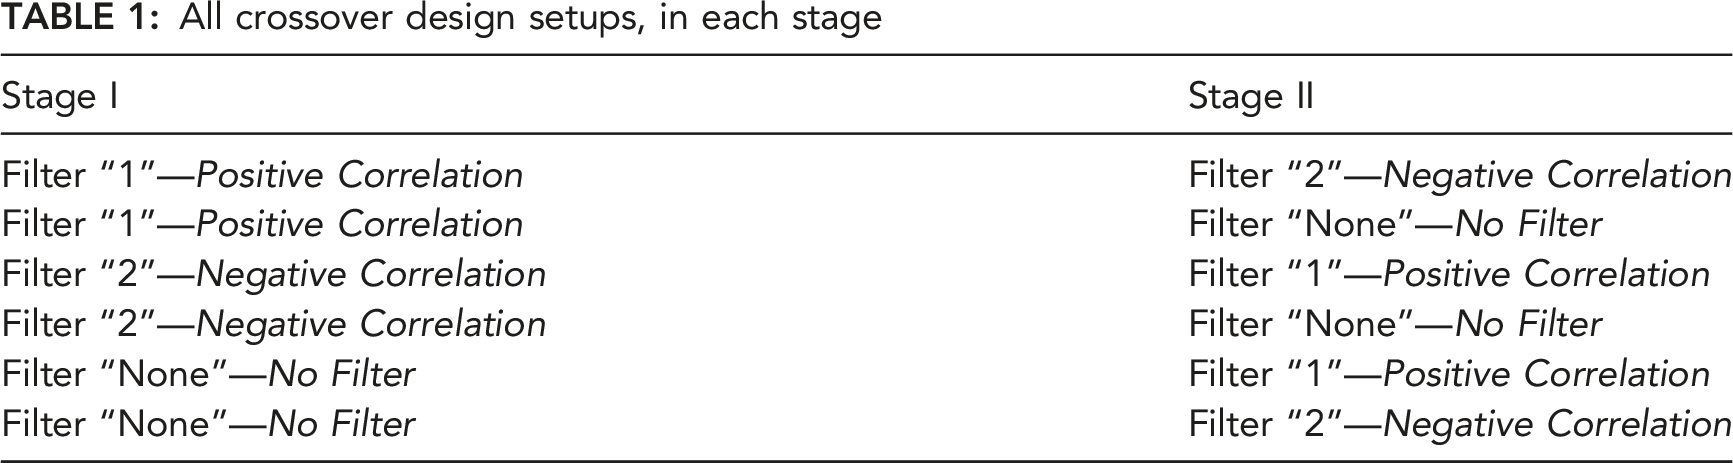
4.3 Experimental Design
All crossover design setups, in each stage
The filter protocol thresholds for filters 1 (positive correlation) and 2 (negative correlation)
Continuous Cognitive Workload Assessment. Cognitive workload was measured continuously using the joystick. Participants’ muscle behavior was recorded through their interaction with the joystick. In a setup phase during a designated scenario, the participant’s cognitive workload score was recorded every 10–30 seconds using the SWAT (Subjective Workload Assessment Technique; Reid et al., 1988; Reid & Nygren, 1988) and compared with his joystick performance. Then, following the Zak et al. (2020e) SWAT in Real Time (SWAT-RT) guidelines, the joystick movements’ magnitude and variability was used to create an ML model that continuously assessed the operator’s workload at any given time. One of the experimental scenarios was used for the setup phase and the remaining two scenarios were used for the operational mission stages. It is recommended that the setup phase and ML construction be run in advance, before the experimental run begins, to ensure that the setup phase is usable for the ML model. However, here, due to the availability of the participants, the setup phase was run right before the other scenarios. Therefore, the continuous cognitive workload assessment was calculated offline ex-post.
4.4 Experimental Procedure
The experiment procedure is illustrated in Figure 4. After filling out a consent form, and following a demonstration of the UCES, the participant was acquainted with the system. Then he was asked to perform the preliminary task to acquire a perception of the cognitive workload, as required by the SWAT technique (Reid et al., 1988). Once completed, the participant went through the workload setup phase, where he had to complete the missions of the first scenario while continuously answering, every 10–30 seconds, the SWAT questionnaire regarding his current perceived workload (Reid & Nygren, 1988; Zak et al., 2020e). The C2 map during the setup phase did not include a filter and showed all information items. Filter protocols (and the control) were then tested in two consecutive scenarios, where participants carried out their missions. Each time a participant identified an allied force crossing a predefined junction he was requested to click the Junction SA button. And each time he identified immediate danger to an allied force he was asked to click the Danger SA button. Information items on the C2 map appeared according to the assigned filter protocol (1, 2, or none). An illustration of the experimental procedure. The last two steps (in blue) were performed ex-post after the experiment was over.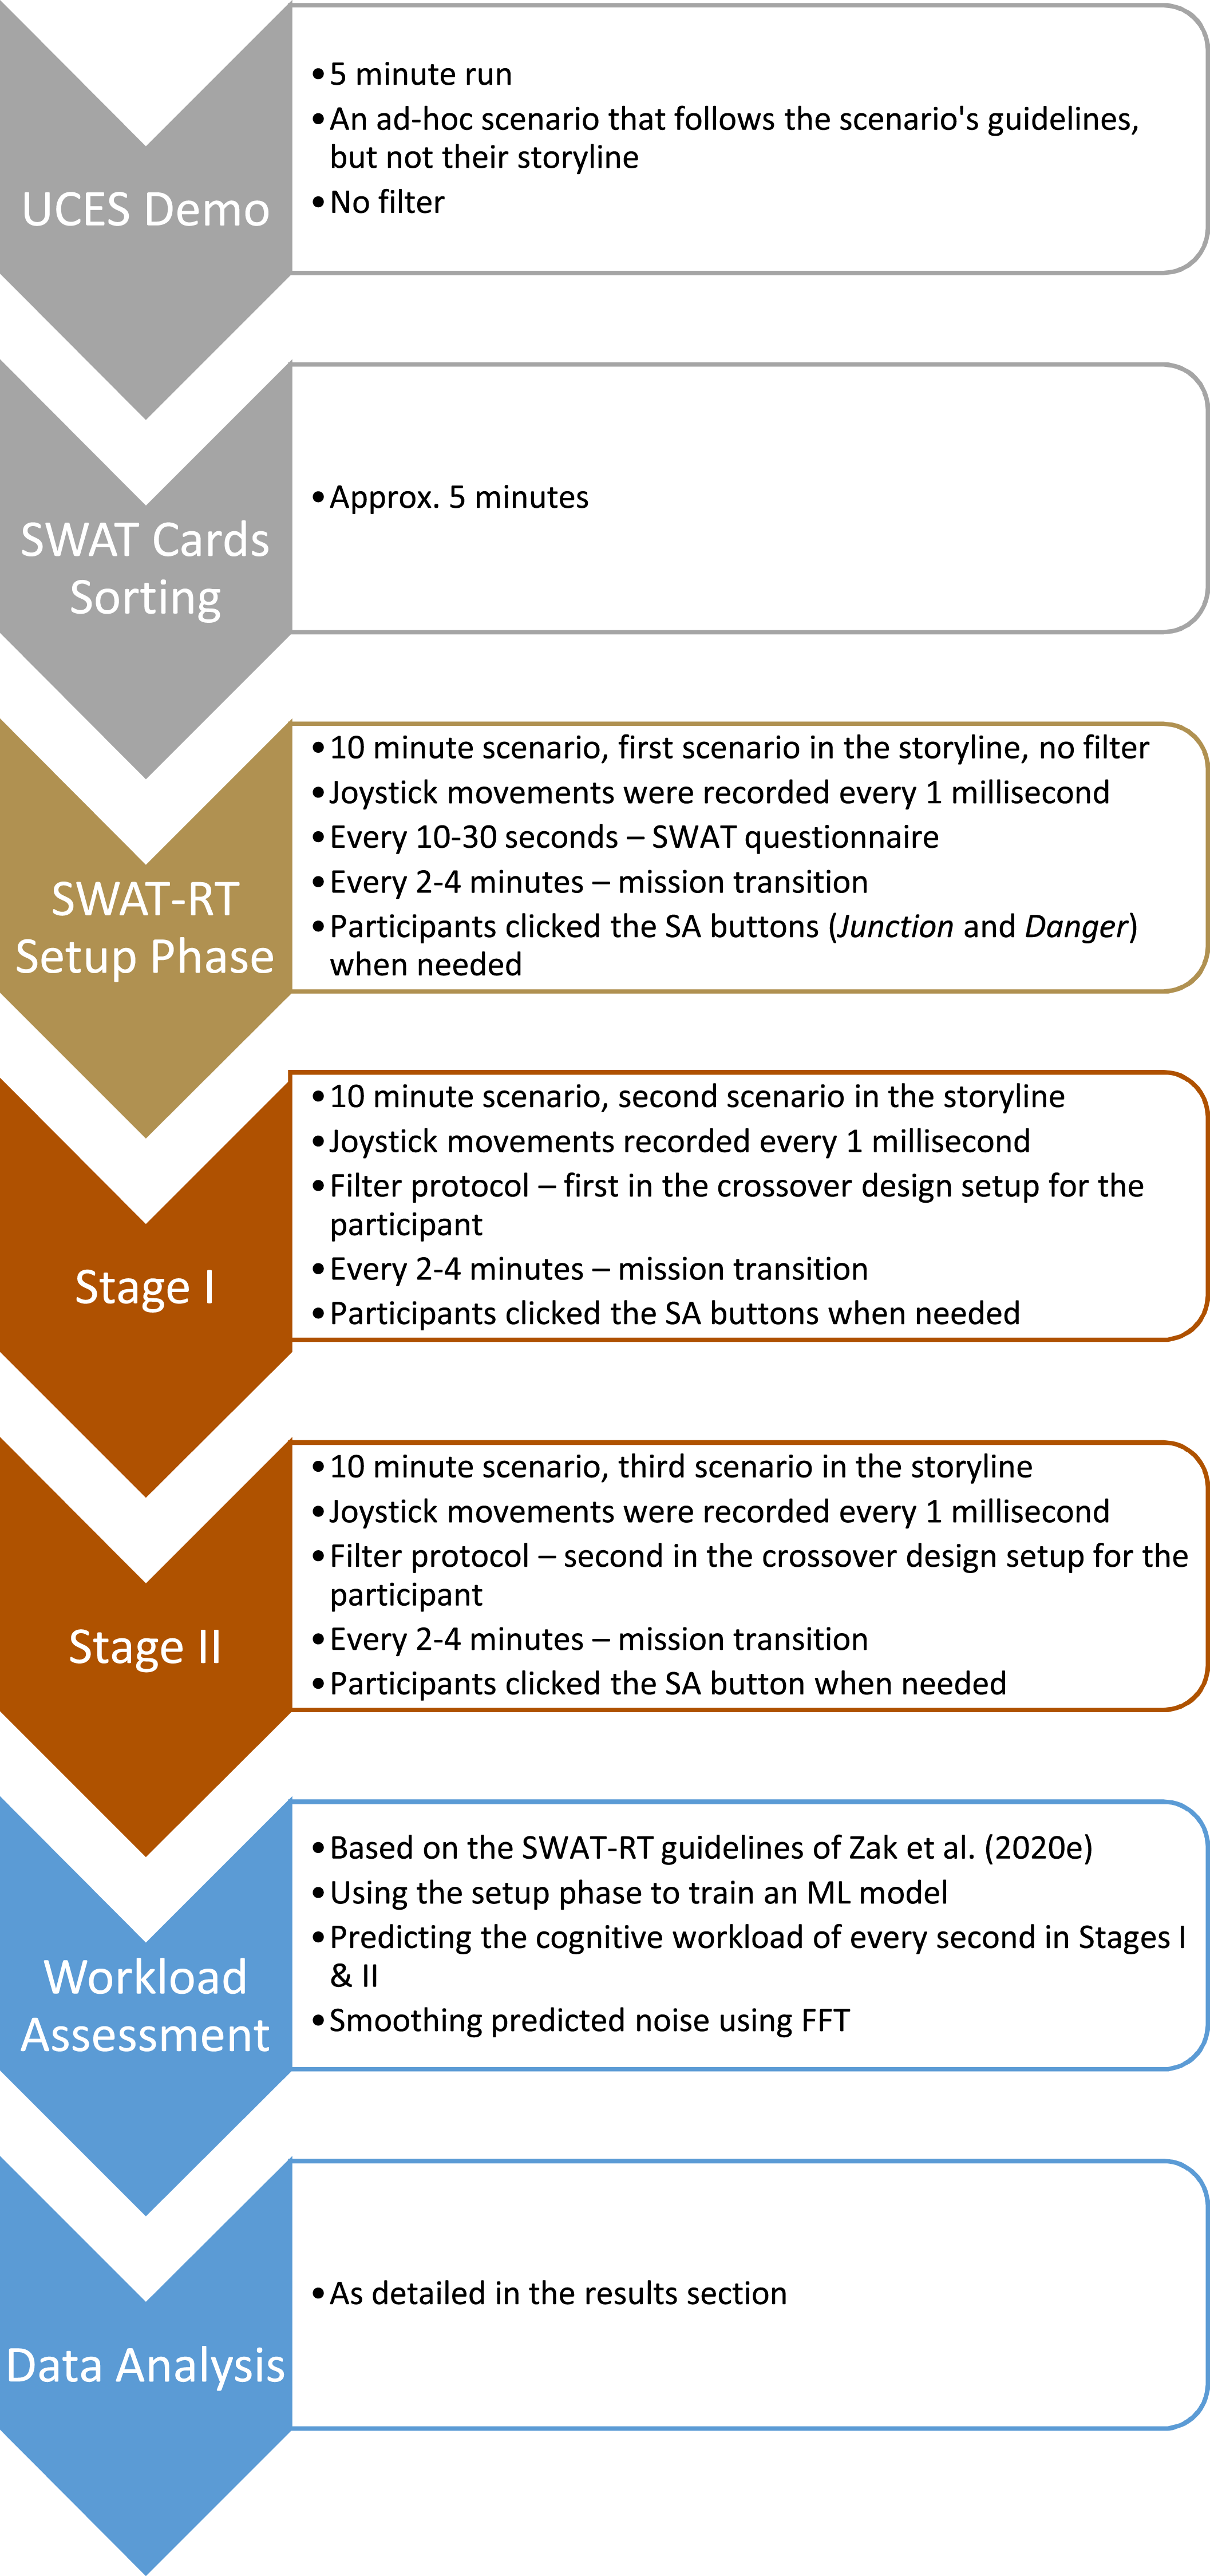
4.5 Data Analysis
The raw data collected via the UCES included the time (in milliseconds), the current stage, the filter protocol, the number of items shown on the map, and the joystick’s state on its two axes. Cognitive workload was derived from the joystick’s state using the ML-based SWAT-RT technique (Zak et al., 2020e). Since each participant may experience workload differently, the scores’ scale differs among participants. To compare participants’ workloads (W), the scores were scaled to the [0–1] interval using the following formula: for each participant,
After preparing the data, the cognitive workload analysis used two techniques. First, generalized linear mixed models (GLMM) to identify the contribution of each scenario and filter protocol to the participants’ adjusted scaled workload, where the participants were included as a random effect. By defining the participants as a random effect, the GLMM assumes within-subject correlations, where a correlation is constant for each participant (Breslow & Clayton, 1993). Since the GLMM assumes a constant within-subject correlation and does not consider time-related correlations, time was modeled with orthogonal polynomials. Then, the analysis was repeated to analyze the effect of the average number of items shown on the map for each scenario and filter protocol.
4.6 Evaluation Results
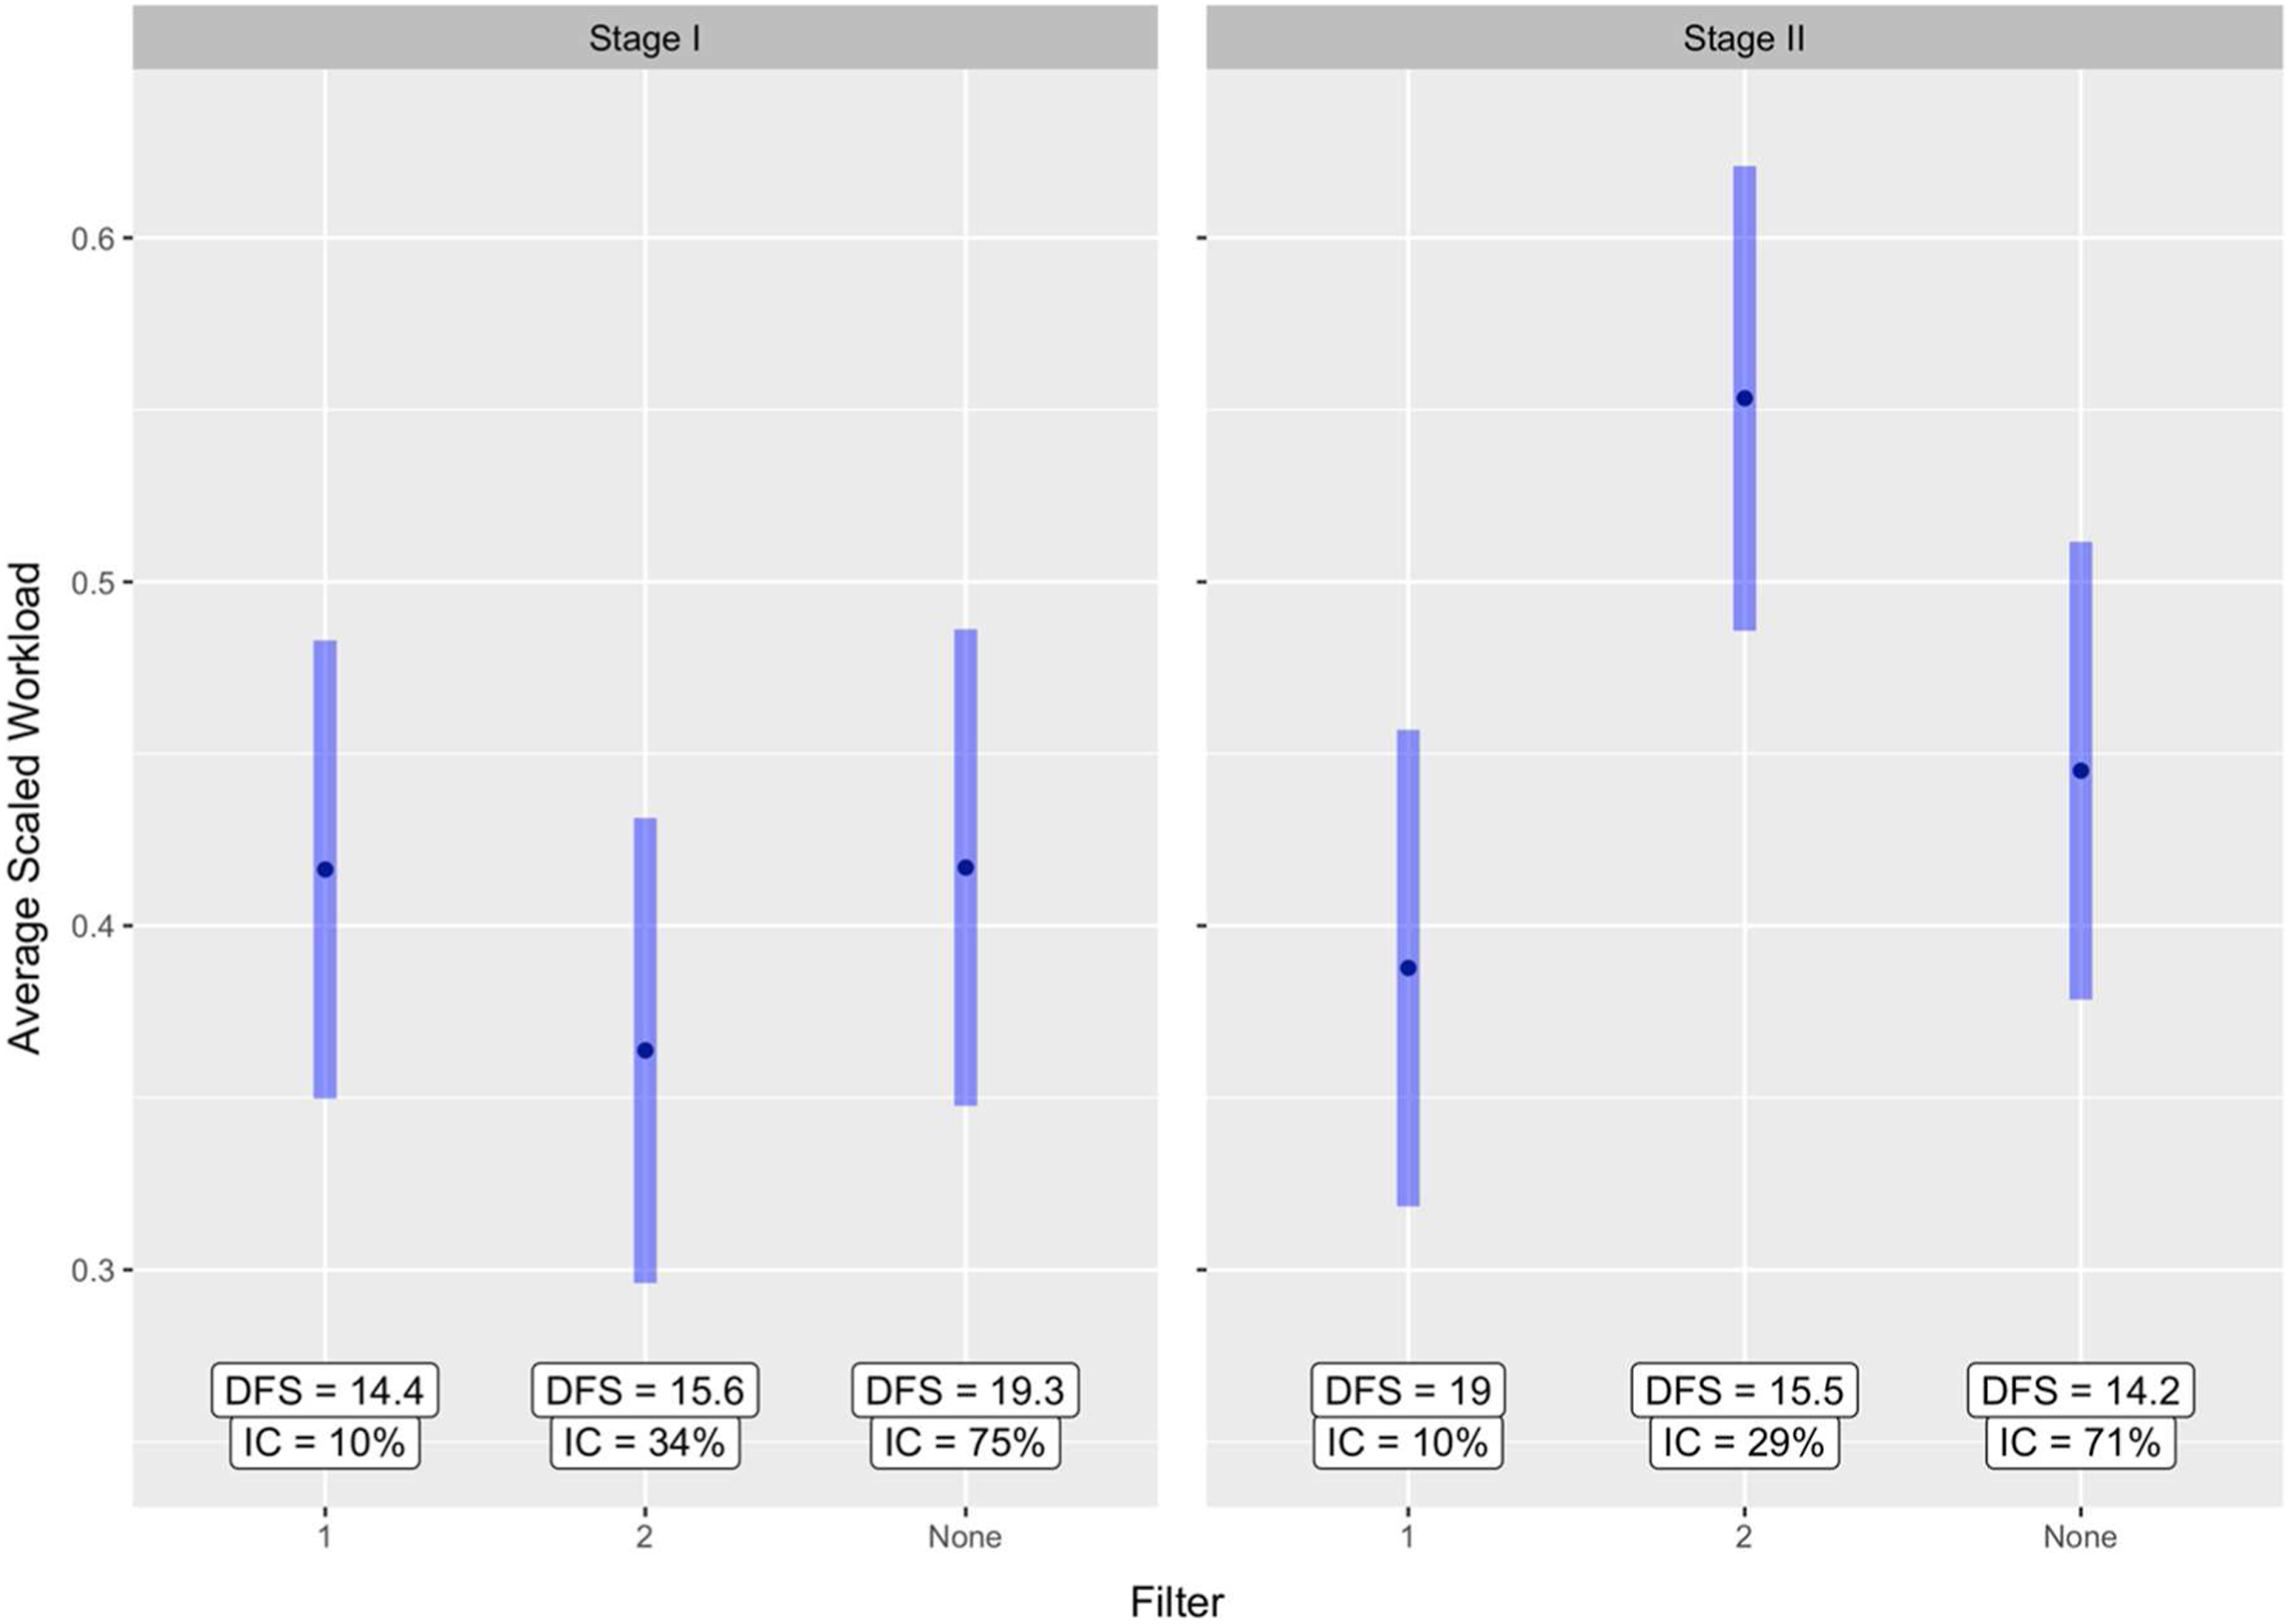
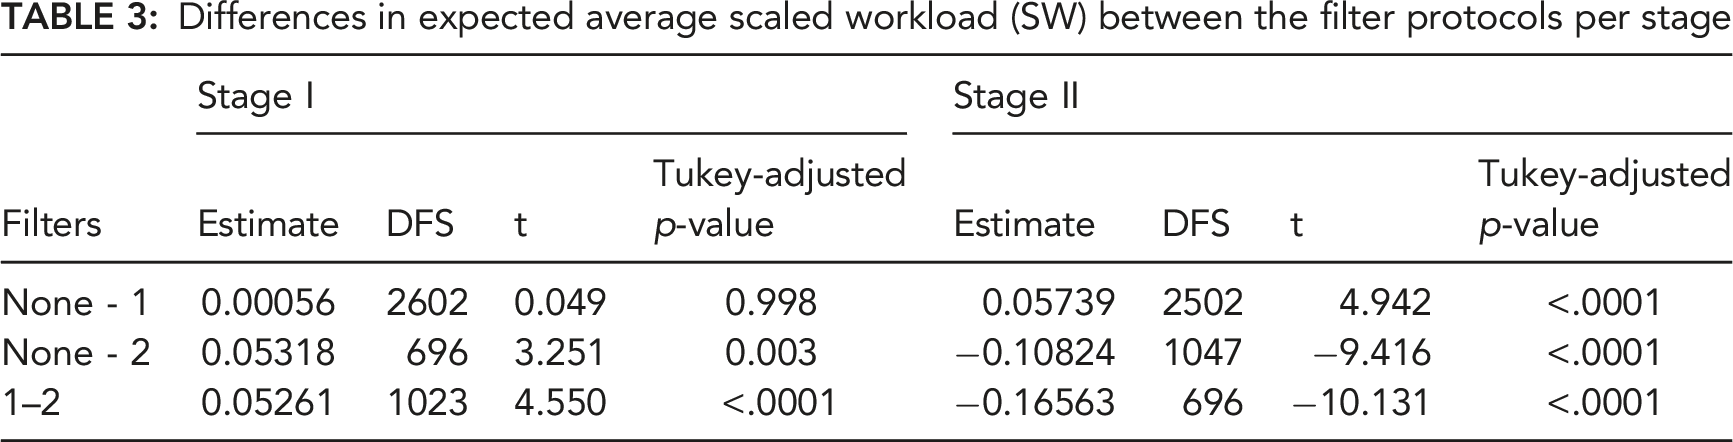
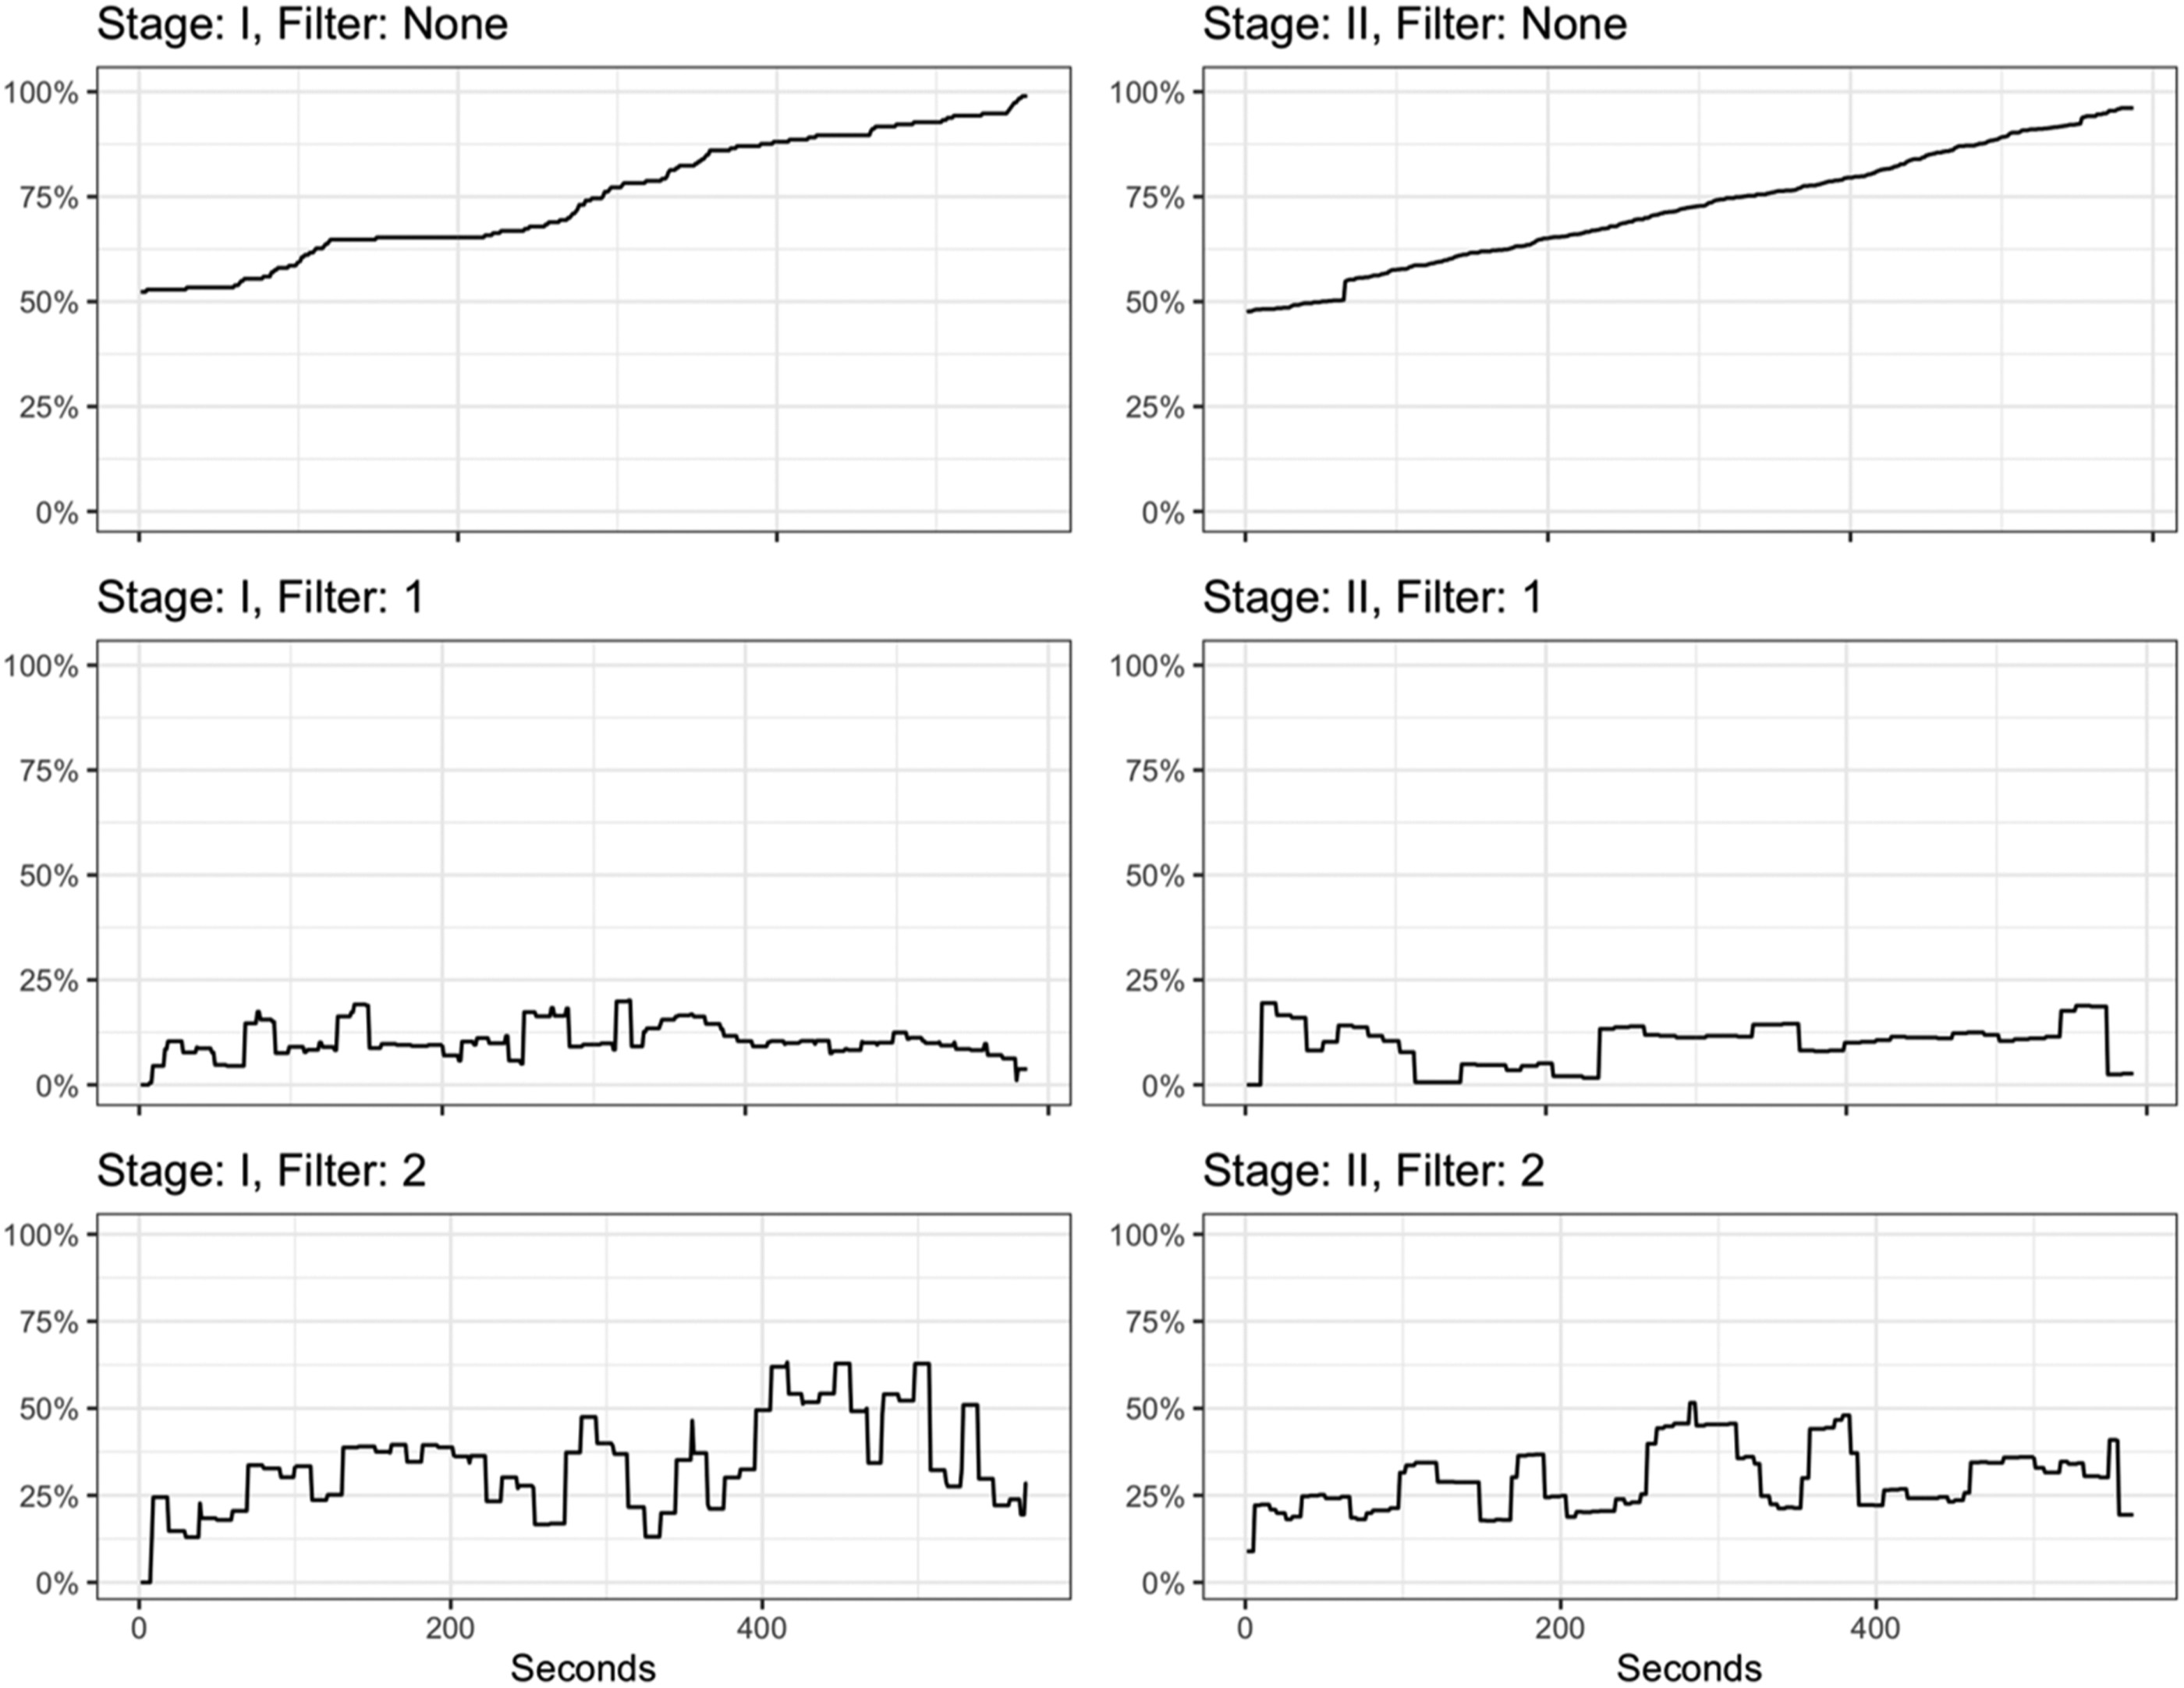
The process of analyzing the results started by obtaining the unique SWAT ML model for each participant. One participant’s reported workload in the SWAT setup phase was too uniform (insensitive to WL), causing his SWAT ML model to be infeasible, and therefore had to be discarded. In some cases, as may happen in AI studies that aim to model human behavior, the cognitive workload cannot be modeled using ML, and the setup phase should be repeated (Pantic et al., 2007; Zak et al., 2020e). Since modeling was done after the entire experiment was over, those participants had to be disregarded from the results. Thus, the crossover design was missing one necessary combination of the filter protocols “none” and “1.” Using the FFT analysis, the SW of each participant was smoothed and is shown in Figure 5. Eventually, each participant in each stage had approximately 600 data points, representing each second in the scenario. These results were analyzed using a GLMM, where the dependent variable was SW, the predicting variables were the filter (1, 2, no filter), the scenario stage (I or II), a degree-26 orthogonal polynomial representation of time, their interaction, and participant as the random effect. The degree of the time polynomial was chosen based on a Bayesian Information Criterion (BIC) comparison of GLMM models with various possible degrees. The result of that analysis is given in Figure 6, with a 99% confidence interval of the expected average SW for each stage and filter protocol combination. From Figure 6, it is evident that there are differences between scenario stages. In Stage I, filter protocol “2” outperforms the other protocols (0.53), with “none” being the runner-up (0.57), and “1” being last (0.58). In Stage II, filter “1” performs best (0.47), with “none” being the runner-up (0.52) and “2” being last (0.62). The difference between the stages was further investigated by running a Tukey post hoc test to compare the estimated marginal means of each filter protocol at each stage (Table 3). From Table 3, it is evident that in Stage I scores were not always statistically significant, indicating that participants may have been indifferent to the filter protocol. Figure 7 illustrates information clutter using the percentage of items shown at each stage for each filter protocol. That percentage is also used to indicate the information clutter in Figure 6 (labeled as “IC”). The percentage is relative to all information items available at the end of the stage. Using no filter increases the information item clutter to 100% by the end of the stage. Filter protocol “1” has on average less clutter (10%) than filter protocol “2” (31%). The cognitive workload of each participant, as predicted by the SWAT ML model. The X-axis is time, and the Y-axis is scaled workload (SW). The empty box represents the participant whose workload could not be modeled. A 99% confidence interval (blue) of the expected average scaled workload (SW, black) for each stage and filter protocol combination. DFS—the degrees of freedom for the signal. IC—the average information clutter (as a percentage shown out of all possible information items at the end of the stage). Differences in expected average scaled workload (SW) between the filter protocols per stage An illustration of the information clutter, the percentage of items shown at each stage with each filter protocol. The percentage is defined as the number of items shown out of the maximum number of items at the end of the stage.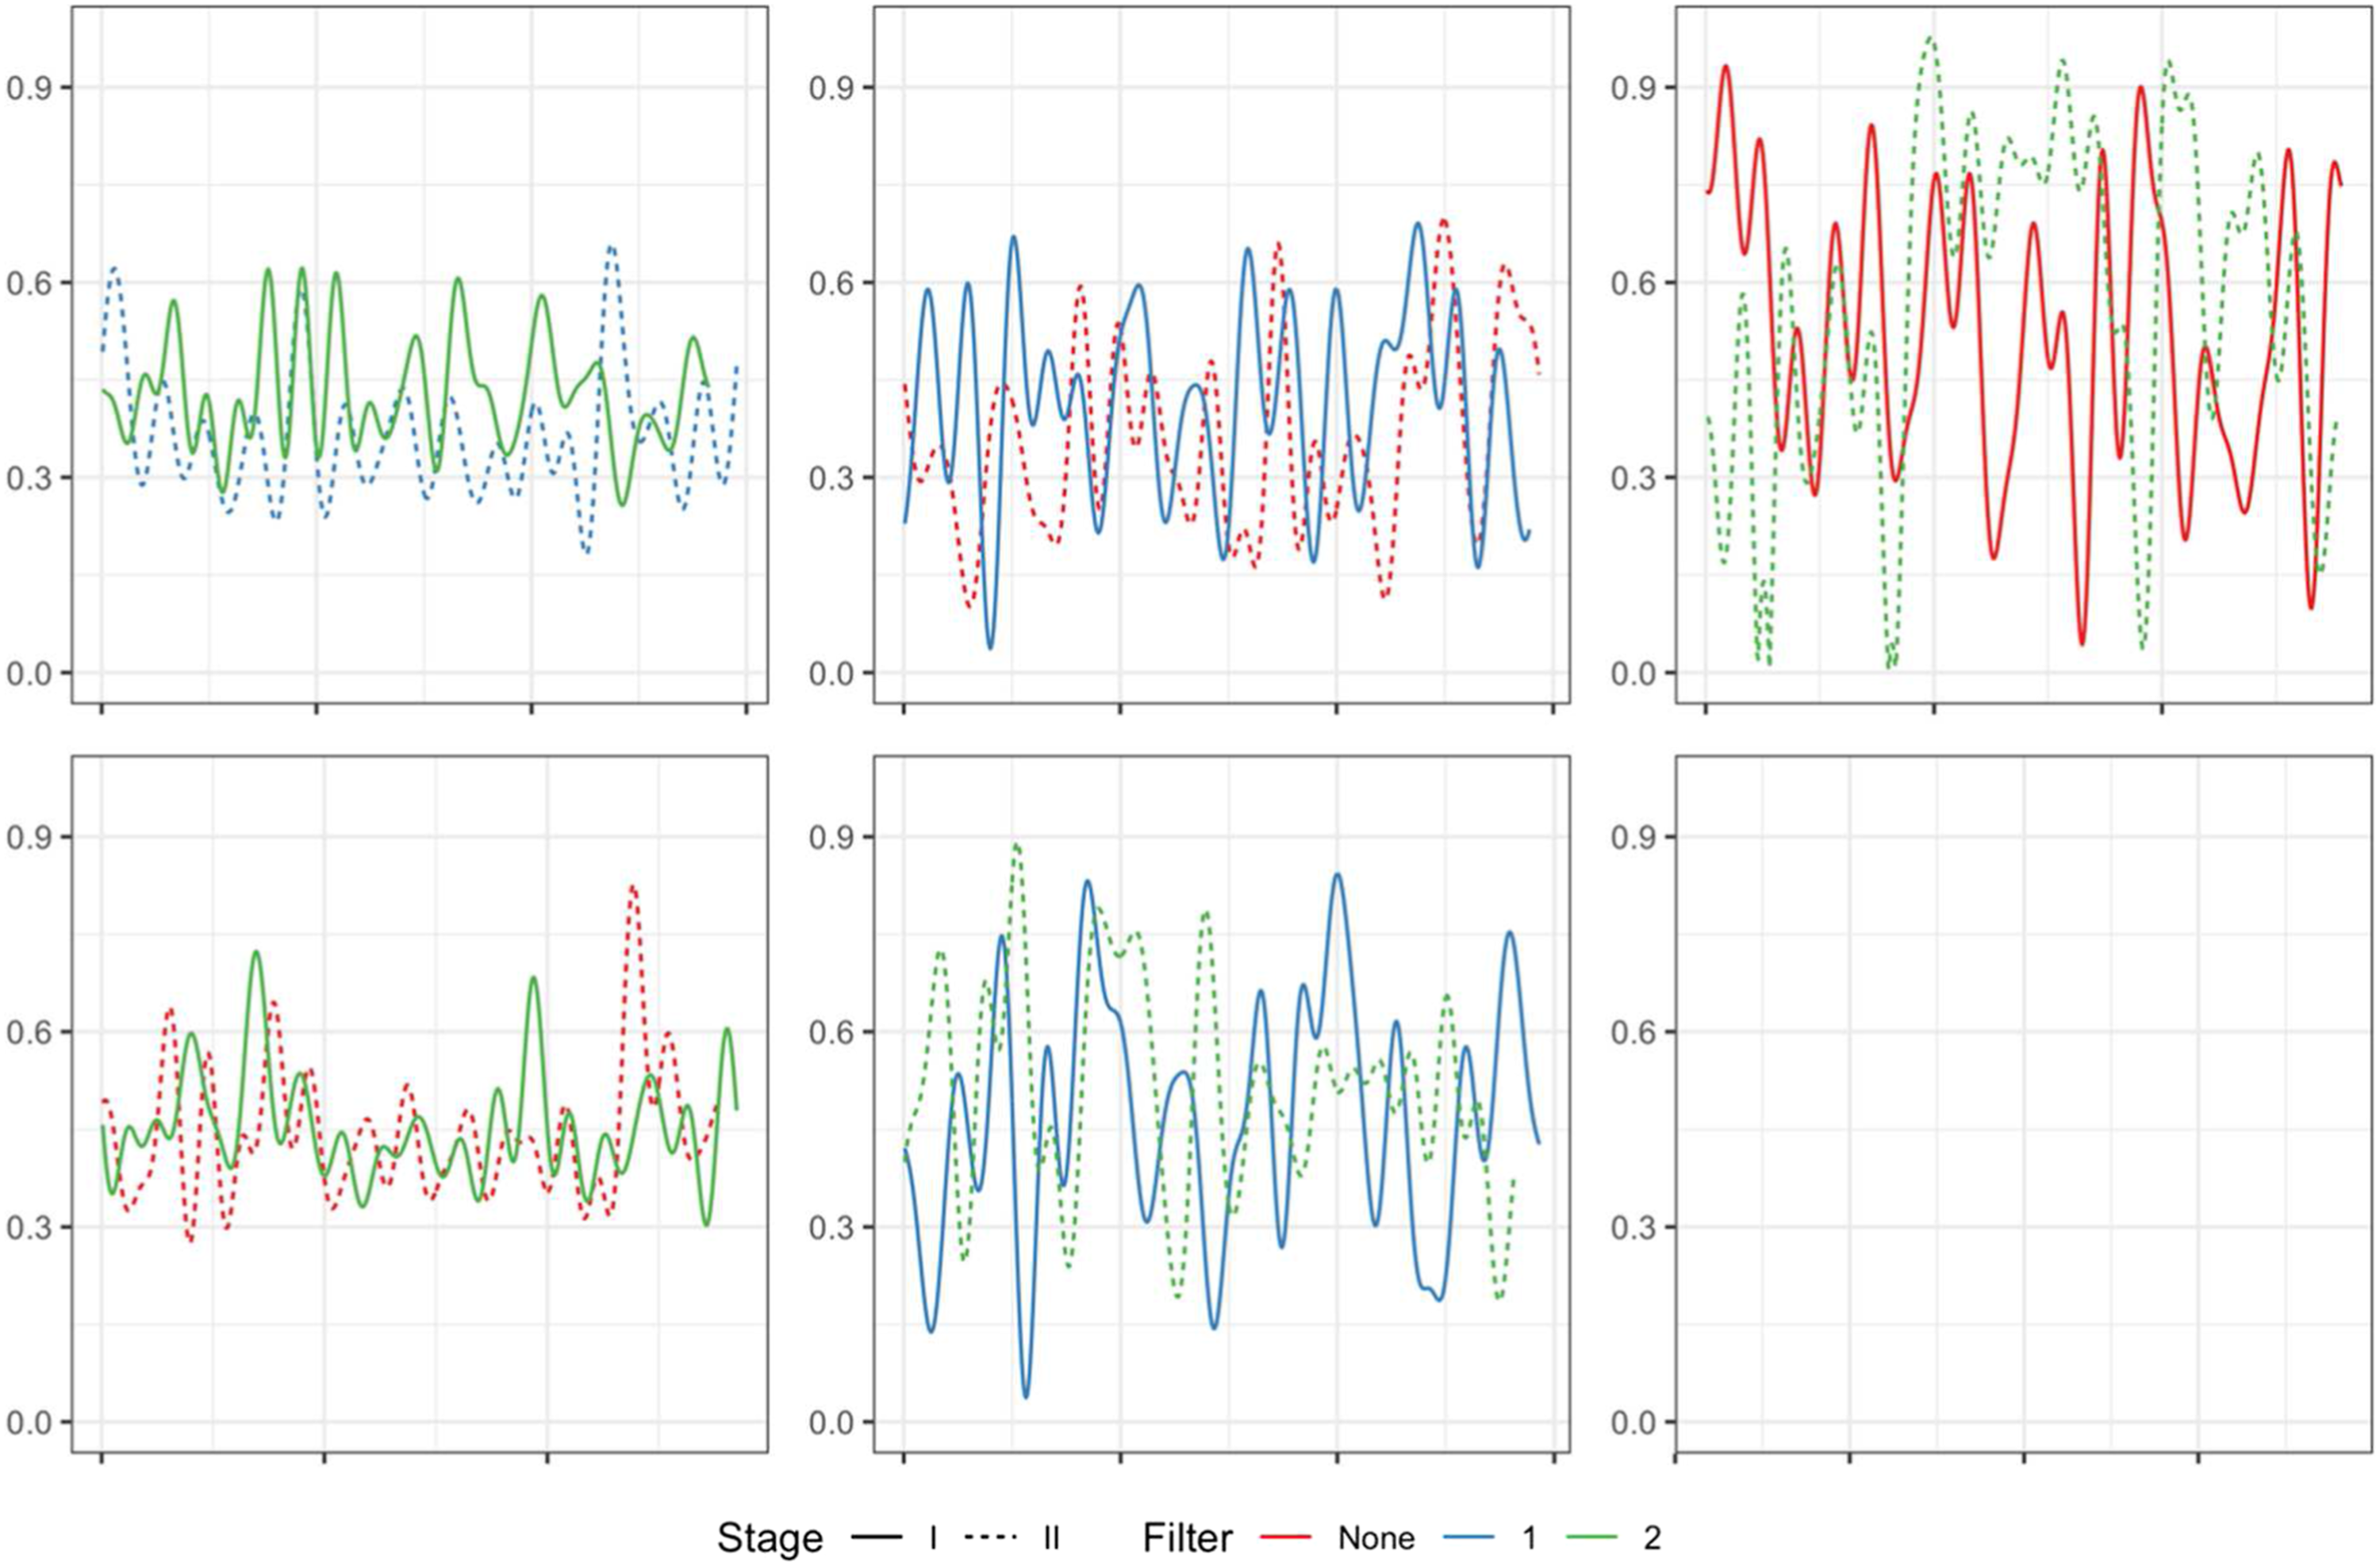
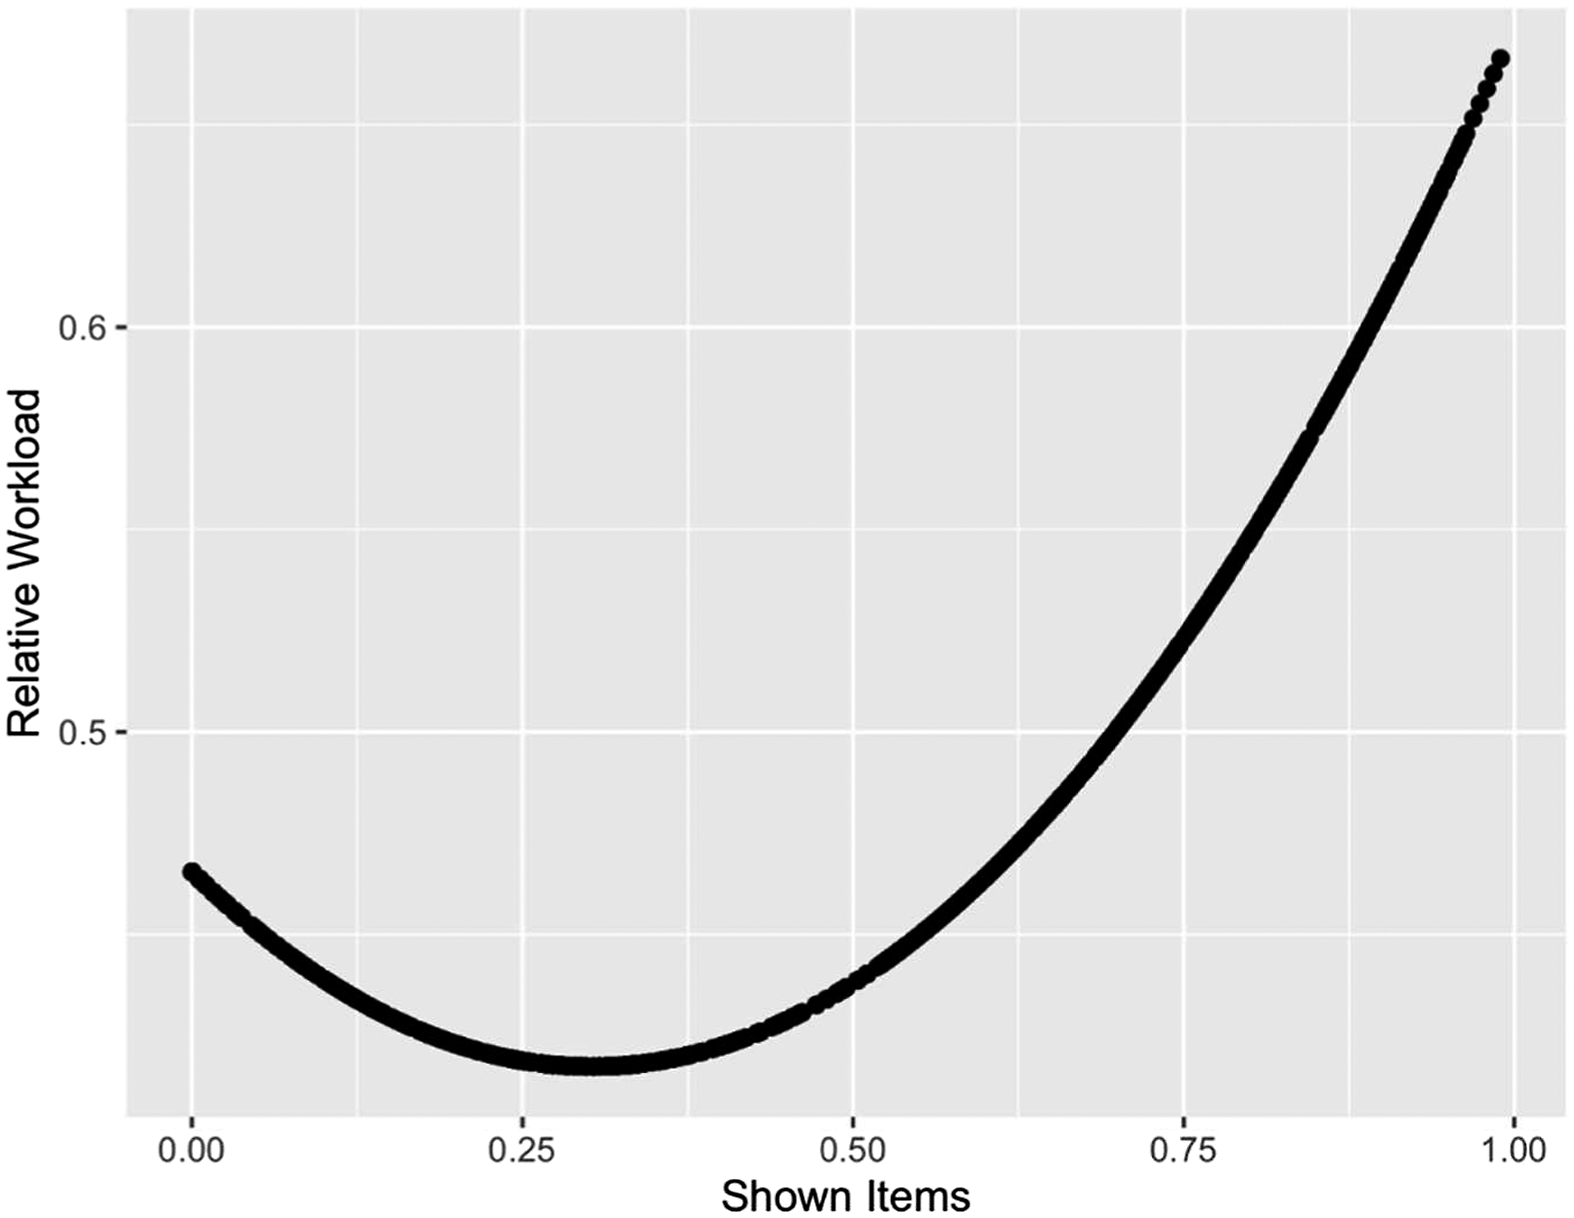
Following the guidelines of Eisler and Meyer (2020) on visual analysis of ML models, Figures 8 and 9 illustrate the marginal effect of the information clutter on the SW, based on the GLMM that includes a degree-26 orthogonal polynomial representation of time and degree-4 polynomial representation of the information clutter. The polynomial degrees were chosen based on BIC comparisons of clutter and time degree combinations. The figure represents the coefficients’ contribution to the expected average SW, i.e., each data point represents the marginal contribution to the cognitive workload (Y-axis) of a given information clutter level that was observed in the experiment (X-axis). Figure 8 illustrates this for each stage separately. While the marginal effect of Stage I decreases the SW with higher percentages of shown items, the effect of Stage II increases the SW with higher percentages. Figure 9 illustrates the analysis for both stages combined, by aggregating the marginal contributions of Stage I and Stage II. When analyzing for the two stages together, the information clutter’s effect increases the SW, similarly to Stage II. The expected relative workload as a function of the percentage of the number of items being shown, for analysis of each stage. The Y-axis represents the contribution of the shown items’ coefficient to the overall scaled workload (SW). The expected relative workload as a function of the percentage of the number of items being shown, for both stages combined.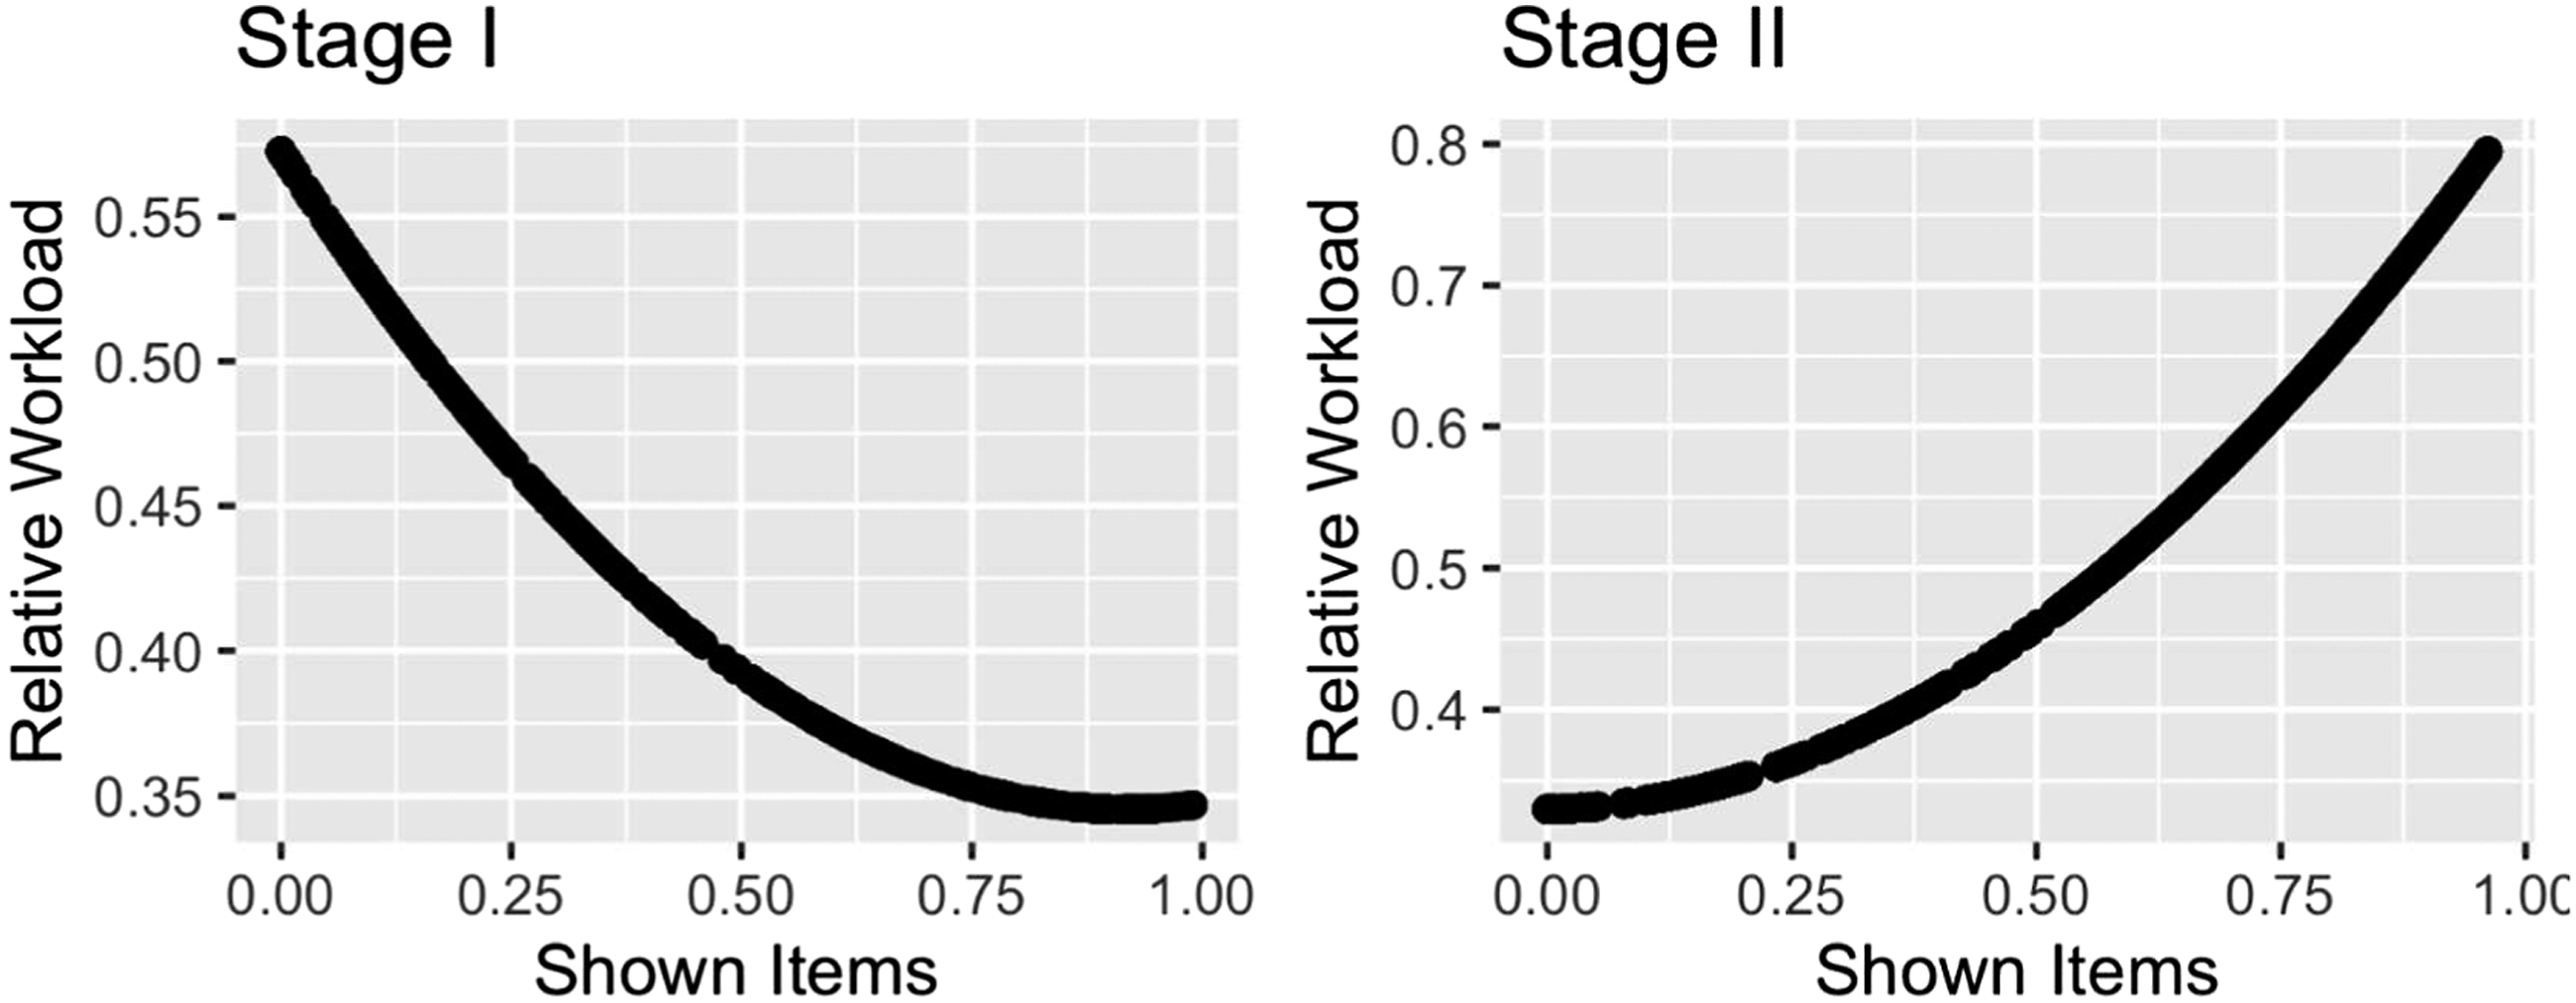
5. Discussion
Answering Adams’ (2015) call to consider the cognitive aspects of UAV operation in the development of systems, and Shneiderman’s (2020) call to build the AI around the human, we provide here a demonstration of an AI-based intelligent filter, its implementation and an empirical evaluation of how this implementation affects operators’ workloads in real time. Specifically, we are addressing the problem of information overload in C2 maps and how it affects the work of micro-UAV operators. Two distinctive GiCoMAF filter protocols were explored relative to a no-filter control, in two experimental stages: protocol “1,” which showed more information items within the operator’s AOI, and protocol “2,” which showed less information items within the AOI but more information items in its periphery. Six experienced and professional micro-UAV operators participated in the empirical evaluation, and we translated their SWAT scores into an ML model (SWAT-RT) of joystick movements during the scenario.
Analyzing the expected workload results in Figure 6 and Table 3, it is evident that Stage I results are not entirely statistically significant. Hence, the difference between running the scenario with filter protocol “1” or no filter was negligible. Moreover, the marginal difference between “None,” “1,” and “2”, although statistically significant, is not large. The statistical insignificance of filters “None” and “1” in Stage I can also be attributed to the low number of participants, especially given that the crossover design could not be completed as one participant’s cognitive workload could not be modeled. It should be noted that the low number of participants does not undermine the validity of the results, as that validity was controlled by the confidence level. It can, however, indicate that there are additional insights that could be learned if more results were collected.
Alternatively, the differences between stages may indicate that, during the first scenario, participants were indifferent to the filter protocol presented to them. Therefore, it is important to learn the possible reasons for this indifference. Figure 6 portrays the information clutter of each filter protocol. While the information clutter in no-filter trials is the highest, the information clutter of filter protocol “1” is lower than the information clutter of protocol “2”. Together with the results (Table 3), it is evident that in Stage I participants preferred marginal numbers of information items, and in Stage II they preferred lower numbers of information items. Following this observation, Figure 8 illustrates the relationship between information clutter and relative workload for each stage. In Stage I, this relationship is negative, that is, after a peak at a relatively low number of information items, more items decrease the workload. On the other hand, the relationship in Stage II is positive, that is, after a minimal point at a relatively low number of information items, the workload becomes higher as more information items are shown to the participant. Looking at Figure 9, where the data is analyzed without distinction between the stages, relative workload reduces between information clutter levels of 0% and about 30%, and then increases. Thus, operators require the filter to distil information clutter to an exact marginal number of items. Two insights arise from Figures 8 and 9. First, in Stage I, operators require more information items, and second, the effect of Stage I is minor relative to Stage II. Hence, operators’ preferences for higher information clutter in Stage I are negligible. This may indicate the effect of a confounder: participants’ fatigue. Thus, in the beginning, when participants are alert, they have a higher resource supply and they can process more information items. However, as the mission continues, participants show signs of fatigue and can process less information. Thus, they need the C2 map filter to reduce information clutter.
It has been shown before that fatigue may increase cognitive workload (Liu et al., 2013) and reduces the quality of SA (Endsley, 2000; Ockerman et al., 2012). The results of this study support the notion that fatigue reduces the available cognitive resources for information processing, and the ability of the operators to handle information overload. However, as illustrated in Figure 8, a lack of capacity to process larger amounts of information at higher fatigue levels does not necessarily call for showing as few information items as possible. If the C2 map does not provide an overview of the environment, as required by the operator, he may need to seek other information sources to complete the picture, which may cause even higher cognitive workload and possibly lower SA. This corresponds to the supply-and-demand relationship associated with mental workload and performance by Young et al. (2015), where task demand increases due to missing information, and supply decreases due to fatigue. Moreover, the behavior of the joint stages in Figure 9 corresponds to the U shape of the workload and task demand relationship of de Waart (1996). According to de Waart, workload decreases as task demand increases, until it reaches a plateau, and then increases again when task demand approaches its peak value. Similarly, the “comfortable” information clutter is within the midrange, whereas extremely high or low clutter levels cause higher workloads. Moreover, performance has an inverse U shape in relation to task demand—thus, it increases up to a plateau as the demand increases, and then decreases again as task demand approaches its peak. According to Figure 9, showing extremely high or low information clutter may have negative effects on operators” SA.
Having SA of the environment is important to avoid unfortunate consequences, as in Afghanistan, 2010 (Filkins, 2010; Shanker & Richtel, 2011). Therefore, the exact number of required information items may be higher than the minimum, and the characteristics of the information items shown should be carefully chosen. Given the fact that GiCoMAF relies on stochastic ML models, ethical issues are raised about which is the less bad approach. Should one show all information items consistently, without losing any important information items but inadvertently increasing workload and reducing SA at higher fatigue levels? Or should an intelligent filter be used to reduce information clutter, thus requiring less cognitive resources and reducing workload, but with the risk of losing important information items and having poorer SA? The key to these questions can be to adjust the filter protocol to the operator’s state of mind. Thus, the filter protocol now becomes dependent not only on the UAV type, mission type, and the organizational procedures, but also on operators’ fatigue state and relative cognitive workload. Moreover, the quality of information items has to be further investigated. It should be kept in mind that the algorithm’s accuracy is only about 75% (according to Zak et al., 2020a, 2020c), although this is within what is considered to be high human preference prediction accuracy (Agichtein et al., 2016; Guimerà et al., 2012). Therefore, to address the ethical issues empirically, the experiment should be repeated with a robust schema for SA measurement.
6. Conclusions and Limitations
The information overload of C2 maps concerns many military forces. It is especially relevant to UAV operators, as they must use the C2 map to develop SA while their focus is on the payload’s feed. Common filtering mechanisms allow operators to filter the map based on information layers, which causes an information trade-off. GiCoMAF is an intelligent filter intended to solve information overload by automatically and dynamically filtering each information item on the C2 map individually, based on its environmental context. This study aimed to evaluate the application of two filter protocols for GiCoMAF, in terms of how they affect operators’ workloads. The results are encouraging. To an extent, the algorithm was able to reduce participants’ cognitive workload. The workload reduction was statistically significant, especially when operator fatigue accumulated (in stage II of the mission). When alert, participants can process more information, and therefore the marginal effect of the intelligent filter was smaller. Moreover, filtering the C2 map when participants are alert may even negatively affect operators’ cognitive workloads.
The study has limitations. First, statistical insignificance can be attributed to the low number of participants, and more experimental runs should be executed. Second, the study raised ethical issues about the use of stochastic models in the decision of how much information should be shown to an operator whose decisions may have fatal consequences—in particular, the trade-off between increasing workload and reducing SA by showing all information items (not losing any important items), and decreasing workload by reducing the information clutter but (in doing so) potentially reducing SA due to the unshown information items. Therefore, a more thorough study of the algorithm’s effect on operators’ SA, using robust measures, should be performed. Third, the study relies on the SWAT-RT technique that cannot provide deep insights on the cognitive skills required by the participants. Repeating the experiment with additional techniques, like NASA-TLX, is advised. Fourth, the algorithm should be tested in additional evolving scenarios and other simulation environments, varying in mission type, UAV type, organization, etc.
Confirmation of the algorithm’s abilities to assist human operators with their work can be further generalized to other work domains where spatial-temporal information should be filtered based on context, for example, other military domains, police command-and-control, search-and-rescue missions, information-guided surgery, etc. Practically, this study should encourage developers of military UAV applications to consider integrating an implementation of the GiCoMAF algorithm relevant to their product and customers. More broadly, developers of human involved systems that are prone to information overload should focus on the human in the loop and consider integrating AI-based algorithms to assist the human’s work. This can be applied for airspace systems to allow better integration of information and support air traffic control. Our work demonstrates the potential for integration of artificial intelligence while addressing in real time human cognitive performance in complex systems. Lastly, recently we showed that UAV operators can benefit from information aids in the in form of visualizations of spatial and temporal patterns-of-life (Zak et al., 2021). In future work, we propose to look at how intelligent filtering can be combined with more sophisticated spatial-temporal visualizations to make the information even more available.
Footnotes
Acknowledgments
This research is partially funded by the “Negev” scholarship, and by the George Shrut Chair in Human Performance Management at Ben-Gurion University of the Negev. Corresponding author—Yuval Zak,
Key Points
• Unmanned Aerial Vehicle (UAV) operators work in dynamic environments, using command-and-control (C2) maps to develop their situation awareness (SA). • C2 maps are overloaded with information, which should be filtered at the level of individual information items. • Two filter protocols for GiCoMAF, a Gibsonian automatic and dynamic intelligent filter, were developed and empirically evaluated with ex-military UAV operators as participants. • Results show that the algorithm has the potential to reduce the operators’ cognitive workloads, especially when fatigue accumulates. Further studies of the effects of the algorithm on the operators’ SA are required. • The algorithm can be further generalized to other domains where spatial-temporal information should be filtered based on context: military, police, command-and-control, search and rescue, information-guided surgery, etc.
Yuval Zak holds a Ph.D. from the Department of Industrial Engineering and Management at Ben-Gurion University. Corresponding Author.
Yisrael Parmet is an associate professor at the Department of Industrial Engineering and Management at Ben-Gurion University. He received his Ph.D. in 2000 from Tel-Aviv University.
Tal Oron-Gilad is a full professor and the Chair of the Department of Industrial Engineering and Management at Ben-Gurion University. She received her Ph.D. in 2003 from Ben-Gurion University of the Negev.