
Abstract
Objective
In two experiments, we examined how quickly different visual alerts on a head-worn display (HWD) would capture participants’ attention to a matrix of patient vital sign values, while multitasking.
Background
An HWD could help clinicians monitor multiple patients, regardless of where the clinician is located. We sought effective ways for HWDs to alert multitasking wearers to important events.
Methods
In two preclinical experiments, university student participants performed a visuomotor tracking task while simultaneously monitoring simulated patient vital signs on an HWD to detect abnormal values. Methods to attract attention to abnormal values included highlighting abnormal vital signs and imposing a white flash over the entire display.
Results
Experiment 1 found that participants detected abnormal values faster with high contrast than low contrast greyscale highlights, even while performing difficult tracking. In Experiment 2, a white flash of the entire screen quickly and reliably captured attention to vital signs, but less so on an HWD than on a conventional screen.
Conclusion
Visual alerts on HWDs can direct users’ attention to patient transition events (PTEs) even under high visual-perceptual load, but not as quickly as visual alerts on fixed displays. Aspects of the results have since been tested in a healthcare context.
Application
Potential applications include informing the design of HWD interfaces for monitoring multiple processes and informing future research on capturing attention to HWDs.
Keywords
Introduction
There are many contexts that require individuals to monitor multiple processes while they perform other tasks, including tasks that move them away from conventional displays. In the field of healthcare, our focus in this paper, nurses and physicians often monitor the vital signs of single or multiple patients while carrying out various care tasks. In such situations, a small monocular head-worn display (HWD) could make the information to be monitored—patients’ vital signs—continuously available to the wearer, regardless of their location. However, previous research indicates that there can be limitations in people’s ability to detect important changes on an HWD while they perform other tasks (Liu et al., 2009a; Pascale et al., 2018). This could result in vital sign events being missed, with potentially adverse consequences for the patient. A key question is how to ensure such events are not missed, while not burdening the participant with stimulation. In this paper, we report two laboratory-based experiments with patient monitoring tasks that test how efficiently and reliably different kinds of signals might redirect the wearer’s attention from an ongoing task to changes in a patient’s vital signs displayed on an HWD.
The Attention Management Challenge
In many hospital settings such as emergency departments or high dependency units, clinicians must attend to immediate tasks such as administering medications, managing wound dressings, or writing care summaries, while at the same time maintaining a general awareness of the well-being of several patients who may be under their care. However, information about patients’ vital signs is often distributed across different displays in different locations, or it is integrated on a central display in one location. As a result, clinicians could potentially benefit from wearable technology, such as an HWD, that could make patient vital sign information continuously available for inspection while they move around and carry out immediate tasks. HWDs used to date for this purpose have been monocular HWDs conveying information on a small screen positioned slightly in the periphery of vision.
A clinician using an HWD would need to timeshare their immediate tasks with checks of the patient vital sign information on the HWD display. Attention management during monitoring therefore becomes a concern (Moray, 1976, 1986). If the clinician must remember to look frequently at the HWD display to check their patients’ well-being it may interrupt their ongoing tasks, whereas if the clinician focuses mostly on the ongoing task then clinically significant changes on the HWD may be missed. A key question is what kind of visual signals can be designed that attract the clinician’s attention reliably only when needed and that preserve the clinician’s ability to perform ongoing tasks safely and effectively.
Benefits and Challenges of HWD-Based Patient Monitoring
Most prior research has focused on the use of HWDs to provide imagery and augmented reality support during surgery (Rahman et al., 2020). However there is also considerable interest in using HWDs to display a patient’s vital signs—see the recent reviews by Elrose et al. (2021) and Andrade et al. (2021). For single-patient monitoring, HWDs can help clinicians detect patient deterioration faster and look directly towards the patient for longer than when they rely on external monitors alone (Liu et al., 2009b, 2010, 2009c)
Outside the operating room, clinicians may need to track the status of multiple continuously monitored patients. Nurse:patient ratios can run to 1:4 in some acute care units (Aiken et al., 2010) and in closed-model intensive care units, where in-house staff intensivists manage care, physician:patient ratios may run to 1:7 or greater (Ward et al., 2013). Moreover, patients are often in separated rooms or bays, reducing the clinician’s ability to see multiple patients directly (Donetto et al., 2017). Equipment supporting continuous vital sign monitoring of multiple patients can help clinicians make quicker interventions and can lead to better patient outcomes than intermittent bedside checks (Brown et al., 2014; Schmidt et al., 2015; Watkins et al., 2016), but vital signs are usually displayed either on bedside monitors or on a central monitoring station at a fixed location. Continuous monitoring delivered via an HWD could help clinicians care for multiple patients who are not always in view.
Several laboratory- or simulation-based studies have explored whether HWDs with a continuous representation of patient vital signs can help participants monitor multiple patients. For example, Klueber et al. (2019) showed that participants using an HWD with no auditory signals could identify the status of any of five patients more accurately than participants relying on intermittent auditory signals alone. Similarly, Pascale et al. (2019) showed that participants wearing an HWD and hearing alarms could use the HWD information to make intervention decisions more accurately and 26% faster than participants who simply heard alarms. Participants wearing the HWD could use the information displayed on the HWD to determine whether the alarm required a response or not, thereby improving how they prioritised their responding. Finally, in a high-fidelity simulation study, Kuge et al. (2021) showed that anaesthetists wearing an HWD could manage the care of a simulated patient while also supervising the management of five further simulated patients in remote locations. Until now, however, little attention has been paid to the best way of attracting the user’s attention to the HWD without resorting to auditory or vibrotactile alerts.
Capturing Attention Visually with Head-Worn Displays
In many contexts, visual signals have been developed to attract attention to an important change in the visual field, while preserving the user’s ability to handle ongoing tasks. For example, Saint-Lot et al. (2020) tested four alternative visual means for attracting an air traffic controller’s attention to a breakdown of separation between aircraft, and found a solution that reliably attracted attention without compromising accuracy on an ongoing task. In principle, visual signals on an HWD could support attentional shifts that are exogenous (rapid, involuntary shifts of attention to a triggering stimulus) as opposed to endogenous (slower voluntary shifts of attention driven by expectations or goals) (Folk et al., 1992; Theeuwes, 1994). In recent work, Cobus and Heuten (2019) mounted arrays of LED lights on the frame of glasses to capture attention exogenously when activated; the colour and patterning of the activation indicated the direction and urgency of a change in vital signs. However, high-resolution HWD screens can present information that is more detailed. The question remains of whether visual stimuli presented on high-resolution HWD screens will reliably attract attention through exogenous means.
Changes within the HWD image may sometimes fail to attract attention exogenously due to the small size of the HWD displays most commonly tested in clinical environments and the placement of the HWD image in peripheral vision. Some visual stimuli are less noticeable on an HWD than on a conventional computer monitor. Specifically, compared with participants using a monitor, participants wearing a HWD were less likely to notice (a) changes in carbon dioxide waveforms (Liu et al., 2009c), (b) changes in the orientation of lines, especially with low contrast stimuli and in peripheral vision (Pascale et al., 2018), and (c) the presence of the number 0 among instances of the letter O (Huckauf et al., 2010).
At face value, the above findings suggest that visual stimuli on HWDs might not capture the wearer’s attention as reliably as when they are on other display media, or as reliably as the wearer might expect. If this were always the case, it would have significant implications for the usability of HWDs in patient monitoring environments, where there can be grave consequences to delayed or absent responses to patient alarms. However, the displays used on the HWDs in the studies reported in the previous paragraph were not designed to attract attention reliably. In the studies reported herein, we sought visual stimuli that would reliably attract attention to the HWD and on which the user would come to depend. An HWD showing patient vital signs would be useful if its display could reliably capture attention exogenously, while providing a rich context within which to interpret any abnormal vital signs and preserving the user’s ability to carry out their ongoing tasks.
Program of Research
The research described here consists of two laboratory experiments that investigate how visual alerts presented on an HWD capture the attention of non-clinician participants who are simultaneously engaged with a visuomotor tracking task. In each experiment, the HWD displayed a matrix of numbers representing multiple patients’ vital signs. When the numbers transitioned between clinically relevant ranges (henceforth referred to as patient transition events; PTEs), attention was drawn to the display through various means. The primary outcome of each study was participants’ average latency to respond to PTEs, which was likely to be a sensitive measure of whether attention was being attracted exogenously to a change on the display.
Experiment 1 compared the effectiveness of adding low or high contrast greyscale highlights to abnormal values presented on the HWD while participants were under different levels of perceptual load imposed by a concurrent manual tracking task. Experiment 2 investigated how well a white flash of the entire screen shifted attention to abnormal values on either an HWD or a fixed screen. The experiments were designed individually within our program of research, so there are methodologic differences between them that will be noted. In both experiments participants were non-clinicians, given that the experiments were preclinical studies in which we were concerned with detection and identification tasks that did not require clinical knowledge.
Experiment 1: Comparing Low or High Contrast Highlights Plus Easy or Hard Tracking Task
In Experiment 1, we explored whether high contrast highlights of abnormal values would lead to faster responses to patient transition events (PTEs) than low contrast highlights. In previous research using abstract stimuli, we found a greater drop-off in detection accuracy for stimuli in the periphery of the visual field (24.3o to 27.8o of visual angle from the fovea) on HWDs than on a screen, but high contrast stimuli on the HWD partly compensated for this effect (Pascale et al., 2018). Accordingly, in Experiment 1, we compared a low versus high level of visual contrast to see whether an advantage for high contrast highlights also emerged for signalling abnormal vital signs on an HWD.
We added a perceptual-motor ongoing task, so that the participant’s attention would usually be directed away from the HWD. Manual tracking represents manual tasks that a clinician might perform such as setting up infusion pumps, inserting vascular lines, or changing dressings. The manual tracking task also engages visual attention and manual responding on a continuous basis, providing sensitive measures of performance that can indicate when attention is drawn away from the HWD. There are at least two lines of evidence suggesting that more difficult manual tracking tasks should reduce the detection of visual events such as abnormal vital signs. First, perceptual load theory predicts that high perceptual load inhibits intrusions from task-irrelevant events, or distractors (Lavie, 2005; Lavie et al., 2014). In our experiments, the ‘intrusions’ are from task-relevant events (abnormal events) and no task-irrelevant events exist, but perceptual load might still inhibit detections. Second, and possibly more cogently, sampling theory predicts that as manual tracking becomes more difficult, it requires more frequent visual attention if the participant is to compensate for a tracking error that is likely to grow faster and require larger corrective action (Eisma et al., 2018; Sheridan, 1970) – visual attention that would otherwise be directed towards abnormal event detection. Therefore, we tested whether different levels of difficulty of the perceptual-motor task would affect participants’ ability to detect PTEs. Figure 1(a) shows the task setup and the HWD monitoring interface displayed in the high contrast (Figure 1(b)) and low contrast (Figure 1(c)) conditions. The hypotheses were as follows. (a) Example of setup for Experiment 1 with participant wearing the Vuzix M100 HWD. The participant positioned the HWD so that its image fell just below the tracking task screen. The tracking task controller comprised the graphics tablet and stylus. At right are screens with examples of (b) high contrast between highlights and background and (c) low contrast between highlights and background. In each case, a filled box indicates crisis level, and a border indicates warning level.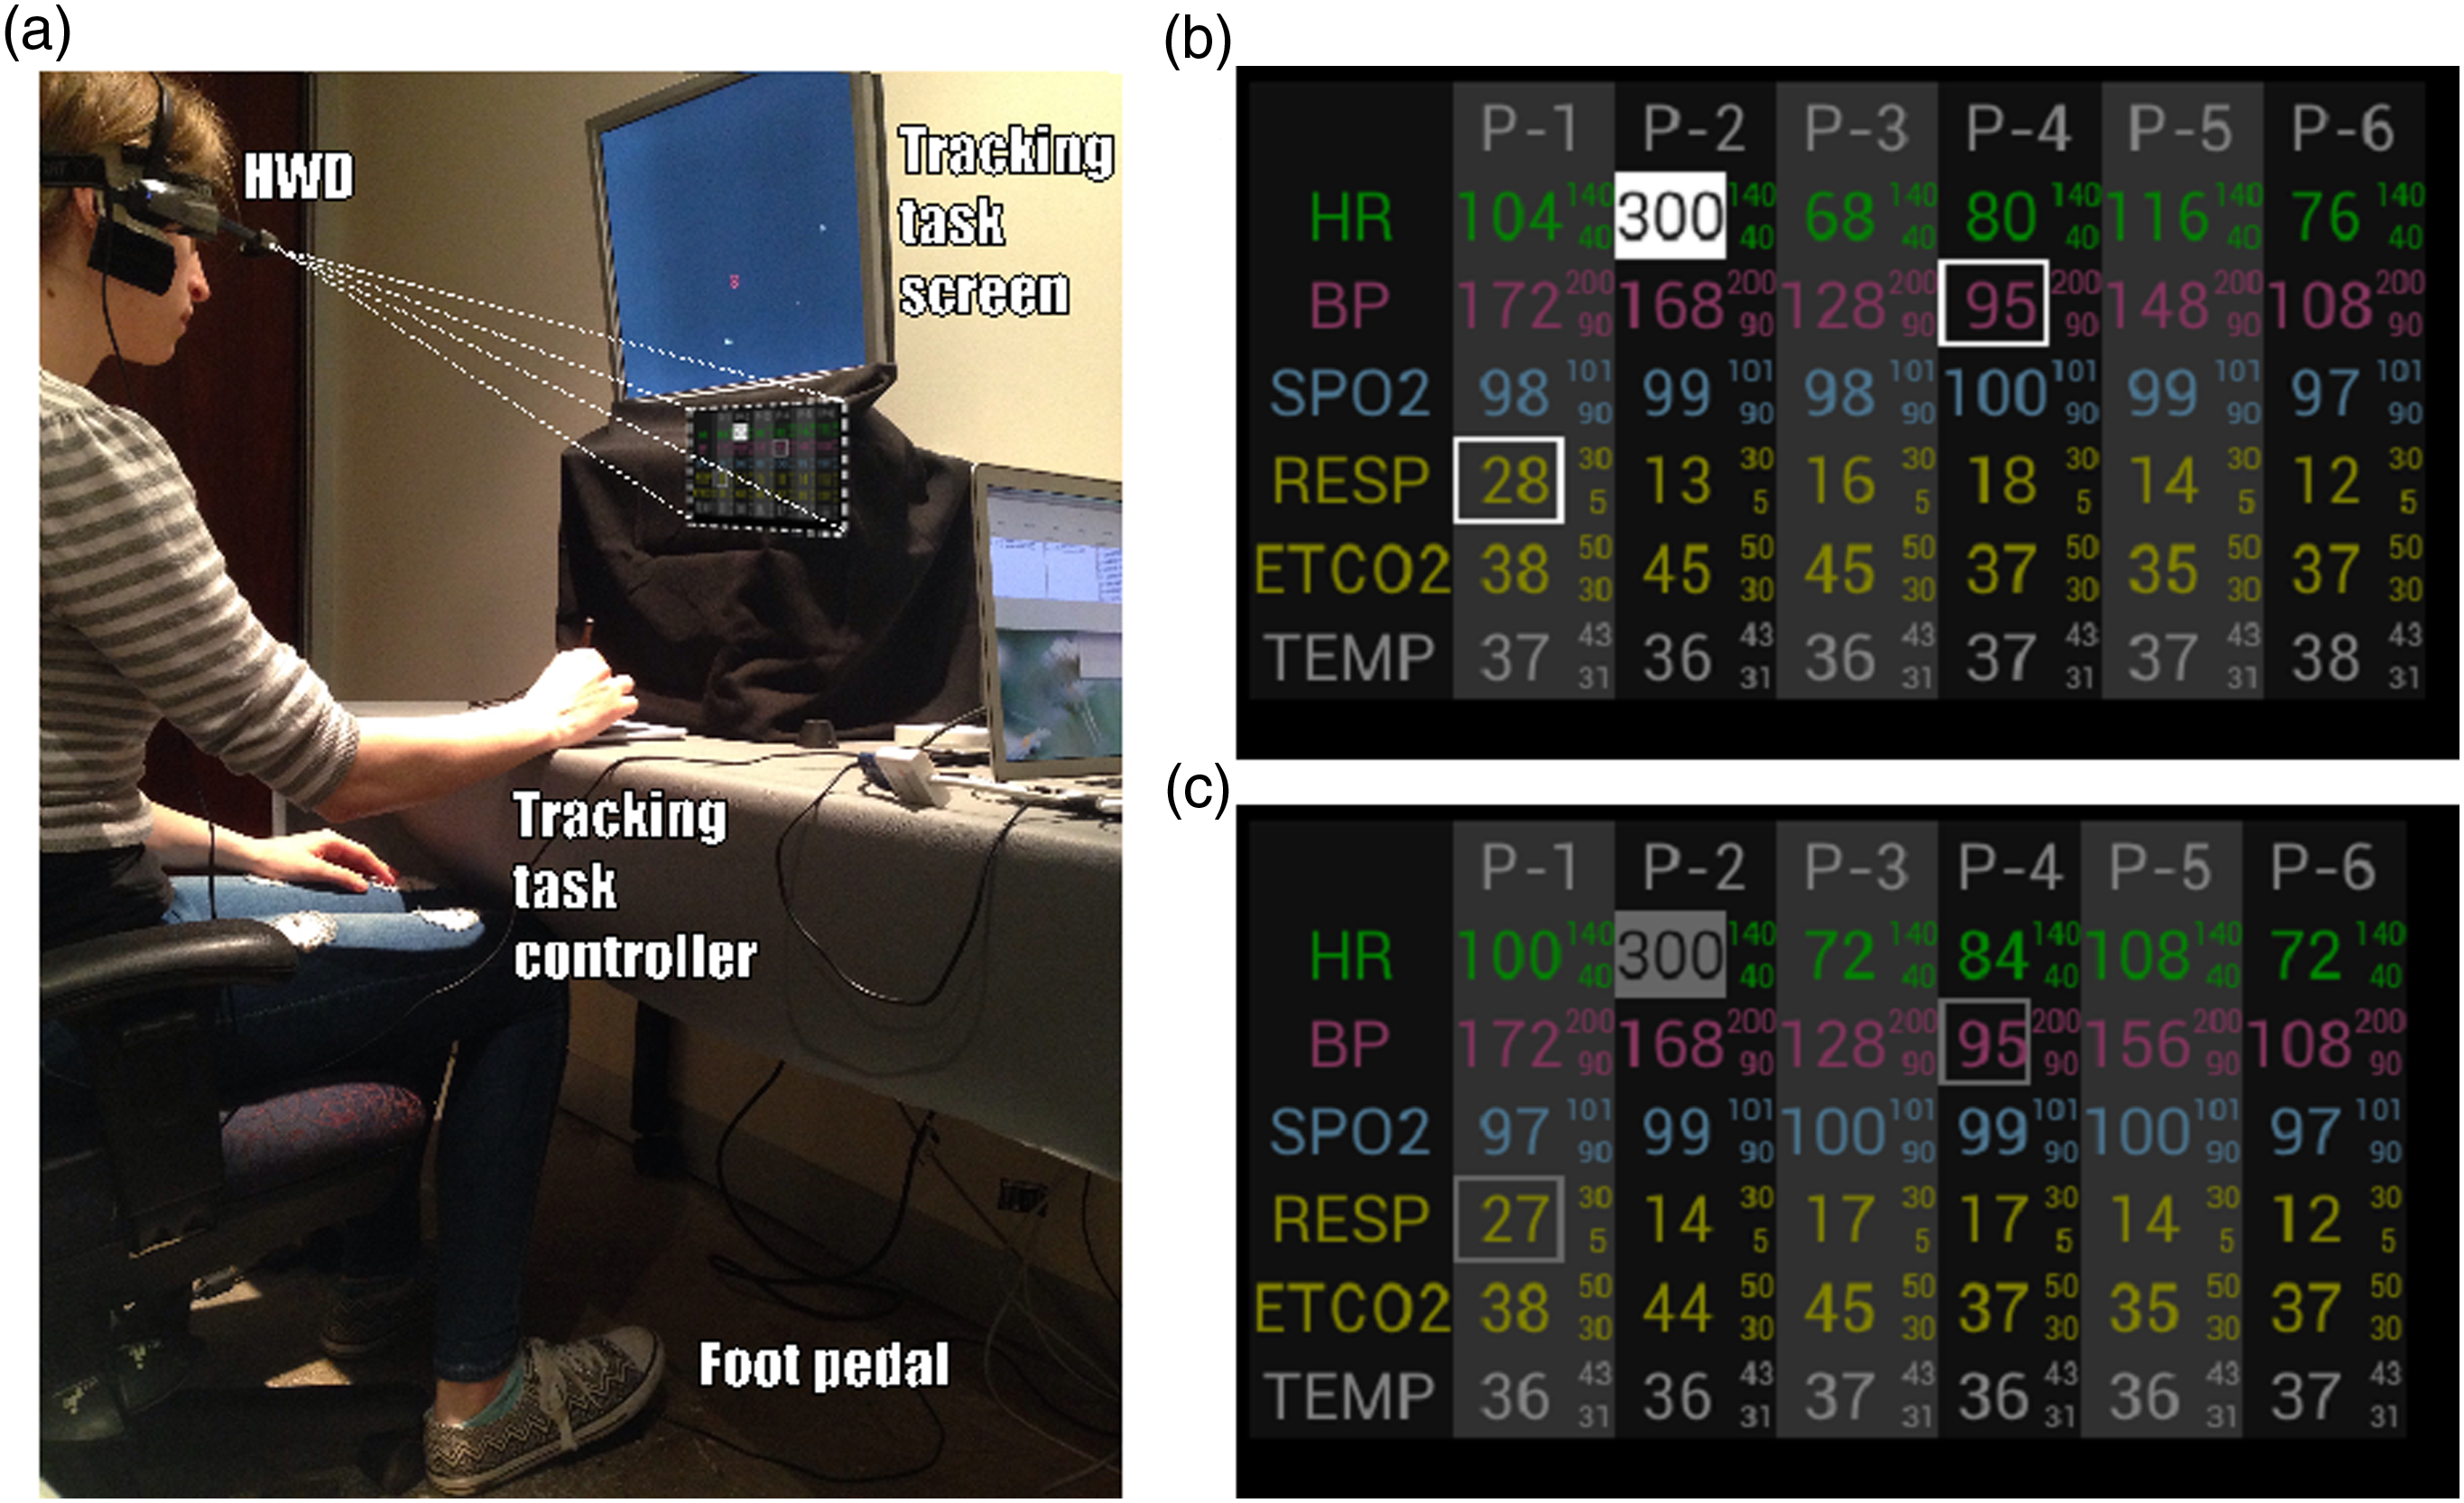
H1: Participants will respond to PTEs faster in the high contrast rather than in the low contrast highlights condition, given the results of Pascale et al. (2018).
H2: Participants will respond to PTEs faster while doing the easy rather than the difficult tracking task, given that they will need to monitor the easy tracking task less closely and can therefore sample the HWD image more frequently (Eisma et al., 2018; Sheridan, 1970).
H3: Participants will perform better on the tracking task in the high contrast condition than in the low contrast condition, assuming that the more noticeable high contrast allows them to depend more on exogenously driven attention shifts to the HWD screen and less on potentially disruptive endogenously driven sampling of the HWD screen (Klueber et al., 2019).
H4: Participants will perform better on the tracking task while doing the easy rather than the difficult tracking task because the slower frequencies and lower amplitudes of easy tracking will allow the participant to stay on target more of the time (Eisma et al., 2018; Sheridan, 1970).
Methods
Design
The experiment used a mixed factorial design, with one between-subjects variable (PTE highlight contrast: low, high) and one within-subjects variable (Tracking task difficulty: low, high). Each participant was allocated at random (via ‘cards out of a hat’ procedure, without replacement) to either the low contrast or the high contrast highlight condition. Every participant performed both the low and high tracking difficulty conditions, the order of which was counterbalanced to control for asymmetric transfer. In each of four 6-minute scenarios of simulated vital sign changes, there were 20 PTEs that occurred either 15 s or 20 s apart.
Participants
Participants were undergraduate psychology students recruited from The University of Queensland. They were all required to have normal or corrected to normal vision without glasses because the HWD apparatus used did not fit over glasses. They were also required not to have participated in any previous HWD studies conducted by the present research group. Participants gave written informed consent prior to participation and were reimbursed with course credit. Ethical clearance for this study was granted by The University of Queensland’s School of Psychology ethics committee (approval number 16-PSYCH-4-121-JH).
Tasks and Materials
The experimental setup is shown in Figure 1. A monocular opaque HWD (Vuzix M100; Vuzix Corporation, West Henrietta, NY) was used to display the patient monitoring task to the participant’s right eye. The Vuzix HWD was used because it is a market leader in its class and because its opaque display creates images with better definition against the ambient visual environment than optical see-through HWDs do. Participants wore a headband to which the HWD was attached and the HWD was positioned so that its display appeared below the tracking task screen in the participant’s field of view (see Figure 1(a)). The visual angle between the tracking task target and the HWD image was between 10o and 35o depending on the location of the moving target on the tracking screen.
The HWD showed six vital signs for each of six simulated patients (see Figures 1(b) and 1(c)). The vital signs were heart rate, mean blood pressure, blood oxygen saturation, respiratory rate, end-tidal carbon dioxide, and temperature. The values of the vital signs were updated every 2 s, and they moved in a physiologically plausible manner, including slight random variation. Each vital sign had its own predefined target and abnormal ranges. These ranges were very high, high, target, low, and very low. Participants were not required to remember the numerical values associated with ranges because they were always associated with a highlight.
Vital sign values were highlighted with a cell border when in the low or high (‘warning’) ranges, and with a background fill when in the very low or very high (‘critical’) ranges, as seen in Figures 1(a) and 1(b). In the low contrast condition, the highlights were grey (luminance 13.65 cd/m2) whereas in the high contrast condition the highlights were white (69.89 cd/m2). The background was black (5.77 cd/m2) in both conditions.
Participants responded to PTEs by tapping on a foot pedal and then vocally stating the PTE details (patient, vital sign, and range). In this experiment, vital sign changes were considered to be PTEs when they entered an abnormal range or transitioned from one abnormal range to a more severe one, for example, from low to very low. Latency to respond to each PTE was measured from the start of the PTE to the moment of the foot pedal response. PTEs were recorded as missed if there was no foot pedal response between the PTE’s onset and the start of the next PTE, meaning participants had a response window of 15 or 20 s. The data collected from vocal responses could not be analysed due to technical difficulties.
In the tracking task, a small circle (the target) moved around a separate computer screen, following an invisible track created as described in the next paragraph. Participants used a Wacom Intuos Small tablet (Wacom Co. Ltd., Kazo, Japan) and a stylus to keep a cursor inside the target, at which point the target would turn green. The trackpad was in ‘pen mode’, so that there was a one-to-one mapping between stylus position and screen position. The tracking task screen was a 19” Samsung monitor (Samsung, Seoul, South Korea), positioned in front of black drapes to minimise background interference with the HWD image from high contrast elements in the test room environment.
Two levels of difficulty in the tracking task were created by manipulating the frequency and amplitude of 10 sine functions summed and presented in the X axis of the screen plus a further sum of 10 sine functions in the Y axis (see supplemental materials for details), to create the X–Y coordinates for the target. In the high difficulty condition the highest frequency sine function was 1.300 Hz, so that the speed of the target was higher and its path less predictable than in the low difficulty condition, where the highest frequency sine function was 0.537 Hz. The screen’s refresh rate was 50 Hz. Tracking performance was scored as the percentage of time that participants could keep their cursor inside the moving circle, thereby keeping its colour green.
Participants completed the NASA-TLX measure of subjective mental workload (Hart & Staveland, 1988) separately for the monitoring task and tracking task. The purpose was to determine whether conditions intended to be more difficult were experienced as such. Participants also completed Likert-type questions about task difficulty and answered open-ended questions about the strategies they had used to do the task.
Procedure
After giving written informed consent, participants were instructed how to do each task and were fitted with the HWD. They completed 13 minutes of practice, which included performing the monitoring and tracking tasks both individually and together. Before the main experimental blocks, participants were told “You should only focus on the monitoring task when you notice a patient go into a warning or critical state. Remember to press the foot pedal once and tell me the patient number, vital sign, and alert type. You should continue to work on the tracking task as you do this.”
Participants then completed the four 6-minute test blocks, all at the highlight contrast level to which the participant had been assigned. For two blocks the tracking task difficulty was high, and for the other two blocks it was low. After each block, participants completed the NASA-TLX and questionnaires asking about the degree to which they depended on the HWD visual alerts (an exogenous strategy) or remembering to check the HWD (an endogenous strategy), and how they balanced their attention between monitoring and tracking. Upon completion participants were thanked for their time and reimbursed.
Pilot Study
A pilot study of the above design using the same stimuli and software provided data for a power analysis which indicated we needed a sample size of N = 30 to find effects of visual contrast and tracking load on participants’ response latency to PTEs. The experiment was not powered to find an effect of contrast on tracking task performance (H3), because the pilot study suggested it was probably too weak an effect (d = 0.12) to have relevance. The weakest effect powered for was the effect of tracking task difficulty on participants’ latency to respond to PTEs (H2; d = 0.65) with a power of 0.80 and an adjusted alpha of .0125 (p = .05/4).
Results
Data from 34 participants were included in the analyses (female = 27 (79%), male = 7 (21%), M = 19.71 years, SD = 2.48 years, range = 17–28 years). Data from two further participants were excluded before any analysis was conducted because the participants disclosed during testing that they did not have normal or corrected to normal eyesight. Tests of hypotheses used a Bonferroni corrected alpha of .05/4 = .0125. All other analyses were exploratory and used alpha = .05
PTE Detection Latency
Detection latency was measured from the onset of a PTE to the moment the participant pressed the foot pedal. Each participant’s average PTE response latency was then calculated. As predicted, participants in the high contrast condition responded to PTEs significantly faster (M = 2485 ms, SD = 916 ms) than participants in the low contrast condition (M = 3699 ms, SD = 1141 ms), F(1, 32) = 13.50, p < .001, Experiment 1 results for PTE response latency, showing the 2 × 2 comparison with main effects of highlight contrast (p < .001), tracking (p = .003), and no significant interaction (p = .286). Numbers indicate group means (SD). The horizontal lines are means. Vertical lines are SDs. Grey points are each participant’s mean and light grey bars are within-participant SDs. Results for each participant within a condition have been arranged in ascending order of means to convey an impression of the distributions of latencies.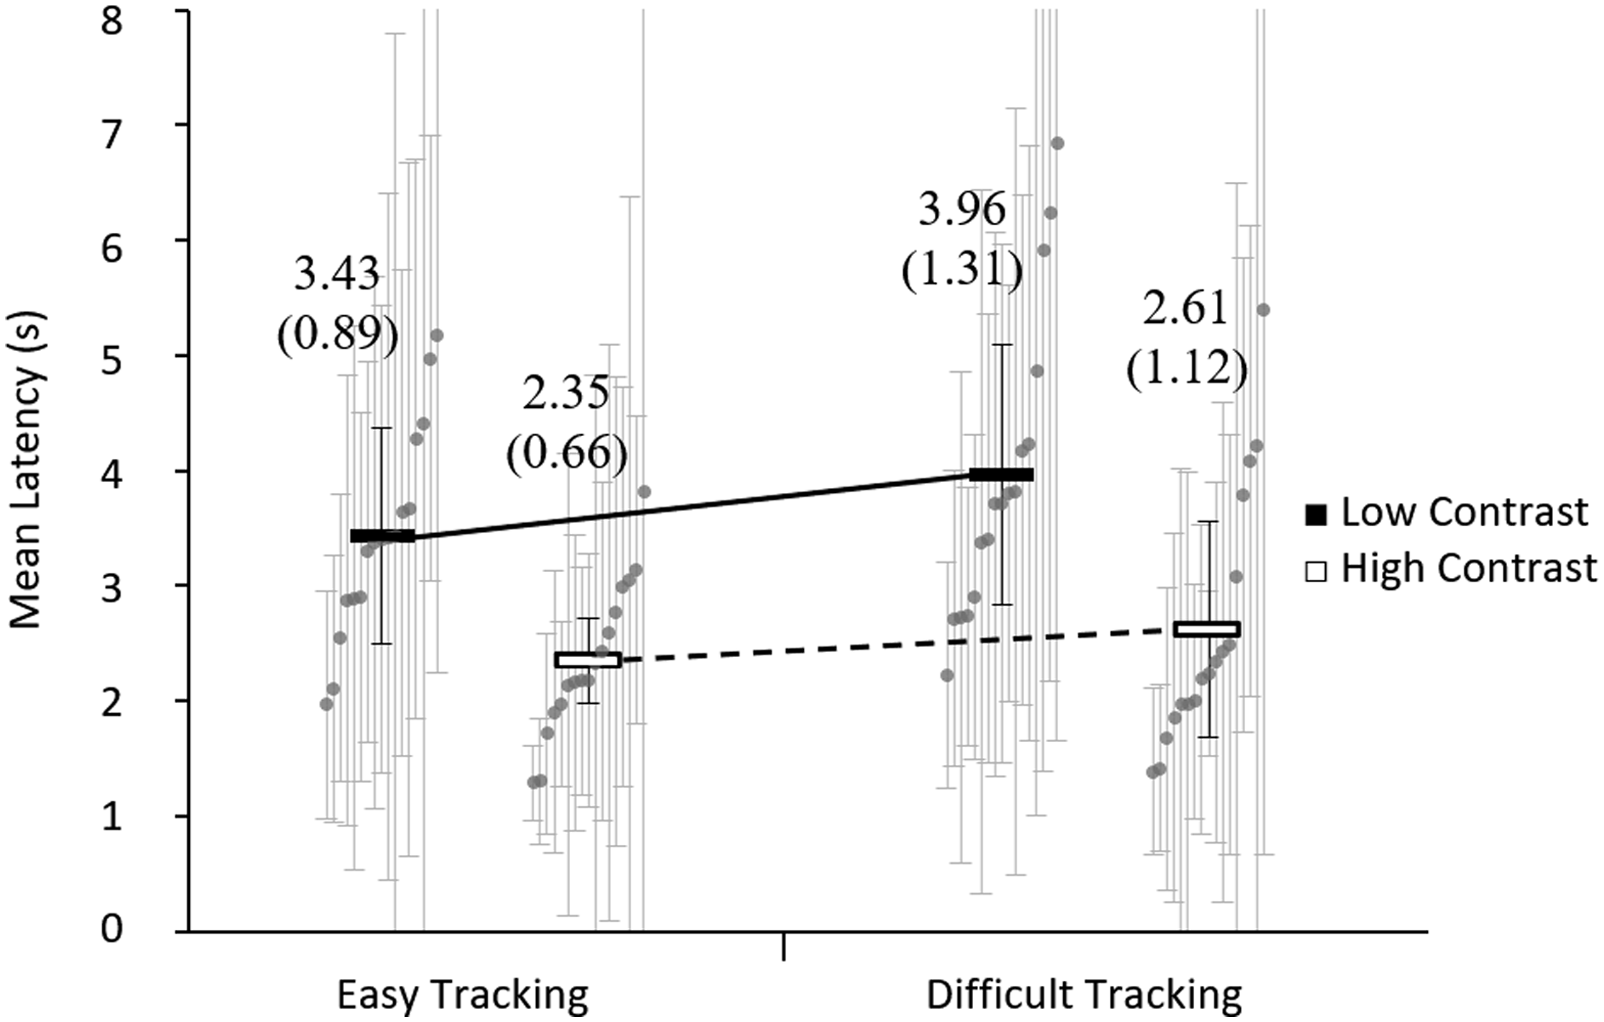
Consistency of PTE Detection Latency
The variability of PTE detection latency indicates how consistently participants responded. Consistently fast responses may be more indicative of exogenous attention capture than a ‘chance-based’ endogenous checking strategy. Post hoc analyses revealed no evidence of an effect of tracking difficulty on the SD of participants’ response latency to PTEs, W = 227, z = −1.21, p =.228, r = 0.21 (Wilcoxon Signed Ranks test). However, participants in the high contrast condition (Mdn = 1695 ms, IQR = 1094–2010 ms) had smaller response latency SDs than those in the low contrast condition (Mdn = 2356 ms, IQR = 1886–3172 ms), U = 204, z = 2.05, p = .041, r = 0.35 (Mann-Whitney U test).
PTE Detection Rate
There was no evidence that participants in the high contrast condition detected more PTEs than participants in the low contrast condition, U = 122, z = −0.2 p =.433 r = 0.14 (Mann-Whitney U test). Nor was there any evidence of participants detecting more PTEs with easy tracking than with difficult tracking, W = 30, z = −1.75, p = .081, r = −0.30 (Wilcoxon Signed Ranks test). The median (IQR) detection rate in the high contrast difficult tracking condition was 100% (95–100%), for high contrast easy tracking 100% (98%–100%), for low contrast difficult tracking 98% (95–100%), and for low contrast easy tracking 98% (95–100%).
Tracking
There was a significant main effect on tracking task performance from both tracking difficulty F(1,32) = 2252.33, p < .001, Experiment 1 results for tracking, showing percentage of time the participant’s pointer was in the green zone. Figure shows main effects of tracking difficulty (p < .001), highlight contrast (p = .034), and significant interaction (p = .007). Numbers indicate group means (SD). The short horizontal lines are means and vertical lines are SDs. Grey points are each participant’s mean. Results for each participant within a condition have been arranged in ascending order of means to convey an impression of the distributions of tracking task scores.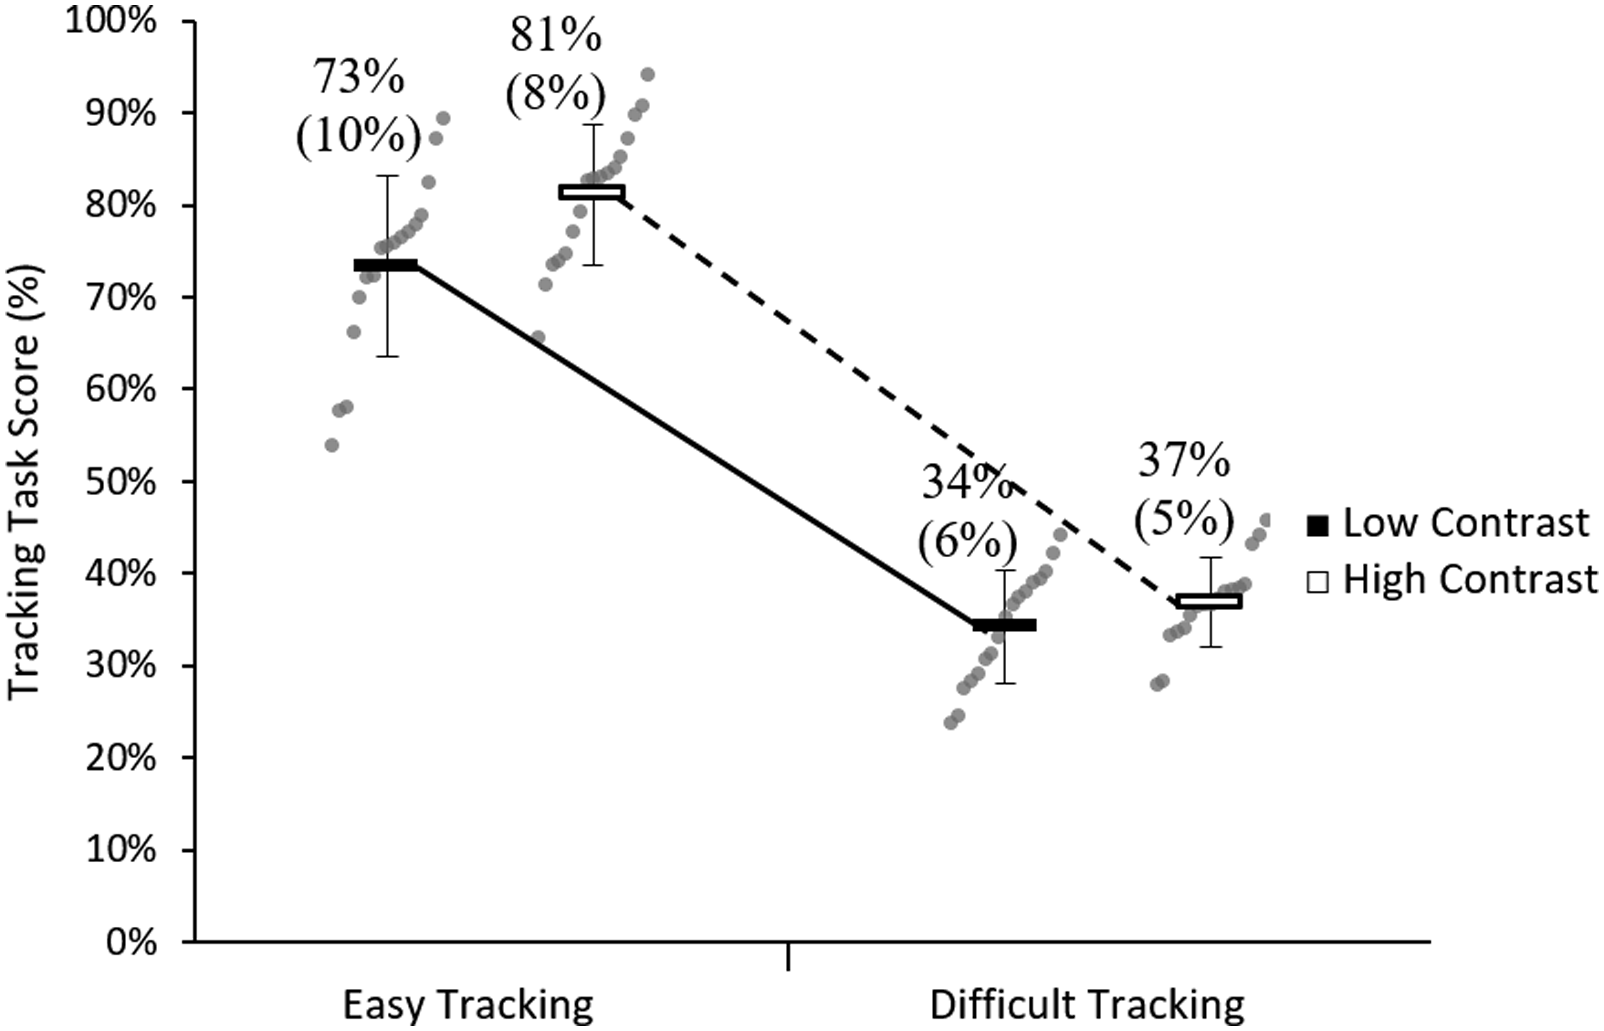
Subjective Reports
There was no evidence of a significant difference in workload ratings for patient monitoring between participants in the high contrast highlights condition (M = 43.59, SD = 11.80) and participants in the low contrast highlights condition (M = 48.09, SD = 11.08), F(1, 32) = 1.32, p = .260,
Discussion
As predicted, participants detected PTEs faster when the HWD displayed high contrast highlights (H1) and when tracking was easy (H2). The effect of contrast on absolute detection times was greater than the effect of tracking difficulty. There was no evidence of an interaction between highlight contrast and tracking difficulty on PTE detection latency. PTE detection latencies were also more consistent across participants in the high contrast condition. However, the shortest mean PTE response latency was still around two seconds, which is longer than would be expected for an alert strong enough to elicit immediate detection (Fischer & Ramsperger, 1984). This raises the question of what kind of alerts would more reliably and robustly produce exogenously driven attending, and whether a pattern of more consistently fast responses can be achieved.
Participants’ accuracy at detecting PTEs in Experiment 1 were already near an accuracy ceiling (high 90% range), largely because participants had several seconds before the next PTE arrived to detect the previous PTE. This helps to explain why participants’ PTE detection rate remained the same across highlight conditions, although they detected PTEs faster with high contrast highlights.
As predicted, the difference in tracking performance between easy and difficult tracking conditions was significant (H4) and the effect was large. The effect of tracking difficulty on PTE detection latency is consistent with resource models of attention (Wickens, 2002), but it differs from findings by Martin-Emerson and Wickens (1992) and Salvucci and Taatgen (2008) who found that levels of tracking difficulty did not affect response times to a time-shared visual choice task. However, our tracking difficulty manipulation had a relatively small effect on PTE detection latency compared with the highlight contrast manipulation. In addition, as predicted, participants performed the manual tracking task more accurately when PTEs were signalled with high contrast highlights than with low contrast highlights (H3), though the effect was small. However, the highlight contrast manipulation had less effect on tracking performance than tracking difficulty did.
Although participants appeared to use a more exogenous attention management strategy when they worked with high contrast highlights, it is unclear what their performance would be like with fully exogenous attention management. Before proceeding, we therefore investigated performance with a stimulus very likely to produce strongly exogenous attending to determine how closely the high contrast highlights had approximated strongly exogenous attention management (Browning, 2016). Auditory signals are highly effective at capturing attention (Ho & Spence, 2005; Spence & Santangelo, 2010) and auditory alerts should support a strong exogenously driven strategy (Iani & Wickens, 2007; Posner et al., 1976; Wickens & Colcombe, 2007). Participants hearing auditory alerts as well as seeing high contrast highlights should respond rapidly and consistently to PTEs and should be less likely to report that they deliberately checked the HWD than participants using only the high contrast highlights on the HWD.
To investigate the above, Browning (2016) used the same setup as in Experiment 1, with ‘high contrast’ highlights but moderately difficult tracking (further details are in supplemental materials). In the HWD plus auditory alerts condition, an animal sound was played through the HWD’s earphone to indicate a PTE. Animal sounds were chosen because they are highly detectable and distinguishable (Suied et al., 2010) rather than as a practical prospect for the clinical context. Participants in the HWD plus auditory alerts condition detected PTEs about half a second faster (M = 1.16 s, SD = 0.27) than participants in the HWD only condition, (M = 1.62 s, SD = 0.34) p < .001, and they had much smaller SDs for PTE response latencies (M = 353 ms, SD = 42 ms) than participants in the HWD only condition (M = 1075 ms, SD = 422 ms), p < .001. They also reported making fewer deliberate checks of the HWD, p = .025, and reported relying on visual alerts less than participants in the HWD only condition, p = .003.
Overall, the auditory alerts produced responding that was approaching a maximum possible speed and accuracy given the experimental setup, providing a benchmark for a strongly exogenous pattern of responding. However, our objective was to produce a highly effective visual signal, rather than relying on auditory or vibrotactile alerts, because the use of the latter modalities is not always ideal in hospital environments. Fortunately, there are other ways of manipulating visual properties of the HWD to encourage exogenously driven attention management. In Experiment 2, we investigated a further kind of visual signal that in prior research has attracted attention robustly and reliably.
Experiment 2: Comparing White Flash Alert on HWDs and Computer Screens
In Experiment 2 we sought to introduce a visual signal on the HWD that would draw participants’ attention to PTEs as unfailingly and quickly as the auditory alert did. Bright flashes are robust exogenous alerts (Posner, 1980) and a version has recently proven effective in attracting air traffic controllers’ attention to breakdowns of separation between aircraft (Saint-Lot et al., 2020). The kind of flash we chose was a brief (150 ms) white flash over the entire screen when the PTE occurred.
Experiment 2 was also a preclinical study in which the effectiveness of a visual alerting signal was tested. It differed from Experiment 1 in several ways, however, given the different context in which it was run. In particular, Experiment 2 was conducted with a view to eventual clinical implementation of the HWD. As a result, features were added to the patient monitoring display to bring it closer to the needs and context of clinical work (see Figure 4). The original grid pattern of participants and vital signs was retained, but on advice from our clinical collaborator (author RGL) we included trend information for each patient vital sign. Another change was the adoption of a ‘traffic light’ colouring system—often adopted in health contexts (Ashir & Marlowe, 2008)—to indicate patient status more clearly. Normal vital signs were shown in green, and abnormal vital signs were highlighted with either a yellow (warning) or red (crisis) cell colour. A further difference in Experiment 2 was that tracking was performed with a finger on a tablet computer, rather than with a stylus on a desktop computer, and was set to a relatively easy level. Display screen used in Experiment 2. Dots represent a graphical trend of values over the previous 160 seconds. Faint horizontal lines within each cell indicate boundaries of warning and crisis levels for vital signs. Yellow cells indicate that a vital sign is in a warning state and red cells indicate a crisis state. Experiment 2 was run in Germany; thus the German patient names on the display. For each block, the display screen was presented on either the HWD or the computer screen.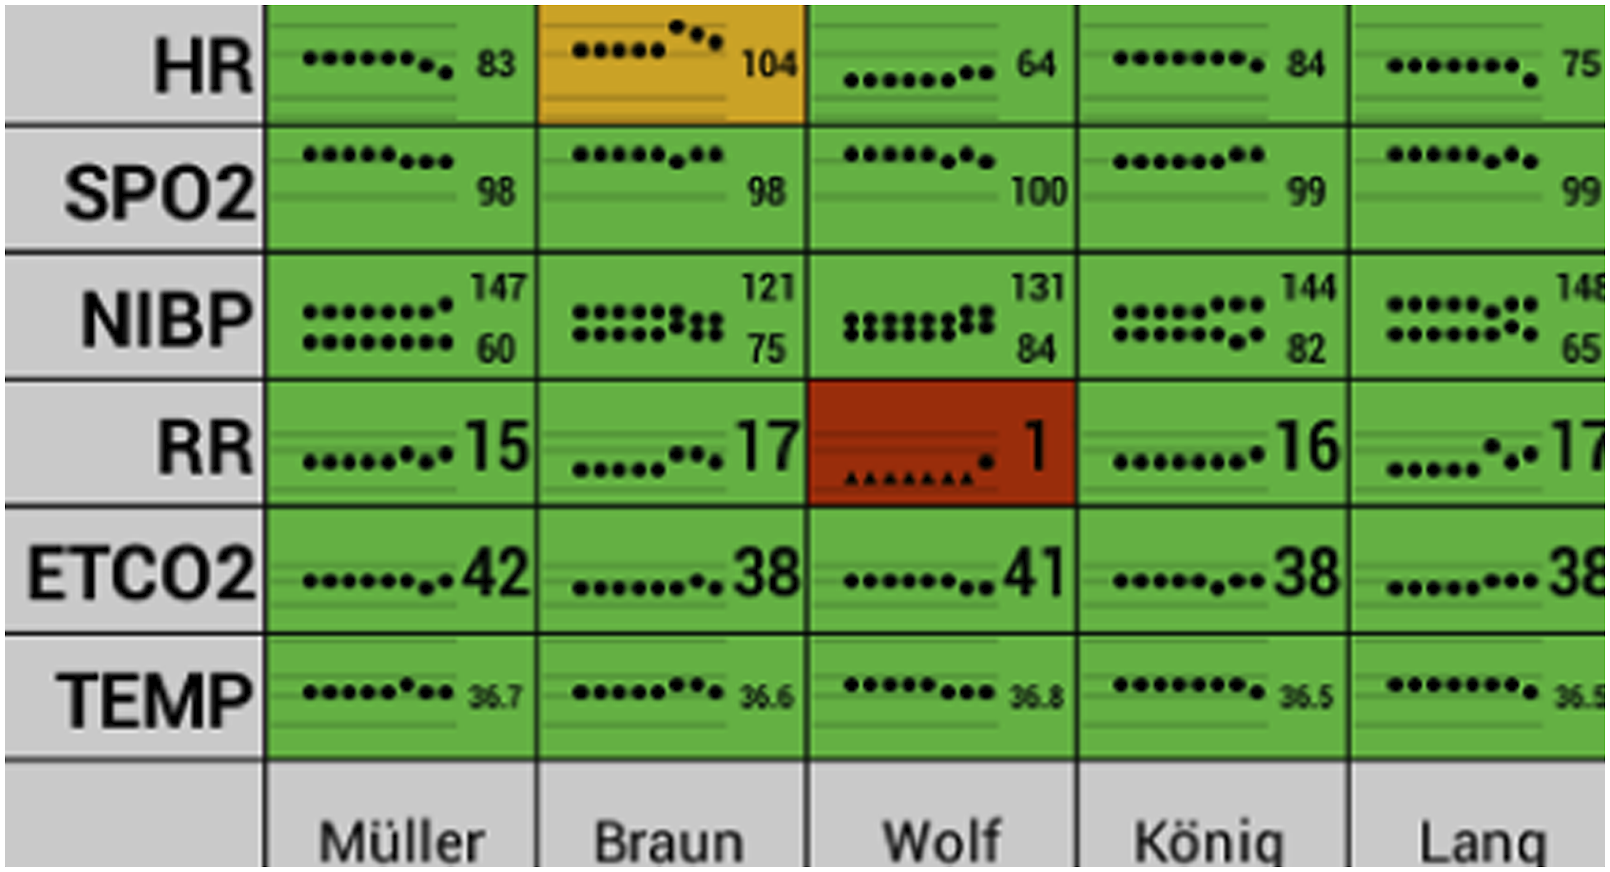
Experiment 2 compared participants’ performance when the white flash accompanied a PTE event with participants’ performance with no white flash. However, previous research has indicated that participants are less likely to notice signals of a given contrast ratio on an HWD than on a computer screen (Pascale et al., 2018, 2019). A conventional computer screen condition was therefore added to the experimental design to see if the white flash drew attention as effectively on the HWD as on a computer screen.
In the Pascale et al. studies, and in Experiment 1, the HWDs and computer screens were always positioned in participants’ peripheral vision. The physical design of most HWDs allows them to be adjusted so that the display is closer to the centre of the wearer’s field of view, but few studies have examined the effects of HWD position. Kruse et al. (2020) assigned participants prospectively to HWD position conditions but found that HWD position did not affect how quickly participants resumed an ongoing task after an HWD-based interrupting task. However, HWDs may capture people’s attention more quickly than computer screens when people are free to position the HWD wherever they like in their visual field; the latter is a feature of some (but not all) HWD devices (Schmalstieg & Hollerer, 2016).
For Experiment 2, three hypotheses predicted advantages in performance for the participants using the HWD rather than the computer screen. The hypotheses are based on the fact that participants would be able to place the HWD image of the vital signs at the most convenient location in their visual field, including directly over or adjacent to the tracking task, whereas the computer screen image of the vital signs would always be separate from the tracking task. The hypotheses were as follows.
H1: Participants will respond to PTEs faster when using the HWD than when using the computer screen.
H2: Participants will perform better at the tracking task when using the HWD than when using the computer screen.
H3: Participants will glance at the vital sign display less often when using the HWD than when using the computer screen.
A further three hypotheses predicted advantages for performance with the white flash, given the likelihood that it would capture attention through exogenous means (Posner, 1980; Saint-Lot et al., 2020). Participants’ reliance on the white flash to capture their attention might allow them to put more resources into the tracking task (Meyer et al., 2014).
H4: Participants will respond to PTEs faster with the white flash than without it, given the flash’s exogenous capture of visual attention.
H5: Participants will perform better at the tracking task with the white flash than without it, given the opportunity to rely on the flash’s exogenous capture of visual attention for PTE detection and to pay more attention to the tracking task.
H6: Participants will check the vital sign display less with the white flash than without it, given the opportunity to rely on the flash’s exogenous capture of visual attention and less on endogenously driven monitoring for PTEs.
Methods
Design
The experiment used a within-subjects design, with independent variables display (HWD or computer screen) and white flash (present or absent). All participants experienced all four combinations of display and presence or absence of white flash. The order of presentation of conditions was determined according to a Latin square. In each of eight 5-minute test blocks (two for each condition) there were 10 PTEs that occurred between 5 s and 70 s apart.
Participants
Participants were undergraduate human-computer-systems or media communications students recruited from University of Würzburg in Germany. As in Experiment 1, all participants had normal or corrected to normal vision without glasses and had not participated in a previous HWD study conducted by the research group. Participants gave written and informed consent and received course credit for their participation in this study. Ethical clearance for this study was granted by The University of Queensland’s School of Psychology ethics committee (approval number 15-PSYCH-S-10-JS).
Tasks and Materials
In the HWD conditions, the patient monitoring task was displayed on a Vuzix M100 monocular opaque HWD (Vuzix Corporation, West Henrietta, NY). In the computer condition, the patient vital signs display was embedded in a small area of the 24″ LCD panel (LG Electronics Inc, Seoul, South Korea) positioned 60 cm from the participant’s head. The embedded display subtended approximately the same visual angle on the computer screen as on the HWD (15° diagonal between opposite corners of the display), so that the vital sign display was the same size in the participants’ visual field between both HWD and computer screen conditions. In the HWD conditions, participants could position the HWD image wherever they liked in their visual field by adjusting the arm of the display, rather than having the image in a fixed position below the tracking screen as in Experiment 1.
At the end of the experiment, participants reported where they positioned the HWD in their visual field relative to the tracking task for each HWD condition. We assumed that participants would keep the tracking task target in the centre of their visual field while tracking. Participants could report one of three HWD positions: overlapping the tracking task (approximately 1.5°–5.2° of visual angle between the HWD screen and the tracking task target), near the tracking task (approximately 5.3°–12.5° from the tracking task target), or far from the tracking task (at least 12.6° from the tracking task target; see Figure 5). The visual angle between the centre of the computer screen and the tracking task target fluctuated between approximately 16.8° and 22.5°. The exact visual angles between the HWD or computer screen and the tracking task target varied depending on where the moving tracking task target was on its display in each moment and where the participant positioned the HWD (in the HWD conditions). Experiment 2 layout image used to elicit participants’ statements of where they positioned the HWD during HWD conditions. Participants did not see the blue zone markers or descriptive text. HWD positioning was classified as either overlapping, near, or far from the tracking task. The upper screen showed vital signs in the computer screen condition. Lower screen always showed the tracking task.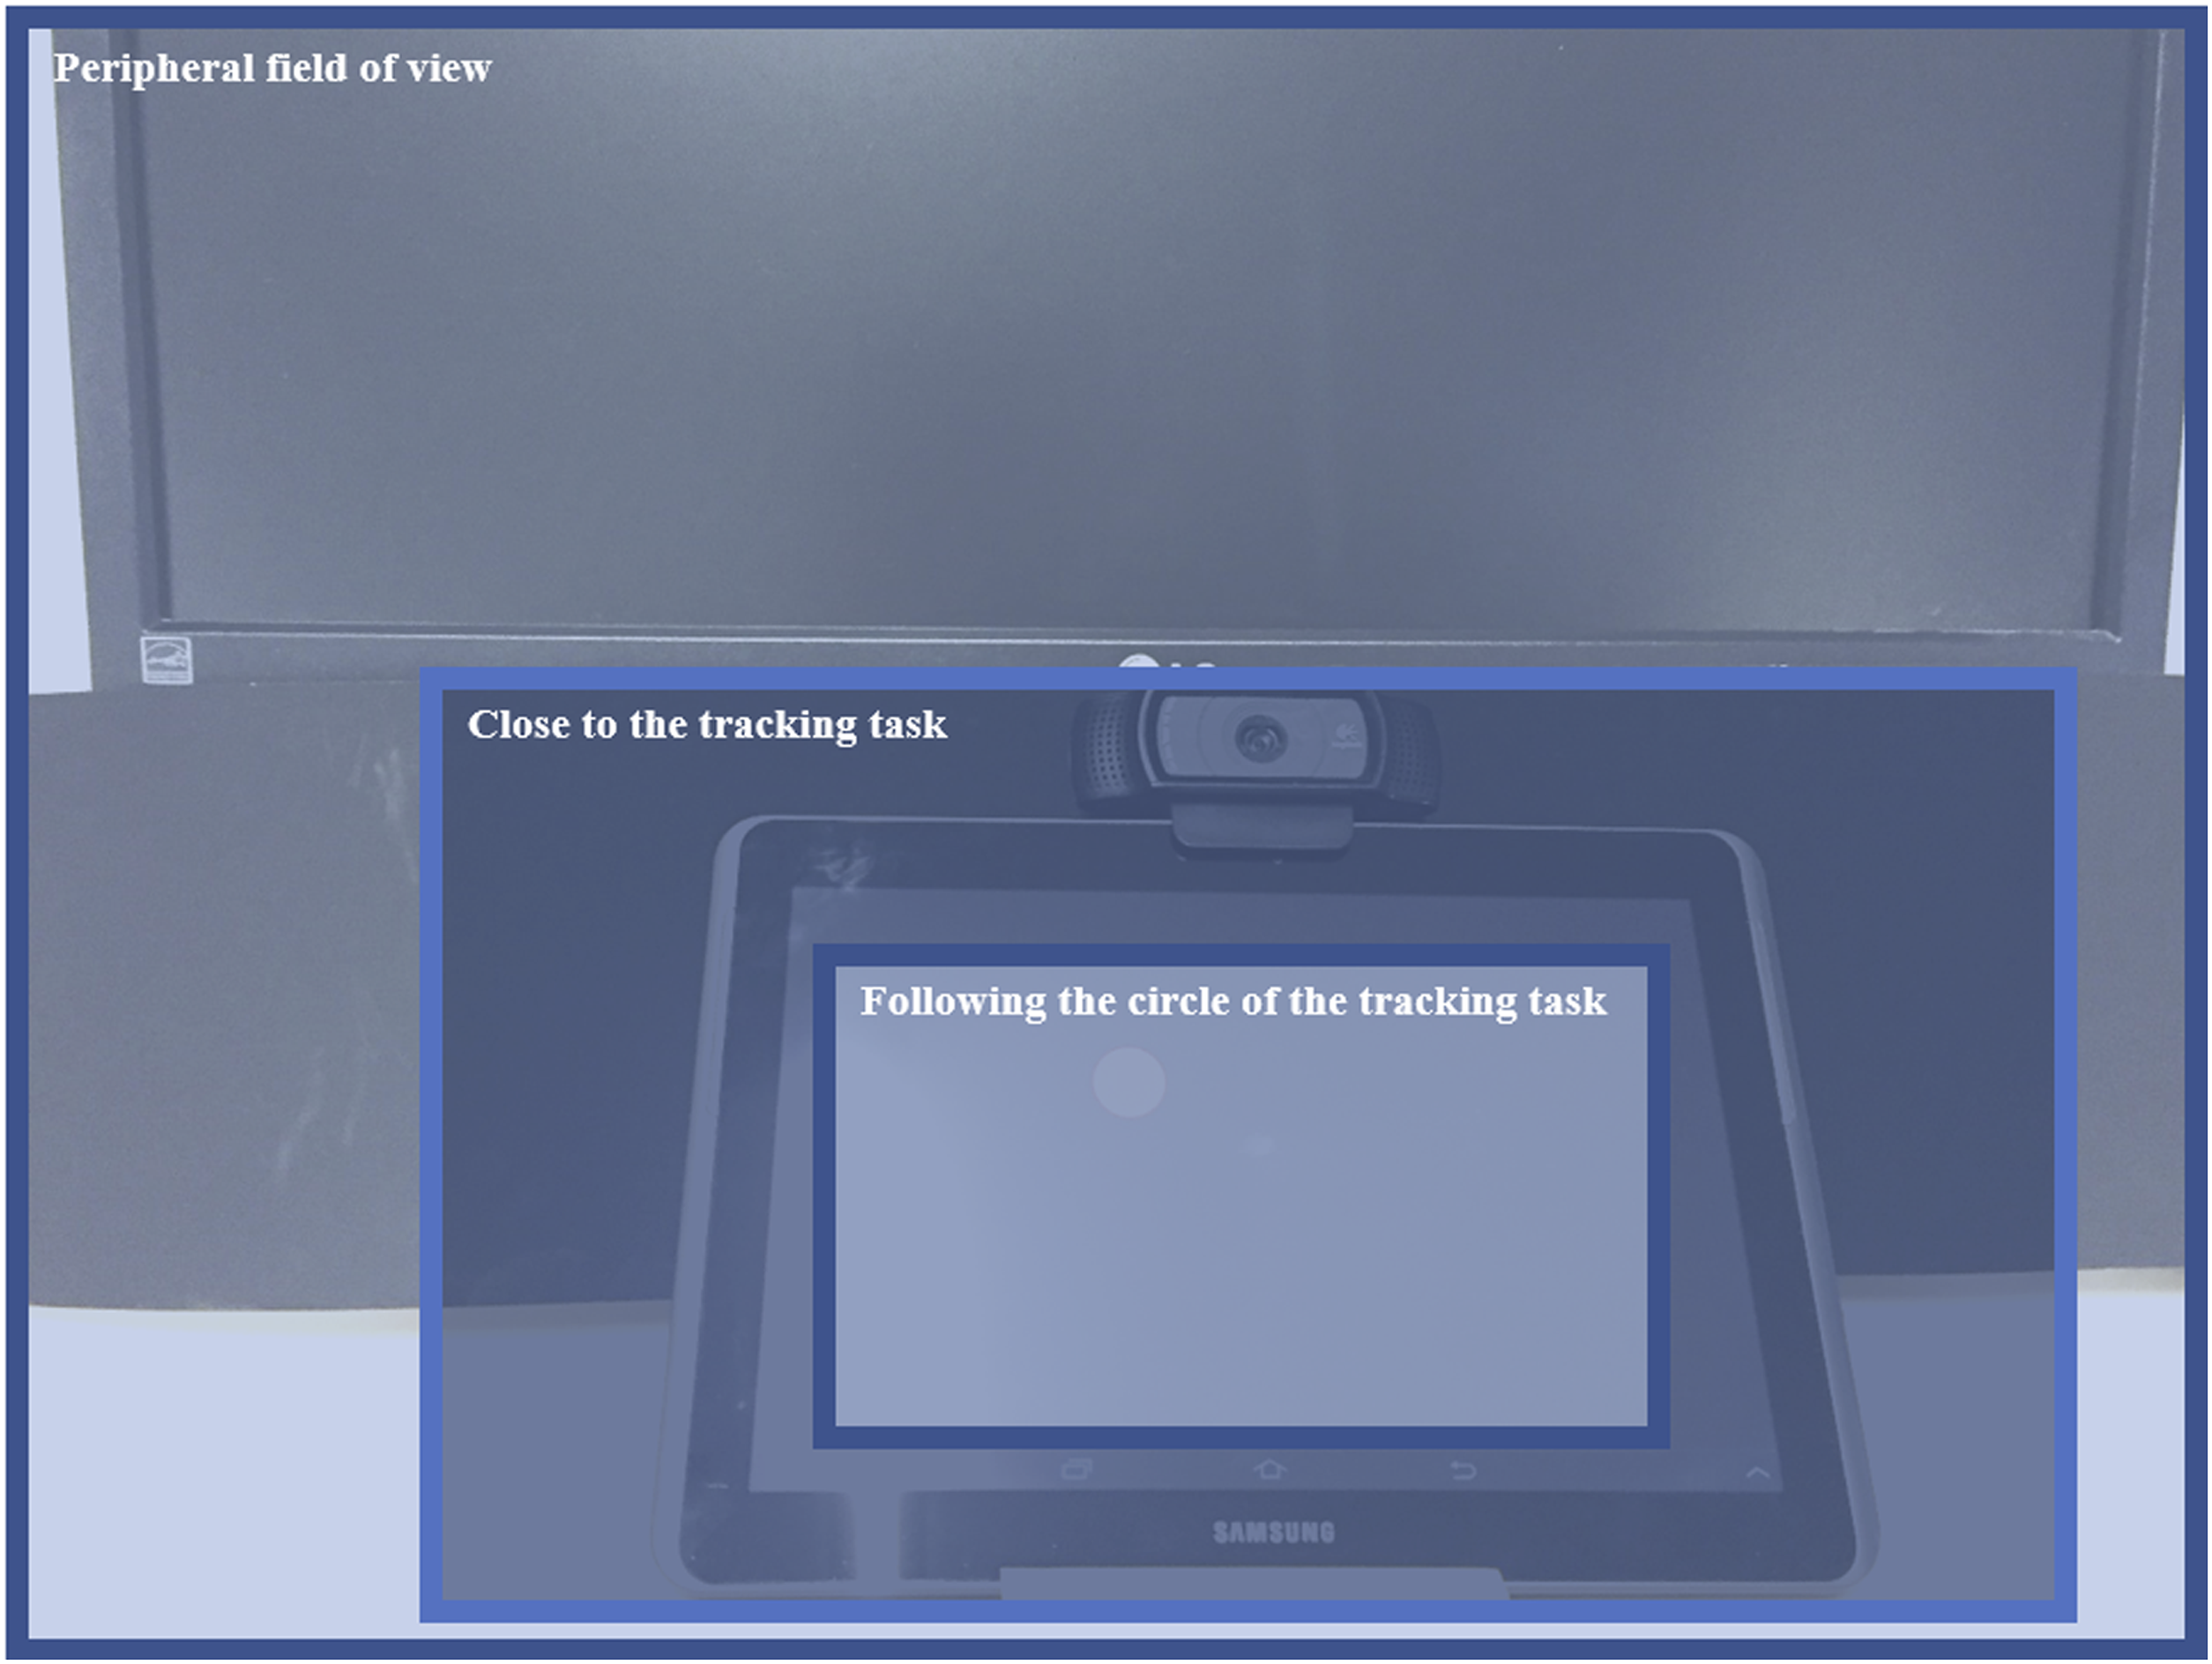
In the HWD+flash condition, the entire HWD screen flashed white for 150 ms at the onset of each PTE. However, in the computer screen+flash condition, the entire 24″ screen flashed white for 150 ms, not just the smaller part of the screen with the embedded image, thereby creating a physically larger stimulus than the HWD+flash condition. This was because the vital sign display may not have been in the participant's visual field when they used the computer screen and were focused on the tracking task (see the Discussion for a description of the pilot study in which the flash was the same size as the embedded vital signs display).
The patient monitoring screen was redesigned for Experiment 2, with clinician input, so that it showed trends for six vital signs for each of five patients (see Figure 4). The same vital signs were selected as in Experiment 1, but they were displayed in a different order that matched clinical conventions better. Vital sign values were updated every 5 seconds. Fields changed to yellow to indicate warning levels and to red for crisis levels, reflecting the two levels of alerts that were used in Experiment 1.
Participants were asked to state the details of each PTE (patient, vital sign and range) as soon as they noticed each PTE. Audio recordings were taken during each block (no foot pedal responses were used). The latency to respond to PTEs was operationalised by coding the time between the onset of a PTE on the participants’ display and the moment of their first utterance in response. Participants were asked to respond when a vital sign crossed from a more abnormal to a less abnormal range as well as when a vital sign crossed from a less abnormal to more abnormal range.
Participants performed the tracking task on a Nexus 10 10.1″ touchscreen tablet (Samsung, Seoul, South Korea) positioned on the desk surface below and in front of the LCD computer screen. They performed the tracking task with their finger, rather than with a stylus as in the previous experiment. Experiment 2 used a Perlin Noise algorithm for the tracking task (see supplemental materials Table SA4 for movement frequencies). Tracking performance was scored as the percentage of time that participants could keep the circle green.
A webcam positioned on the touchscreen tablet recorded participants’ eye movements during all conditions. The videos were manually coded to count participants’ saccades toward the patient vital signs display in the computer screen conditions, or toward the HWD in the HWD conditions.
Participants completed the NASA-TLX measure of subjective mental workload (Hart & Staveland, 1988) for both the monitoring and the tracking tasks combined and answered open-response questions probing strategies used. Participants also reported where they had positioned the HWD in their visual field. The three positioning categories represented distinct areas of the layout of screens, as shown in Figure 5. At the top of the image in Figure 5 is the screen on part of which the patient vital signs appeared in the computer screen condition, and below the screen is a smaller screen on which the tracking task appears. Participants in the HWD condition drew on the image to indicate where they positioned the HWD. The three blue zones were added during analysis to classify each participant’s HWD positioning as overlapping, near, or far from the tracking task. The overlapping location was only assigned when the participant either used arrows to indicate that they actively moved the HWD while following the target or when they described this strategy in the monitoring strategy questionnaire.
Procedure
After giving written informed consent, participants were fitted with the HWD and were trained how to report PTEs for 1 min. Before the main experimental blocks, participants were told ‘It is very important that you try to follow the circle as long as possible. Nevertheless, do not forget your simulated patients and report any occurring change in vital signs to the experimenter immediately!’ (translated from German). After familiarisation and training on the tasks, participants completed eight 5-minute test blocks. At the end of the experiment, participants completed the subjective questionnaires and reported their positioning of the HWD in each condition. Upon completion, participants were debriefed and reimbursed.
Pilot Study
A pilot study with 23 participants was conducted with a design close to the above except that participants used a chin rest and the HWD image was consistently in a similar location in the visual field as the computer screen was. Just three conditions were used: HWD, screen and screen+flash where the flash was the same size as for the HWD (see more on this in the Discussion below). Because of these differences, the results of the pilot study were not used for a statistical power analysis for Experiment 2. Instead, a sample of N = 30 was decided a priori, given the sample sizes of similar experiments and the strong effects found in the pilot study (see Schlosser et al. (2016)).
Results
Thirty students participated in this study (female = 16 (53%), male = 14 (47%), M = 21.80 years, SD = 3.19 years, Range = 19–32 years). Two participants’ data were excluded for the latency measures only, due to technical difficulties with the audio recording setup. All analyses used alpha = .05.
PTE Detection Latency
Participants responded to PTEs more slowly when using the HWD than when using the computer screen, F(1, 27) = 21.50, p < .001, Experiment 2 results for PTE detection latency. The horizontal lines are group means. Vertical lines are group SDs. Figure shows 2 × 2 comparison with main effects of display (p < .001), no flash versus flash (p < .001), and significant interaction (p = .010). The black numerals are the group means (SDs). Numerals in grey are means (SDs) of within-participant SDs (latency consistency). Grey points are each participant’s mean and light grey bars are within-participant SDs. Results for each participant within a condition have been arranged in ascending order of means to convey an impression of the distributions of mean latencies.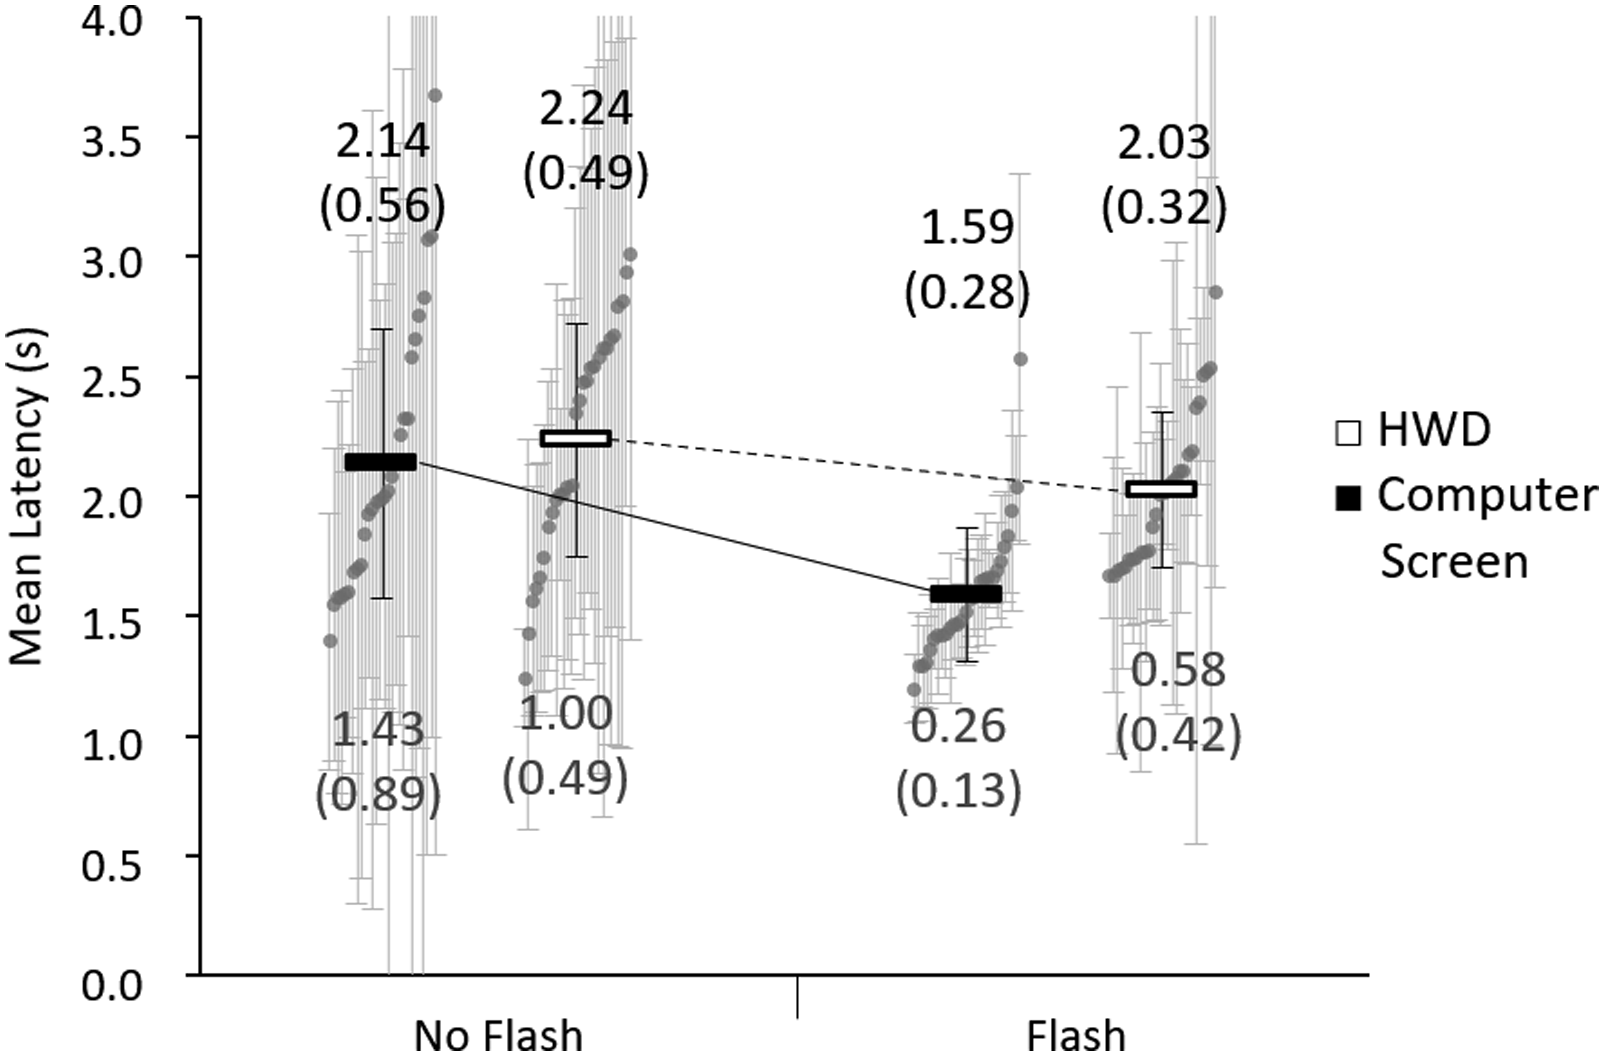
Consistency of PTE Detection Latency
Participants’ latency SDs were smaller with the flash than without, F(1, 27) = 57.89, p < .001,
PTE Detection Rate
Almost all participants responded to all PTEs on each condition. Of all 672 PTEs presented across 28 participants, six were missed by three participants using HWD only, one by a participant using HWDs plus flash, seven by five participants using the computer screen only, and one by a participant using the computer screen plus flash.
Tracking
Participants’ tracking performance was more accurate in the computer screen condition than in the HWD condition, F(1, 29) = 28.30, p < .001, Experiment 2 results for tracking, showing percentage of time the participant’s pointer was in the green zone. Figure shows 2 × 2 comparison with main effects of display (p < .001), no flash versus flash (p < .001), and significant interaction (p = .004). The numberals are group means (SD). The horizontal lines are means. Vertical lines are SDs. Grey points are each participant’s mean. Results for each participant within a condition have been arranged in ascending order of means to convey an impression of the distributions of tracking task scores.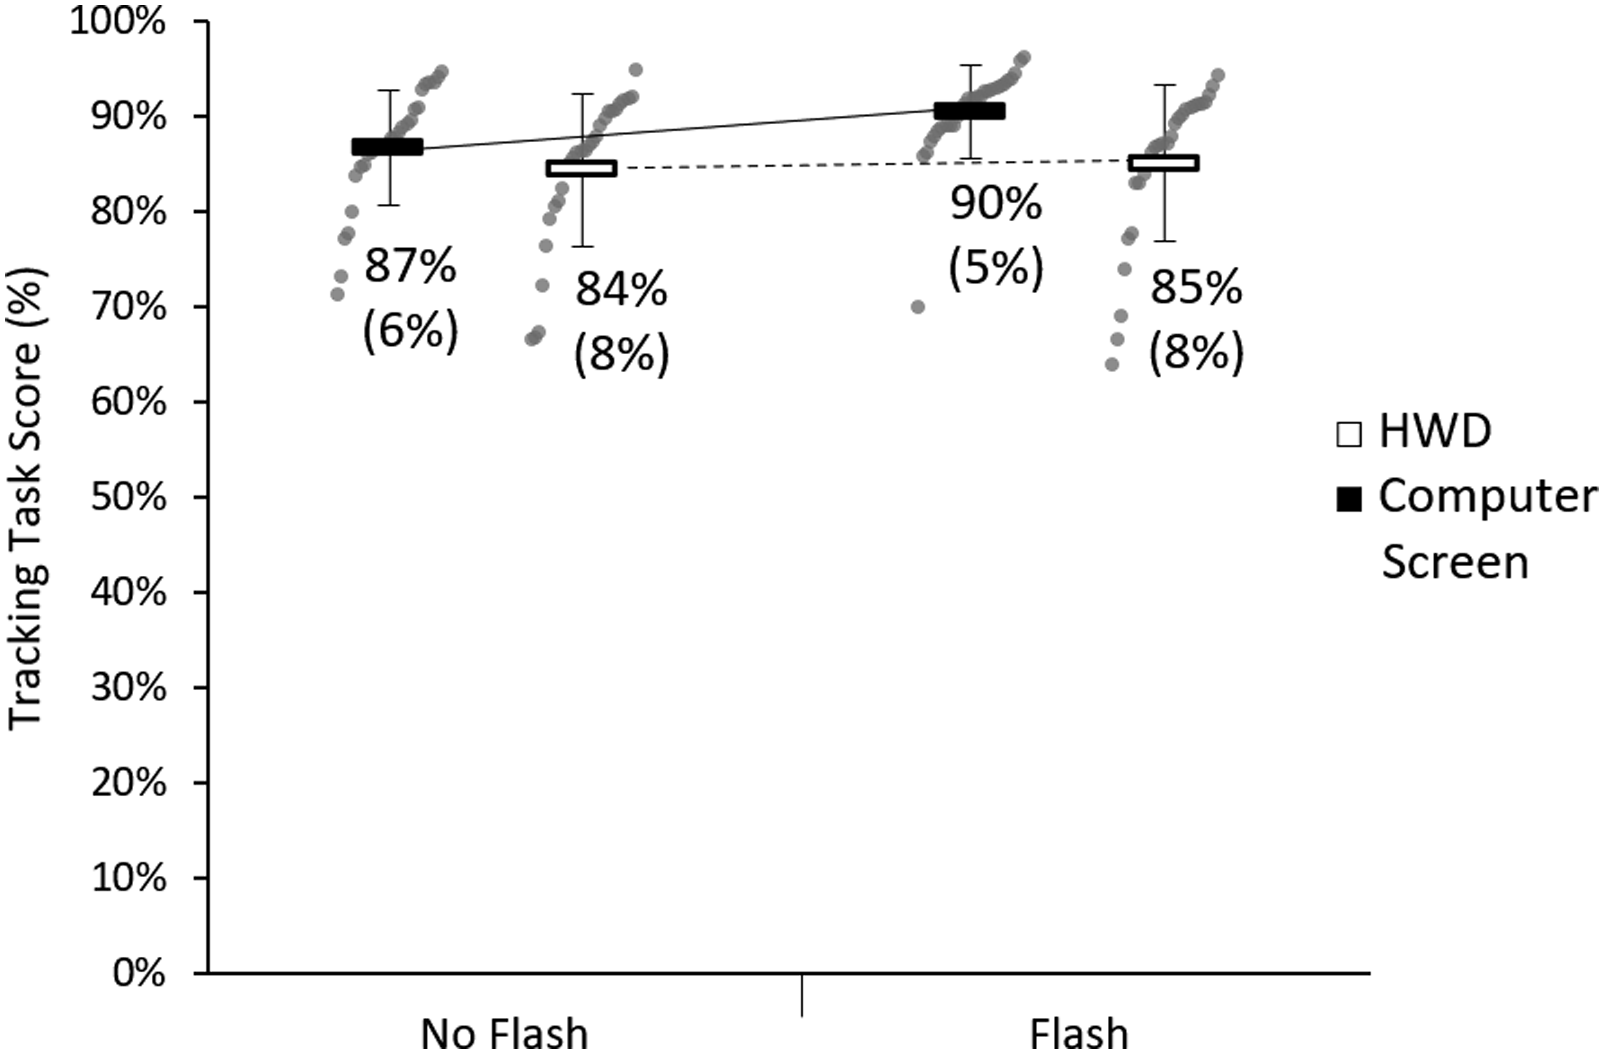
Eye Movements
Participants visually checked the HWD more often than they checked the computer screen, F(1, 29) = 6.52, p = .016, Experiment 2 results for number of times participants looked at the vital sign display. The short horizontal lines are group means. Vertical lines are group SDs. Figure shows 2 × 2 comparison with main effects of display (p = .016), no flash versus flash (p < .001), and significant interaction (p < .001). The numerals are the group means (SDs). Grey points are each participant’s mean number of looks across the two blocks per condition. Results for each participant within a condition have been arranged in ascending order of means to convey an impression of the distributions of values.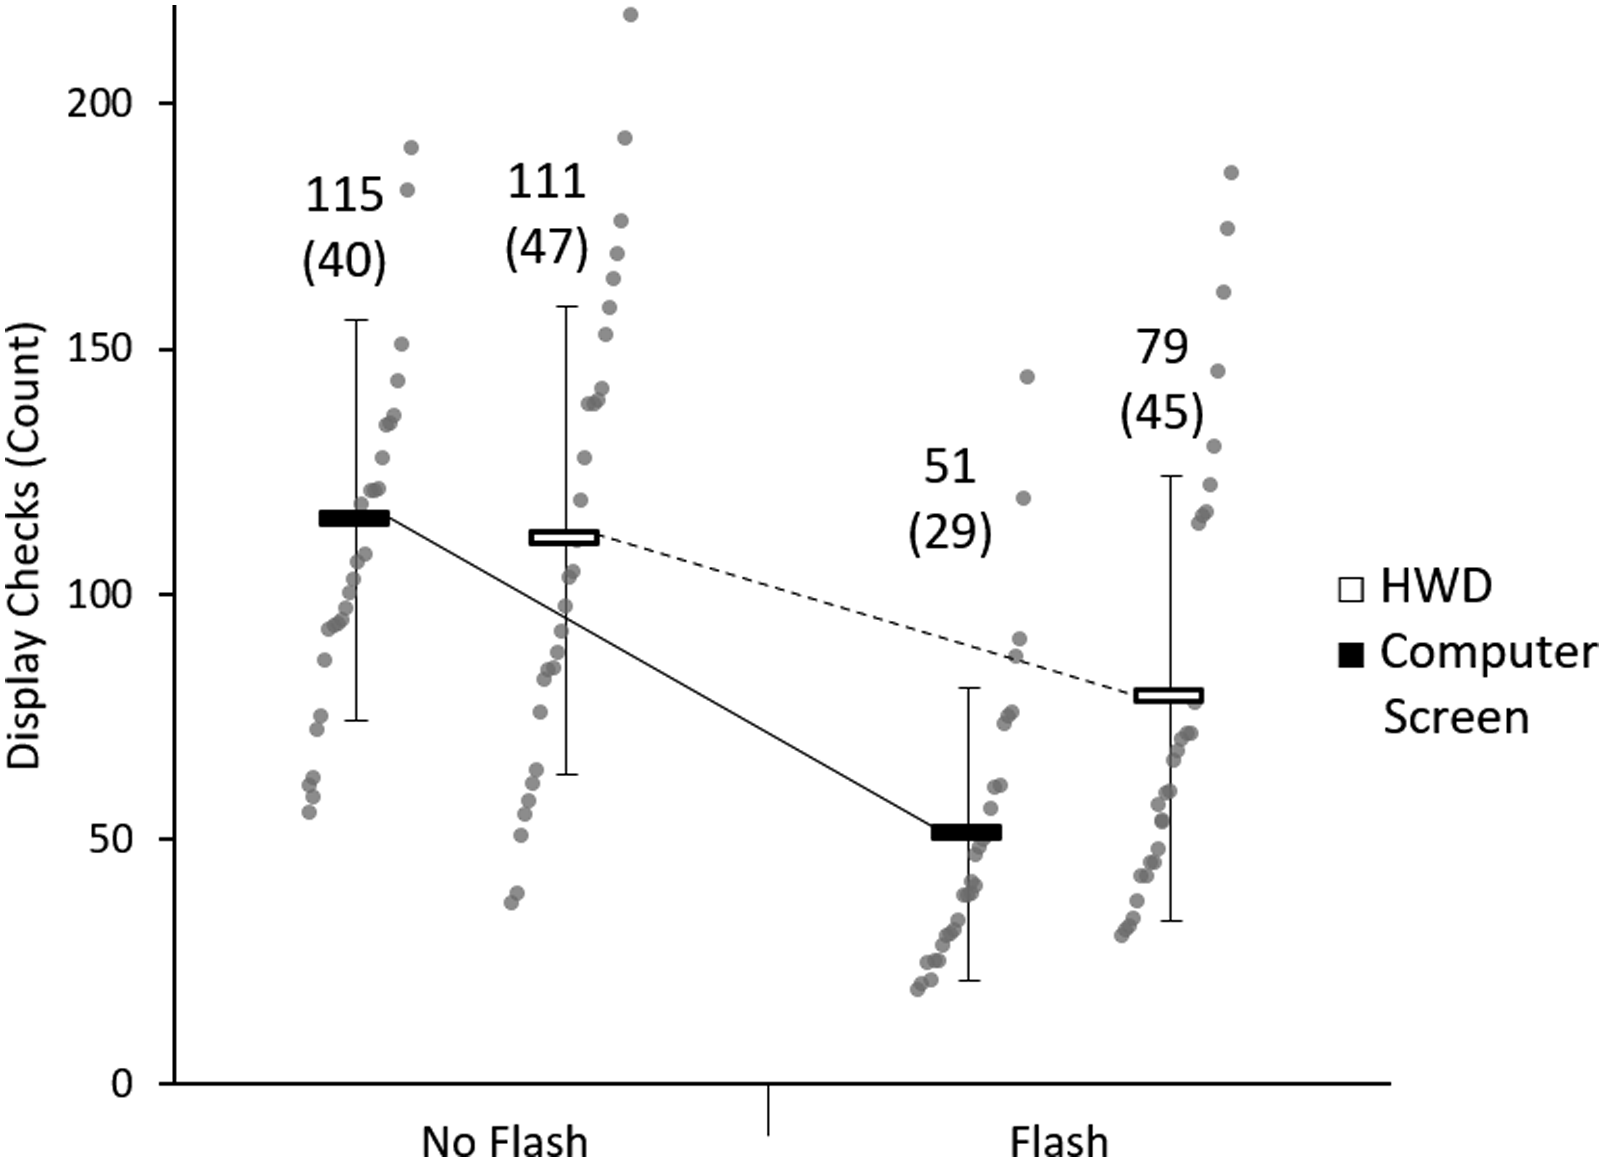
Subjective Reports
Subjective mental workload of both tasks together, measured with the NASA-TLX, indicated an effect of display, F(1, 29) = 11.36, p = .002,
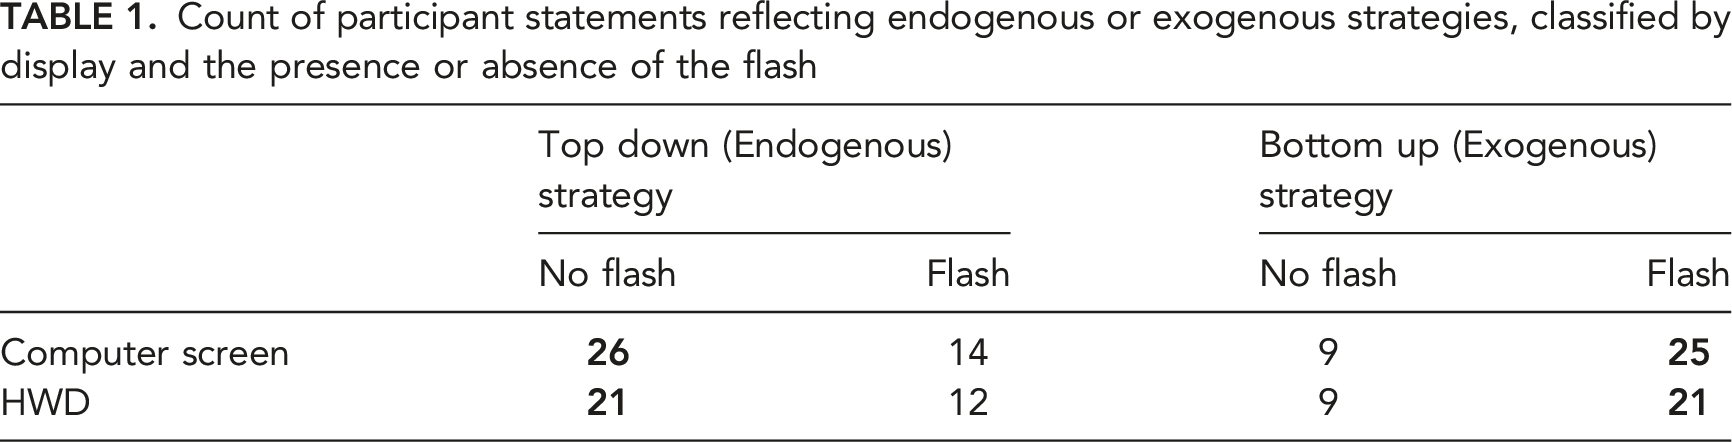
Count of participant statements reflecting endogenous or exogenous strategies, classified by display and the presence or absence of the flash
HWD Positioning
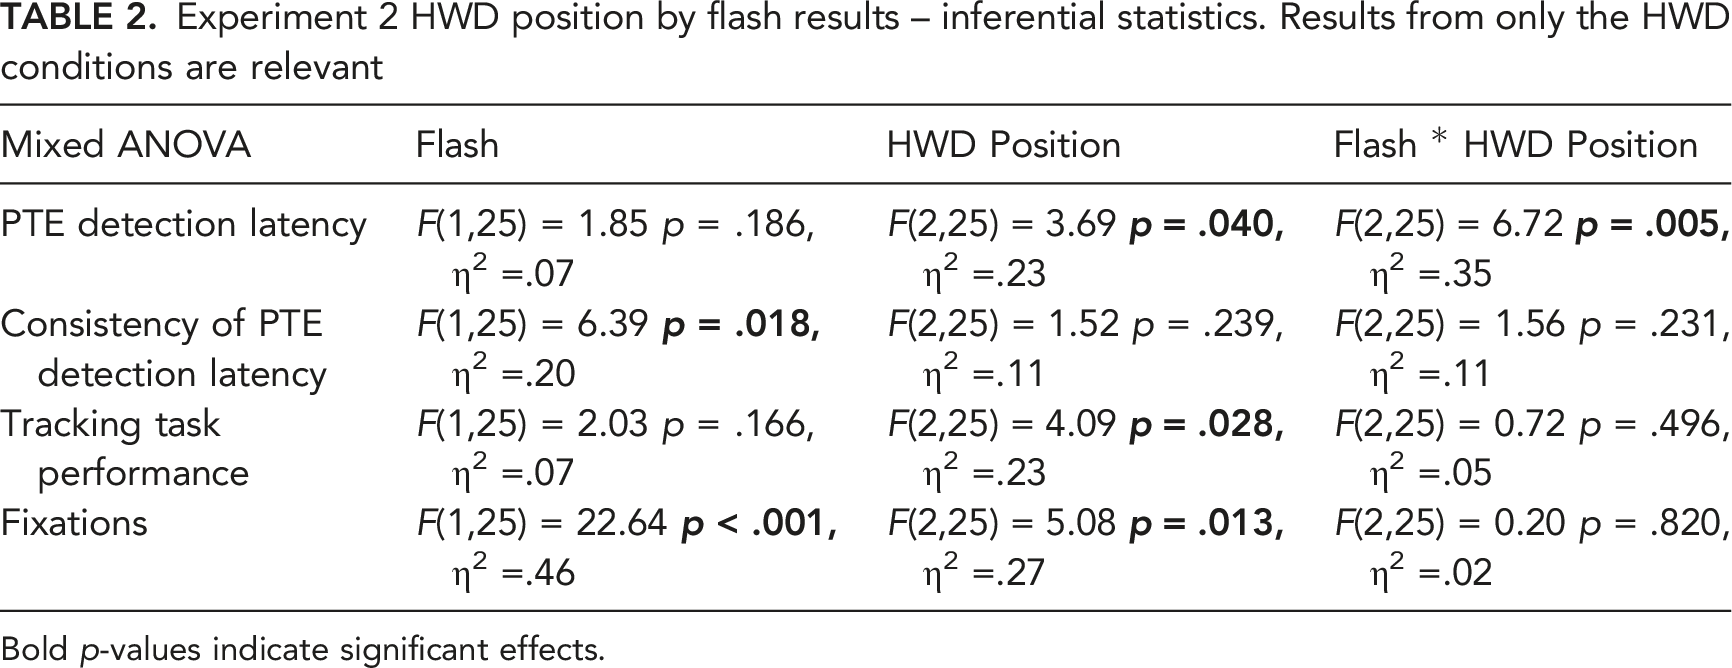
Further exploratory analyses compared patterns of results between participants who reported positioning the HWD so that it was overlapping the tracking task in their visual field (n = 6), near the tracking task (n = 8) or far from the tracking task (n = 16; see Figure 5). Results for PTE detection latency, consistency of PTE detection latency, tracking task performance and number of fixations on the HWD are shown in Figure 9 and Table 2. Participants who reported positioning the HWD so that it was overlapping the tracking task detected PTEs faster than participants who positioned the HWD far from the tracking task. For participants who placed the HWD far from the tracking task, tracking was less accurate and eye fixations on the HWD were more frequent than for participants who placed the HWD overlapping or near the tracking task. Fixations on the HWD were fewer with the flash. These results should be interpreted with caution because participants ‘self-assigned’ their HWD position. Effects of HWD positioning on PTE detection latency, consistency of PTE detection latency, track task performance, and number of fixations to HWD respectively, by flash or no flash conditions. Numbers are group means. The HWD Position was self-selected by participants and was measured at the end of the experiment, so it was not randomly assigned. Experiment 2 HWD position by flash results – inferential statistics. Results from only the HWD conditions are relevant Bold p-values indicate significant effects.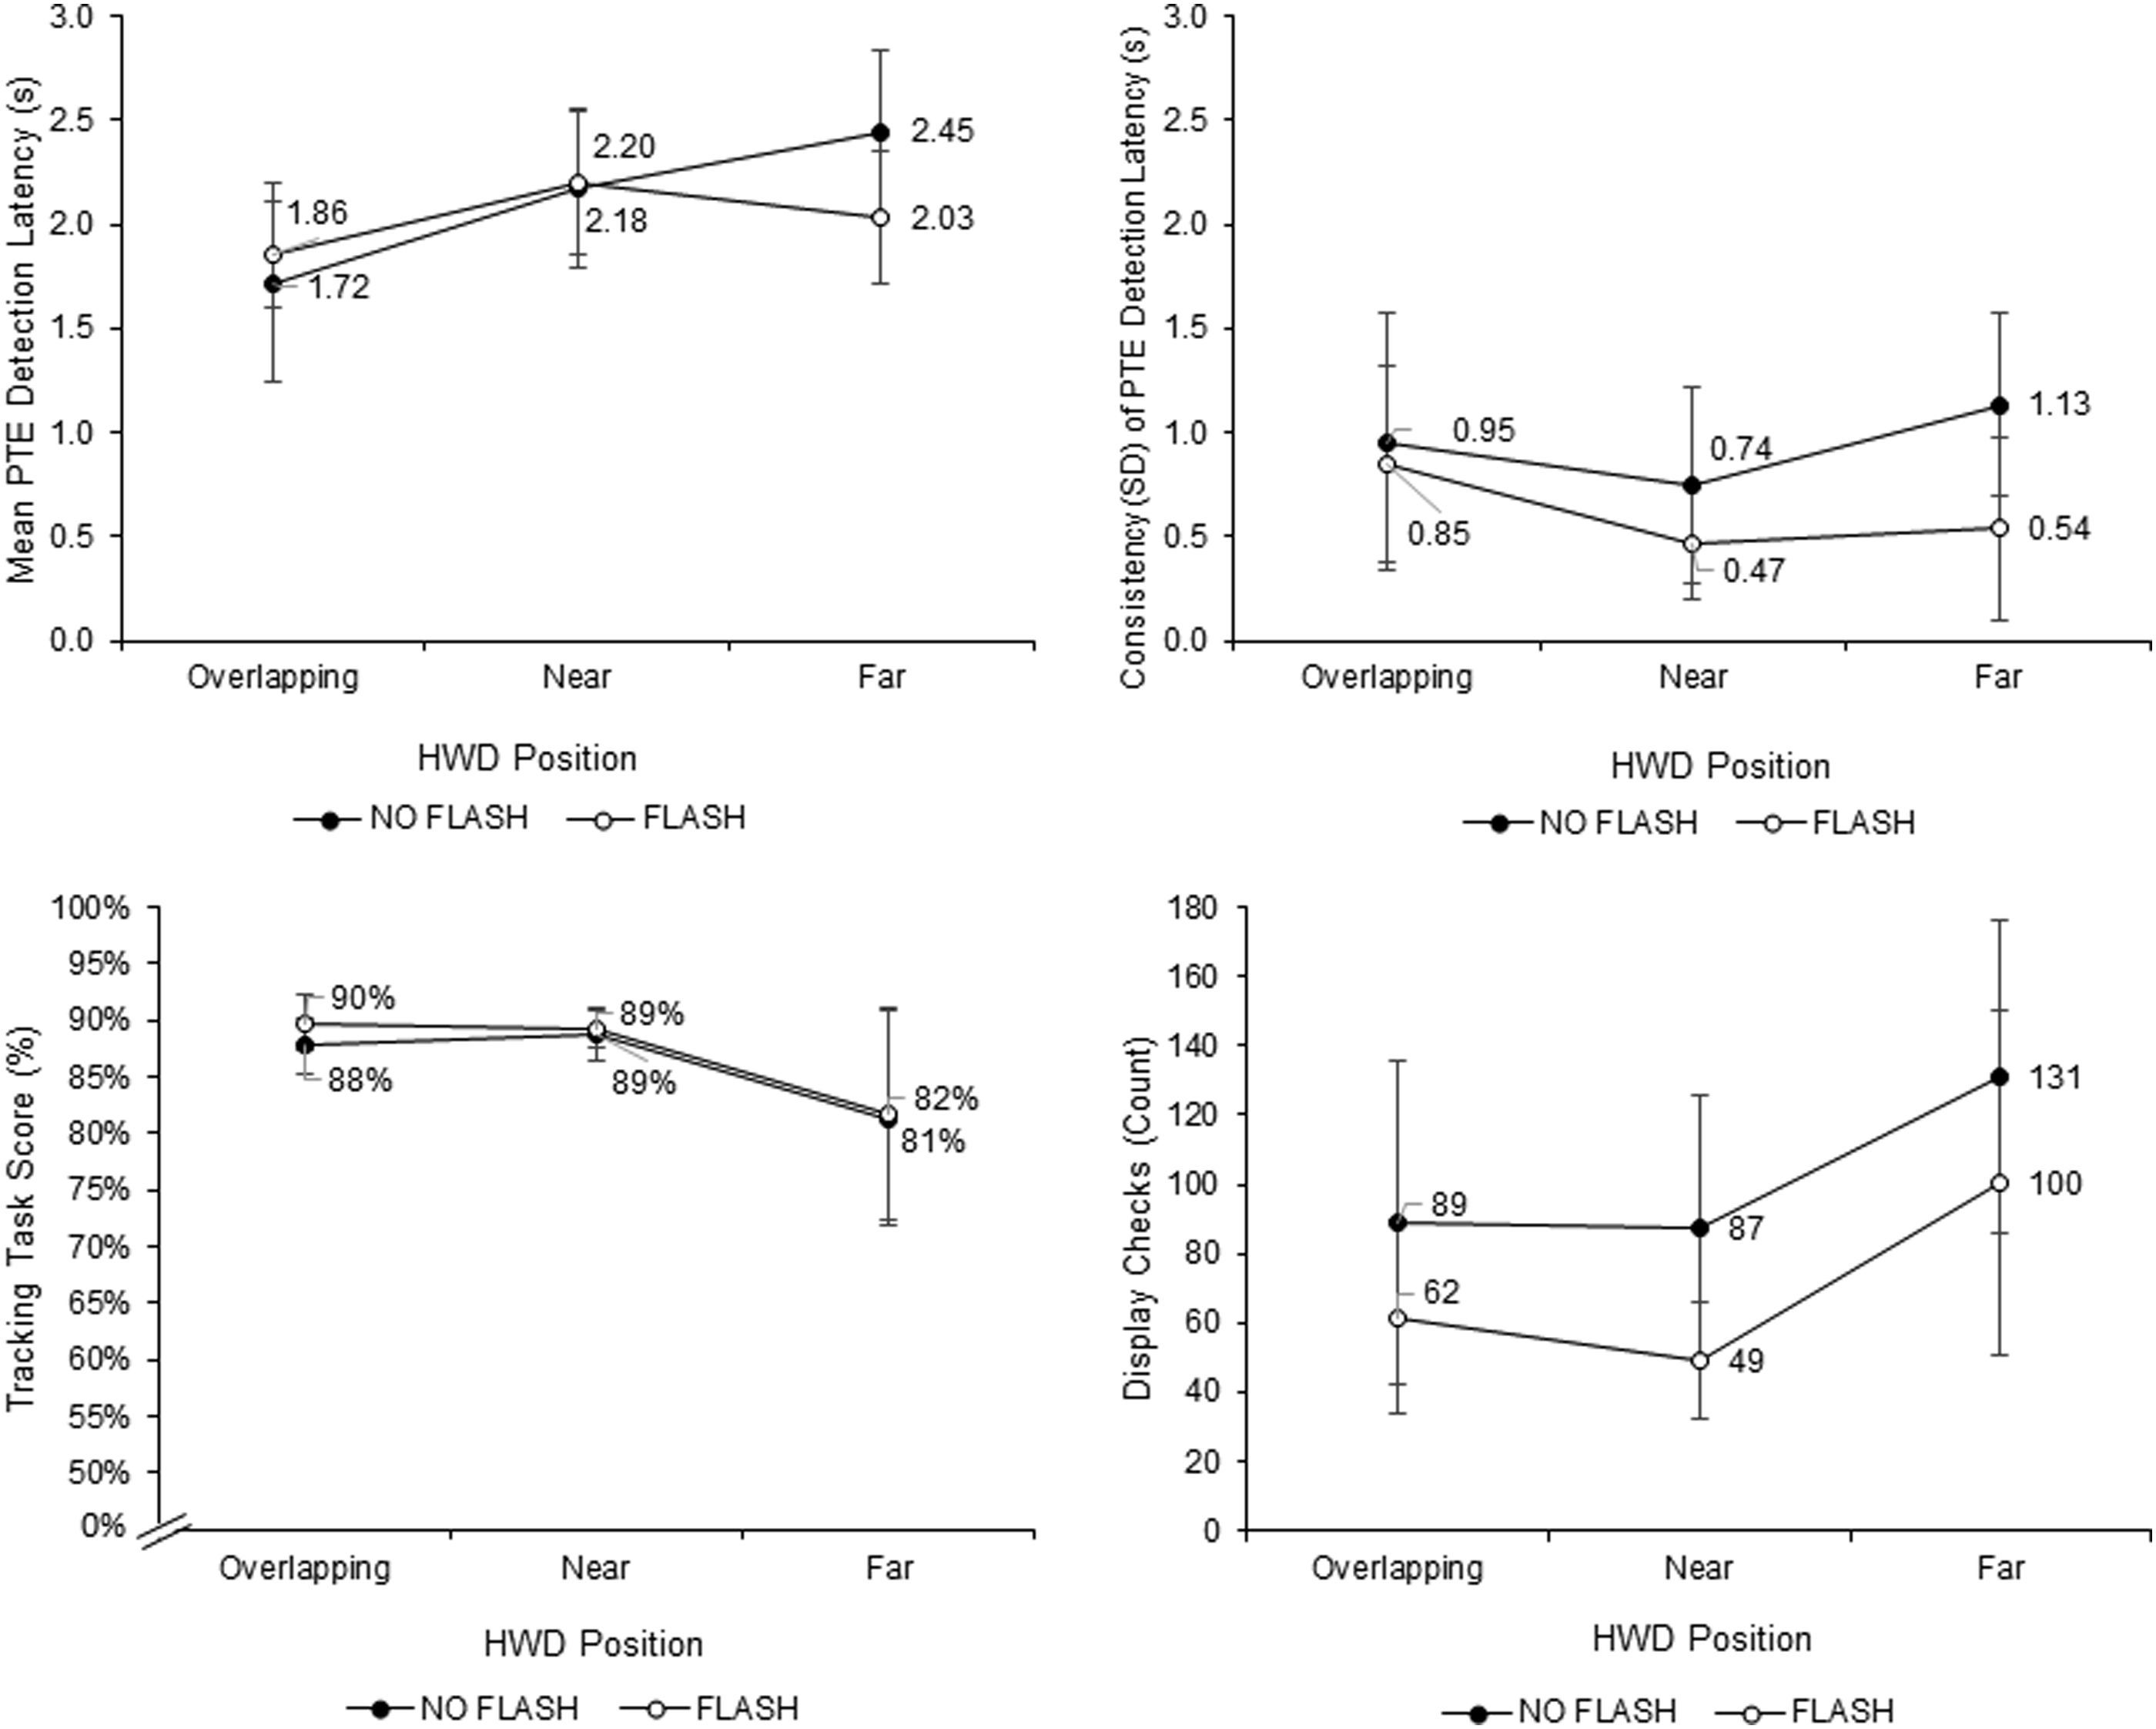
Discussion
Experiment 2 investigated a further method of alerting users to changes on an HWD. The experiment showed that PTE detection is less effective on an HWD than on a computer screen. This is contrary to our prediction that self-selection of HWD position would lead to better performance for the HWD than for the computer screen, but replicates earlier findings by Pascale et al. (2019). Introducing a flash over the visual field at the onset of each PTE brought performance with the HWD up to the level of performance with the computer screen when the flash was absent. Nonetheless, the fastest time to detect PTEs, the best tracking performance, and the fewest screen checks were achieved with the computer screen when the flash was present. Under these conditions, participants probably relied on the computer screen to capture their attention exogenously. A formal statistical comparison across experiments is inappropriate, but the PTE detection latency of 1.59 s (SE = 0.05 s) for participants using the computer screen plus flash was descriptively faster than the 2.35 s (SE = 0.66 s) found for participants in Experiment 1 using the HWD with high contrast highlights and easy tracking, and closest to Browning’s (2016) 1.16 s (SE = 0.07 s) PTE detection latency in her HWD plus auditory alerts condition. However, in the presesnt studies, participants continuously faced a fixed computer screen, which is inconsistent with clinicians’ need to move around their workspace.
The benefits for the flash are consistent with those of Saint-Lot et al. (2020), who found that a flash over air traffic controllers’ screens was effective in alerting them to a breakdown of separation between aircraft. Saint-Lot et al.’s flash was orange-red, 15% opaque, and lasted for 300 ms. In their study, participants using the flash showed faster and more accurate breakdown of separation detections, but no difference between conditions on subjective workload or on an ongoing task. However, only participants who later disclosed that they had understood the meaning of the flash showed an improved detection rate; they also responded faster than participants who had not understood the meaning of the flash. In contrast, in our Experiment 2, the flash was white, 100% opaque, lasted 150 ms, and all participants were told that the flash meant that a PTE had occurred. When using the flash, participants responded faster, performed better at the ongoing tracking task, and reported lower workload, indicating an even more successful application of the flash concept than Saint-Lot et al. (2020) achieved.
One potential concern about Experiment 2 is that the significant display x flash interactions for many of the collected outcome measures (caused by exceptionally good performance in the computer condition with the flash) may have occurred because the flash in the computer screen condition was larger than on the HWD. The flash filled the entire 24″ LCD screen – a space larger than the vital sign display on the computer screen – which may have made it more salient. However, the pilot study suggests otherwise (see Schlosser et al. (2016)). In the computer screen condition of the pilot study, the flash was the same size as the vital sign display (about 20% of the available screen space; same visual angle as the HWD) rather than filling the entire screen. The smaller flash reduced participants’ PTE detection latency on average by 23.32% whereas the larger flash in the main study reduced it by 21.98%. Moreover, the smaller flash improved participants’ tracking task performance by an average of 3.32% versus by 4.57% with the larger flash. The similarity across the pilot study and main study results therefore suggests that the larger flash used in Experiment 2’s computer screen condition did not boost performance markedly more than the small flash in the pilot study. Therefore, a more plausible explanation for the display x flash interaction lies in binocular summation (Blake & Fox, 1973). Specifically, the HWD was monocular, and therefore visible only to one eye. As a result, the white flash on the HWD may have been weaker than the white flash on the computer screen, which was seen by both eyes and thereby benefitted from binocular summation.
We had hypothesized that the HWD would generally support faster PTE detections than the computer screen would because participants would have the freedom to position the HWD to their best advantage. However, participants detected PTEs more slowly overall when monitoring with the HWD than with the computer screen. For an extensive discussion of factors that might compromise the detection of peripheral targets on an HWD, see Pascale et al. (2019). The effect of HWD position on PTE detection latency and tracking performance reflects findings by Martin-Emerson and Wickens (1992) and Salvucci and Taatgen (2008) that tracking performance and visual choice task performance worsened as the degree of separation between the two tasks increased. In our study, when the HWD image overlapped the tracking task, participants detected PTEs faster than when the HWD was positioned in other areas of the wearer’s visual field, but it still did not reach the PTE detection speed for participants using the computer screen.
General Discussion
In this program of research, we investigated whether visual alerts added to dynamically changing numbers on an HWD would quickly and reliably capture the wearer’s attention while the wearer is carrying out an ongoing task. Our context for these investigations was the monitoring of multiple patients’ vital signs, and the ongoing task was a perceptual-motor task.
In Experiment 1, we established that highlighting abnormal vital signs with a high contrast against their background allowed participants to detect PTEs faster than highlights with low visual contrast, which is consistent with the findings of the HWD studies by Pascale et al. (2018), as well as the large research base on attention capture and visual alert design more generally. With the high contrast highlights, participants seemed more likely to rely on the highlights to draw their attention to the HWD rather than checking preemptively. In addition, ongoing task load affected PTE detections; when the tracking task was difficult rather than easy, participants were slower to detect PTEs, regardless of highlight contrast level. As sampling theory would suggest, participants performing difficult tracking may have had less time to glance at the HWD (Eisma et al., 2018; Moray, 1986; Sheridan, 1970) than those doing easy tracking. The outcome is also consistent with findings that higher perceptual load reduces the detection of stimuli in the periphery (Macdonald & Lavie, 2008) which has been associated with a reduction in the visual cortex’s response to contrast (Lavie et al., 2014). Moreover, the effects of the highlight and the tracking task on PTE detection are both consistent with the Salience Effort Expectancy Value (SEEV) model (Wickens et al., 2003) and the more recent Noticing SEEV (NSEEV) model (Steelman et al., 2011), with the high contrast highlights increasing ‘salience’ and the increased tracking task difficulty increasing the expectancy (i.e., bandwidth) and therefore decreasing the attentional attractiveness of the HWD which resulted in an increase in missed PTEs.
Experiment 2 was a further attempt to create a visual alert that would produce highly exogenous attention management. The white flash speeded responding for both the HWD and the computer screen, but less strongly for the HWD than for the computer screen. This result echoes findings that participants’ performance on some visual attention tasks is worse with an HWD than with an analogous display on a computer screen (Liu et al., 2009c; Pascale et al., 2018; Huckauf et al., 2010).
In both experiments, performance on the ongoing manual tracking task improved when attention management could be more exogenously driven with, respectively, the high contrast highlights and the white flash. Interestingly, the visual enhancements benefitting PTE detection also benefitted tracking. This indicates that the use of effective exogenous signals did not jeopardise ongoing task performance, a concern reflected in Saint-Lot et al.’s (2020) treatment of their orange–red flash.
Design Implications
The results of the experiments reported in this paper show that certain design elements can have an impact on the usability of HWDs for monitoring multiple processes. The results of Experiment 1 suggest that the high contrast highlights supported patient monitoring with no detriment to the concurrent tracking task. The results of Experiment 2 reinforce the message that findings with visual stimuli tested on external screens may not always generalise to HWDs, or their effects may be attenuated, so care should be taken with generalisation. Interestingly, participants in Experiment 2 who positioned the HWD in central vision were the fastest at detecting PTEs, suggesting a role for optical see-through HWD images that can be arranged over the whole visual field rather than in the periphery.
Finally, the results from the current experiments showed that high contrast alerts in the form of highlights or full-screen flashes can shift attention to important patient information on an HWD, but less reliably than similar alerts on binocularly viewed computer monitors. This is particularly relevant given the increasing enthusiasm for adopting HWDs in the field of medicine (Schlosser et al., 2021). If HWDs were to be generally less effective in attracting visual attention than conventional screens, their use as standalone vital sign monitors would have to be reconsidered. However, a binocular HWD with a larger visual field might decrease alarm detection times compared to the monocular HWD that we used in our experiments. Furthermore, in many clinical situations, participants’ slower PTE detection latency with monocular HWDs might be compensated for by the fact that HWDs provide continuous location-independent information. Ultimately, our results underline that visual alerts on HWDs must be designed carefully if they are to attract attention effectively.
Translation to Clinical Context
The results of Experiment 2 were considered sufficiently promising that the white flash was used in a subsequent small clinical trial with the HWD. Schlosser et al. (2019) developed a variant of the multiple patient monitoring display for use by supervising anaesthesiologists who provided backup for six other anaesthesiologists in an operating suite in a German Hospital. The supervising anaesthesiologist wore a Vuzix M300 HWD that showed the vital signs of six patients undergoing surgery. The white flash from Experiment 2 and a one-second long auditory tone were used to attract anaesthesiologists’ attention to abnormal values. In a crossover design, supervising anaesthesiologists carried out clinical duties for 3 hours while using either the HWD or their conventional monitoring technology (central monitoring station or bedside monitors). The anaesthesiologists acknowledged alarms by pressing a small button worn on their scrubs and reported a significantly larger proportion of alarms while wearing the HWD (67%) than while using conventional monitoring (7%) (Schlosser et al., 2019). Most participants expressed interest in the HWD’s potential and wished to test it further. Interestingly, no anaesthesiologist commented on the white flash. It is unclear to what extent the white flash contributed to the HWD’s effectiveness; tests with and without the flash would be needed to determine that.
The Schlosser et al. (2019) study suggests that using an HWD can be a viable solution for clinicians who must monitor the well-being of multiple patients at the same time, while moving between different locations in their work environment. Further contexts for application in healthcare include supervising nurses in an ICU context, who provide backup and expertise for several nurses working 1:1 with a patient, nurses in other critical care or high dependency units, physicians in ICUs, and triage or transportation leaders in mass casualty accident response teams who must maintain awareness of patient priority and patient evacuation to the appropriate level of care.
Limitations and Future Research
The studies reported have several limitations that suggest opportunities for future research. First, we chose non-clinician participants and used low-fidelity tasks in a highly controlled laboratory environment because the purpose of these preclinical experiments was to evaluate the efficacy of alerts signalling vital sign transition on HWDs, the results of which would inform the design of effectiveness studies in contexts more similar to the clinical environment. Further research in clinical or simulated clinical contexts and with clinicians – as in Schlosser et al. (2019) – are required to evaluate the effectiveness of HWDs for supporting multiple patient monitoring. As in Schlosser et al., further experiments involving mobility on the part of participants would probably show advantages for the HWD over conventional monitoring.
Second, we only evaluated the impact of the HWD on participants’ ability to notice changes. However, in any applied context the operator/clinician wearing an HWD to monitor multiple processes will have a degree of situation awareness, and therefore some expectations about upcoming system states. This would inevitably result in some degree of endogenously driven reorienting of attention which, depending on task requirements, could work together with exogenous alerting, and on occasions could even be more appropriate than strong exogenous alerts. How strongly a specific alert captures attention is partly contingent on the goals of the observer (Becker, 2018; Benoni, 2018; Folk et al., 1992; Kiss et al., 2011). Within the SEEV model of visual attention (Wickens et al., 2003), these top–down processes are represented by the ‘expectancy’ and ‘value’ factors. Although clinicians should always be aware of patient deterioration, any display would need to be carefully calibrated to attract focal attention only when appropriate (see Woods (1995) for a discussion of preattentive reference). Further research could consider features of HWDs that support other cognitive tasks such as maintaining situation awareness, applying expert knowledge, and communicating relevant information to team members. Furthermore, the NSEEV model could be applied (Steelman et al., 2017), in which the latency and miss rates can be predicted from knowing the salience and expectancy (i.e., bandwidth) of the different areas of interest to the observer in addition to the effort involved in moving attention to the areas and the value of single areas to the observer.
Third, we did not prospectively vary the position of the HWD. In Experiment 1 the HWD was in a fixed peripheral location. In Experiment 2 which introduced more of the naturalism that would be expected in a clinical context, participants could locate the HWD where they preferred. Participants who reported positioning the HWD more centrally responded to PTEs faster; this effect seemed to interact with flash such that the effect of flash was only a trend when the HWD position was far from the tracking task target. Future studies should examine effect of visual angle on specific kinds of visual alert. Steps in this direction have been taken by Pascale et al. (2018) and Kruse et al. (2020).
Finally, the HWD used in both experiments was the monocular and opaque Vuzix M100 HWD. New HWDs are being rapidly developed with new technology and features (Upton & Stein, 2015). Just as it is important for the current findings to be tested in high-fidelity clinical environments and with clinician participants, so is it important to perform tests of different devices such as binocular see-through augmented reality glasses.
Conclusions
We have shown that high contrast highlights or a white flash will improve the speed to detect PTEs on HWDs. Moreover, performance on an ongoing manual tracking task does not worsen, and can even improve, when strong visual alerts draw attention to an HWD when needed. Conventional computer screens may support better performance than HWDs in some respects, but the fact that HWDs move with the clinician around their workspace, and can be manipulated hands-free, makes them a compelling adjunct to clinical work, even in the absence of fully exogenous attention management. The results of our studies could guide future research in clinical contexts, and apply not only to healthcare, but also to other work contexts such as warehouse picking, logistics, and field services industries.
Supplemental Material
sj-pdf-1-hfs-10.1177_00187208221075851 – Supplemental Material for Attention to Changes on a Head-Worn Display: Two Preclinical Studies with Healthcare Scenarios
Supplemental Material, sj-pdf-1-hfs-10.1177_00187208221075851 for Attention to Changes on a Head-Worn Display: Two Preclinical Studies with Healthcare Scenarios by Isaac S. Salisbury, Paul D. Schlosser, Tsz-Lok Tang, Caitlin Browning, Ismail Mohamed, Tobias Grundgeiger, Robert G. Loeb and Penelope M. Sanderson in Human Factors: The Journal of Human Factors and Ergonomics Society
Footnotes
Acknowledgments
The authors thank Dr. Birgit Brecknell for assistance with programming and members of the Cognitive Engineering Research Laboratory for input on an earlier version of the manuscript. We also thank Reviewer 2 for suggestions on wording in our justification of the experiments.
Declaration of Conflicting Interests
The author(s) declared the following potential conflicts of interest with respect to the research, authorship, and/or publication of this article: R. G. Loeb has received $1000 per year to be on the Masimo Inc. Scientific Advisory Board. P. M. Sanderson is co-inventor of a respiratory sonification (Sanderson and Watson, US Patent 7070570). No other authors have competing interests to declare.
Funding
The author(s) disclosed receipt of the following financial support for the research, authorship, and/or publication of this article: This work was supported by Australian Research Council Discovery Project grant DP140101822. P. D. Schlosser was supported by the Max Weber-Program of the State of Bavaria.
Key Points
• Simulated patient vital signs were presented numerically on head-worn displays • High contrast changes and a full-screen white flash reorient visual attention best • A white flash alert is less advantageous on head-worn displays than fixed screens • The position of a head-worn display in the visual field may affect event detection • Results may apply to patient monitoring and other process monitoring tasks.
Supplemental Material
Supplemental material for this article is available online.
Author Biographies
References
Supplementary Material
Please find the following supplemental material available below.
For Open Access articles published under a Creative Commons License, all supplemental material carries the same license as the article it is associated with.
For non-Open Access articles published, all supplemental material carries a non-exclusive license, and permission requests for re-use of supplemental material or any part of supplemental material shall be sent directly to the copyright owner as specified in the copyright notice associated with the article.