
Abstract
Objective
The aim of this study was to establish the effects of simultaneous and asynchronous masking on the detection and identification of visual and auditory alarms in close temporal proximity.
Background
In complex and highly coupled systems, malfunctions can trigger numerous alarms within a short period of time. During such alarm floods, operators may fail to detect and identify alarms due to asynchronous and simultaneous masking. To date, the effects of masking on detection and identification have been studied almost exclusively for two alarms during single-task performance. This research examines 1) how masking affects alarm detection and identification in multitask environments and 2) whether those effects increase as a function of the number of alarms.
Method
Two experiments were conducted using a simulation of a drone-based package delivery service. Participants were required to ensure package delivery and respond to visual and auditory alarms associated with eight drones. The alarms were presented at various stimulus onset asynchronies (SOAs). The dependent measures included alarm detection rate, identification accuracy, and response time.
Results
Masking was observed intramodally and cross-modally for visual and auditory alarms. The SOAs at which asynchronous masking occurred were longer than reported in basic research on masking. The effects of asynchronous and, even more so, simultaneous masking became stronger as the number of alarms increased.
Conclusion
Masking can lead to breakdowns in the detection and identification of alarms in close temporal proximity in complex data-rich domains.
Application
The findings from this research provide guidance for the design of alarm systems.
Introduction
In many complex data-rich domains, such as aviation and process control, system safety depends greatly on the timely detection and correct identification of alarms. Alarm detection and identification pose a challenge to operators because the number and degree of coupling of systems in many workplaces have increased significantly. As a result, a single anomaly can trigger a series of related alarms in a very short period of time and thus turn into an alarm flood (Perrow, 2011). An alarm flood is defined as more than 10 alarms in a 10-minute period, but this rate is often exceeded in real-world settings (EEMUA, 1999). For example, in the 1994 Texaco Refinery explosion (Milford Haven, Wales), two operators had to respond to 275 alarms during the last 10.7 minutes of the accident, or approximately one alarm every two seconds. The operators therefore missed critical alarms that could have helped them diagnose and resolve the crisis (HSE, 1997).
The risk of operators missing critical signals during an alarm flood is rooted in perceptual and attentional limitations related to different types of masking. Masking occurs when one stimulus is obscured by the presence of another stimulus (Enns et al., 2000). It can affect two stimuli that are temporally overlapping (e.g. see research on change blindness; Lu, 2014; Rensink, 2002; Simons & Levin, 1997) or contiguous (Breitmeyer & Öğmen, 2006). When the two stimuli are temporally contiguous, masking can affect the detection of the first stimulus (known as backward masking) or the second stimulus (known as forward masking). As an example of forward masking, attentional blinks involve the failure to detect the second of two target stimuli when both are presented in close temporal proximity (200–600 ms apart, according to the literature in attention research). Masking effects were first and primarily studied in the visual modality but more recent studies confirmed their manifestation for auditory stimuli, both intramodally between two auditory stimuli (Arnell & Jolicœur, 1999; Carhart et al., 1969; Doll et al., 1992; Fastl & Zwicker, 2006; Pavani & Turatto, 2008) and cross-modally between visual and auditory stimuli (Arnell, 2006; Arnell & Jolicœur, 1999; Arnell & Larson, 2002; Van der Burg et al., 2010; Van Der Burg et al., 2013). Masking was reported as the most frequent reason (nearly 50% of all cases) for missing an alarm in a survey of industrial operators (from a chemical manufacturer, a confectionery company, and a nuclear power plant; Stanton, 1993).
There is an abundance of basic research on change blindness and attentional blink; however, the contribution of these two phenomena to breakdowns in alarm detection in real-world environments is still unclear. For one, almost all research on masking to date has focused exclusively on the detection and identification of just two stimuli. It is therefore unclear to what extent findings from those studies apply to real-world settings where operators experience significantly larger numbers of alarms. It has been shown that a person’s ability to report multiple concurrent or temporally close targets decreases with an increase in the number of stimuli (Boot et al., 2007; Burr et al., 2010). Other limitations of earlier research on masking include that the vast majority of studies have examined the two phenomena in the visual modality only, and participants in these studies were most often responsible only for detecting target stimuli. In contrast, alarm floods in real-world domains involve exceedingly large numbers of visual and auditory signals, and operators in these fields have to timeshare multiple tasks. Finally, based on limited empirical evidence, the timing at which forward masking is experienced in more complex and demanding environments appears to be longer than suggested by basic research on masking. For example, Ferris et al. (2006) observed a higher miss rate with an SOA (stimulus onset asynchrony) of 1000 ms (compared to an SOA of 500 ms for attentional blink). Establishing the actual SOA range for asynchronous masking of visual and auditory stimuli in complex data-rich environments is important for being able to predict and counteract the failure to detect alarms in real-world settings.
The reported research aimed to address the above limitations in the literature. To this end, two experiments were conducted using an unmanned aerial vehicle (UAV) control simulation. Participants were tasked with acting as supervisory controllers of a commercial drone-based package delivery system. The first experiment aimed to identify the SOAs at which masking effects are observed in a demanding multitask environment. The second experiment had two objectives: (1) to establish the relative contributions of simultaneous and asynchronous masking to missed and misdiagnosed visual and auditory alarms under varying workload (i.e., during routine operations and in an alarm flood) and (2) to investigate the effect of the number and temporal distribution of alarms on alarm detection and identification.
Experiment 1: Establishing the SOA Range for Asynchronous Masking
The goals of this experiment were to understand to what extent masking effects are observed in a demanding multitask environment and at what SOA range they are experienced. Based on the review of previous studies, the following hypotheses were formulated: • H1-1: Due to masking, when two alarms are presented in close temporal proximity, the detection rate and accuracy for the second alarm will be lower, compared to single alarms that appear in isolation. • H1-2: The effect described in H1-1 will be observed with an SOA longer than the 200–600 ms range reported in earlier basic research. • H1-3: The effect described in H1-1 will be observed both intra- and cross-modally for visual and auditory alarms. • H1-4: Alarm floods will result in lower detection rates, identification accuracy and longer response times to alarms, compared to routine operations.
Method
Participants
The participants in this study were 15 students recruited from the College of Engineering at the University of Michigan. All participants were between 20 and 35 years old (mean = 24.2 years, SD = 3.4 years; 8 males and 7 females). They all reported to have normal or corrected-to-normal vision, normal color vision, and normal hearing ability. This research complied with the American Psychological Association Code of Ethics and was approved by the Institutional Review Board at the University of Michigan (UM IRB: HUM00144319). Informed consent was obtained from each participant.
Apparatus and Tasks
The simulation used in this study was a simulated interface of a ground-based drone control system. It consisted of a computer with a keyboard, an optical mouse, a 23-inch LCD monitor, a pair of stereo speakers, and an audio recorder.
During the experiment, participants were required to perform three tasks: delivery consent, alarm detection and identification, and air traffic control monitoring. Delivery consent was required whenever a drone reached a customer residence. Simulated video feeds from eight drones were presented on the screen (see Figure 1). The drone would follow predetermined flight paths to customer residences. Once it reached a delivery address, it hovered in midair. The participant needed to determine whether the customer had placed a delivery pad (with the letter “H” on it) on the ground. Upon detection of the pad, the participant should press the top button (with a “target” symbol) next to the corresponding drone window to give consent to the delivery of the package. If the pad was not present, the participant needed to click on the second button from the top (showing the same “target” symbol but with a line drawn across it) to cancel the delivery. The drone would then proceed to the next customer without dropping the package. Drone simulation interface (displaying a red visual alarm for drone 8; requiring the response “R8”).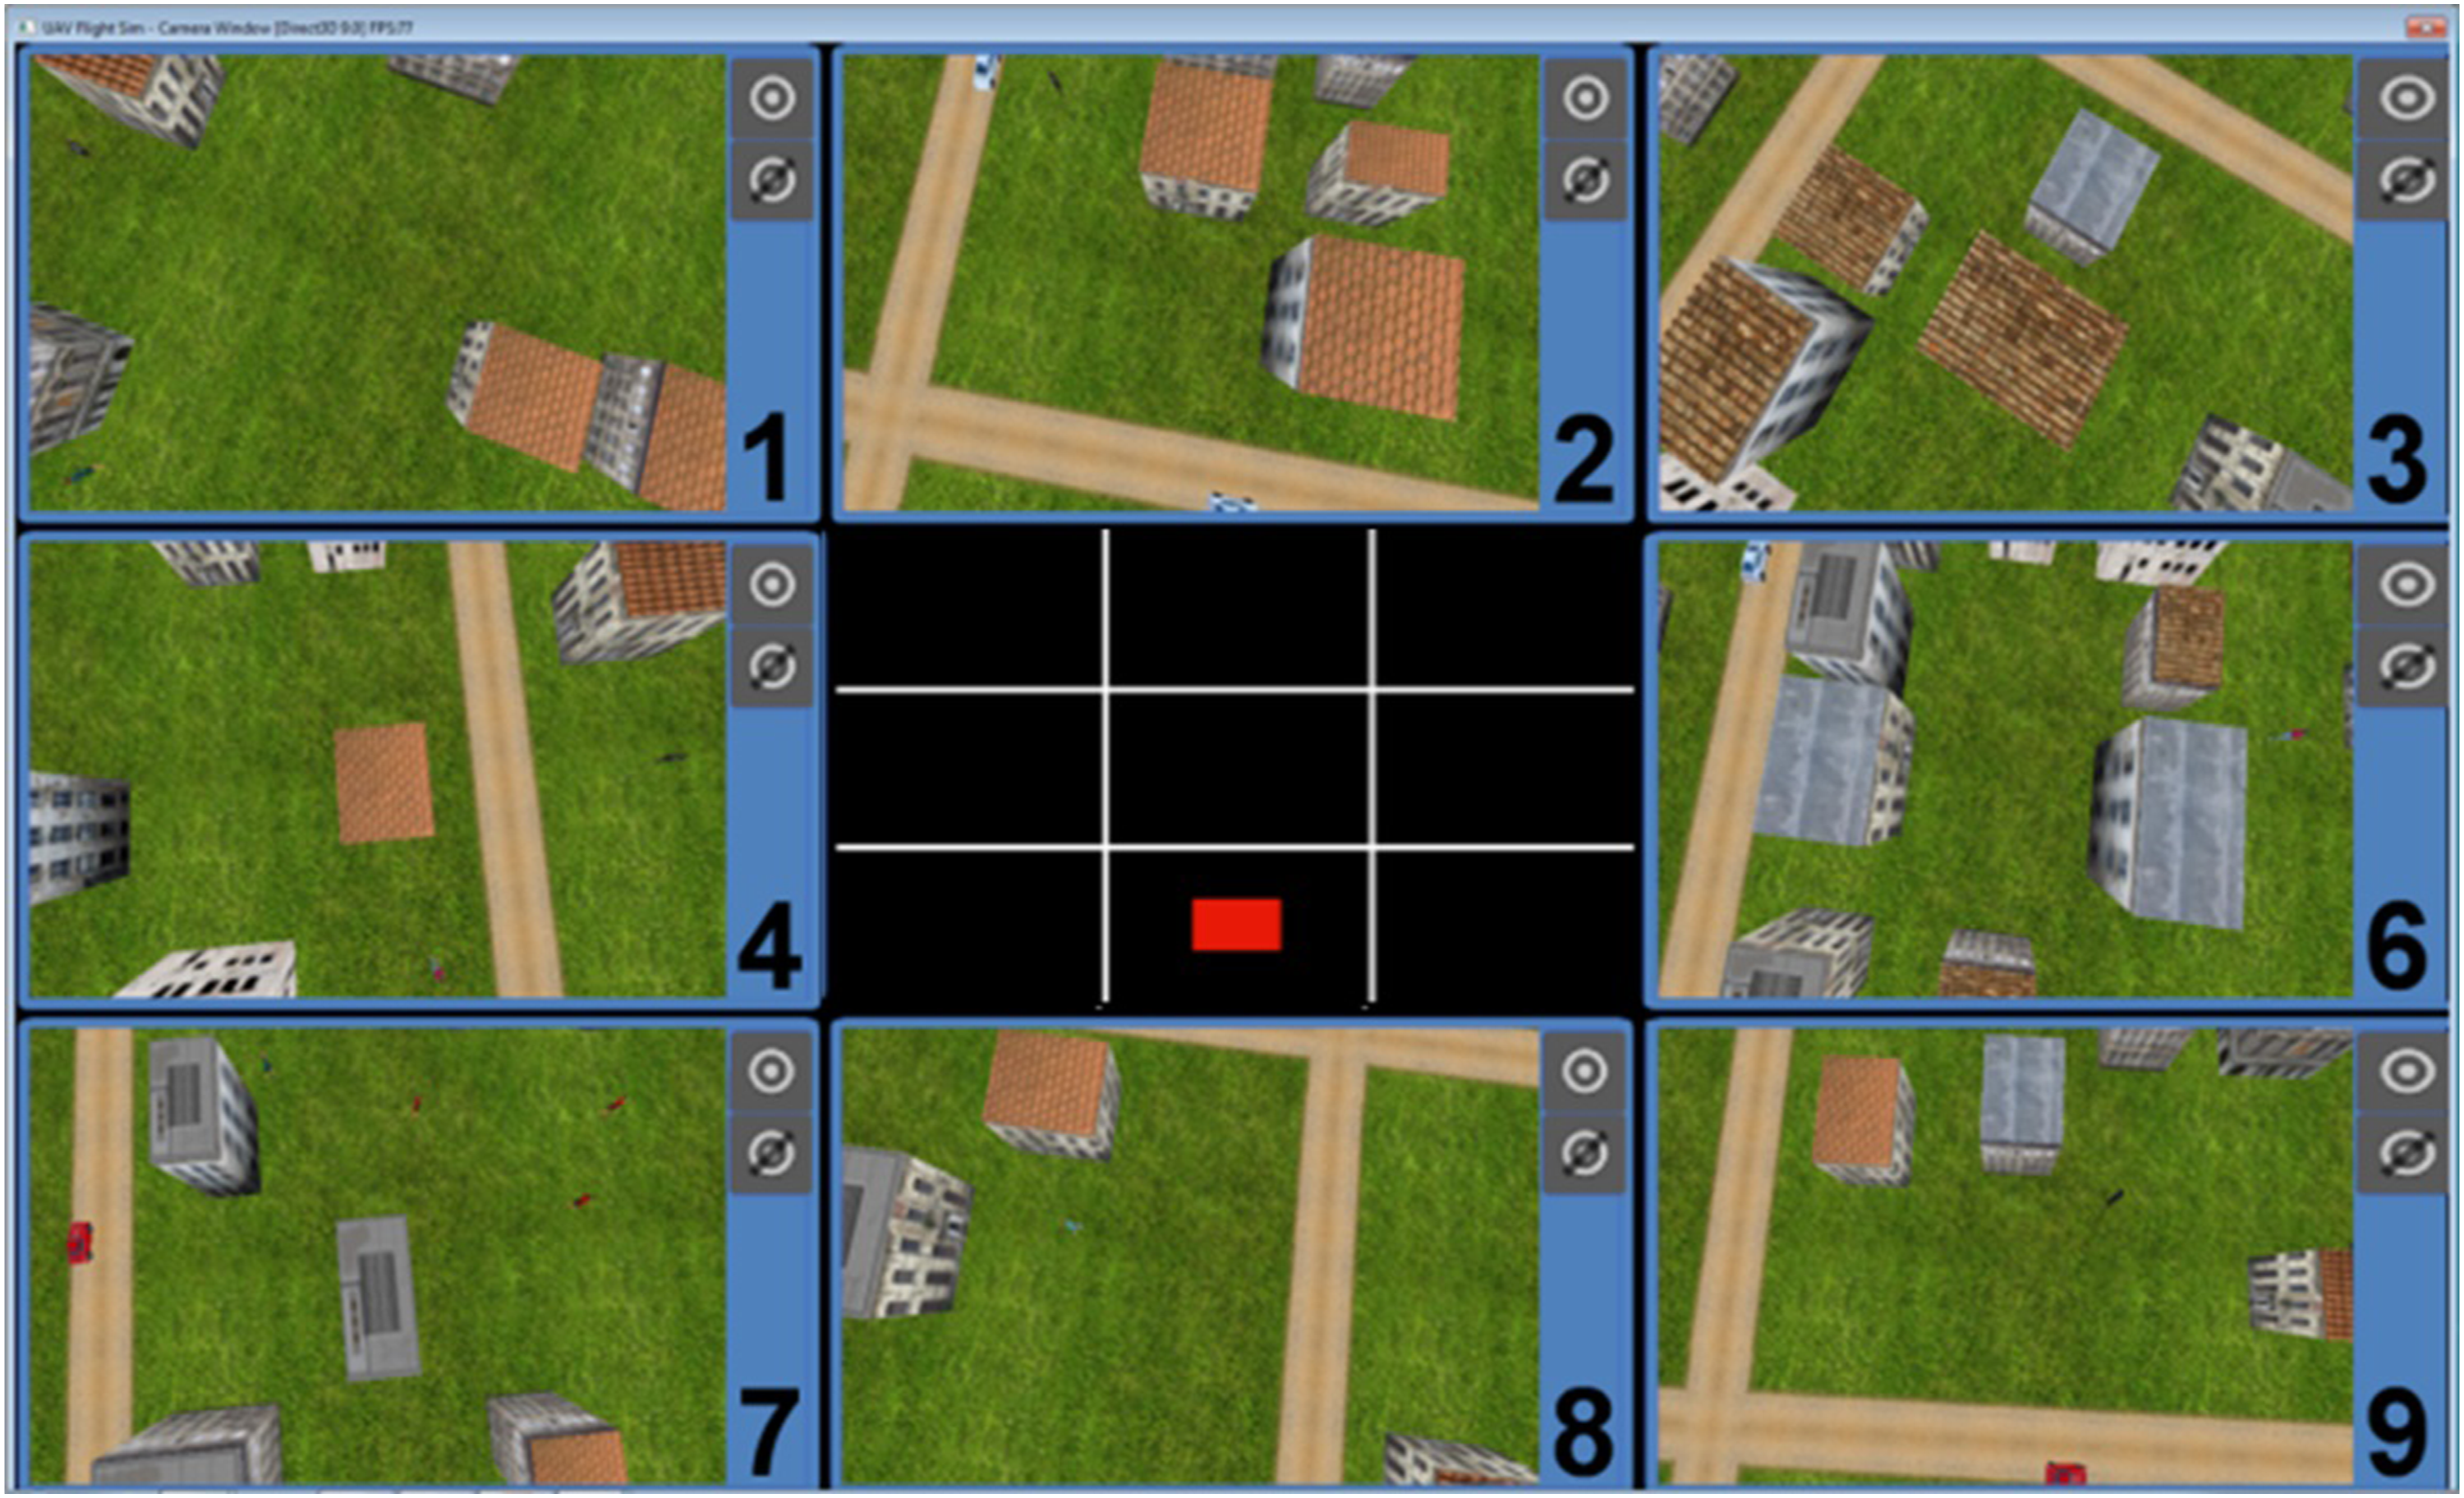
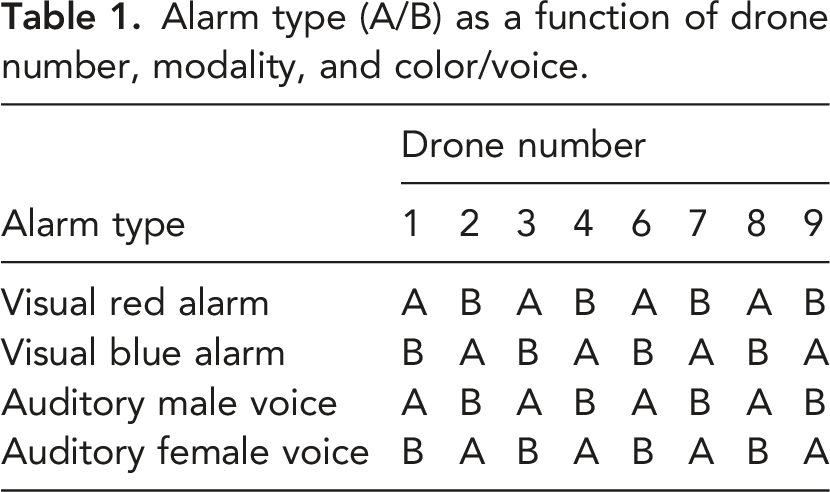
Throughout the experiment, visual and auditory alarms were presented whenever there was a temporary link loss between any of the drones and the ground control station. Visual alarms were presented in the central window of the screen, which was divided into a 3x3 grid (see Figure 1). The outer rectangles of the central alarm grid mapped spatially onto the eight drone windows. A visual alarm was displayed as a small red or blue box in the rectangle adjacent to the affected drone (see Figure 1 for an example of an alarm related to drone #8; the color coding is explained below). Auditory alarms were presented using a synthesized male or female voice.
Alarm type (A/B) as a function of drone number, modality, and color/voice.
A third task required participants to monitor a continuous audio recording of air traffic control. They were monitoring for three pre-recorded messages containing their call sign “DOI51.” These messages were randomly distributed throughout an actual tower recording. To increase the difficulty of the task, another three messages were added that contained similar information but did not include the call sign “DOI51.” Whenever participants heard the call sign, they were required to press the space bar on the keyboard as quickly as possible. This task was introduced to create resource competition in the auditory channel, similar to the competing demands for visual attention of the delivery consent and the visual alarm monitoring tasks.
Experiment Design and Procedure
Types of alarms and alarm pairs.
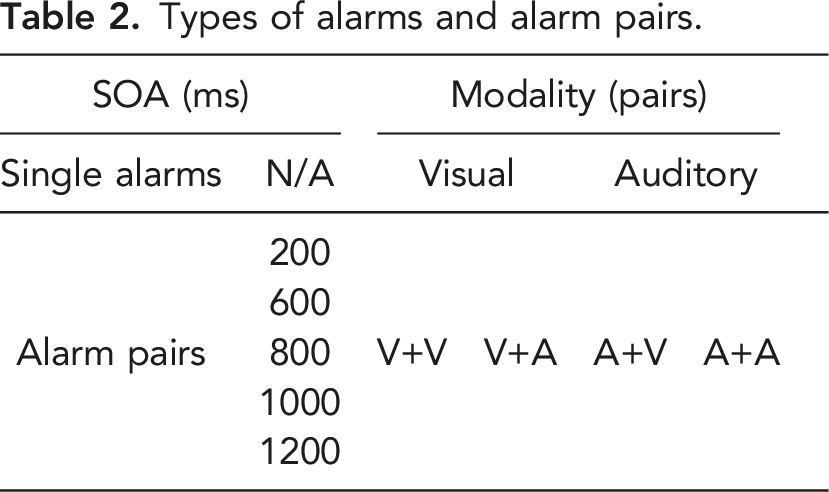
The experiment consisted of three 20-minute scenarios, named early (alarm) flood, late (alarm) flood, and (alarm) flood only, respectively (see Figure 2). Each scenario included 17 minutes of routine operations and a 3-minute alarm flood. The only difference between the early and late flood scenarios and the flood only scenario was that, in the latter, alarms were presented only during the 3-minute alarm flood. The three scenarios were designed so that participants were unable to anticipate when the alarm flood would occur. In each scenario, the delivery consent task was presented 30 times (about once every 40 seconds). During routine operations in the early and late flood scenarios, 20 of the delivery consent tasks were followed by a single alarm (10 times) or an alarm pair (10 times). In the flood only scenario, no alarms were presented during routine operations. The alarm flood started 5, 10, or 15 minutes into the early flood, flood only, and late flood scenario, respectively. During the 3-minute alarm flood, 30 single alarms and 30 alarm pairs were presented to the participant. The order of alarms was randomized. Air traffic control messages were presented about once per minute throughout the scenario. Three scenarios and the distribution of alarms.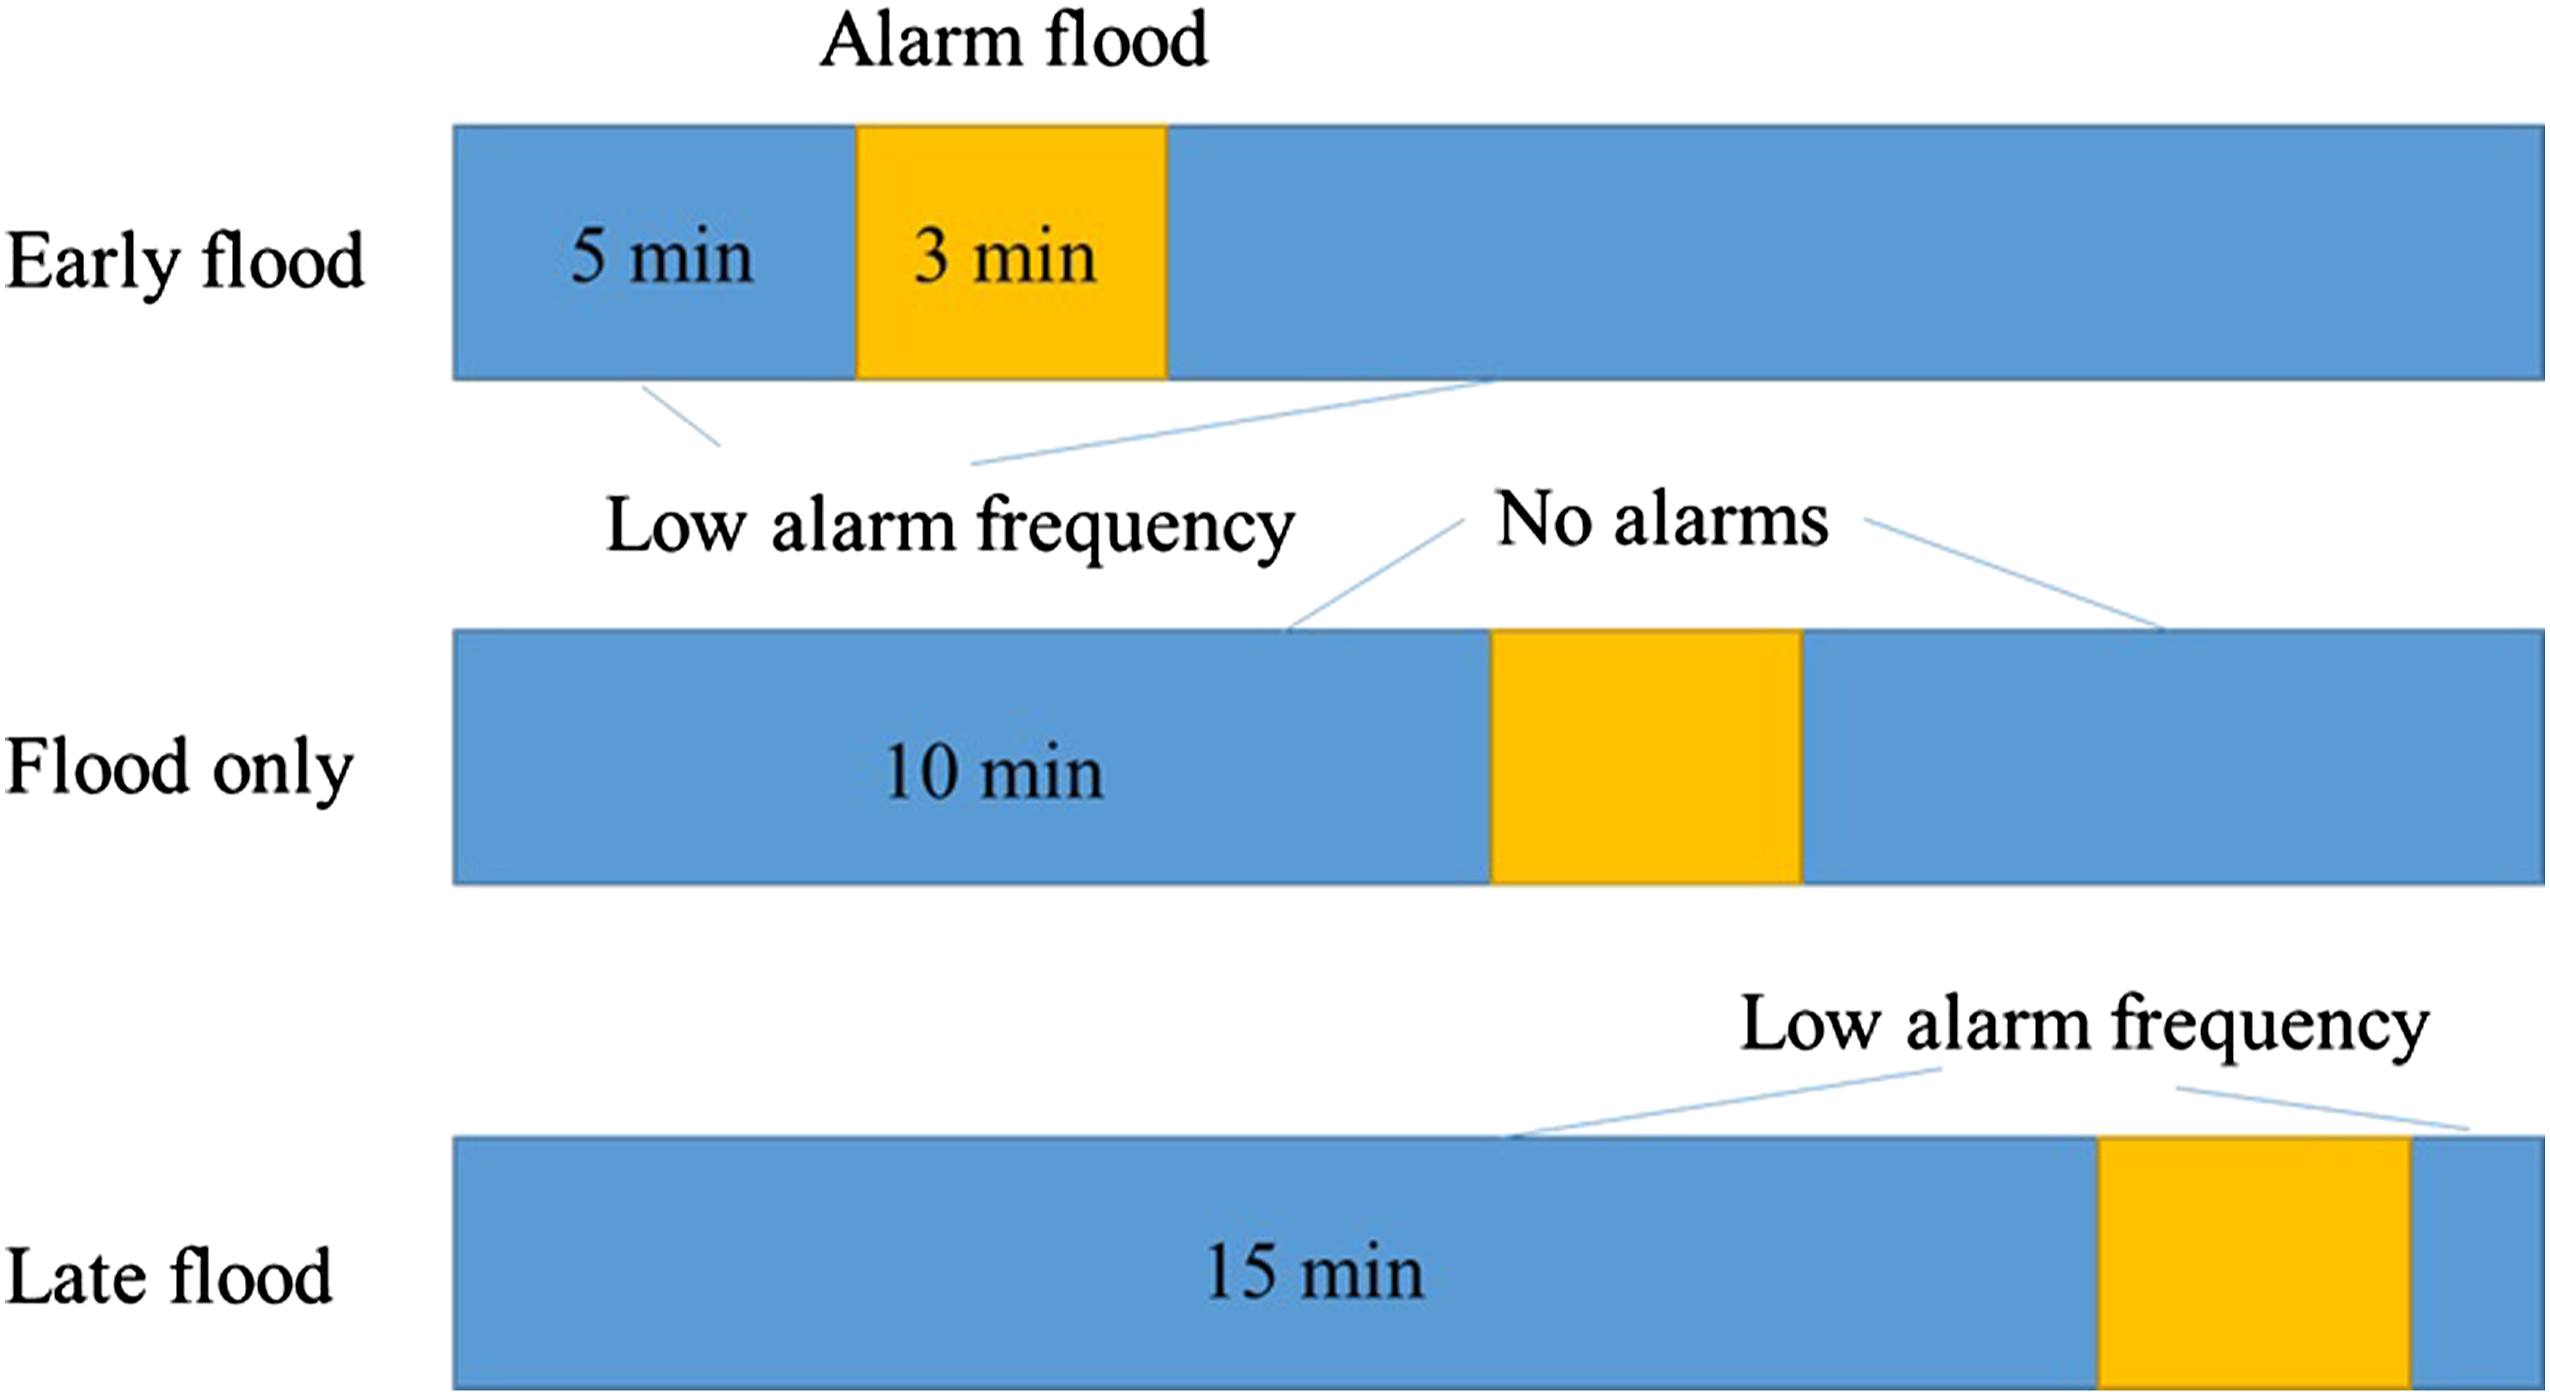
Upon arrival at the laboratory, participants were asked to read and sign a printed consent form. Their chair was then adjusted so that their eyes were about 20 inches from the center of the screen. At this distance, the size of the visual alarms equaled 0.125 rad visual angle. Next, participants were given instructions for their three tasks and told to give equal priority to all tasks. They then received four to five 5-minute training sessions to familiarize themselves with the tasks until they reached a combined accuracy of 90% or higher across all three tasks. Following the training sessions, the participant took a short break before starting the three 20-minute experiment sessions. The order of the three sessions was counterbalanced between participants. Before each session, cross-modal matching was performed by adjusting the volume of the auditory alarms to match the intensity of the visual alarms (Colman, 2015; Pitts et al., 2016). The entire experiment lasted about 100 minutes.
Dependent Measures
The dependent measures in this study were detection rate and accuracy for the alarm monitoring task, accuracy and response time for the delivery consent task, and accuracy and response time for the air traffic control monitoring task. The alarm detection rate was defined as the percentage of alarms that the participant responded to, regardless of the accuracy of the response. Accuracy was assessed based on the percentage of correct responses to alarms, out of all responses. For the delivery consent task, accuracy was calculated as the percentage of correct responses (giving consent only when a delivery pad was present and vice versa). Response time was defined as the time from when the drone stopped to when the participant pressed the button. For the air traffic control monitoring task, accuracy was determined based on the percentage of correct responses (only responding when the call sign was announced). Response time was defined as the time from the start of the call sign to the time when the space key was pressed.
Results
The data from this experiment were analyzed using SPSS. Detection rate and accuracy were recorded as binary true/false data and analyzed using the generalized linear mixed model (GLMM, with a binary logit link) in SPSS. Response time was analyzed using the linear mixed model (LMM) in SPSS. For all analyses, the significance level was set at p < .05. Error bars in the various figures represent standard errors.
Since response time for the delivery consent task was not assessed during training, Pearson’s correlation coefficients between the response time to the delivery consent task and the time elapsed since the start of the experiment were calculated for each participant. This served to determine whether participant performance improved throughout the experiment. The maximum R2 was 0.05, indicating that there was no learning effect.
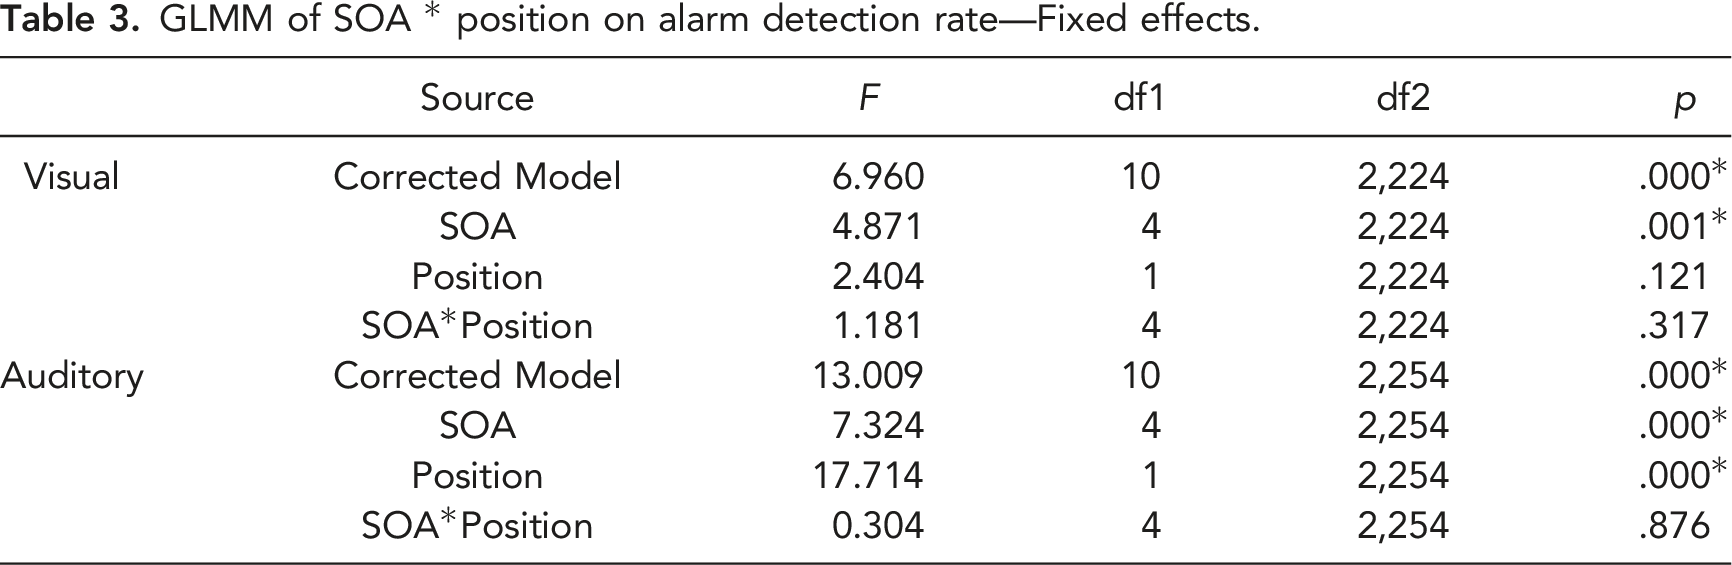
Detection Rate for Alarms
GLMM of SOA * position on alarm detection rate—Fixed effects.
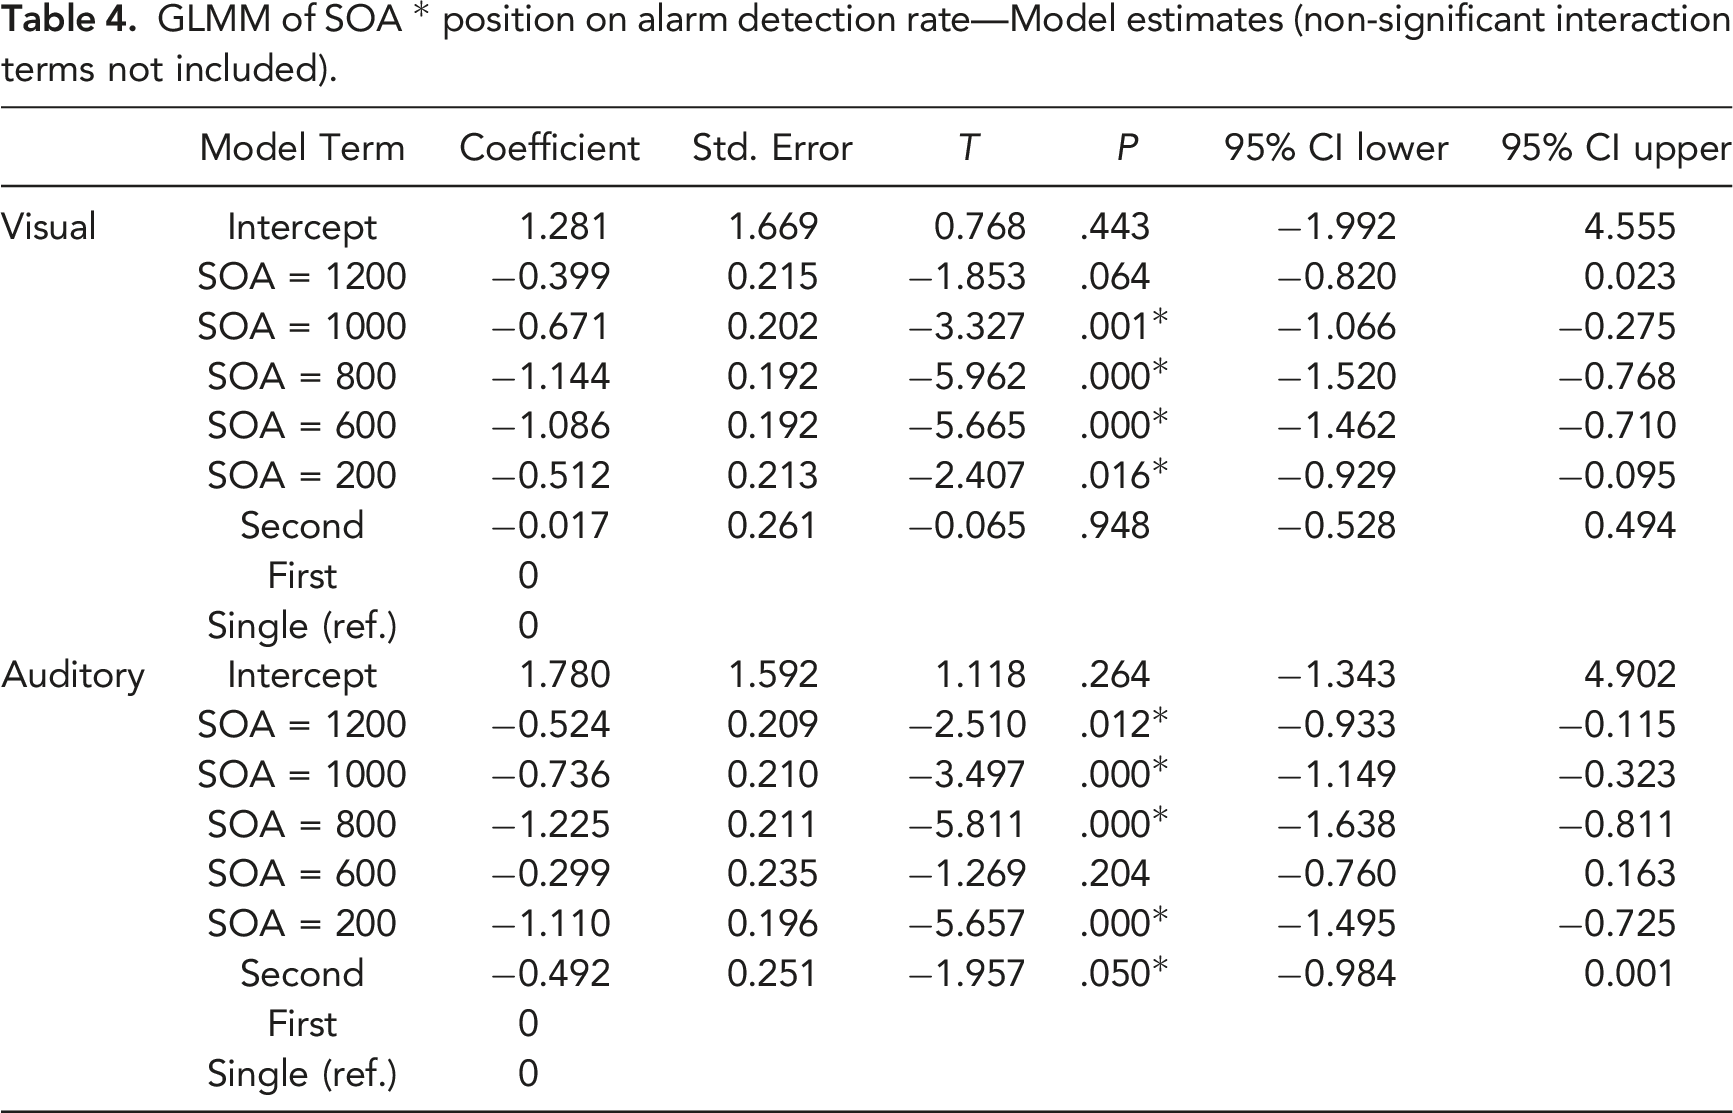
GLMM of SOA * position on alarm detection rate—Model estimates (non-significant interaction terms not included).
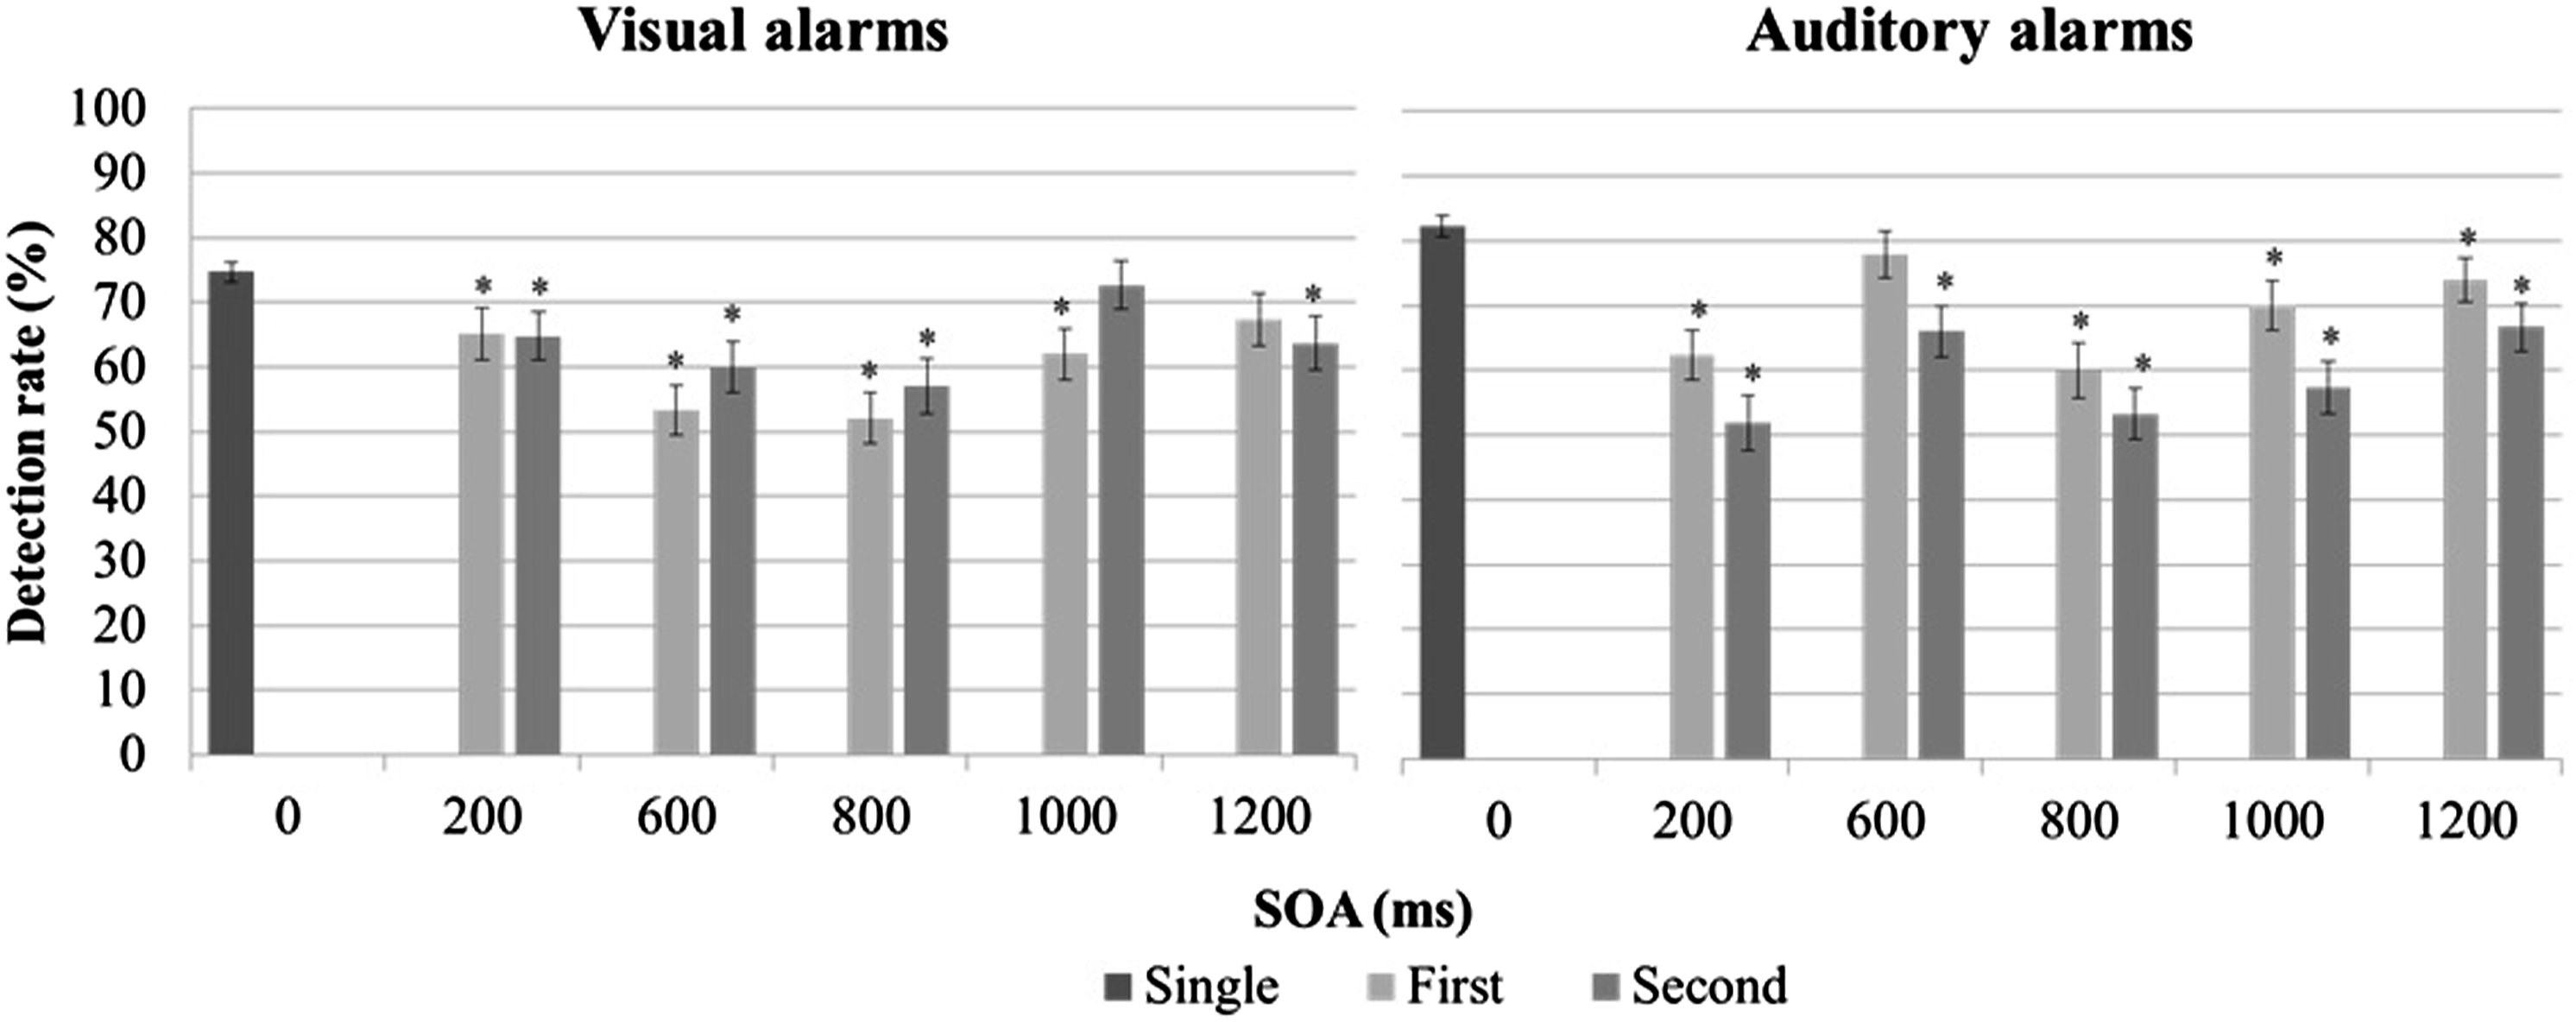
Detection rates for alarms as a function of position and SOA (*p < .05 when compared with single alarms).
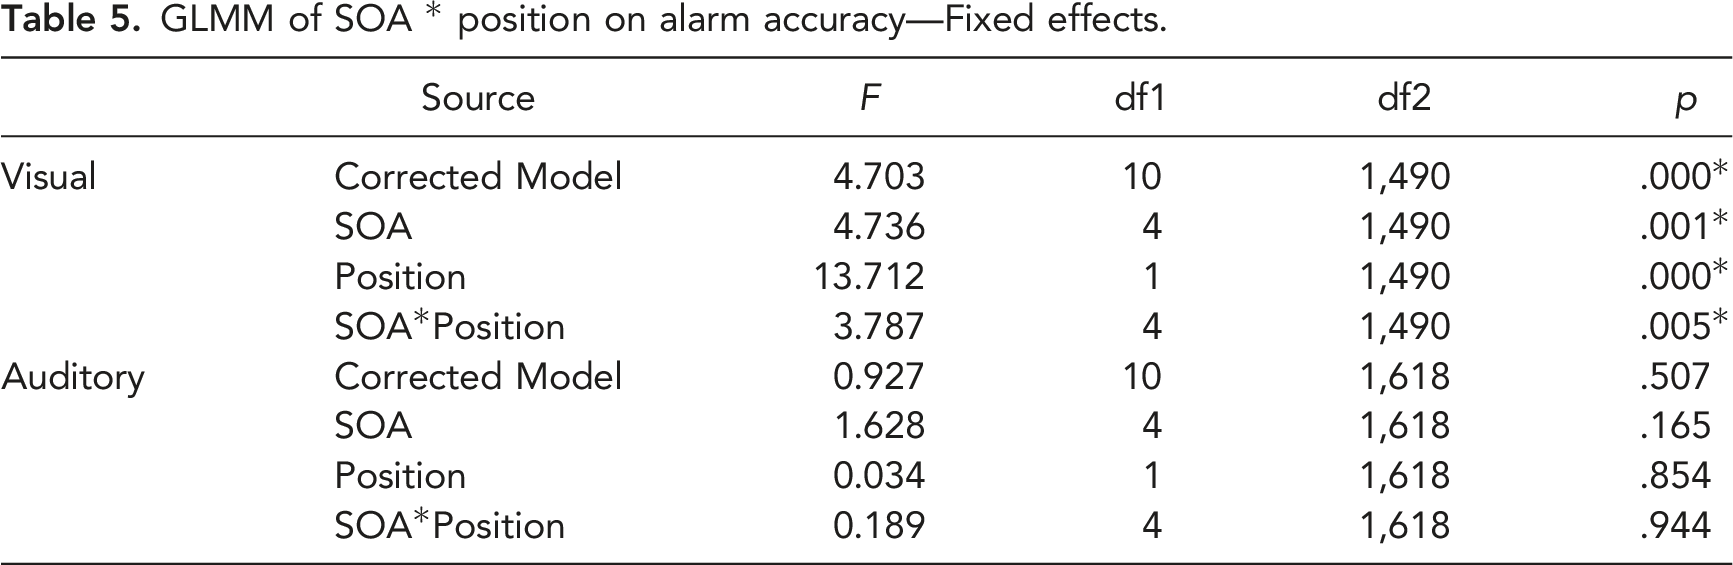
Identification Accuracy for Alarms
GLMM of SOA * position on alarm accuracy—Fixed effects.
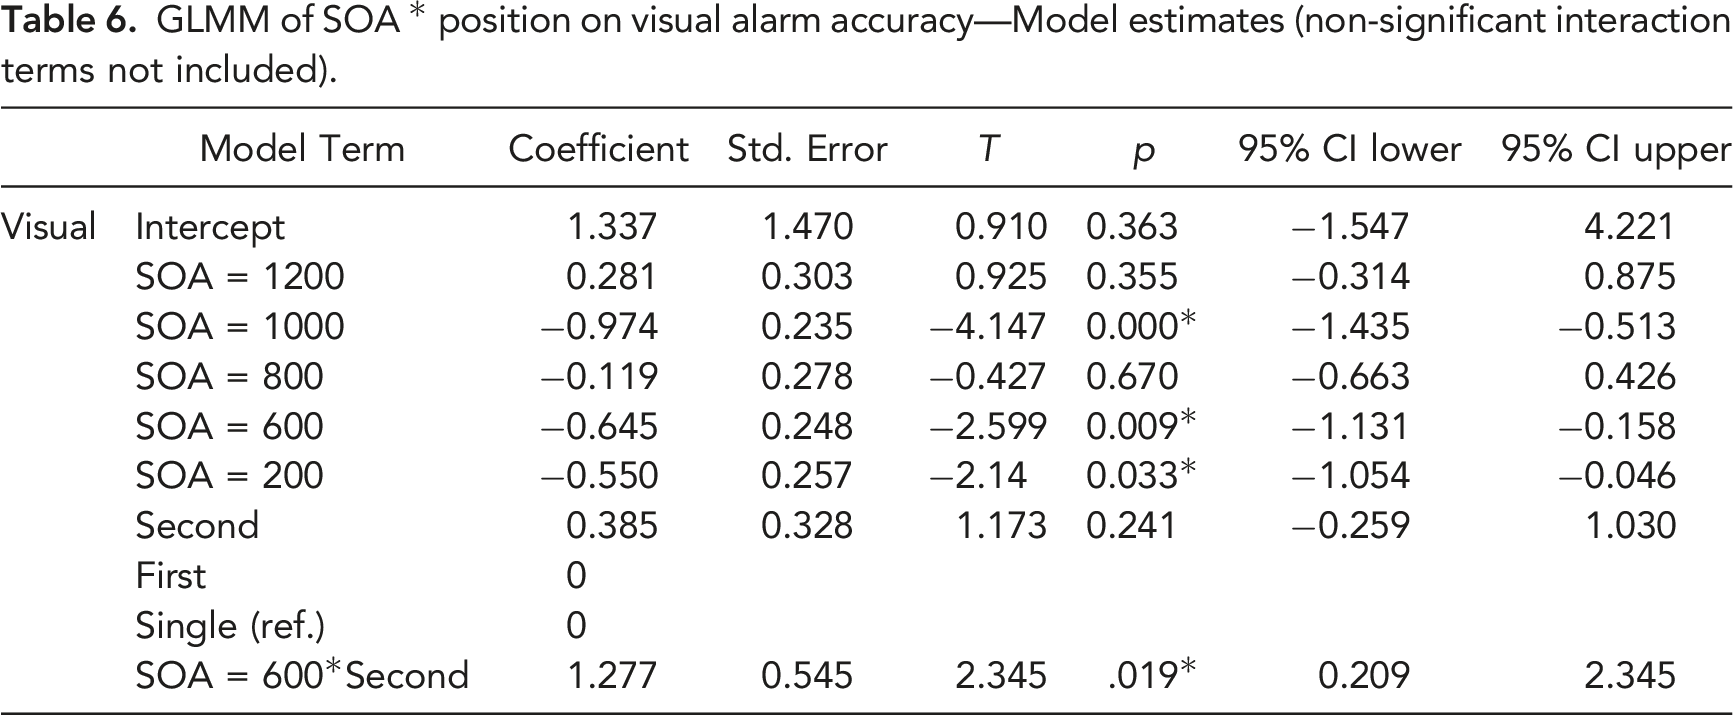
GLMM of SOA * position on visual alarm accuracy—Model estimates (non-significant interaction terms not included).
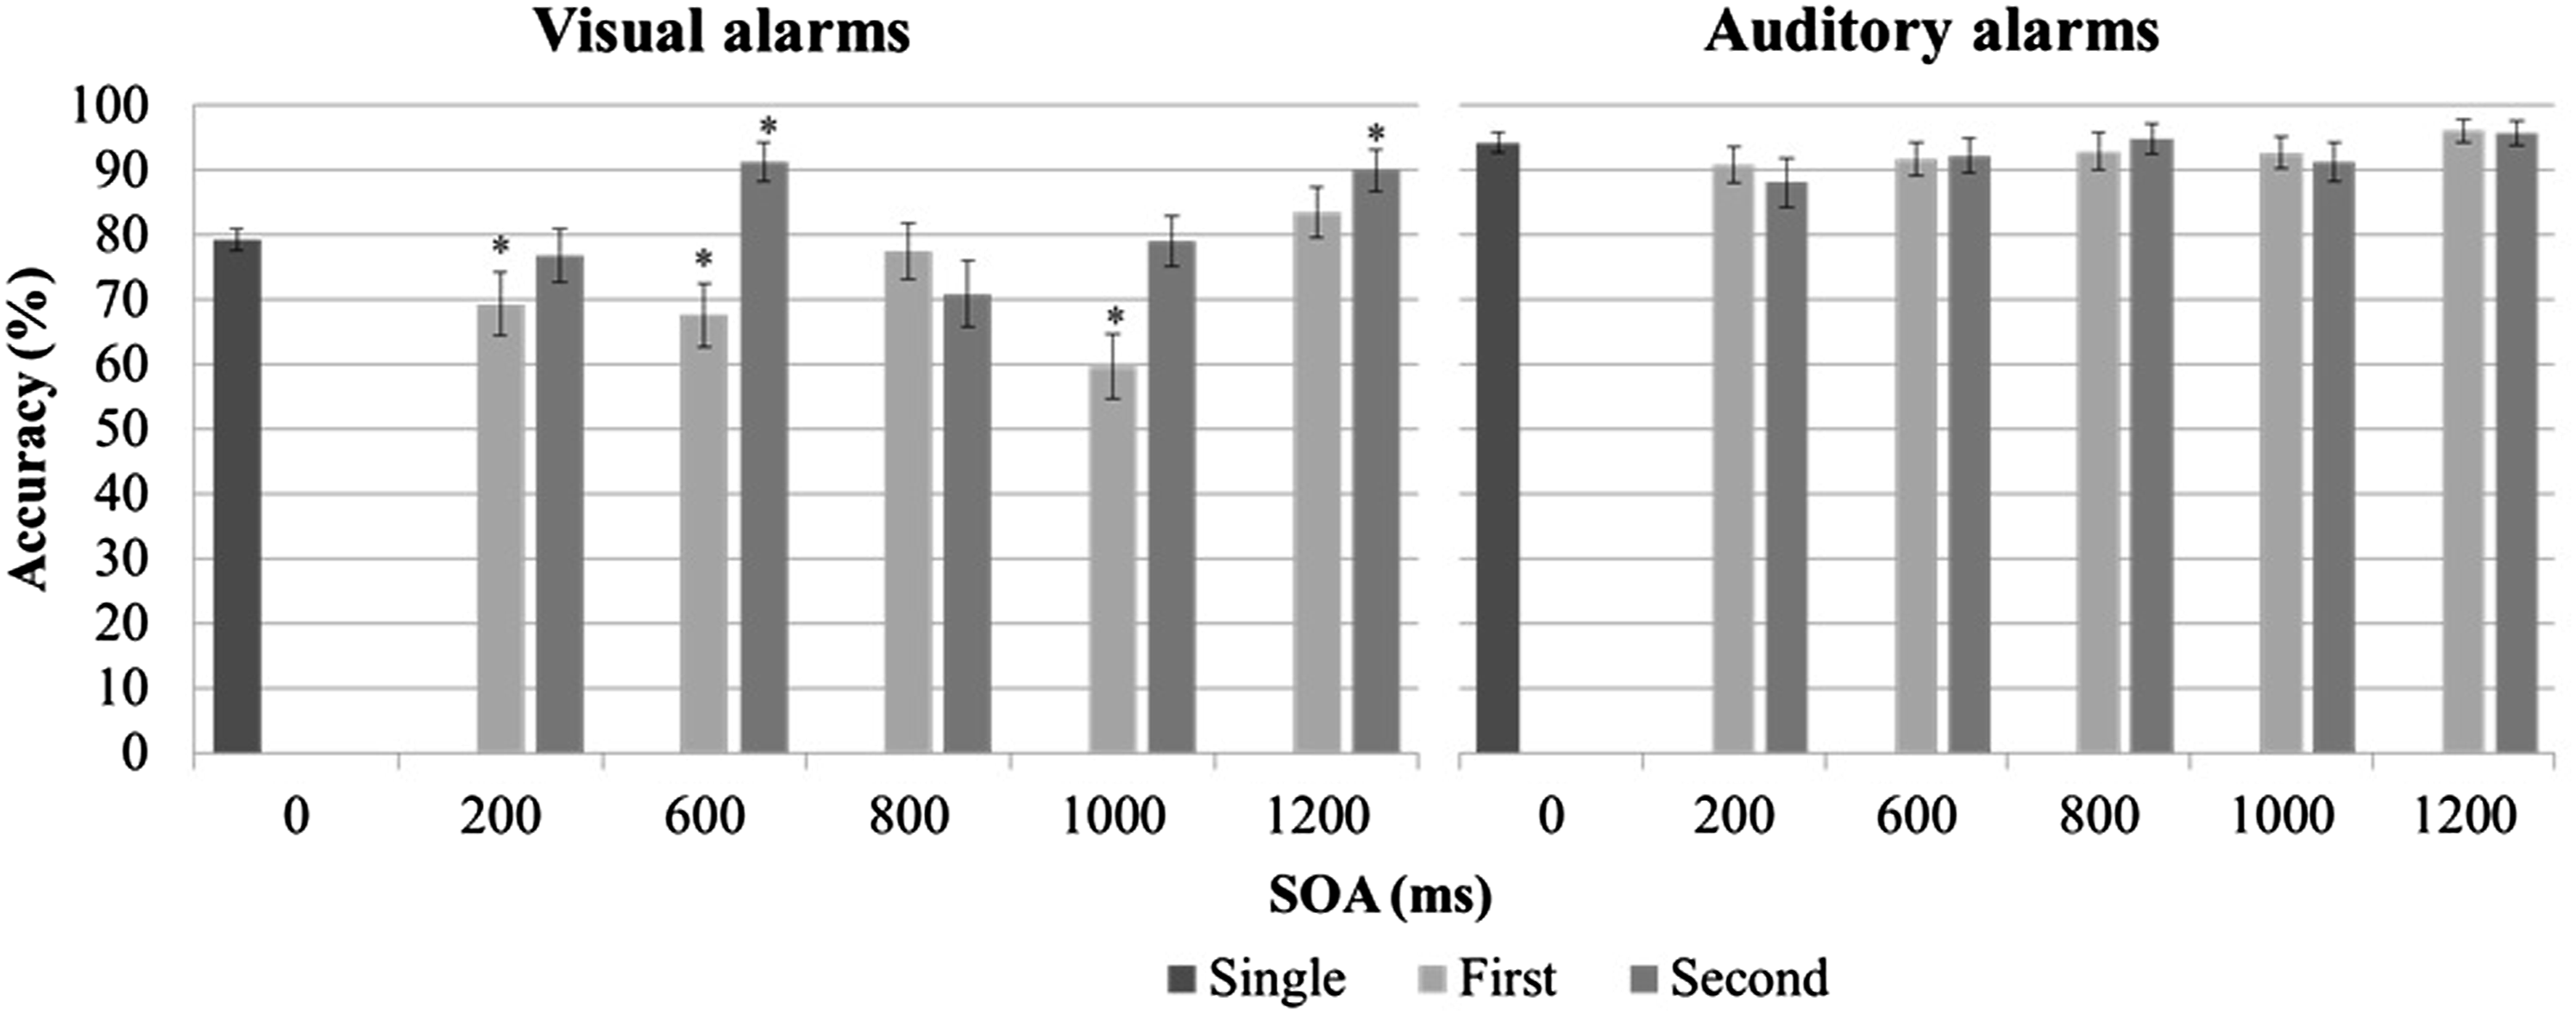
Accuracy for alarms as a function of position and SOA(*p < .05 when compared with single alarms).
Cross-modal Effects in Alarm Detection and Accuracy
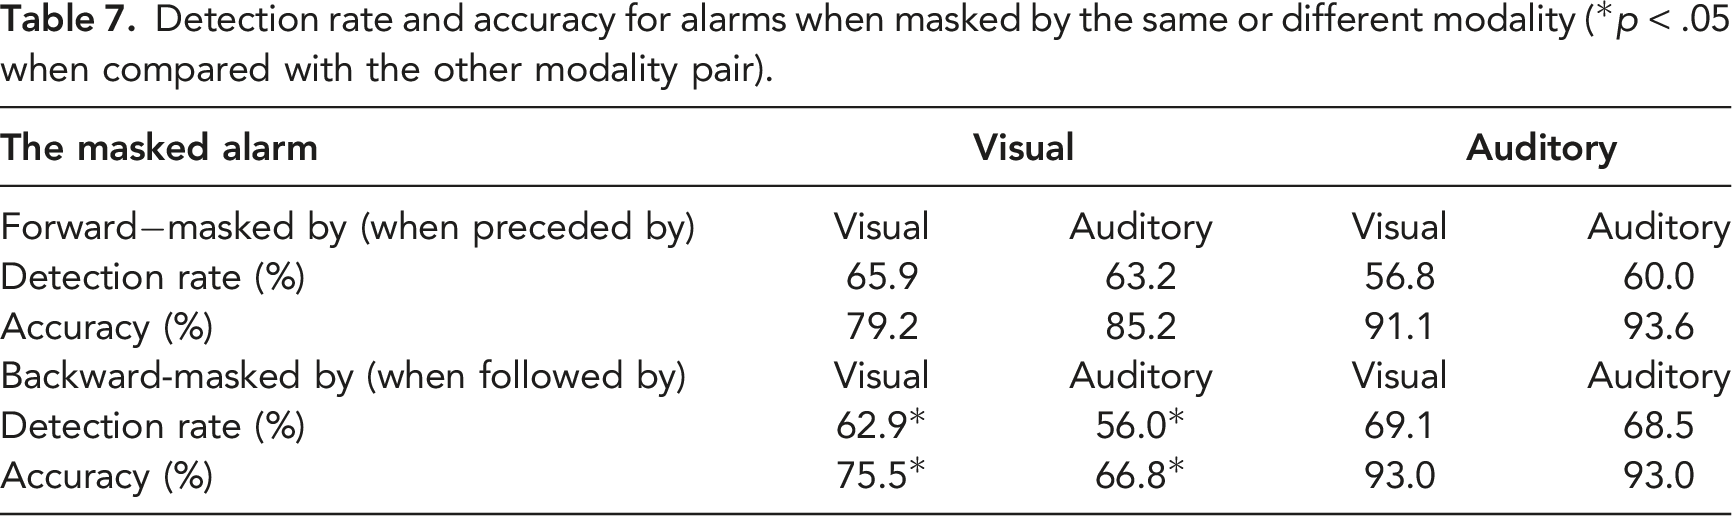
Detection rate and accuracy for alarms when masked by the same or different modality (*p < .05 when compared with the other modality pair).
Alarm Flood Analysis
To test H1-4, GLMMs were fitted on the detection rate and accuracy for all alarms. Workload (routine vs. flood) was set as a fixed effect factor and participant was set as a random effect factor. The overall detection rate for all alarms was significantly lower during alarm floods, compared to routine operations (64.6% vs. 98.7%; F(1, 4498) = 86.352, p < .001). Accuracy was also significantly lower during alarm floods (85.0% vs. 90.1%; F(1, 3128) = 9.066, p = .003; see Figure 5). Detection rate and accuracy during alarm floods versus routine periods (*p < .05).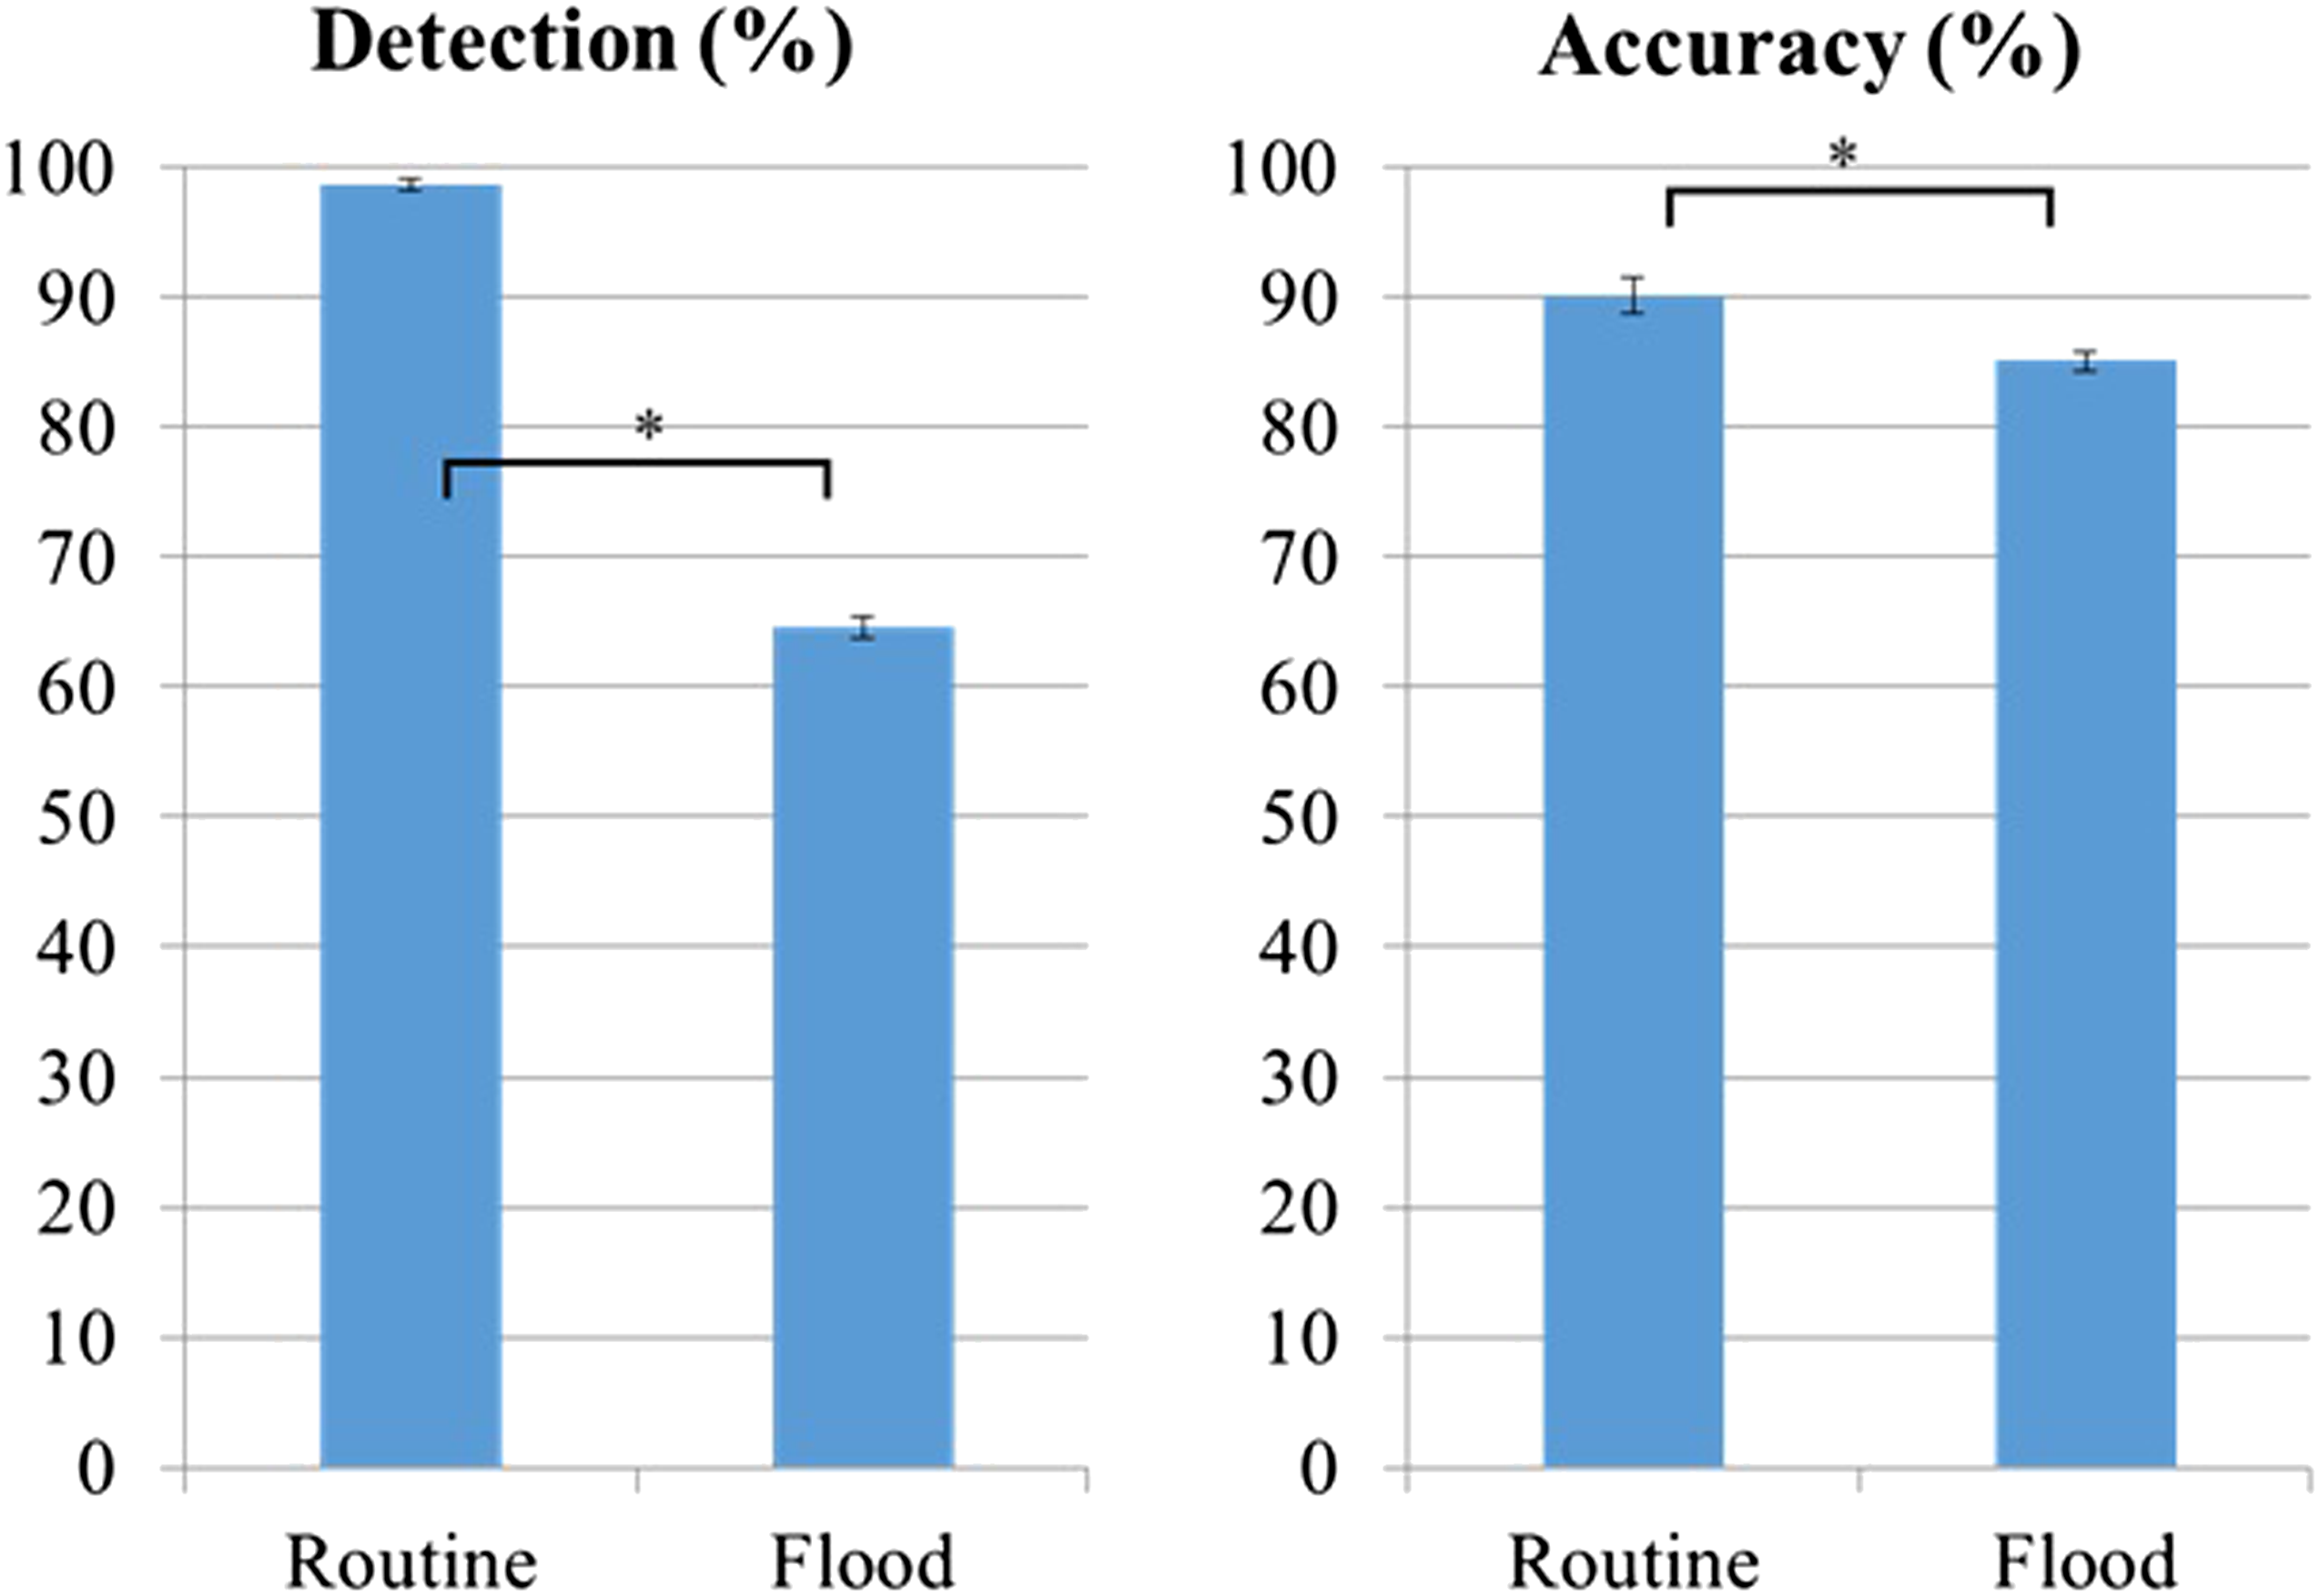
Delivery Consent Task
LMM of workload * scenario on delivery task response time - Fixed effects.
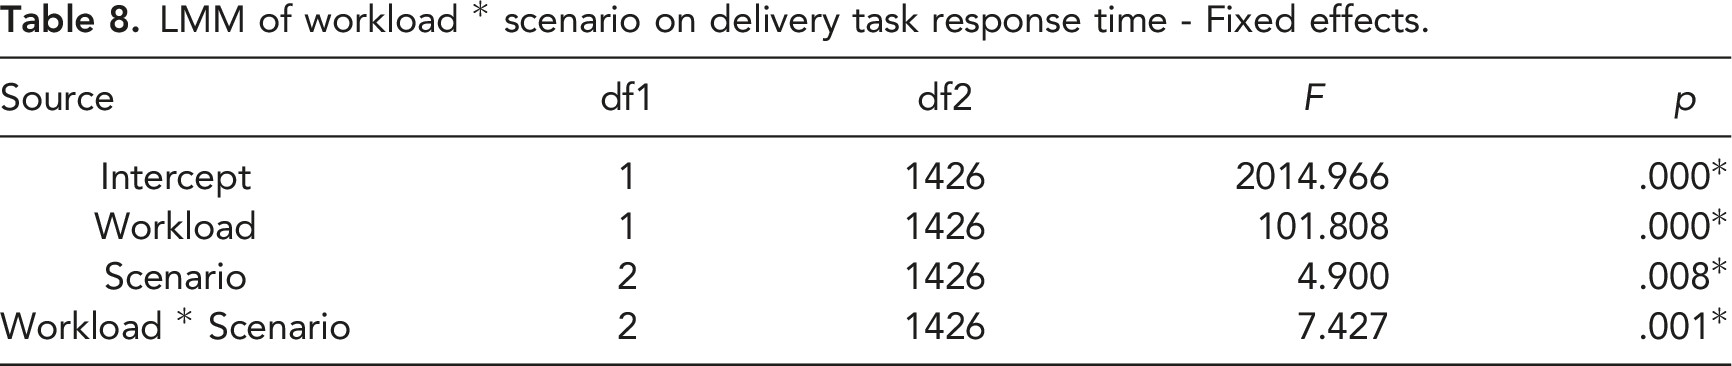
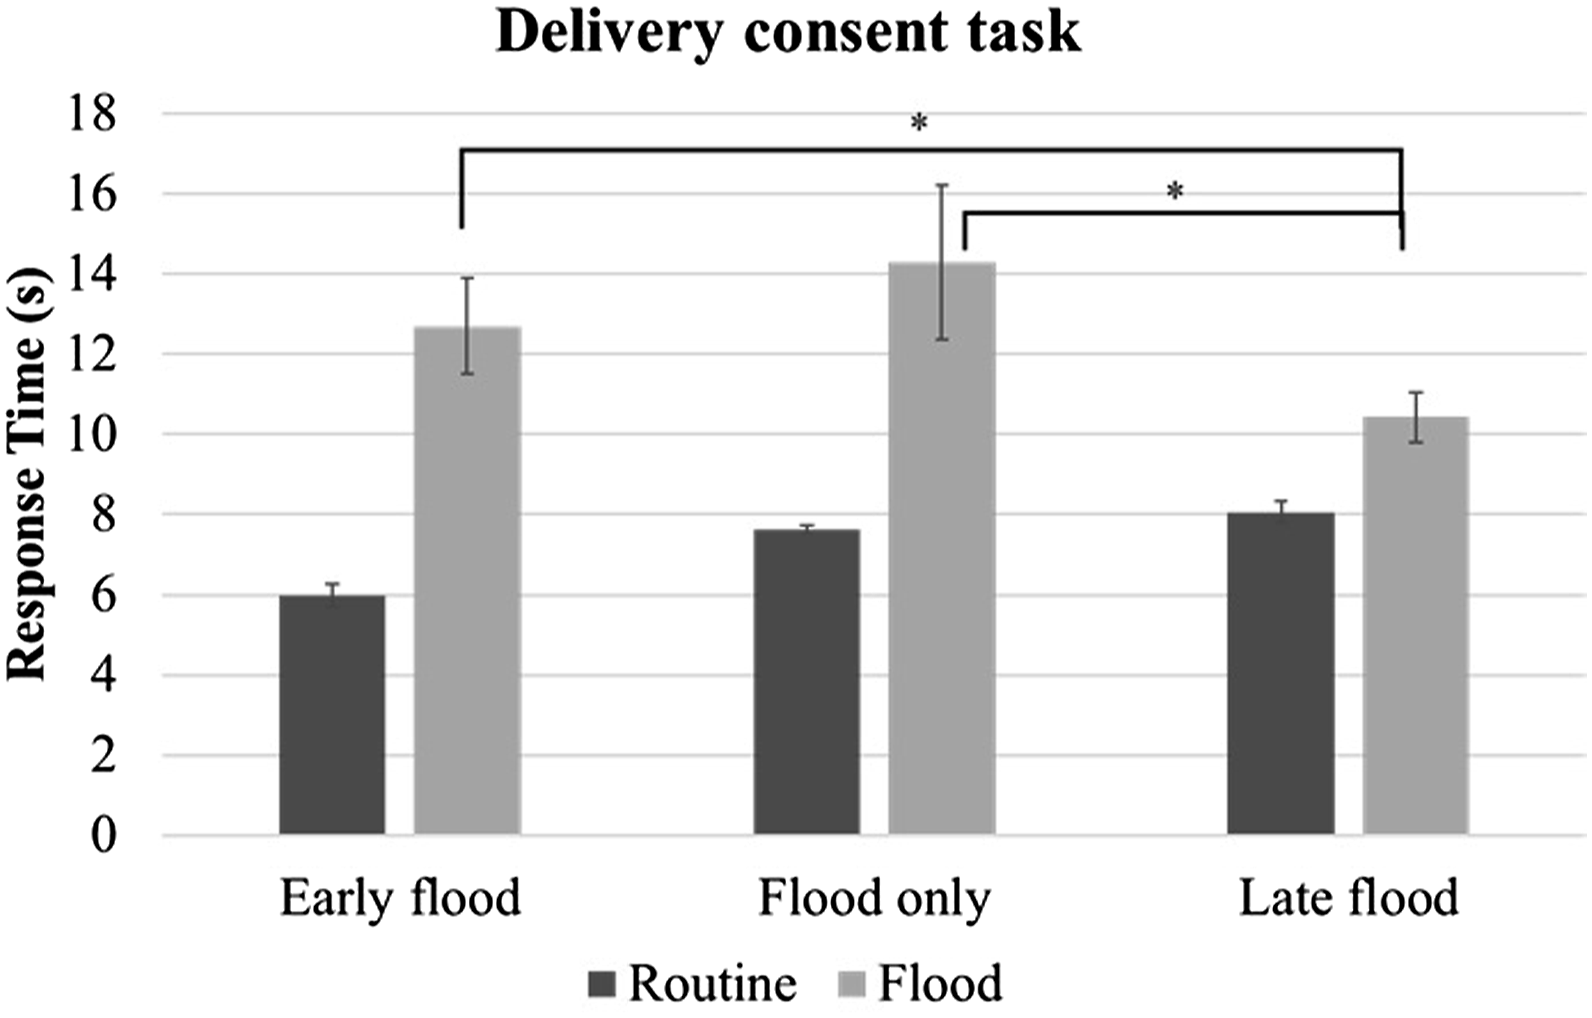
Response time to delivery consent as a function of workload and scenario. (*p < .05, main effects are not shown in the figure; see the methods section for scenario definitions).
Air Traffic Control Monitoring Task
The detection rate for the air traffic control monitoring task was significantly lower during the alarm floods, compared to the routine periods (14.8% vs. 91.3%, respectively). A simple Chi-square test was performed to assess the difference (χ2(1) = 522.209, p < .001, see Figure 7). Since most of the target messages were missed during the floods, there were insufficient data for an analysis of response time. Accuracy for the air traffic control monitoring task as a function of workload and scenario.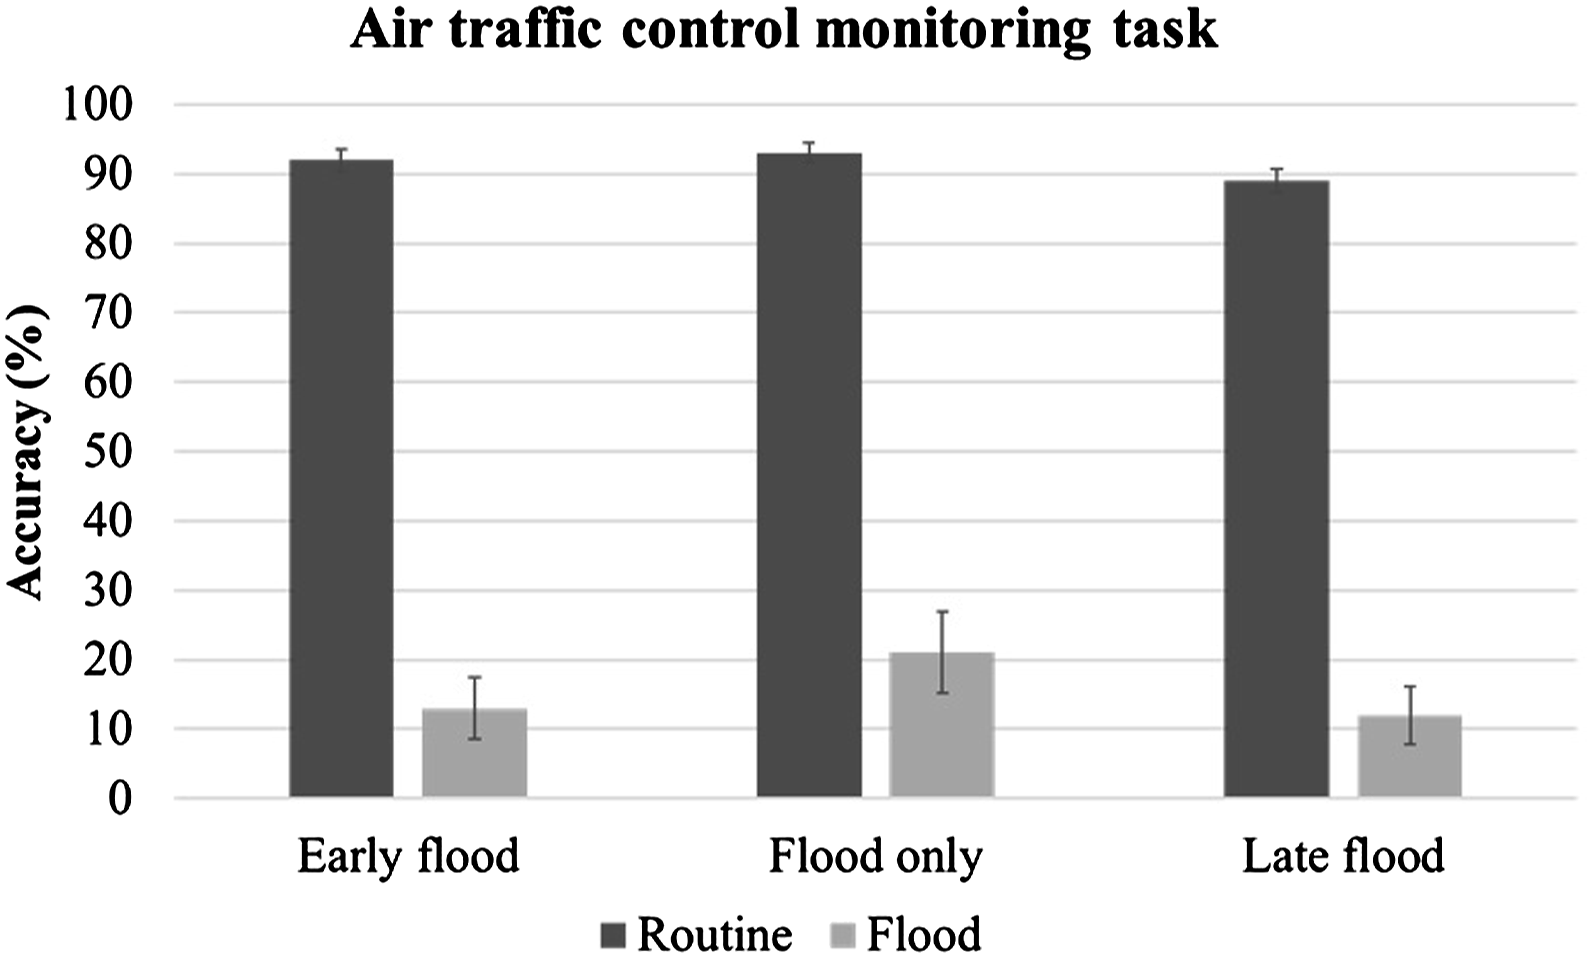
Discussion
The current study demonstrated asynchronous masking effects for both visual and auditory alarms with relatively long SOAs between alarm signals in a complex multitasking environment. Detection performance suffered for both the first and second visual and auditory alarms in an alarm pair. In other words, both forward masking (the masking stimulus precedes the target stimulus) and backward masking (the masking stimulus follows the target stimulus) were observed (H1-1 and H1-3 was supported). Previous studies have shown that both forms of masking interrupt the processing of visual stimuli at very short SOAs, ranging from 0–200 ms (Bachmann & Francis, 2013; Breitmeyer & Ogmen, 2000; Eriksen, 1966; Ogmen et al., 2003). At SOAs shorter than 150 ms, backward masking was shown to be more detrimental to noticing a visual stimulus than forward masking (Bachmann & Francis, 2013). In contrast, in the present study, the effects of forward and backward masking were nearly equally strong for visual alarms. This observation may be explained by earlier findings showing that the effect of backward masking decreases faster than forward masking as the SOA increases (Schiller, 1966). Thus, it can be expected that forward and backward masking may have comparable effects when the SOA is as long as 1000 ms (H1-2 was supported). For auditory stimuli, it has been reported that forward masking has a stronger effect than backward masking (Elliott, 1962; Wilson & Carhart, 1971). This was confirmed in the current study.
While the effects of forward and backward masking were comparable for the detection of alarms, identification was affected more strongly by backward masking, such that accuracy was lower for the first visual alarm in an alarm pair. This difference may be attributed to the required responses. In the current study, participants did not need to redirect their gaze when responding and could continue to monitor the central window where the second alarm would appear. Thus, performance for the second alarm benefited once the participant had noticed the appearance of the first alarm and their visual attention was allocated to the central window. However, the first alarm may have suffered as a result of participants’ attention being focused on other tasks/windows at the time. Furthermore, the identification of an alarm required color perception which is rather poor in peripheral vision as it relies on regions of the retina where fewer cones (capable of color discrimination) are located (Wickens et al., 1998). Auditory alarms are omnidirectional; that is, they do not require a particular eye or head orientation; as a result, effects of spatial position were not observed for these alarms.
The comparison of intra- and cross-modal alarm pairs revealed a stronger backward masking effect for auditory alarms following a visual alarm, compared to visual intramodal masking. This effect was not observed with other modality pairs. This finding is consistent with previous research on interruption management which showed that an auditory signal is more effective than a visual one at capturing attention, at the expense of an ongoing visual task—a phenomenon referred to as auditory preemption (Spence & Driver, 2017; Wickens et al., 2005; Wickens & Liu, 1988). The finding could also be explained by the fact that auditory signals have an advantage in terms of storage in short-term memory. A large body of literature suggests that, in an immediate recall task, performance is consistently better with auditory signals, compared to visual ones. This difference is greatest for the most recent item (e.g. Conrad & Hull, 1968). This modality effect has been attributed to a special type of short-term memory called the pre-categorical acoustic storage (PAS), which stores information for the most recent item before recognition; its visual counterpart decays too fast to be utilized in a recall task (Craik, 1969; Crowder & Morton, 1969).
The alarm floods in this study greatly undermined participants’ ability to perform their three tasks (H1-4 was supported). The detection rate for alarms plummeted from 98.7% to 64.6%. Response times to delivery consent requests almost doubled (see Figure 6), and nearly all air traffic control messages with the call sign “DOI51” were missed (see Figure 7). These performance decrements indicate a strong competition for attentional resources. For the delivery consent task, this competition resulted in increased response times because the drone waited until the participant responded. On the other hand, the (auditory) air traffic control messages were transient and had to be noticed immediately. These messages were more likely to be missed than auditory alarms because they were embedded in a stream of very similar (in terms of acoustic characteristics such as pitch and timbre) ATC messages and thus less salient than the auditory alarms (Huang & Elhilali, 2017; Shinn-Cunningham, 2008).
Experiment 2: Establishing the Relative Contributions of Simultaneous and Asynchronous Masking
One of the main goals of this line of research is to examine and support the detection and identification of alarms in an alarm flood. To date, very few studies have examined detection and identification performance for more than two alarms. The only study found by the authors was published by Boot et al. (2007), who studied the detection of up to 4 visual targets in a radar monitoring task, with SOAs ranging from 0 to 300 ms. They reported main effects of both SOA and the number of targets in temporal proximity. Detection performance was worse with more targets and at shorter SOAs. An interaction effect between SOA and the number of targets was also reported, such that the effect of SOA on target detection became more pronounced with an increase in the number of targets. Note that, in that study, participants were asked to report the total number of targets, but they did not have to identify or discriminate between targets. When discrimination is required, a natural question that arises is whether the position of an alarm in a series affects its performance. Such serial effects have been observed in recall tasks where the first and last stimuli showed better performance (Laming, 2010; Murdock, 1962).
The present study went beyond earlier research in that it examined the role of both asynchronous (which was the focus of the two previous experiments) and simultaneous masking (which becomes more likely with the large numbers of alarms in an alarm flood) in the presence of up to 6 alarms and during an alarm flood. The goals of the current study were: (1) To compare the detection and identification of multiple visual and auditory alarms that are presented concurrently or in close temporal proximity; (2) To investigate the effect of the number of alarms on their detection and identification; (3) For alarms that are presented in close temporal proximity (but not simultaneously), to establish the effect of their serial position on their detection and identification.
The following hypotheses were generated based on findings from previous studies: • H2-1: Alarm detection rate and accuracy will be lower with concurrent alarms than with sequential alarms. This effect is expected to be even more pronounced for auditory alarms. • H2-2: Alarm detection rate and accuracy will deteriorate as the number of alarms increases. This effect will be stronger for concurrent alarms. • H2-3: The first and last alarms in a sequence of alarms will have higher accuracy than other alarms in the same sequence.
Method
Participants
The participants in this study were 15 students recruited from the College of Engineering at the University of Michigan. The participants were between 20 to 35 years old (mean age = 23.7 years, SD = 3.1 years; 11 males and 4 females) and had self-reported normal or corrected-to-normal vision. They were also required to have self-reported normal hearing ability and color vision and could not have participated in Experiment 1. This research complied with the American Psychological Association Code of Ethics and was approved by the Institutional Review Board at the University of Michigan (UM IRB: HUM00144319). Informed consent was obtained from each participant.
Apparatus and Tasks
The apparatus used in the current study was similar to that used in Experiment 1, which consisted of a computer with a 24-inch LCD monitor, a pair of stereo speakers, a mouse, a keyboard, and an audio recorder. A set of driving pedals (part of the Logitech® MOMO® Racing suite) was added to the setup.
Participants were again required to perform three tasks: delivery consent, alarm monitoring, and air traffic control monitoring. The delivery consent task was the same as in Experiment 1. The alarm monitoring task was different from the one described in Experiment 1 in that it included concurrent alarms. Visual alarms were presented in the center of the screen as red (HSL: 5/94%/45%), green (HSL: 101/94%/45%), or blue (HSL: 204/94%/45%; same saturation and brightness) squares in the small grid cell closest to the affected drone. Auditory alarms consisted of a male, female, or children’s voice stating the number of the affected drone. These colors and voices were chosen to ensure that they were equivalent in salience but also easily differentiable from each other. Upon detection of a visual or auditory alarm, the participants were required to press the space key on the keyboard as soon as possible (to record response time) and then verbally report the type of the alarm (R for red, B for blue, G for green; M for male, F for female, and K for kid), followed by the number of the drone.
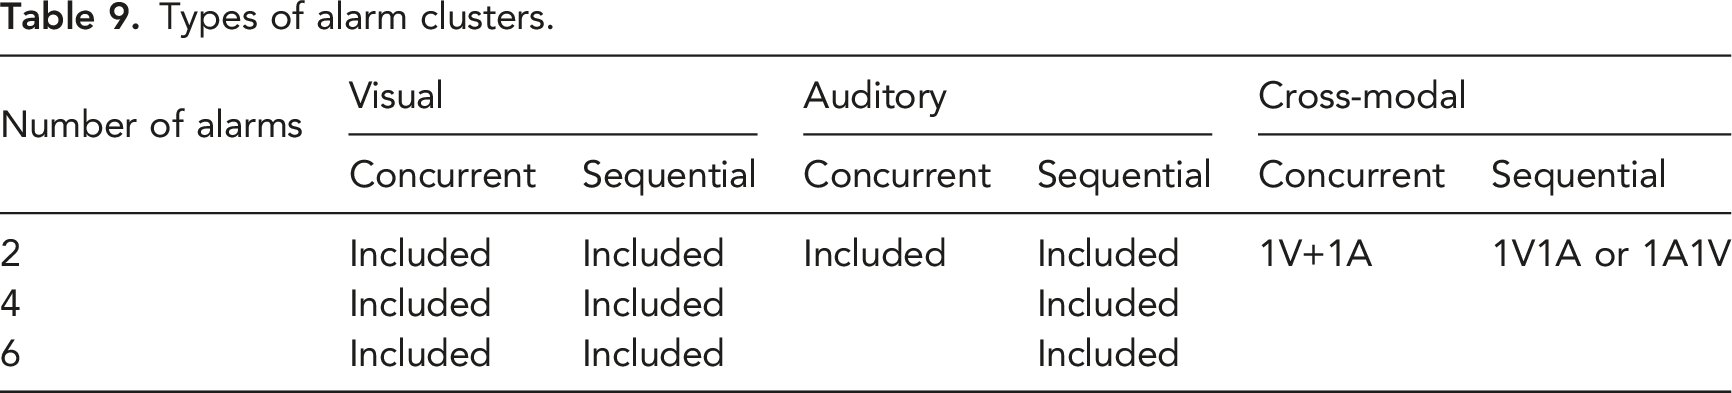
Types of alarm clusters.
The air traffic control (ATC) monitoring task was also slightly modified. The ATC recording and the call sign “DOI51” were the same as in Experiment 1; however, instead of pressing the space key, participants were required to press the foot pedal as soon as possible. This change was made to avoid confusion between the responses to alarms and call signs.
Experiment Design and Procedure
The various types of alarms and alarm clusters in this study were introduced in the previous section and summarized in Table 5. The number of alarms was either 1, 2, 4, or 6, the cluster type was either concurrent or sequential, and the modality of each alarm was visual or auditory. The experiment also varied workload (routine operation vs. alarm flood) and scenario (early flood, late flood, flood only).
Similar to Experiment 1, the current experiment included three 20-minute scenarios, which were the early flood, late flood, and flood only scenarios (see Figure 2). The early flood and late flood scenarios consisted of 17 minutes of low alarm frequency periods and a 3-minute alarm flood (high alarm frequency). The alarm flood only scenario consisted of 17 minutes without any alarms and the 3-minute alarm flood. A total of 15 alarm clusters or single alarms (including one of each possible alarm cluster listed in Table 9, one single visual alarm, and one single auditory alarm) were presented during the low alarm frequency periods of the early and late flood scenarios. During each alarm flood, a total of 30 alarm clusters or single alarms (two of each possible item) were presented. The frequencies of the delivery consent task and the air traffic control messages were the same as in Experiment 1.
Upon arrival in the laboratory, participants were consented and trained similarly to Experiment 1. After the training, the participants completed three 20-minute scenarios, with optional 5-minute breaks between two scenarios. Cross-modal matching was performed before each session using the same method as described in Experiment 1 (see Pitts et al., 2016). At the end of the experiment, participants completed a debriefing questionnaire asking them to estimate their own task performance, rate task difficulties, and provide other feedback.
Dependent Measures
The dependent measures were the same as in Experiment 1 except for those of the alarm monitoring task. Detection rate was measured at the cluster level, defined as the percentage of alarm clusters that were correctly enumerated. Response time was also measured at the cluster level, as the time from the onset of the alarm cluster/single alarm to the time when the participant first pressed the space key. Accuracy was defined at the alarm level, as the percentage of correctly reported alarms out of all alarms.
Results
Similar to Experiment 1, the data were analyzed using SPSS. Detection rate and accuracy were recorded as binary true/false data and analyzed using the generalized linear mixed model (GLMM, with a binary logit link) in SPSS. Response time was analyzed using the linear mixed model (LMM) in SPSS. For all analyses, the significance level was set at p < .05.
Also, as for the previous experiment, Pearson’s correlation coefficients between the response time to alarms and the time elapsed since the start on the task were calculated for each participant to assess whether performance improved throughout the experiment. The maximum R2 was 0.04, indicating that there was no learning effect.
Detection Rate for Alarm Clusters
GLMM of cluster size*cluster size on alarm cluster detection rate - Fixed effects.
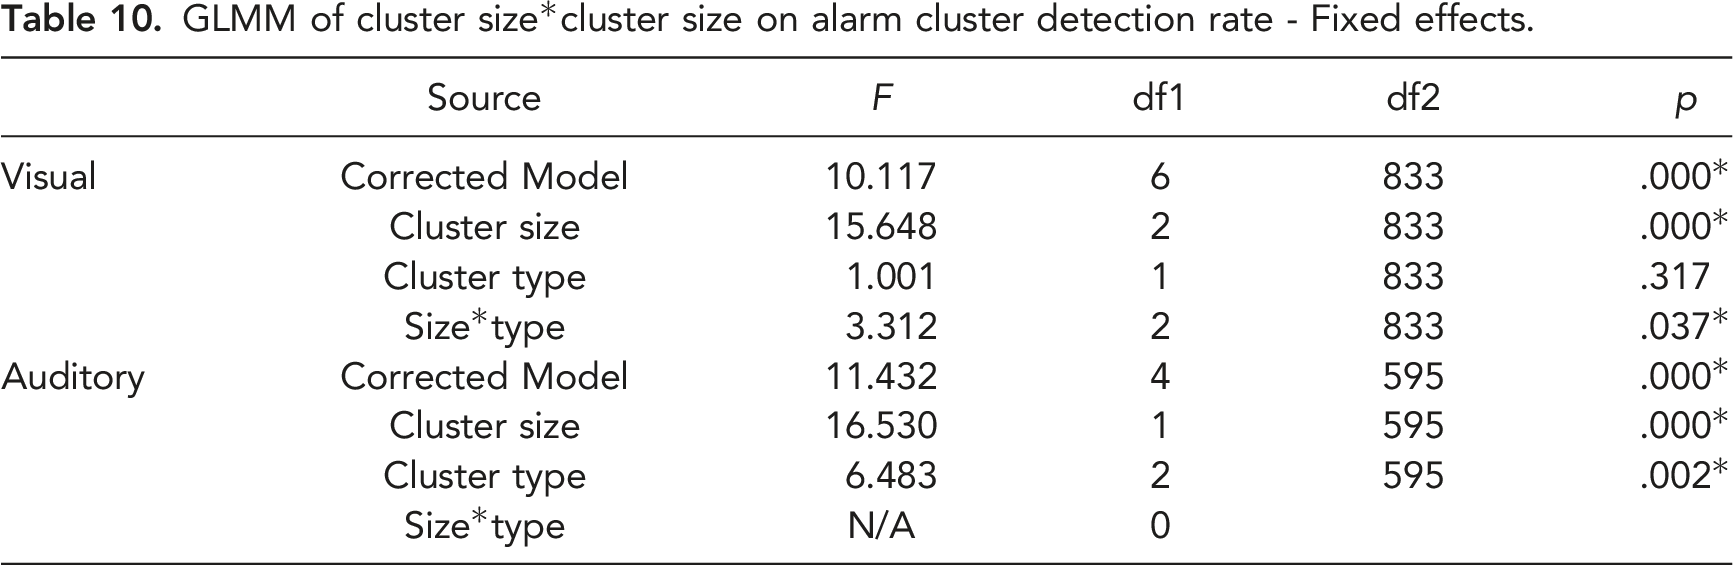
GLMM of cluster size*cluster size on alarm cluster detection rate—Model estimates (non-significant interaction terms not included).
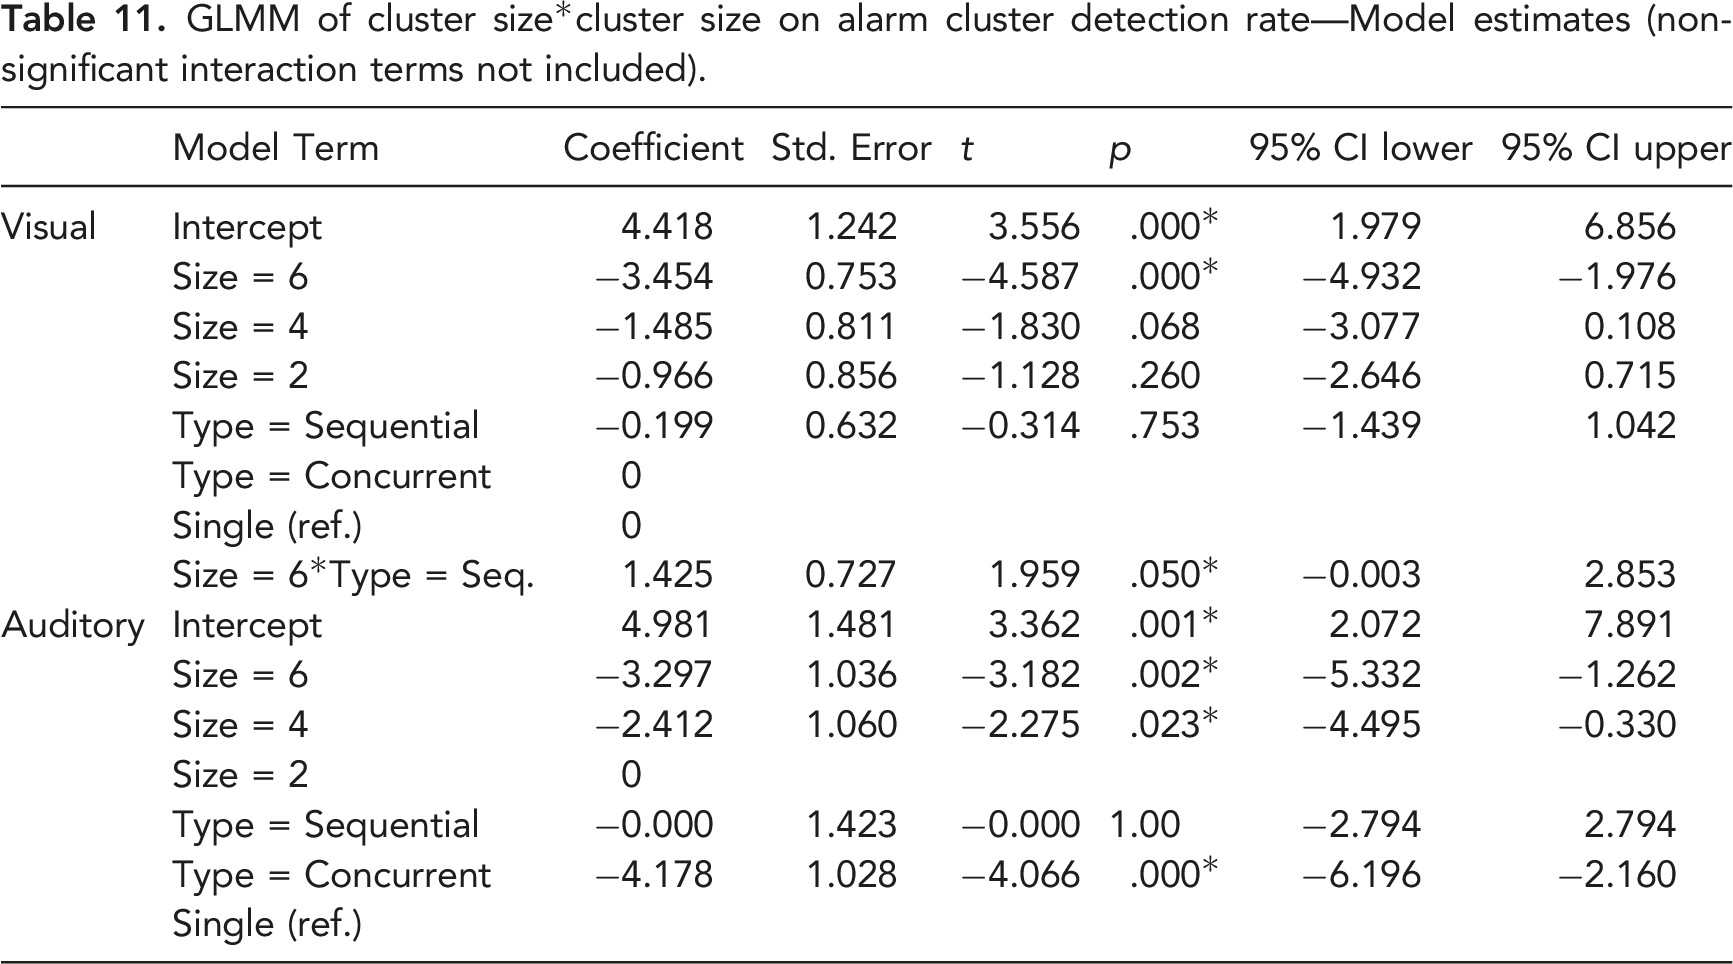
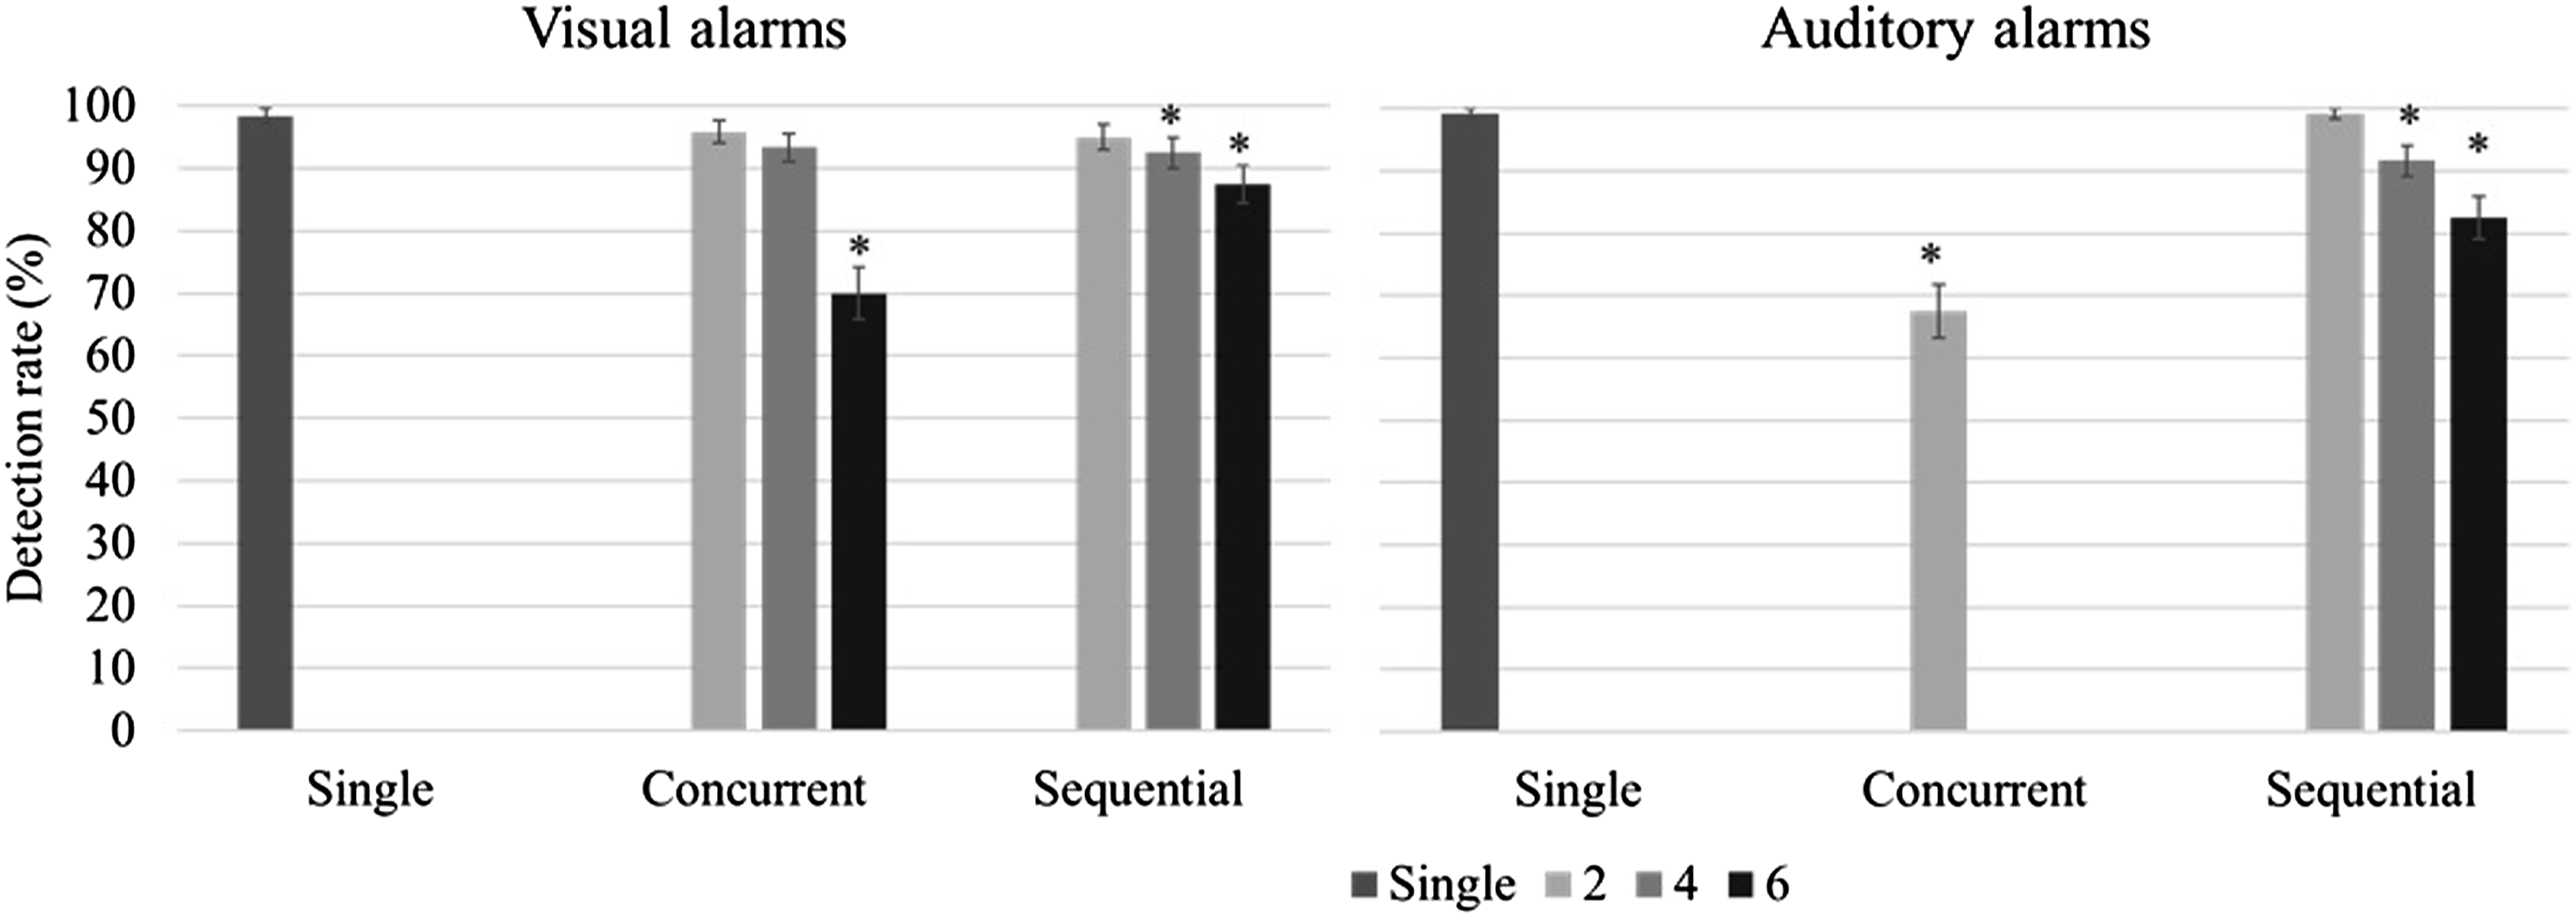
Detection rates for alarms as a function of cluster type and size. (*p < .05 compared to single alarms).
Accuracy for Individual Alarms
GLMM of cluster size*cluster size on alarm accuracy - Fixed effects.
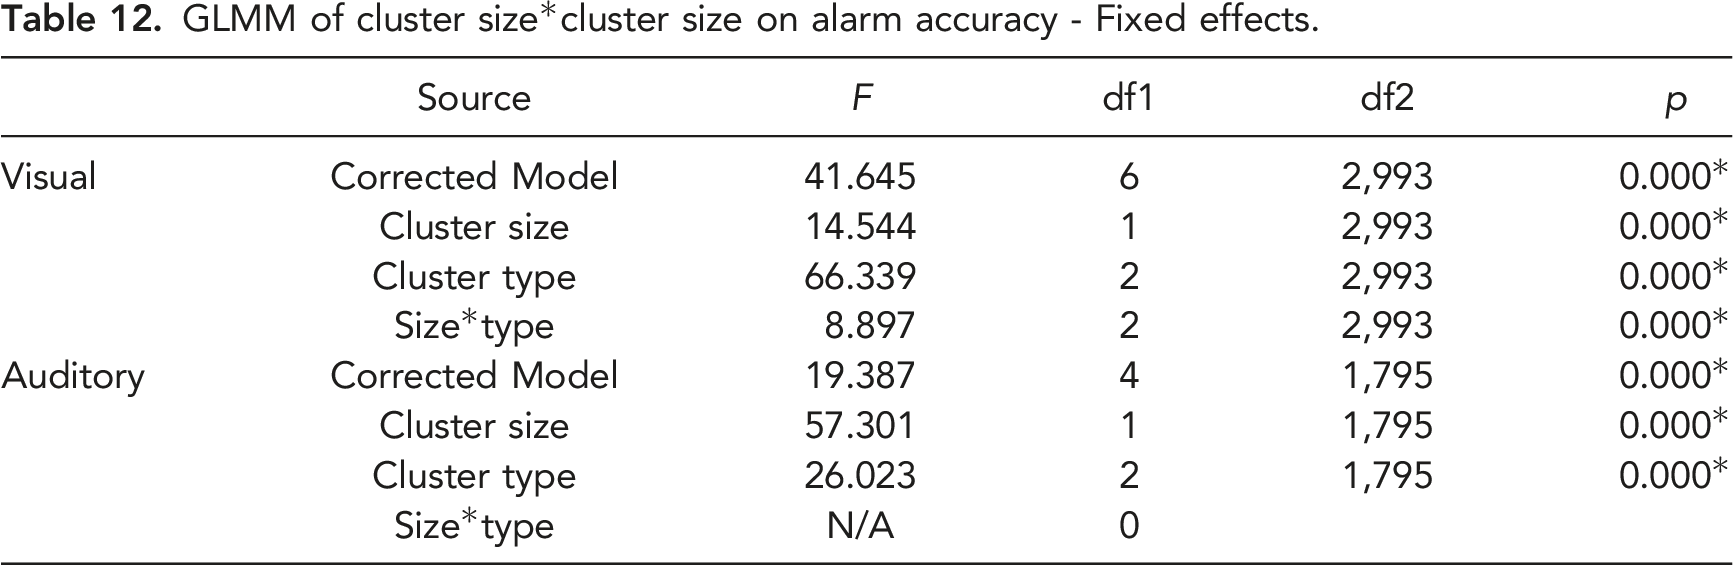
GLMM of cluster size*cluster size on alarm accuracy - Model estimates (non-significant interaction terms not included).
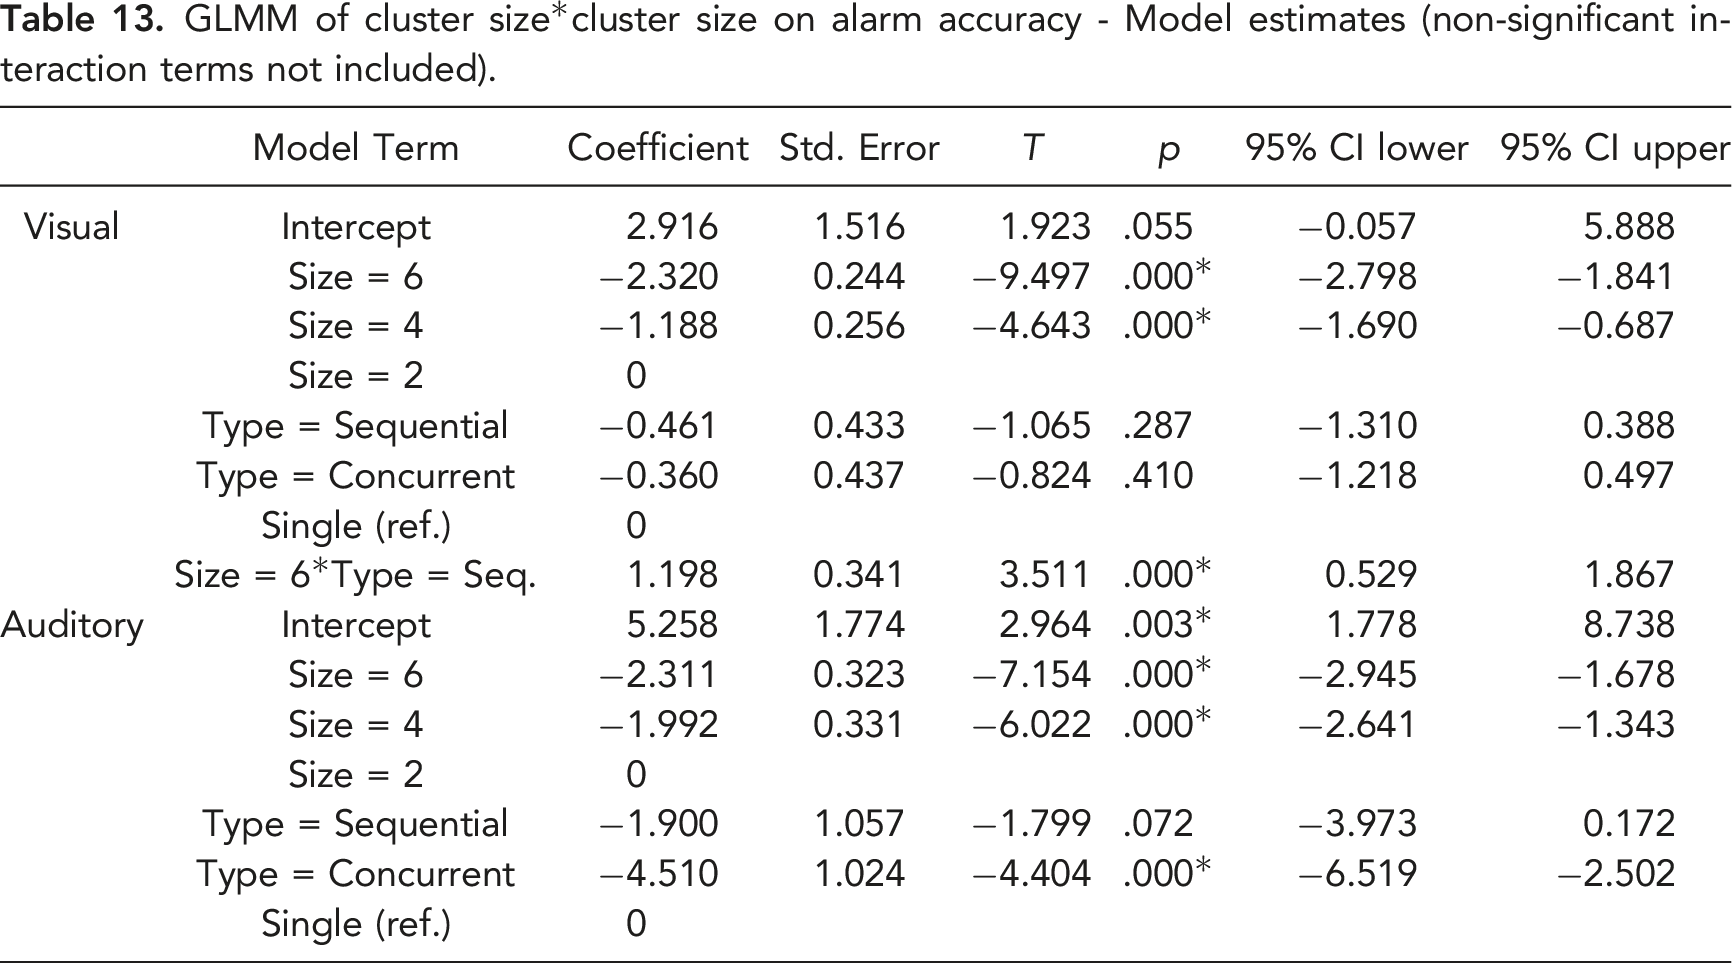
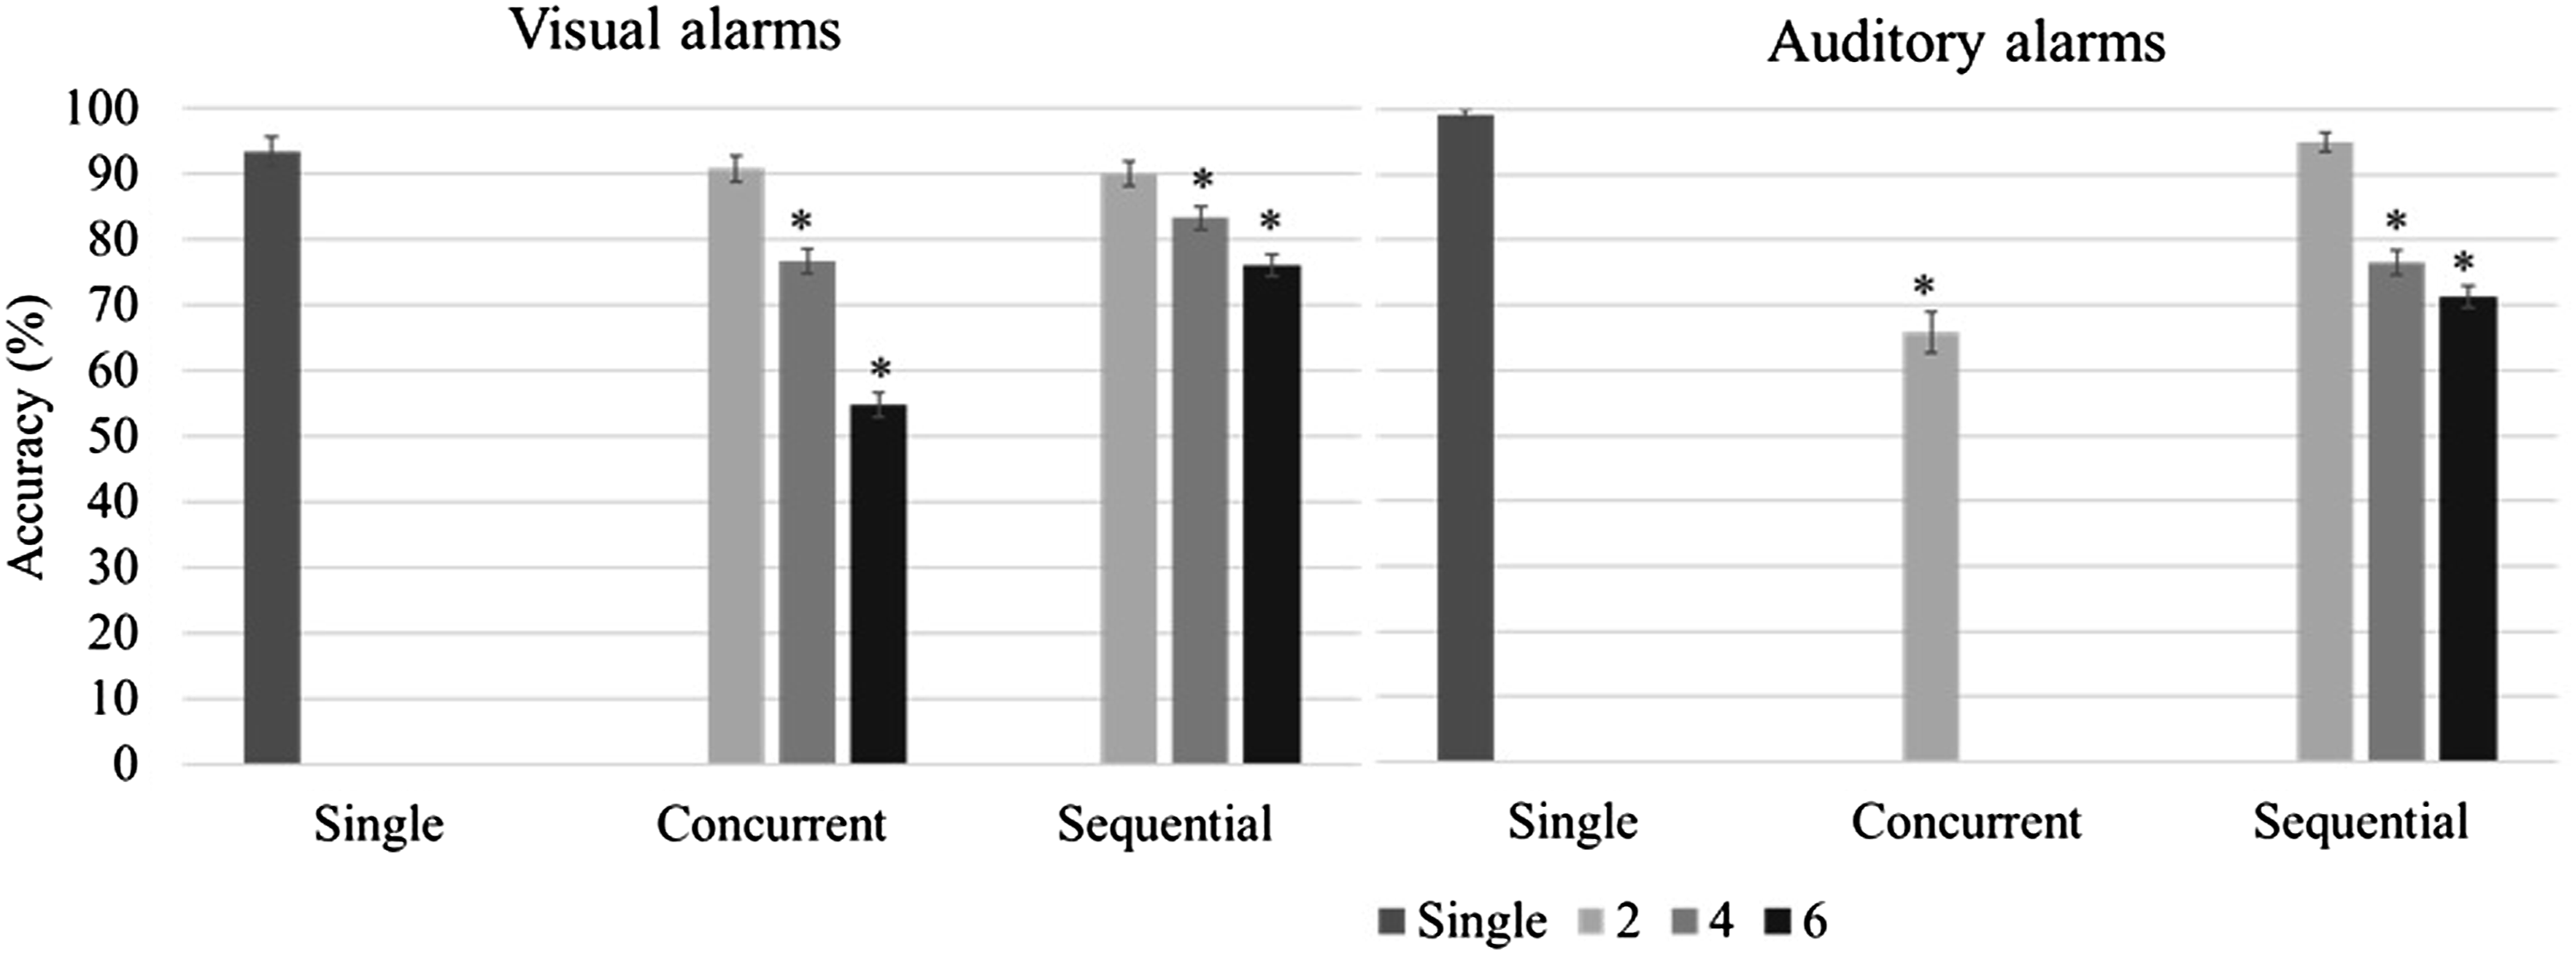
Accuracy for alarms as a function of cluster type and size.
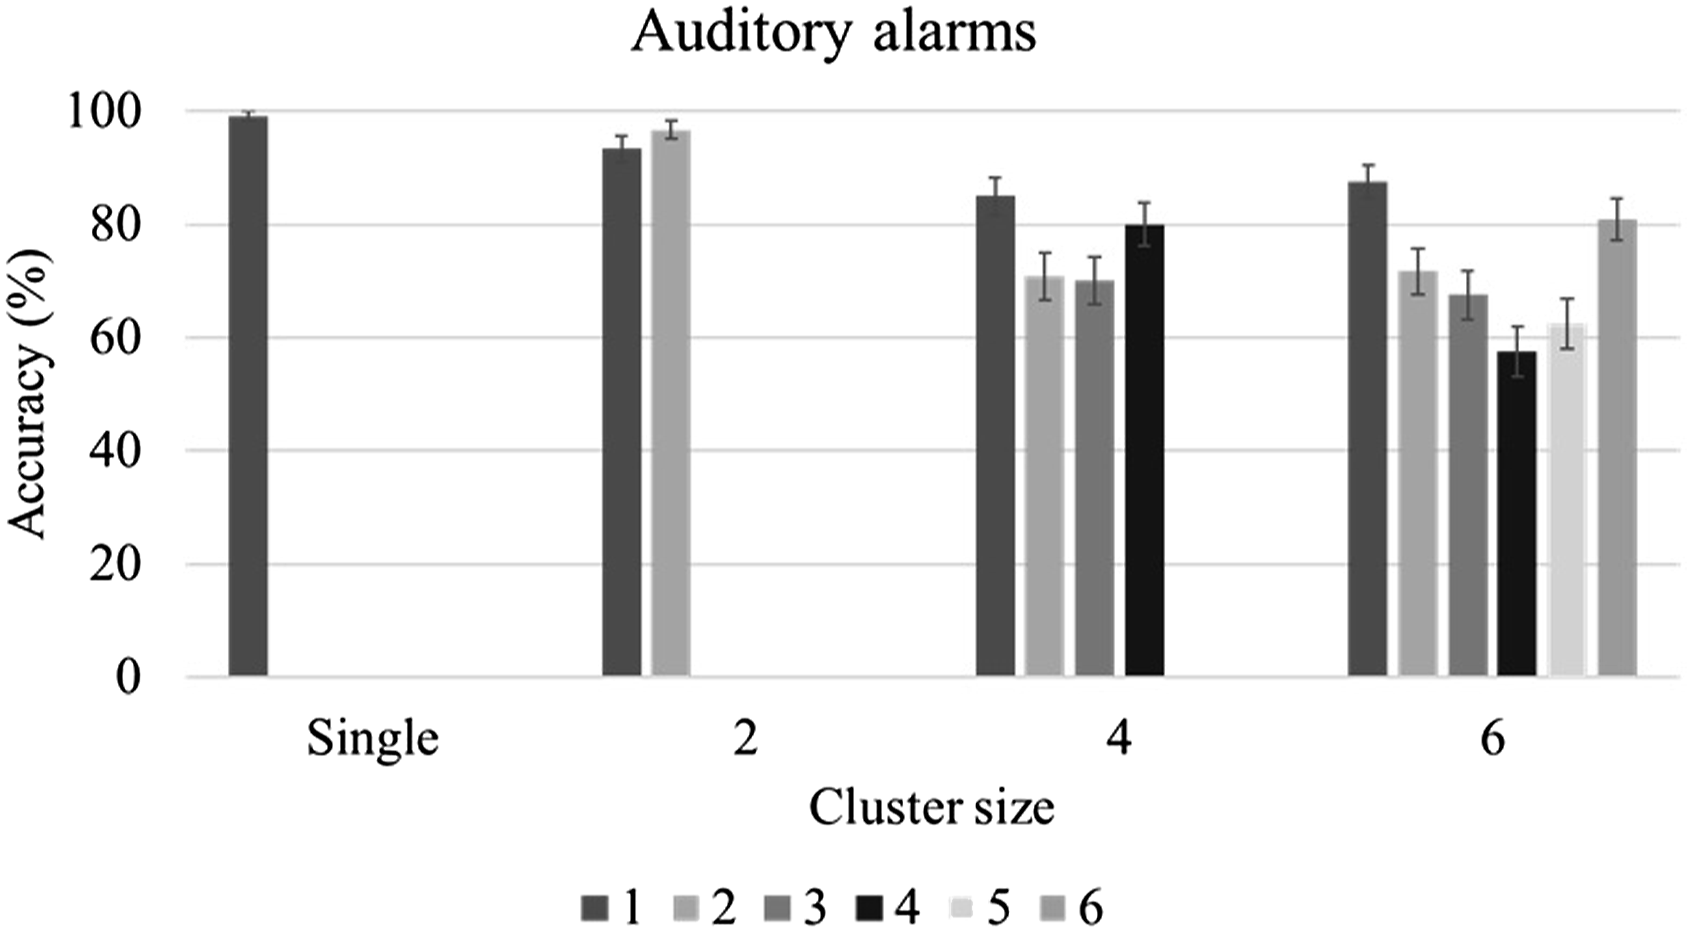
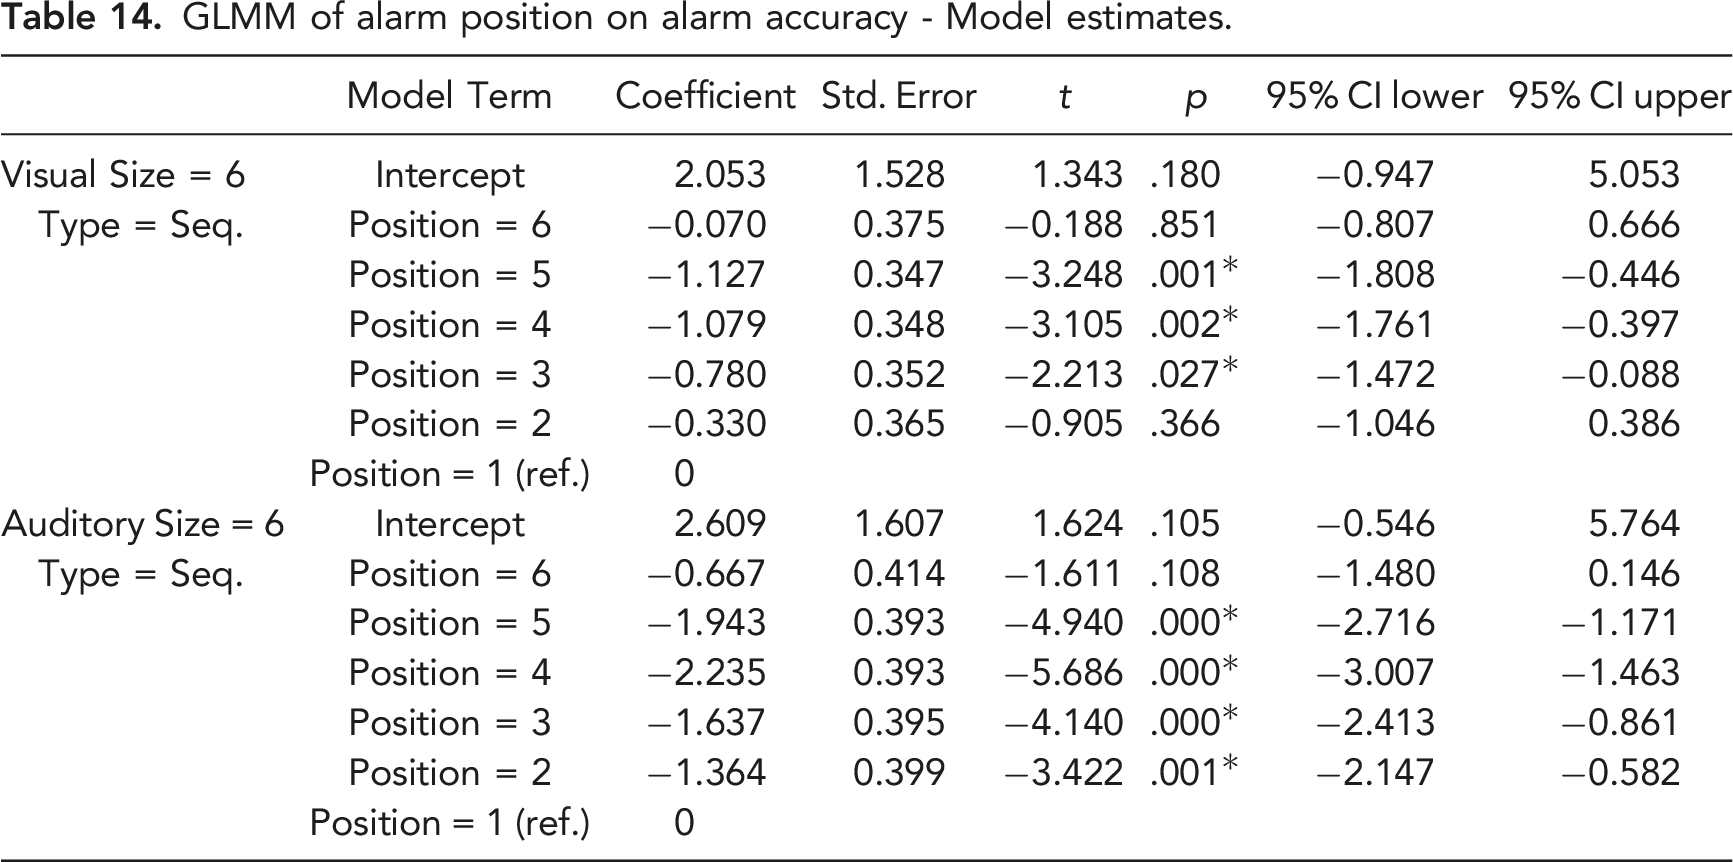
To test H2-3, accuracy data were broken down further (see Figures 10 and 11). With a cluster size of 6 visual alarms or 4/6 auditory alarms, the first and last alarms in a cluster were more likely to be correctly identified than the other alarms. To test this effect, GLMMs were fitted on the accuracy for individual visual and auditory alarms in clusters of 6 sequential alarms. The position of an alarm in the cluster was set as a fixed effect factor, and participant was set as a random effect factor. When the first alarm was used as the reference level, the 3rd, 4th, 5th visual alarms, as well as the 2nd to the 5th auditory alarms showed significantly lower accuracy (see Table 14). Accuracy for visual alarms as a function of cluster size and alarm position. Accuracy for auditory alarms as a function of cluster size and alarm position. GLMM of alarm position on alarm accuracy - Model estimates.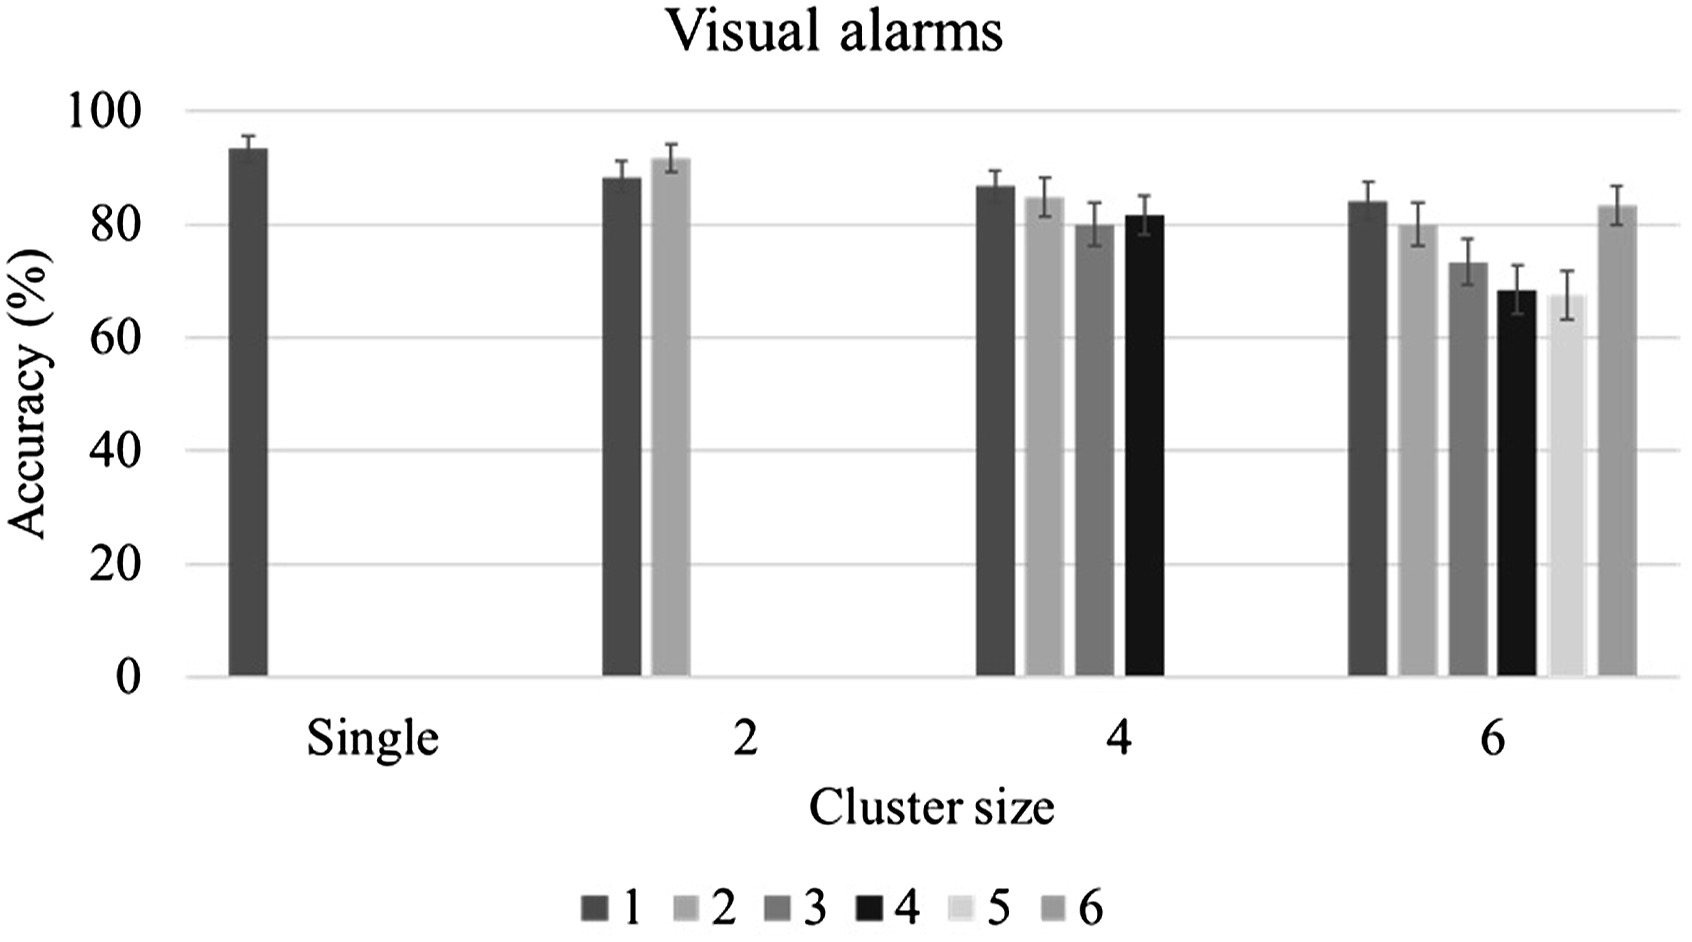
Response Time for Alarms
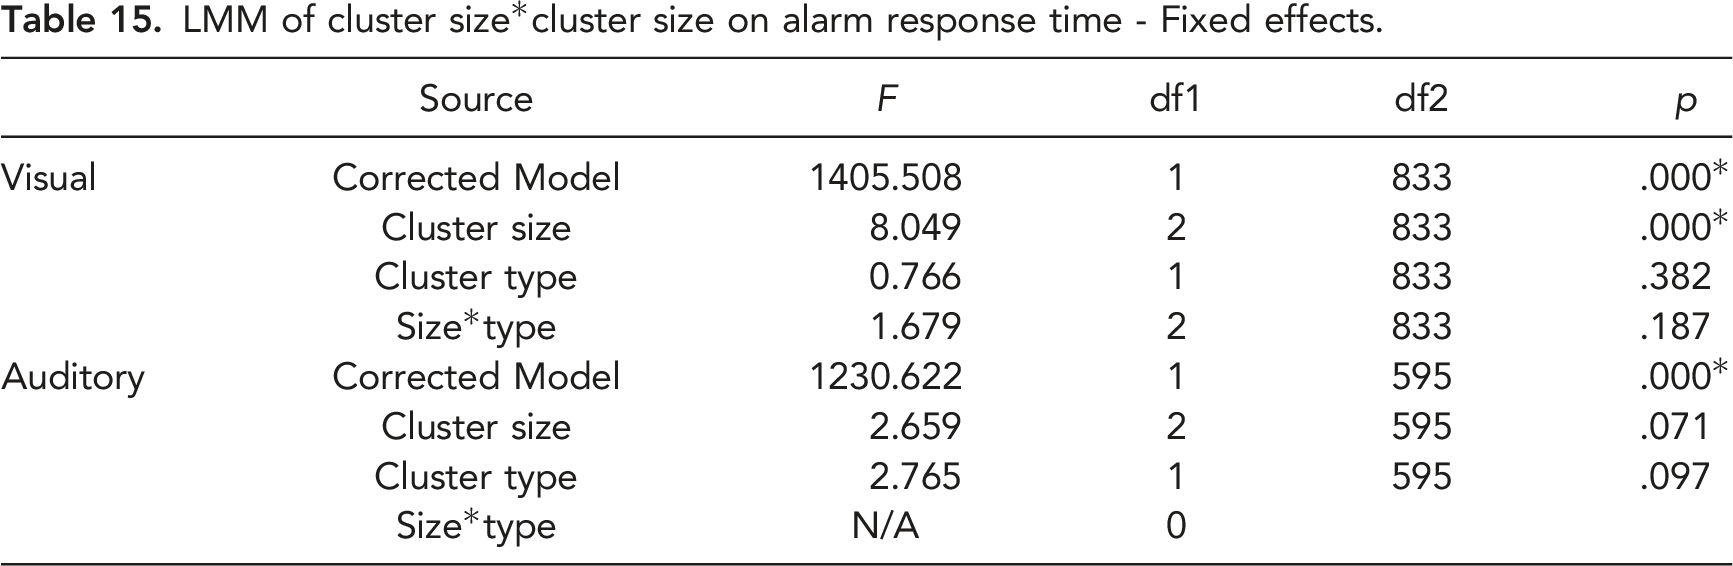
LMM of cluster size*cluster size on alarm response time - Fixed effects.
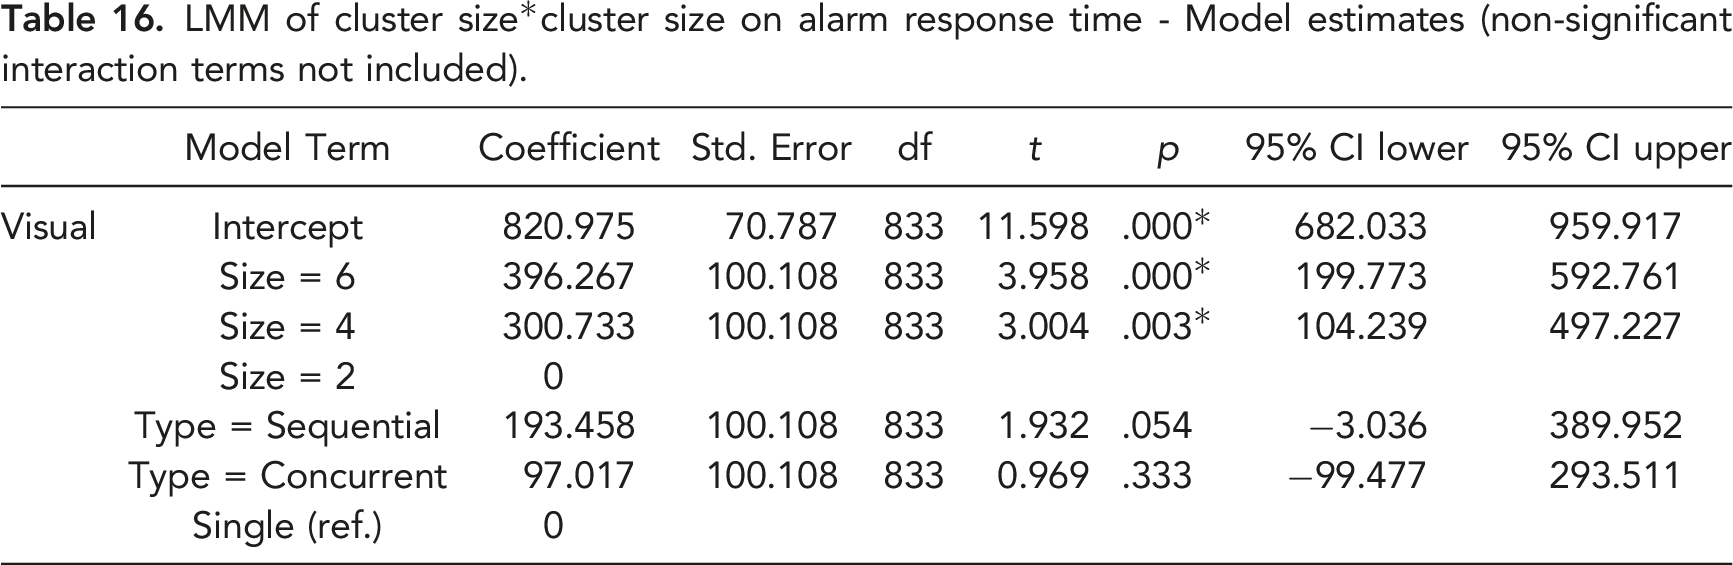
LMM of cluster size*cluster size on alarm response time - Model estimates (non-significant interaction terms not included).
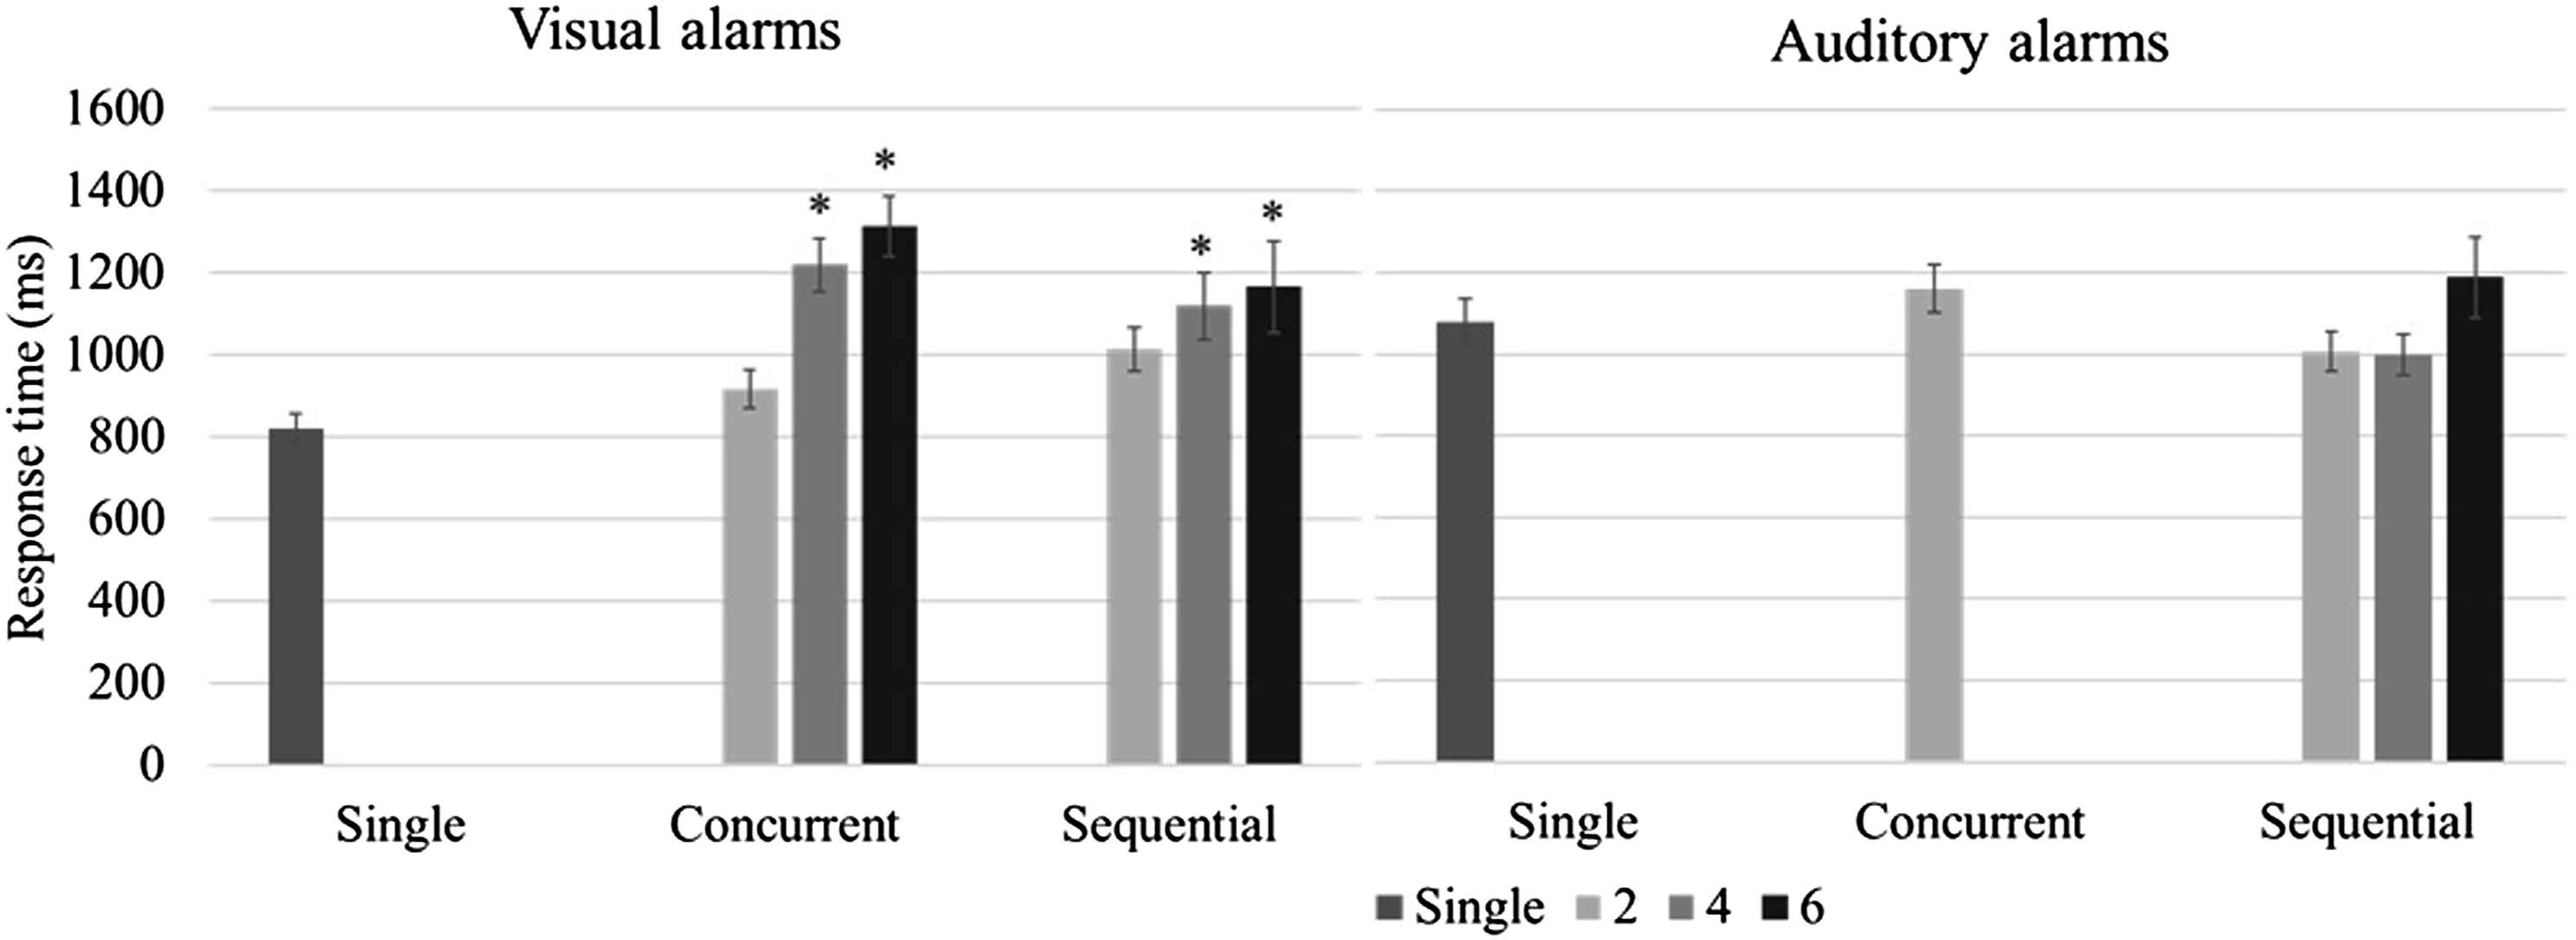
Response time to alarms as a function of cluster type and size. (*p < .05, compared to single alarms).
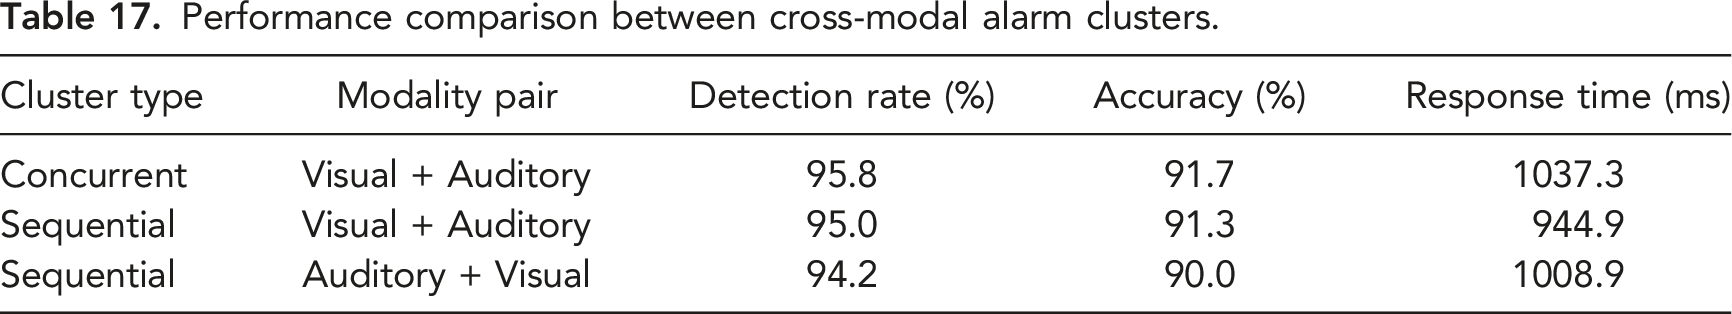
Cross-modal Effects for Alarm Detection Rate, Accuracy, and Response Time
Performance comparison between cross-modal alarm clusters.
Alarm Flood Analysis
Similar to the alarm flood analysis in experiment 1, GLMMs were fitted on the detection rate for all alarm clusters and the accuracy for all alarms. A GLM was fitted to the response time for all alarm clusters. In all three models, workload (routine vs. flood) was set as a fixed effect factor, and participant was set as a random effect factor. Detection rates did not differ significantly as a function of workload (F(1, 1798) = 1.519, p = .218). However, accuracy was significantly lower during the alarm floods (F(1, 5518) = 23.947, p < .001), and response time was significantly shorter (F(1, 1798) = 13.710, p < .001, see Figure 13). Performance comparison between alarm floods and low alarm frequency periods.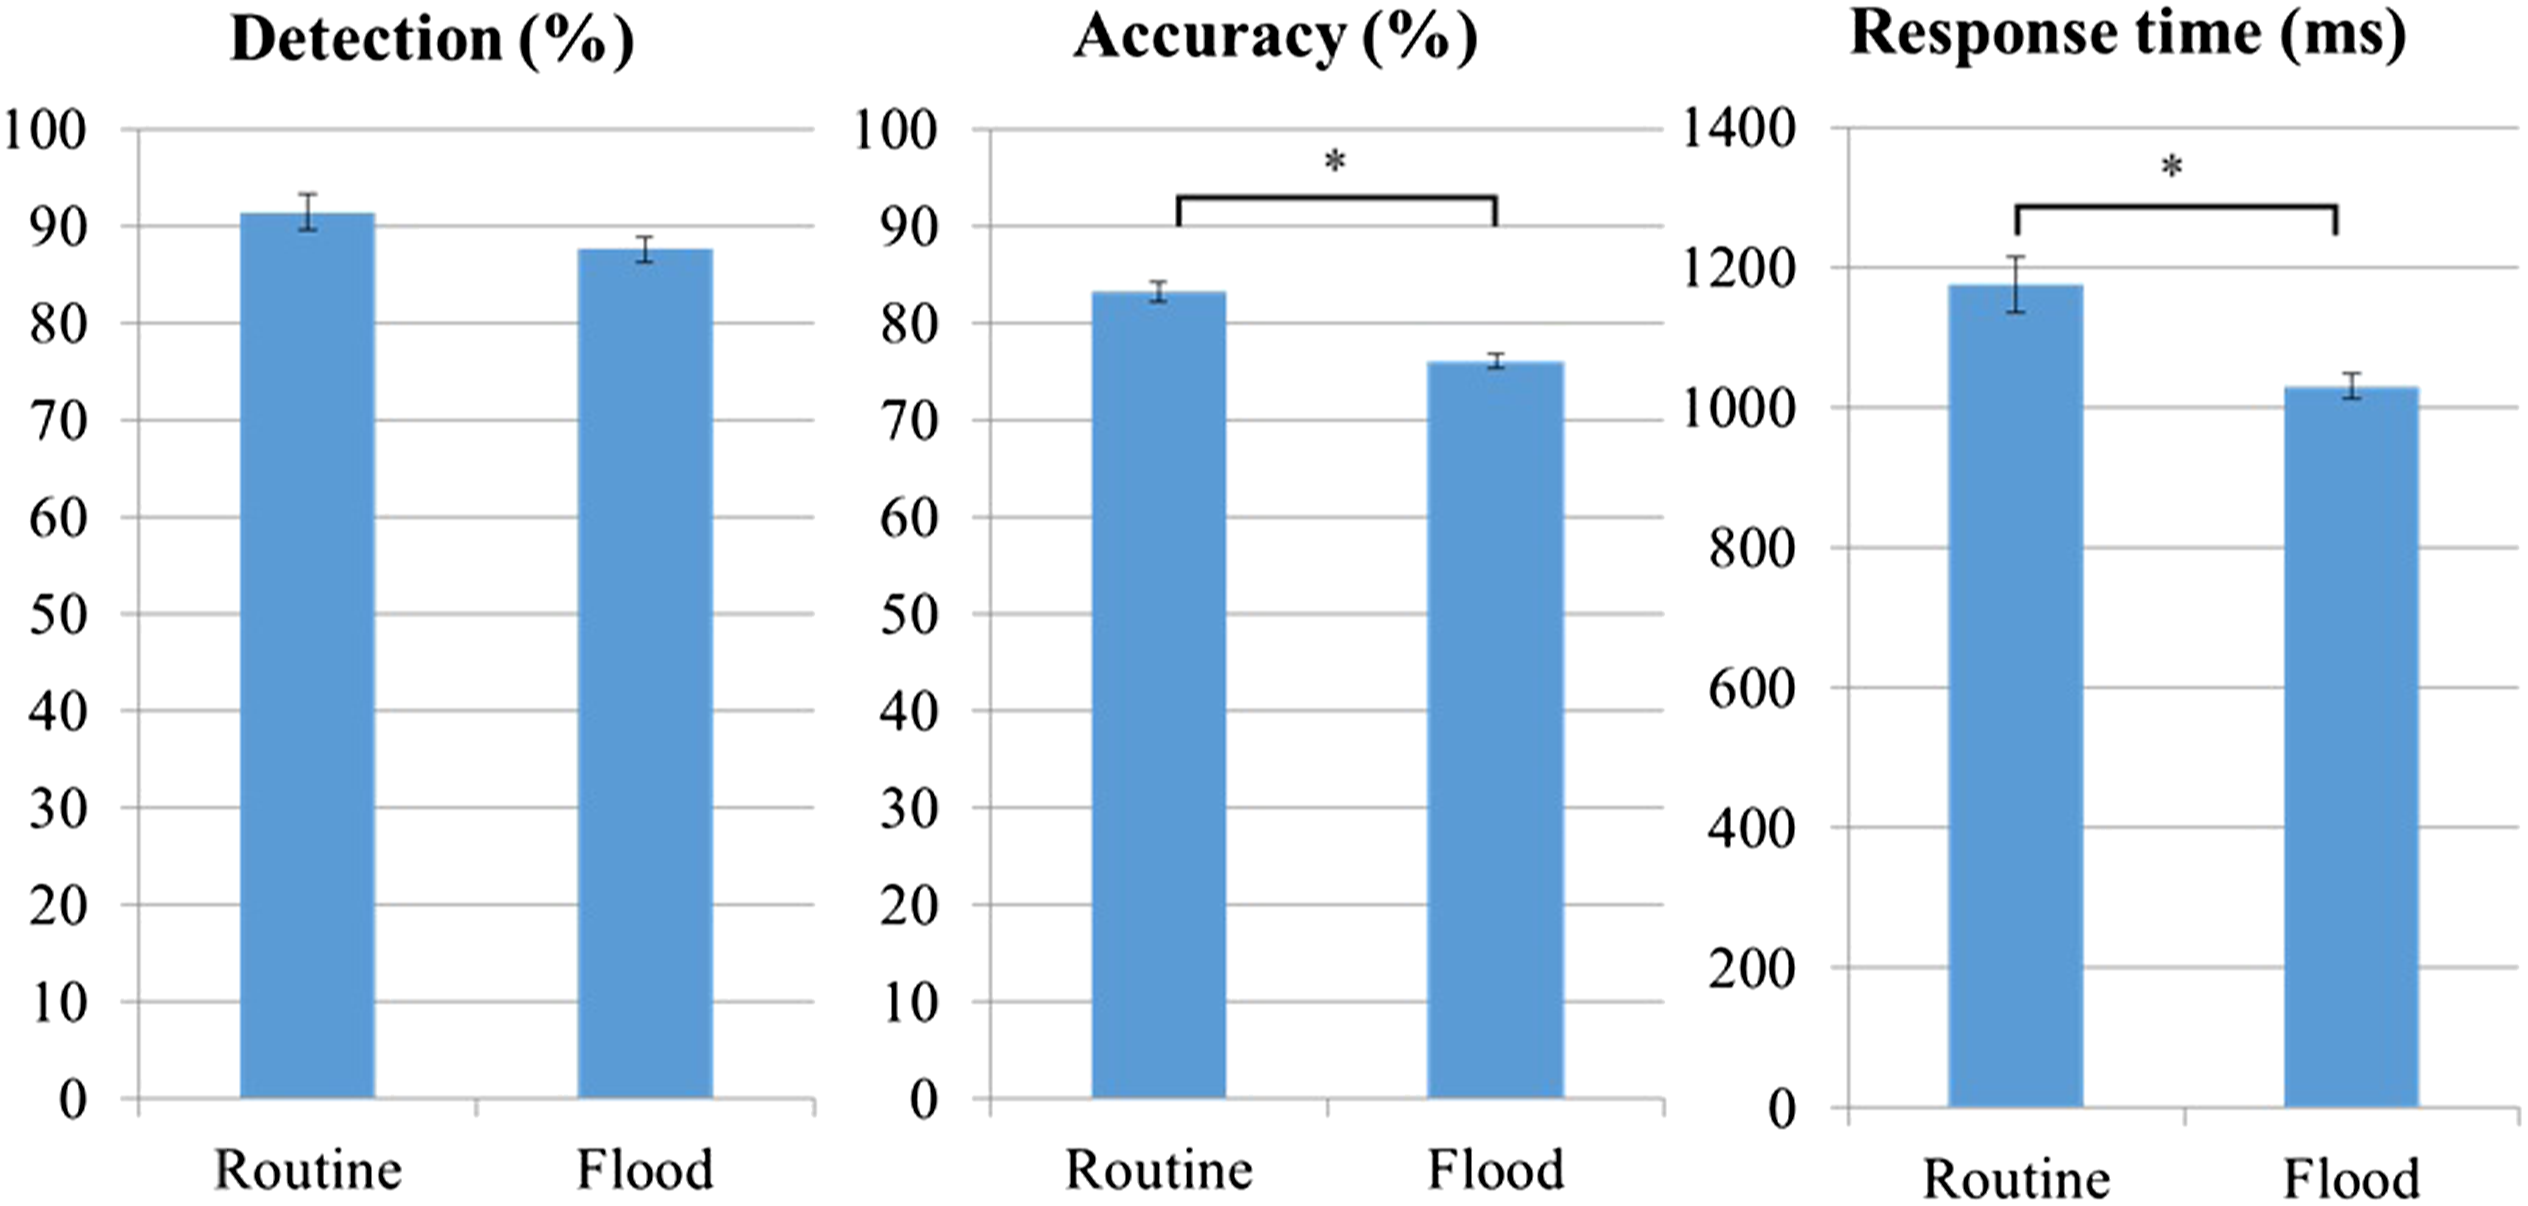
Discussion
The current experiment expanded on Experiment 1 which focused on asynchronous masking effects on the detection of single alarms and alarm pairs. In Experiment 2, concurrent alarms were introduced to study the effect of simultaneous masking, and the number of alarms in temporal proximity was increased from two to six. These changes were made to investigate performance in a context more representative of a real-world alarm flood.
The results from this study indicate that the detection rate and accuracy for visual alarms decreased as the number of alarms in a cluster increased. As expected, this performance decrement was more pronounced with concurrent alarms than with sequential ones (H2-2 was supported). This finding is in agreement with the few studies that, to date, have compared synchronous and asynchronous masking. For example, Beanland and Pammer (2012) investigated attentional blink (asynchronous) and inattentional blindness (the failure to notice unexpected visual targets when attention is engaged with other targets; synchronous) in two experiments. Although the tasks in these studies were not entirely equivalent in nature, the authors reported detection rates of 26% for the inattentional blindness task and 62% for the attentional blink task. This suggests a much stronger performance effect of simultaneous masking. A more equivalent comparison was made by Boot et al. (2007) who examined various numbers of targets and SOA’s in the context of a target detection task using a simulated radar monitoring interface. They reported lower detection rates with simultaneous targets than with sequential targets, especially when the number of targets exceeded three. Detection rates in their study were comparable for pairs of targets with SOA’s ranging from 0 to 300 ms. Similarly, in the present study, participants’ performance deteriorated rapidly with an increase in cluster size for concurrent visual alarm clusters; however, their performance was very similar for concurrent and sequential alarm clusters when the cluster size was small (2 alarms). One possible explanation for these findings is that two concurrent visual alarms are processed as one visual stimulus, thus avoiding or reducing competition for attentional resources (Akyürek & Hommel, 2005; Shapiro et al., 2006). For 4-alarm clusters, the detection rate remained similar, but accuracy was lower for concurrent alarms. This result is consistent with findings from studies on enumeration of targets. As mentioned earlier, these studies have shown that it is possible for people to report the number of targets very quickly when that number is no greater than four (Mandler & Shebo, 1982; Revkin et al., 2008). This ability, termed subitizing as opposed to counting, has been likened to the recognition of figural patterns that contain small numbers of targets (Von Glasersfeld, 1982). Since subitizing is based on processing targets as one figural pattern, it does not support the identification and differentiation of multiple alarm signals. As a result, the detection rate for 4-alarm concurrent visual alarm clusters was comparable to that for sequential alarm clusters because the participants could quickly subitize the number of alarms, but the accuracy for 4-alarm concurrent visual alarm clusters was lower than for sequential alarm clusters because subitizing does not support identification.
One difference between the visual and auditory modalities that was observed in this study was that both detection rate and accuracy were higher for auditory alarms in case of 2 alarm clusters but decreased more rapidly with an increase in cluster size for sequential auditory alarm clusters, compared to visual ones (H2-1 was supported). There are two possible explanations for this modality difference. It could result from the smaller capacity of the auditory working memory, compared to visual working memory (Saults & Cowan, 2007), and/or it could be attributed to the increased interference between the auditory presentation of the stimulus and the required verbal response. Generally, there is a tendency toward better performance when stimulus and response are compatible, that is, share the same processing code (Wickens et al., 1984). However, this benefit may disappear due to the temporal overlap between stimulus and response when the number of alarms increases.
The auditory concurrent alarm clusters led to the worst performance—an average detection rate of only 67.5% —amongst all cluster types, even though these clusters consisted of only two alarms. As mentioned before, auditory alarms are more susceptible to simultaneous masking because their detection suffers not only due to attentional limitations, but also because of acoustic interference between different sounds. Unlike visual perception which can attend to spatially independent objects at the same time, auditory perception relies on receptors that are highly sensitive to differences in frequency (Bolton et al., 2018; Greenwood, 1971). The alarm signals used in the current study were close in their base frequency and identical in their duration; as a result, the simultaneous masking effect was very strong. Similar problems could arise in many application domains (such as medical operations) where auditory displays or alarms are widely used but not necessarily well-coordinated as they are associated with systems that are developed by different companies (Momtahan et al., 1993). On the other hand, performance for cross-modal alarm pairs, whether concurrent or sequential, was relatively good, suggesting that the auditory masking effects occurred only intramodally. This interpretation is supported by Multiple Resources Theory (Wickens, 2008).
For both visual and auditory alarms, the response time was longer with larger alarm clusters and also increased more rapidly with concurrent alarm clusters. Because response time was measured at the cluster level, the response time to a cluster is essentially the response time to the first alarm in the cluster. The processing of the following or other concurrent alarm signals delayed the response. This delay was not reported in previous studies as they did not ask participants to respond as quickly as possible (Beanland & Pammer, 2012; Boot et al., 2007). However, this delay is worrisome when viewed not in absolute terms (e.g., 821 ms for single visual alarms vs. 1314 ms for six concurrent visual alarms) but as a 60% increase in response time. In real-world environments where operators multitask more complex tasks, absolute response times tend to be longer, and a 60% increase can result in operationally relevant delays.
For clusters consisting of 4 or 6 sequential alarms, the first and last alarms were reported more accurately than other alarms in the same cluster, thus confirming H2-3. This was true for both visual and auditory alarms. These results are consistent with the pattern observed in free recall tasks, where subjects are presented with a series of items and required to recall the items, regardless of the order of presentation. Items closer to the beginning or the end of the sequence are more likely to be recalled. These effects were termed the primacy effect and the recency effect, respectively (Murdock, 1962). The primacy effect was explained as a result of covert rehearsal of the items in the sequence. The closer an item is to the beginning of the sequence, the more it gets rehearsed and possibly enters long-term memory. Therefore, the first items in a sequence are more likely to be recalled (Fischler et al., 1970; Laming, 2010). The recency effect was attributed to the fact that these items had just entered into short-term memory and were thus more accessible (Tzeng, 1973). There were two ways in which the participants reported a cluster of multiple alarms: report immediately after each alarm or wait until the end to avoid reporting during the cluster. In the first way, the report of one alarm overlapped and interfered with the presentation of the following alarms, thus giving the early alarms an advantage because they were less affected by such interference. In the second way, the early alarms had a similar advantage as those in the free recall studies because they were rehearsed more. The advantage of the last alarm was also comparable to that in the free recall studies because it was the last item to enter the short-term memory and therefore easier to retrieve. Therefore, in larger clusters, attention is not the only resource that limited report accuracy. The capacity of short-term memory could also play an important role in this process.
The comparison between alarm floods and routine operations yielded results that were mostly consistent with those from Experiment 1. During the alarm floods, the detection rate was slightly, but not significantly lower; accuracy was lower, and response times were shorter. These results confirm that participants change their response strategy when exposed to very large numbers of alarms in close temporal proximity, leading to a speed-accuracy tradeoff. To keep up with the pace of the alarm flood, they sped up their responses, but this was achieved at the cost of accuracy. This strategy could lead to potentially catastrophic misdiagnoses of critical alarms during an alarm flood in a real-world setting.
Finally, limitations of the reported studies should be noted. The participants in these experiments were students whose ability to multitask and process complex information may be different from that of well-trained professional operators. Larger sample sizes would be desirable to improve validity and statistical power. Also, some aspects of the tasks may not be representative of real-world operations but had to be adjusted for experimental reasons (e.g., verbal responses were required to reduce the interference between manual responses and visual scanning). Future studies in more representative settings are needed to further investigate these questions.
Conclusion
The goal of this research was to establish whether and to what extent findings from basic research on masking apply to information processing in more complex multitask settings where the phenomenon can result in operators missing critical alarms that appear in close temporal proximity. Two experiments were conducted to measure the detection and identification performance for visual and auditory alarms in the context of a simulated automated package delivery system. The results from Experiment 1 indicated that asynchronous masking was indeed observed for both visual and auditory alarms. An SOA of 800 ms was shown to be particularly detrimental to detection performance. Experiment 2 included simultaneous alarm presentation and alarm clusters that consisted of two, four, or six alarms. The simultaneous presentation of six visual alarms resulted in a much higher risk of missed or misidentified alarms. For auditory alarms, any number of concurrent signals was very difficult to detect and identify. Overall, when compared to routine operations, alarm floods led to lower detection rates, lower accuracy, and shorter response times to alarm signals. Also, performance of the package delivery monitoring tasks suffered during alarm floods: response time to the delivery consent task nearly doubled and over 90% of the ATC messages were missed.
These results confirm that masking is experienced, albeit at longer SOAs, and can lead to breakdowns in alarm detection and identification in complex data-rich domains. To reduce the risk of missed and misinterpreted alarms, intelligent alarm systems should be designed with these insights into human attention limitations in mind. For example, increasing SOAs between closely spaced critical alarms to prevent masking can complement previous efforts which have focused on adjusting the threshold of alarms (the value at which alarms are triggered) based on the context of system operations (Pollard, 2010; Schmid et al., 2017; Welch, 2011). Such systems are “adaptive” to the state of the system but not to the needs of the human operator. Adopting a human-centered approach to alarm design will contribute to increased safety in a range of application domains, such as process control, aviation, and medicine.
Key Points
Alarm floods are likely to happen when malfunctions happen in complex and highly coupled systems. Masking has been known to lead to attention limitations in the detection of visual and auditory signals, yet their effects in complex, multitasking environments remain unclear. Two experiments were conducted using a simulated drone supervisory control system to investigate this issue. Alarm detection and identification performance were affected when alarms were presented in temporal proximity. Overall speaking, an SOA of 800 ms led to the worse detection performance. When multiple alarms were presented concurrently, clusters of six visual alarms occurred to be much more difficult to detect and identify, so were any number of auditory alarms. In a cluster of multiple alarms, the first and last alarms were easier to detect and identify. Alarm systems should be designed with these temporal limitations in mind and avoid displaying alarms in a way that is prone to be missed.
Footnotes
Declaration of Conflicting Interests
The author(s) declared no potential conflicts of interest with respect to the research, authorship, and/or publication of this article.
Funding
The author(s) disclosed receipt of the following financial support for the research, authorship, and/or publication of this article: This work was supported by the University of Michigan.
Yuzhi Wan, Tencent Technology, Shanghai—PhD, Industrial and Operations Engineering, 2019, University of Michigan.
Nadine Sarter, Department of Industrial and Operations Engineering, University of Michigan - Ph.D., Industrial and Systems Engineering, 1994, Ohio State University