
Abstract
Objective
Two studies were conducted to develop and validate a questionnaire to estimate individual susceptibility to visually induced motion sickness (VIMS).
Background
VIMS is a common side-effect when watching dynamic visual content from various sources, such as virtual reality, movie theaters, or smartphones. A reliable questionnaire predicting individual susceptibility to VIMS is currently missing. The aim was to fill this gap by introducing the Visually Induced Motion Sickness Susceptibility Questionnaire (VIMSSQ).
Methods
A survey and an experimental study were conducted. Survey: The VIMSSQ investigated the frequency of nausea, headache, dizziness, fatigue, and eyestrain when using different visual devices. Data were collected from a survey of 322 participants for the VIMSSQ and other related phenomena such as migraine. Experimental study: 23 participants were exposed to a VIMS-inducing visual stimulus. Participants filled out the VIMSSQ together with other questionnaires and rated their level of VIMS using the Simulator Sickness Questionnaire (SSQ).
Results
Survey: The most prominent symptom when using visual devices was eyestrain, and females reported more VIMS than males. A one-factor solution with good scale reliability was found for the VIMSSQ. Experimental study: Regression analyses suggested that the VIMSSQ can be useful in predicting VIMS (R2 = .34) as measured by the SSQ, particularly when combined with questions pertaining to the tendency to avoid visual displays and experience syncope (R2 = .59).
Conclusion
We generated normative data for the VIMSSQ and demonstrated its validity.
Application
The VIMSSQ can become a valuable tool to estimate one’s susceptibility to VIMS based on self-reports.
Introduction
Visually induced motion sickness (VIMS) is a phenomenon similar to traditional motion sickness and is characterized by a variety of symptoms related to gastric activity (e.g., nausea, vomiting, stomach awareness), autonomic responses (e.g., pallor, sweating), arousal (e.g., fatigue, drowsiness, difficulty concentrating), disorientation (e.g., dizziness, vertigo), and/or oculomotor issues (e.g., eyestrain, blurred vision, headache; Bos et al., 2008; Golding & Gresty, 2015; Kennedy et al., 2010; Keshavarz, Hecht, Lawson, et al., 2014). In contrast to traditional motion sickness, actual physical movement is typically missing during VIMS and symptoms are primarily caused by stimulation of the visual system. The symptomatology of VIMS and traditional motion sickness are very similar, with oculomotor issues such as eyestrain and blurred vision being more common in VIMS. Depending on the visual device, various terms have been used in the literature to describe specific types of VIMS, including video gaming sickness (Frey et al., 2007), cinerama sickness, virtual reality (VR) sickness (Cobb, Nichols, et al., 1999), cybersickness (Stanney & Kennedy, 1997), or simulator sickness (Kennedy et al., 1989). Here, we use VIMS as a general term that includes all these subcategories. Note that the use of simulators and VR may involve physical motion in certain cases (e.g., motion-based simulators, head tracking in VR), and symptoms experienced using these devices may strictly speaking not be purely visually induced; however, as the visual system is arguably the main contributor to motion sickness-like sensations in these cases, we will include them under the umbrella of VIMS in the present paper.
The exact prevalence of VIMS remains unclear, but laboratory research suggests that the percentage of people experiencing VIMS can vary widely from 1% (Klüver et al., 2015) to 80% under certain circumstances (Cobb, 1999; Stanney et al., 1999; Stanney, Mourant, et al., 1998), depending on several factors such as the VR equipment (Frank et al., 1988; Moss & Muth, 2011), the experimental setup (e.g., field-of-view, Bos et al., 2010; Duh et al., 2002), or the visual content (Bubka et al., 2007; Keshavarz, Philipp-Muller, et al., 2019; Palmisano et al., 2007). Additionally, several factors affect an individual’s susceptibility to VIMS. For instance, females have been found to report more VIMS than males (Flanagan et al., 2005; Klosterhalfen et al., 2006; Stanney et al., 2020), although the robustness of this finding remains unclear given that some studies could not identify sex-related differences (Curry et al., 2020; Klosterhalfen et al., 2006). Age has been discussed as another prominent factor, with older adults often reporting more VIMS compared to younger adults (Domeyer et al., 2013; Keshavarz et al., 2018). In the present study, we will consider age- and sex-related differences to further enhance our understanding about the role of these two factors.
The elevated risk for experiencing VIMS is critical for several reasons. VR technologies have dramatically improved over the last decade, while being affordable and accessible to a broad population. Several VR systems (e.g., Oculus Rift, HTC Vive, Playstation VR) offer a highly realistic, immersive, and multisensory VR experience. In 2020 alone, 4.93 million VR devices were sold worldwide and these numbers are expected to increase (www.statista.com/statistics/677096/vr-headsets-worldwide/). VR is no longer a niche product, but is rather a common tool in several domains, including rehabilitation (Massetti et al., 2018), education (Radianti et al., 2020), research (Loomis et al., 1999), training (Adamovich et al., 2009), mental health (Rizzo et al., 1998), clinical assessment (Rizzo, 2014), and personal entertainment (Bates, 1992). The risk of experiencing VIMS can have a dramatic impact on VR technologies from an economic standpoint and may jeopardize the success and acceptability of these technologies. However, VIMS poses a health concern not only when using VR systems, but also for other visual devices such as video games, cinemas, smartphones, and/or tablets. Although symptoms associated with VIMS are typically short-lived and resolve within minutes after stopping, they can occasionally last for several hours and affect the user’s daily activities (Stanney et al., 1999; Stanney et al., 1998). In addition, VIMS is particularly problematic for those with compromised health conditions, where symptoms such as nausea, headache, or dizziness may worsen an underlying medical condition such as migraines and vestibular disorders. Our modern society increasingly relies on visual technologies and the problems associated with VIMS will become even more important in the near future.
Over the past decades, several techniques have been introduced to reduce or prevent VIMS. The list of countermeasures is long and ranges from simple recommendations about the distance to the visual screen (Bos et al., 2010; Duh et al., 2002), behavioral methods (Keshavarz, 2016; Yen Pik Sang et al., 2003), to more complex pharmacological treatments (Golding & Gresty, 2015). The latter is often associated with unwanted side effects such as drowsiness and is therefore not a feasible solution in most situations. Nonpharmacological treatments such as music (Keshavarz & Hecht, 2014; Peck et al., 2020), controlled breathing (Yen Pik Sang, Golding, et al., 2003), visual reference about true gravity vertical (Duh et al., 2004; Prothero et al., 1999), or airflow (D’Amour et al., 2017) can be effective under certain circumstances, but none of these measures fully prevent VIMS. The most effective treatment available so far remains habituation (Hill & Howarth, 2000; Smither et al., 2008). That is, repeated exposure to the same, nauseating stimulus eventually results in reduced VIMS over time, even in severe cases of VIMS (Rine et al., 1999). However, habituation is time consuming and the specific tolerance acquired from one type of visual technology may not always generalize to other VIMS-inducing situations.
Given the lack of reliable methods to prevent VIMS, it is of utmost importance to identify those who are at risk of experiencing VIMS. Unfortunately, reliable methods to predict the susceptibility to VIMS do, to the best of our knowledge, not yet exist. Several methods have been introduced in the past that measure the severity of VIMS during or after exposure to a VIMS-inducing stimulus, such as the Misery Index (Bos, 2015), the Nausea Profile (Muth et al., 1996), the Fast Motion Sickness Scale (FMS; Keshavarz & Hecht, 2011), or the Simulator Sickness Questionnaire (SSQ, Kennedy et al., 1993). In contrast, no tool exists that can be assessed prior to a VIMS-inducing stimulus in order to estimate one’s susceptibility to VIMS. Golding (1998, 2006) introduced the Motion Sickness Susceptibility Questionnaire (MSSQ) to predict an individual’s susceptibility to traditional motion sickness. The MSSQ inquires about a person’s past history of motion sickness as a child or adult. The use of the MSSQ has become best practice to predict traditional motion sickness; however, the MSSQ was not designed to predict VIMS. In fact, items referring to visual devices have been deliberately removed from the MSSQ during the development process because, at the time, visual devices as we know them today were not as common, and including these items did not add to the overall predictive power of the MSSQ. Since new visual technologies have greatly increased and can now be considered mainstream, a tool that focuses on the susceptibility of VIMS is highly desirable. Thus, our objective is to fill this void by introducing a novel method to predict the susceptibility to VIMS, the Visually Induced Motion Sickness Susceptibility Questionnaire (VIMSSQ). Importantly, note that the VIMSSQ was designed as an addition to the MSSQ, and not necessarily as a substitute thereof.
The present paper consists of two main parts. In the first part, we will describe the development of the VIMSSQ and its relationship to other possible risk factors such as classical motion sickness susceptibility, migraine, or dizziness. We will present data from a survey with N = 322 participants using the VIMSSQ. In the second part, we will present empirical findings from an experimental study that shows the usefulness of the VIMSSQ in predicting VIMS. In this experimental study, we applied the VIMSSQ prior to exposing participants to a VIMS-inducing stimulus. VIMS was measured after stimulus exposure using the SSQ (Kennedy et al., 1993), a widely used questionnaire assessing the severity and symptomatology of VIMS.
Part 1: Development and Normative Data of the VIMSSQ—Survey Study
Methods
Development of the VIMSSQ
Questionnaire structure
The VIMSSQ was developed with the MSSQ-short (Golding, 2006) in mind. That is, we adopted the assumption that previous incidences of VIMS can successfully predict future episodes of VIMS. However, as the symptomatology of VIMS is more diverse compared with traditional motion sickness (e.g., more oculomotor issues and dizziness; Lawson, 2014; Stanney & Kennedy, 1997), we decided to inquire about the frequency of specific symptoms when using visual devices, rather than asking for an overall estimation of the level of VIMS for each visual device. Note that this is in contrast to the MSSQ, which asks how often participants experienced motion sickness without looking at different symptoms separately. Thus, the VIMSSQ focuses on five symptoms: nausea, headache, dizziness, fatigue, and eyestrain. Nausea and fatigue are cardinal symptoms of both VIMS and traditional motion sickness, whereas headache, dizziness, and eyestrain are more pronounced in VIMS than in traditional motion sickness (Golding & Gresty, 2005; Keshavarz, Hecht, Lawson, et al., 2014; Lawson, 2014). As previously mentioned, the list of other symptoms for VIMS is long and can include pallor, sweating, burping, blurred vision, general discomfort, vertigo, etc. However, in order to reduce the number of symptoms for inclusion in the VIMSSQ, we decided to focus on symptoms that (a) are most common in VIMS and (b) the user can easily relate to (e.g., it is difficult to self-observe pallor).
The frequency of each of the five symptoms had to be rated for 11 common visual devices. The visual devices included 2D movie theater, 3D movie theater, IMAX theater, smartphone (dynamic content like movies), tablet (dynamic content like movies), TV, video games (console or computer), head-mounted displays/VR glasses, stationary platform simulators, moving platform simulators, and large public moving display advertising or information screen. The frequency of each symptom had to be rated on a four-point Likert scale (never, rarely, sometimes, often; see Golding, 2006) for experiences during adulthood (18 years or older), ignoring childhood experiences; participants could also indicate if they never used a visual device (never used/not applicable: n/a).
In addition, the VIMSSQ included a part that asked the user about their habits of using the above mentioned 11 visual devices (How often have you used or experienced any of these devices or displays during adulthood?). Again, participants could choose between never, rarely, sometimes, and often. This section allowed the researcher to gain insights into how common the usage of different visual displays is and it may help to detect differences between populations in terms of their proficiency with these devices and displays. Finally, a single question at the end of the VIMSSQ inquired whether participants stopped using any of these devices due to increased discomfort (Have any of these symptoms stopped you from using any of these devices or made you actively avoid viewing such displays?). If participants responded with yes, they were asked to list the types of devices that they stopped using in a free response format. (Note that for the final version of the VIMSSQ, we decided to change the response format for the avoidance question to match the VIMSSQ response format: 0 = never, 1 = rarely, 1 = sometimes, 3 = often). Overall, the VIMSSQ contained 67 items: 11 items regarding the usage frequency of visual displays and devices, 55 items regarding the frequency of each of the five symptoms, and one question regarding the avoidance of any visual devices and displays.
Scoring
The scoring of the VIMSSQ follows Golding’s (2006) procedure for calculating the MSSQ scores. That is, responses for each item are assigned a numeric value (0 = never, 1 = rarely, 2 = sometimes, 3 = often, n/a = never used/not applicable). To calculate scores for each of the five subscales—nausea (VIMSSQ-N), headache (VIMSSQ-H), dizziness (VIMSSQ-D), fatigue (VIMMSQ-F), and eyestrain (VIMSSQ-ES), the following procedure is applied (Figure 1): for each subscale, the number of types of visual devices and displays not used by the participant is identified and counted (i.e., the total number of n/a – not used responses, maximum = 11). Next, for each subscale, the score for each of the 11 types of devices/displays is calculated by summing the raw scores for each item (n/a responses counted as zero). To ultimately calculate each VIMSSQ subscale, we used the formula:

with “raw subscale score = score for either nausea, dizziness, fatigue, headache, or eyestrain” and “n/a total = the total number of n/a responses.” If no types of visual devices are experienced, an error due to a division by zero would occur, making it not possible to calculate a VIMSSQ score and estimate VIMS susceptibility, which also provides an internal consistency check. The maximum score for each VIMSSQ subscale is 33. A VIMSSQ total score (VIMSSQ-TS) can be calculated by summing the five subscales.
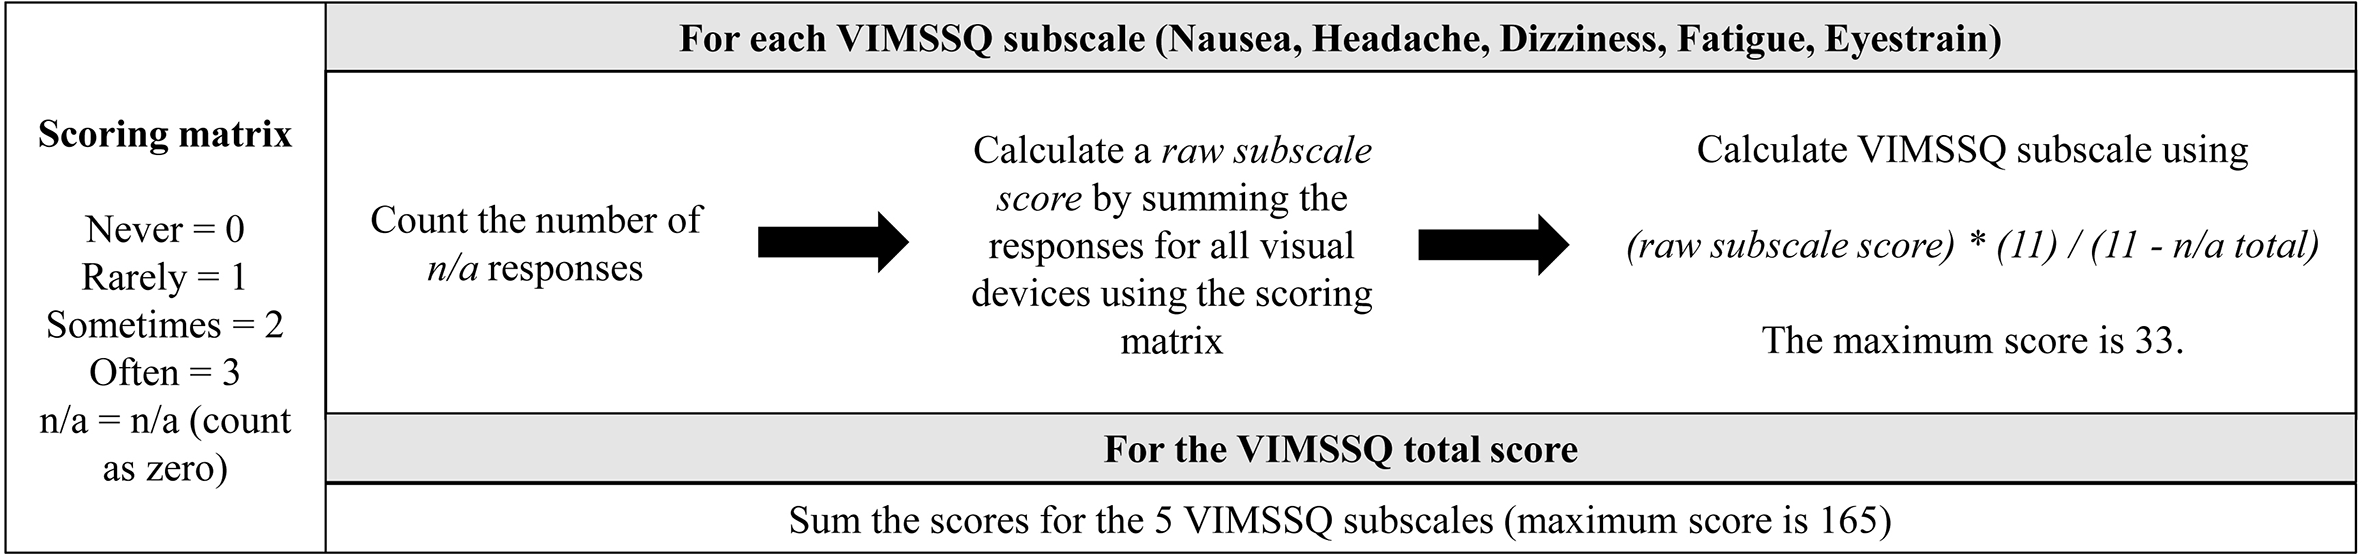
Scoring procedure for the VIMSSQ subscales (upper panel) and the VIMSSQ total score (lower panel). Note. Refer to the text for a detailed description of the scoring procedure. VIMSSQ = Visually Induced Motion Sickness Susceptibility Questionnaire.
Participants
A total of 332 participants filled out the VIMSSQ either via an online survey using the platform Qualtrics (n = 140) or as a paper-and-pencil version when they attended experimental studies at KITE-Toronto Rehabilitation Institute, University Health Network (UHN) (n = 192). In both cases, participants gave their written consent first before filling out the VIMSSQ. The online survey was approved by the research ethics boards of the UHN, Canada, and the University of Westminster, United Kingdom. The respective study protocols for the paper-and-pencil version of the VIMSSQ were all approved by the research ethics board of the UHN, Canada. Ten participants were removed from the data analysis due to incomplete data sets, resulting in a final sample size of N = 322 (Mage = 32.89 years, SDage = 18.82). The sample consisted of 195 females (Mage = 31.26 years, SDage = 17.53) and 126 males (Mage = 35.38 years, SDage = 20.45). As differences between females and males have been suggested with regard to VIMS severity (Flanagan et al., 2005; Stanney et al., 2020), we will consider sex as a factor in our analysis. Note that one participant chose not to answer the question regarding their sex and was therefore excluded from all sex-related statistical analysis. A detailed description of the age distribution of the sample is given in Figure 2.
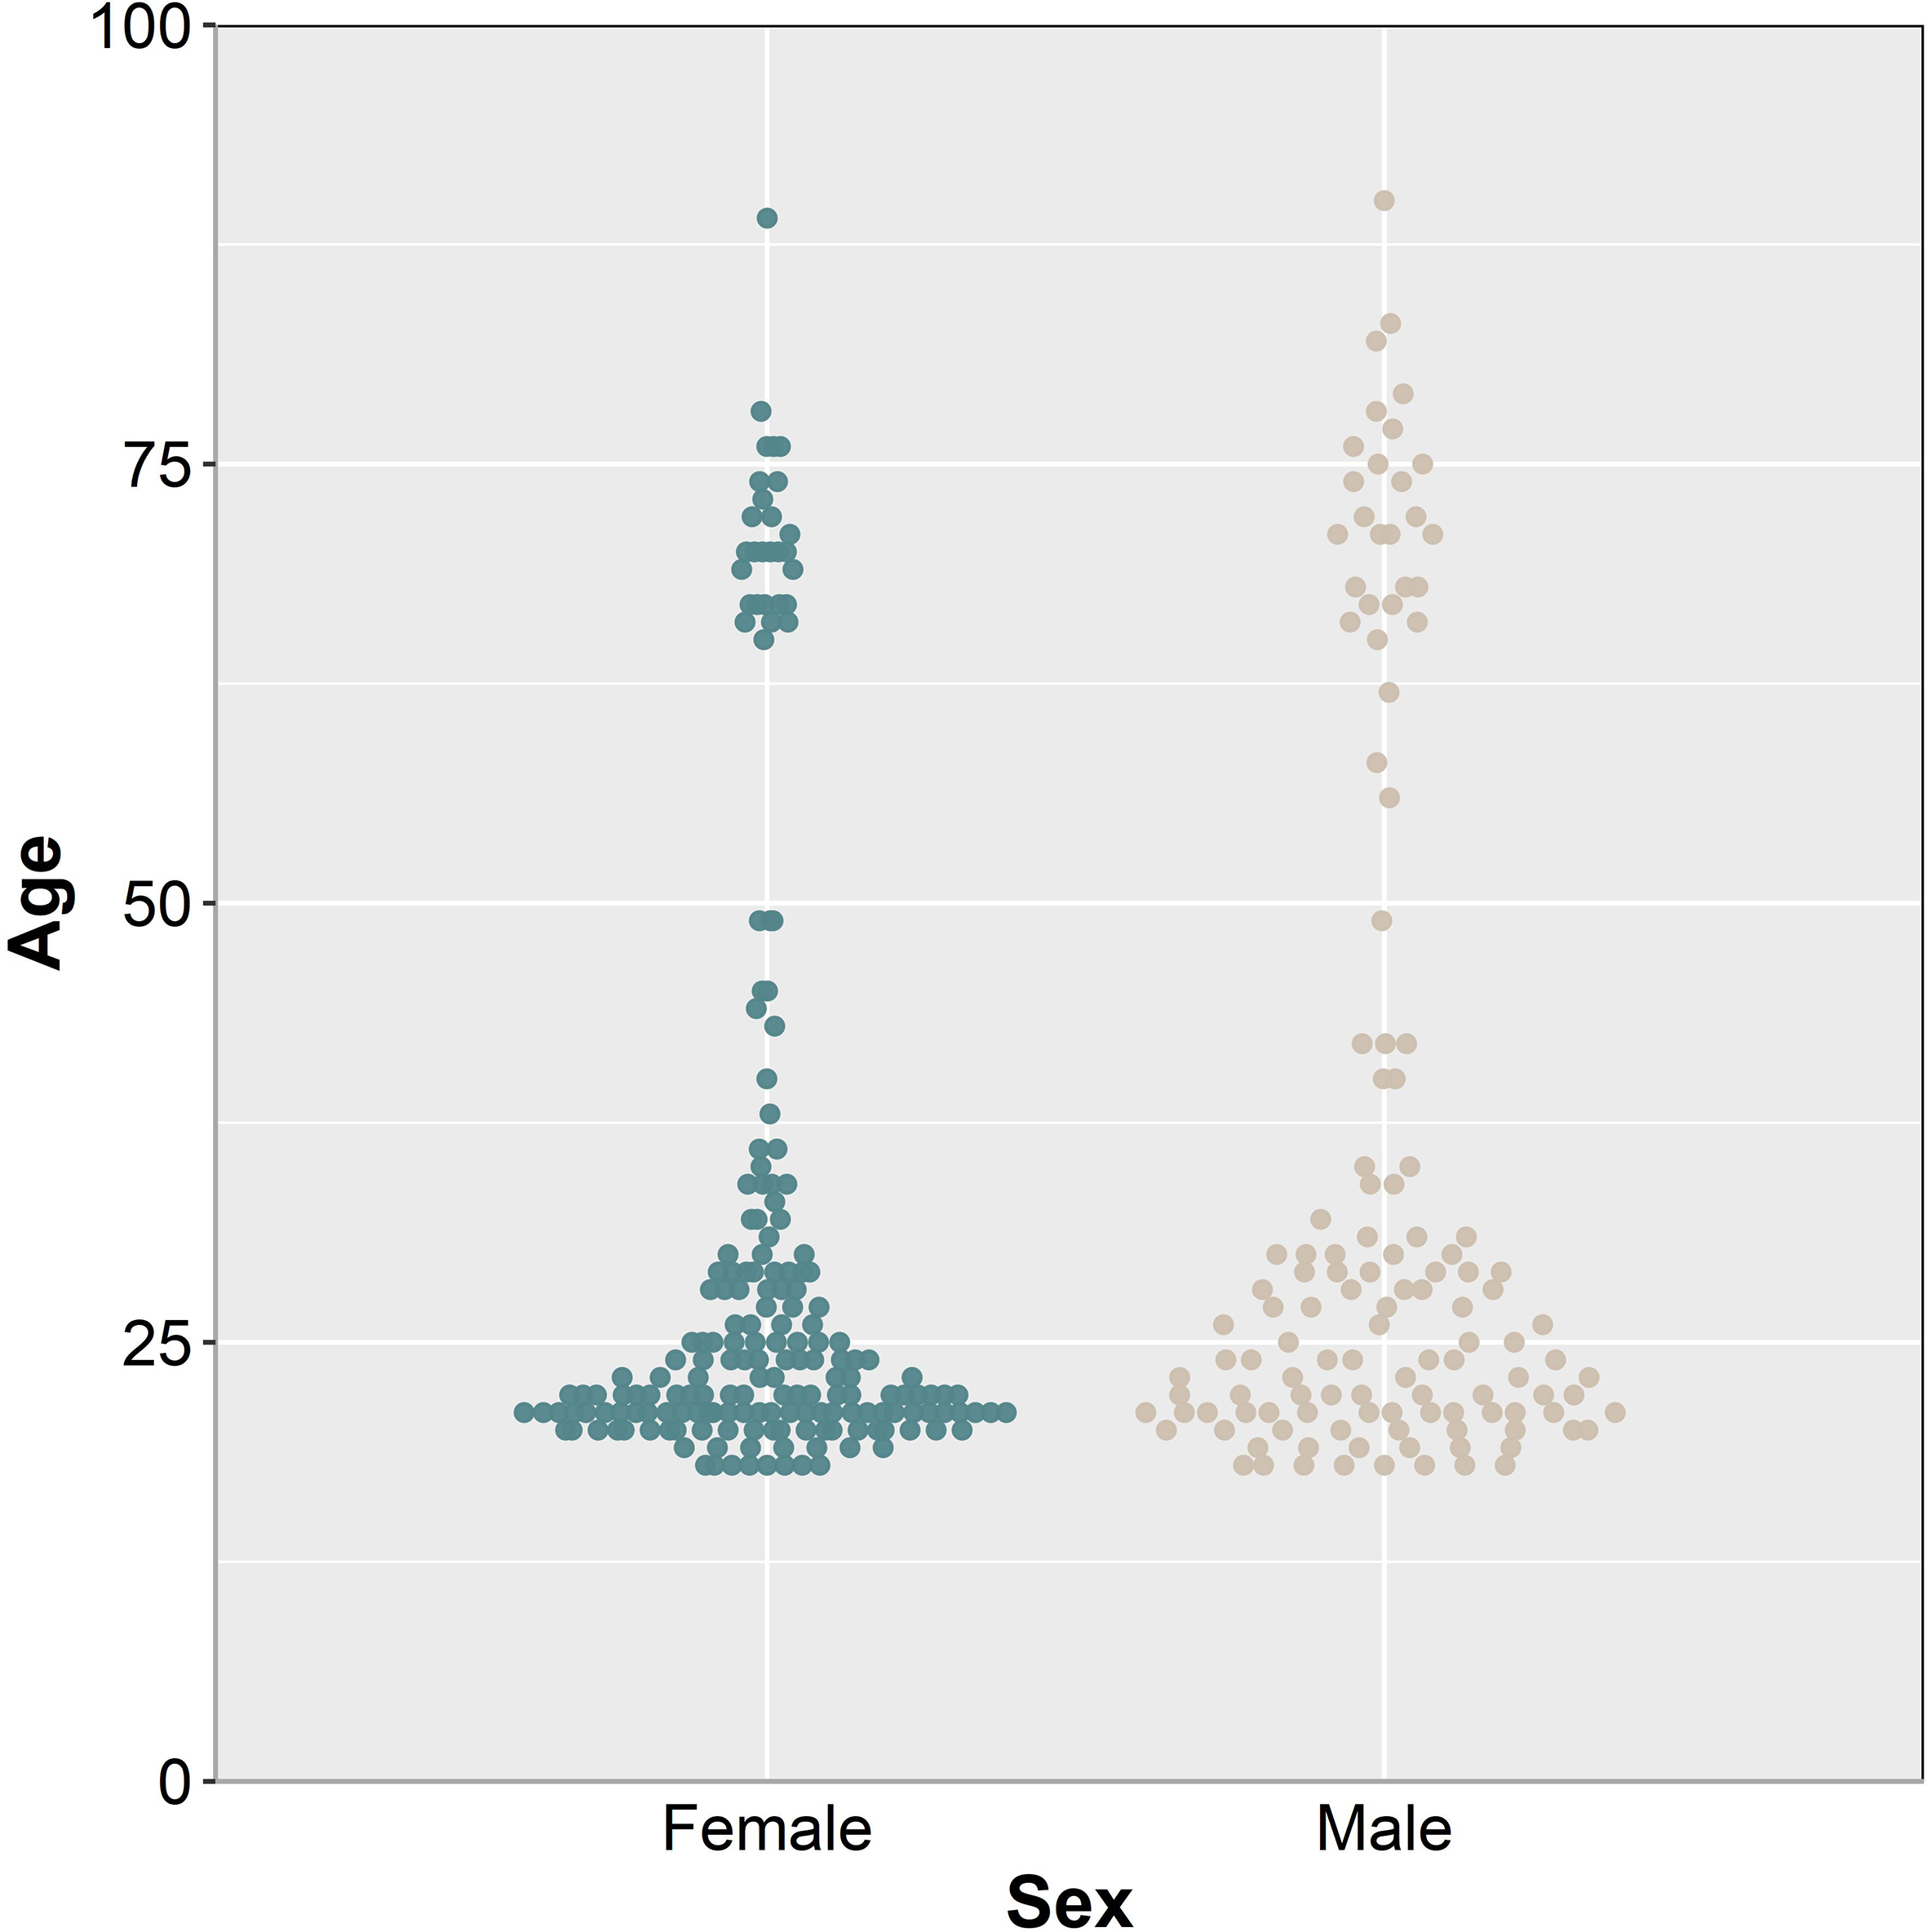
Participants’ age distribution separated by sex.
Other Baseline Measures
In addition to the VIMSSQ, participants filled out questionnaires related to concepts relevant to VIMS, including their susceptibility to traditional motion sickness, migraines, and the impact of dizziness on daily living. Motion sickness susceptibility was measured using the short version of the MSSQ (Golding, 2006). The MSSQ inquires about the frequency of motion sickness (not applicable, never, rarely, sometimes, often) when traveling or using different modes of transportation (e.g., car, bus, ship, airplane, funfair rides) as a child (before the age of 12) and as an adult (last 10 years). The tendency to experience migraines has been linked to the experience of VIMS in the past (Golding & Patel, 2017) and was measured using the Migraine Screen Questionnaire (Láinez et al., 2010), consisting of five items that are rated on a binary scale (0 = no, 1 = yes). Questions include whether a person experiences frequent or intense headaches and whether the headaches last more than 4 h. A total score was calculated by summing the values for each response (max. score = 5), with a score of 4 or higher indicates high propensity to experience migraines. The Social Life and Work Impact of Dizziness questionnaire (SWID4), a set of four social, travel, family, and work-related questions that has been validated previously (Bronstein et al., 2010), was used to assess the impact of dizziness on social life and work. Participants had to provide yes or no responses to these questions, and the values (no = 0, yes = 1) were summed together to create a total score for SWID (max. score = 4). A single binary item concerning the susceptibility to vasovagal syncope and facilitating factors, circumstances, and symptoms (derived from Bosser et al., 2006) was added.
Results
Device Usage
An overview of the usage of visual devices is provided in Figure 3 for male and female participants. To account for the nonnormality of the data (ordinal scales), nonparametric Wilcoxon Rank-Sum tests were calculated to detect differences in the frequency of visual device usage for males and females. Results showed that male participants played significantly more video games than female participants (W = 8080.50, p < .001). No other sex-related differences were found for any of the other visual devices.
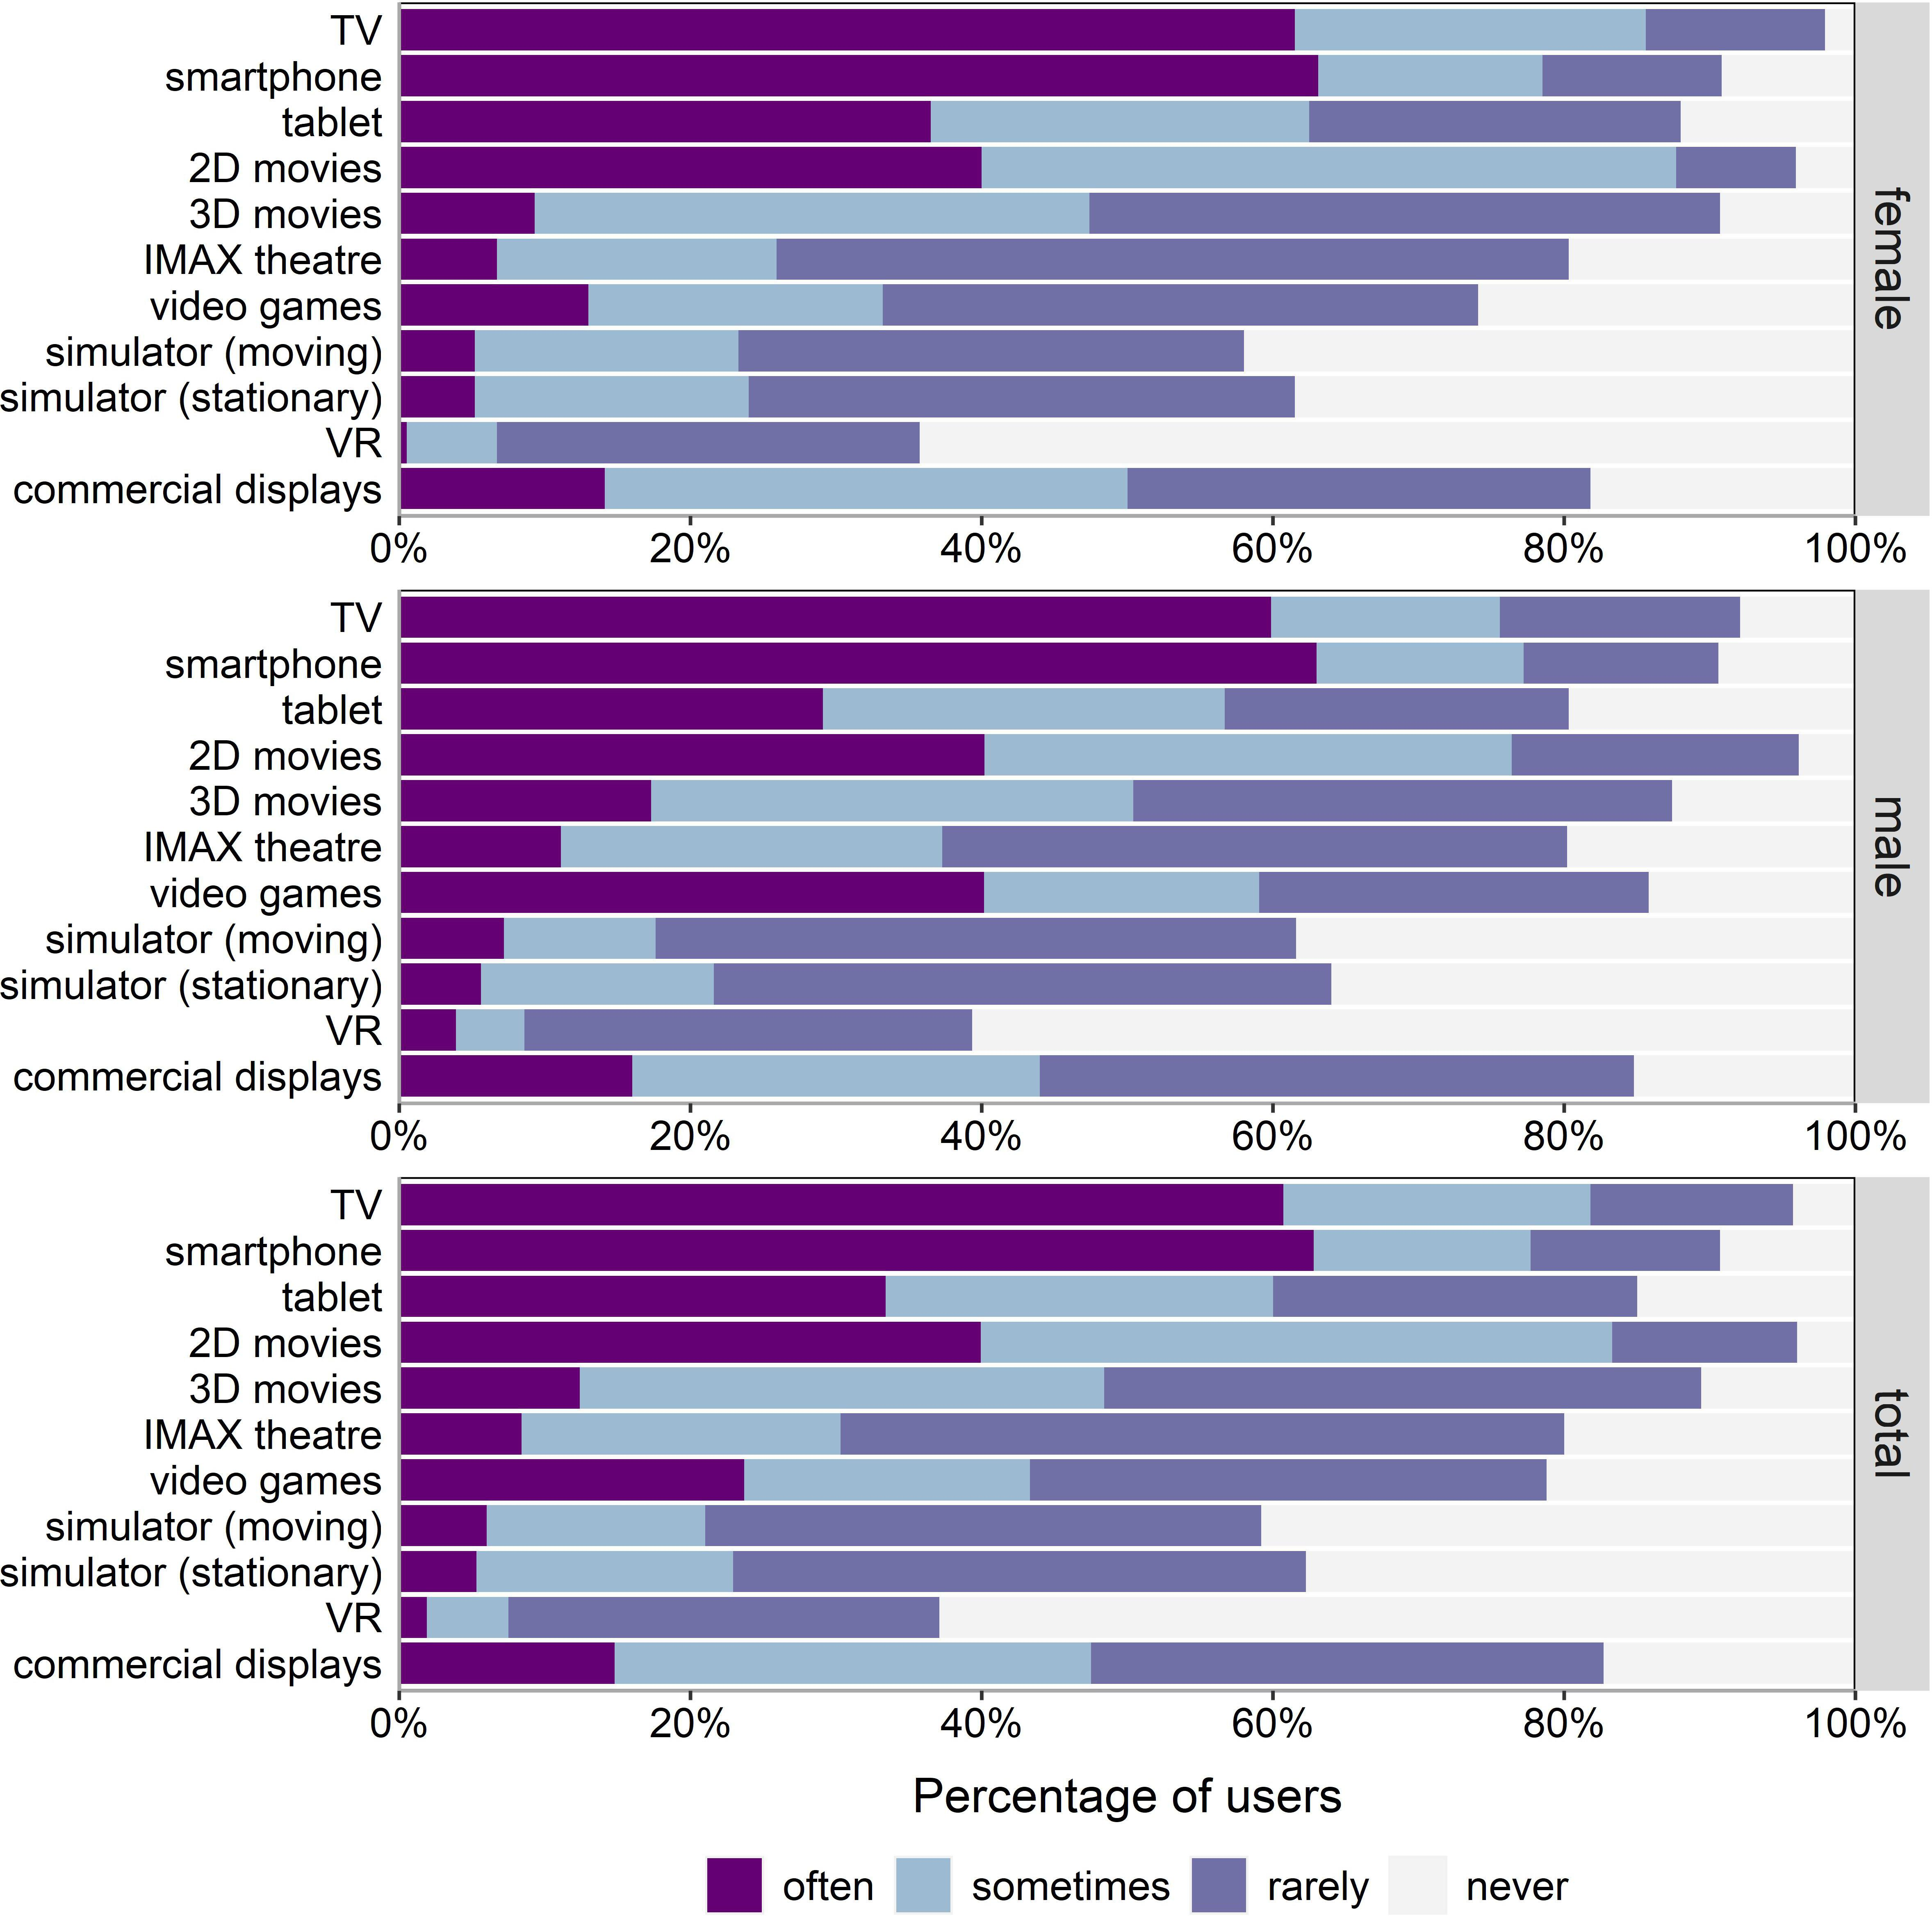
Relative frequency of device usage (in percent) for females (top panel), males (center panel), and for both combined (bottom panel). Note. VR = virtual reality.
Symptom Frequency, VIMSSSQ Scores, Device Avoidance, and Sex
The frequency of each VIMS-related symptom for each of the visual devices is shown in Figure 4. The mean scores for the VIMSSQ subscales nausea, dizziness, fatigue, headache, and eyestrain as well as the VIMSSQ total score are shown in Figure 5 for female and male participants. Detailed statistical information including percentiles for each VIMSSQ subscale is given in Table 1. Independent samples t tests (degrees of freedom corrected for unequal variances, Holm-corrected alpha level, Cohen’s d as effect size) were calculated to investigate sex-related differences with regards to the VIMSSQ subscales. Females reported significantly higher scores for the VIMSSQ subscales dizziness, t(278) = 2.625, p = .025, headache, t(309) = 4.327, p < .001, d = .47, d = .30, fatigue, t(296) = 2.476, p = .025, d = .27, eyestrain, t(291) = 3.120, p = 002, d = .35, and the total score, t(291) = 3.577, p < .001, d = .40,. No significant difference showed for the VIMSSQ subscale nausea, t(257) = 1.660, p = .086, d = .19.
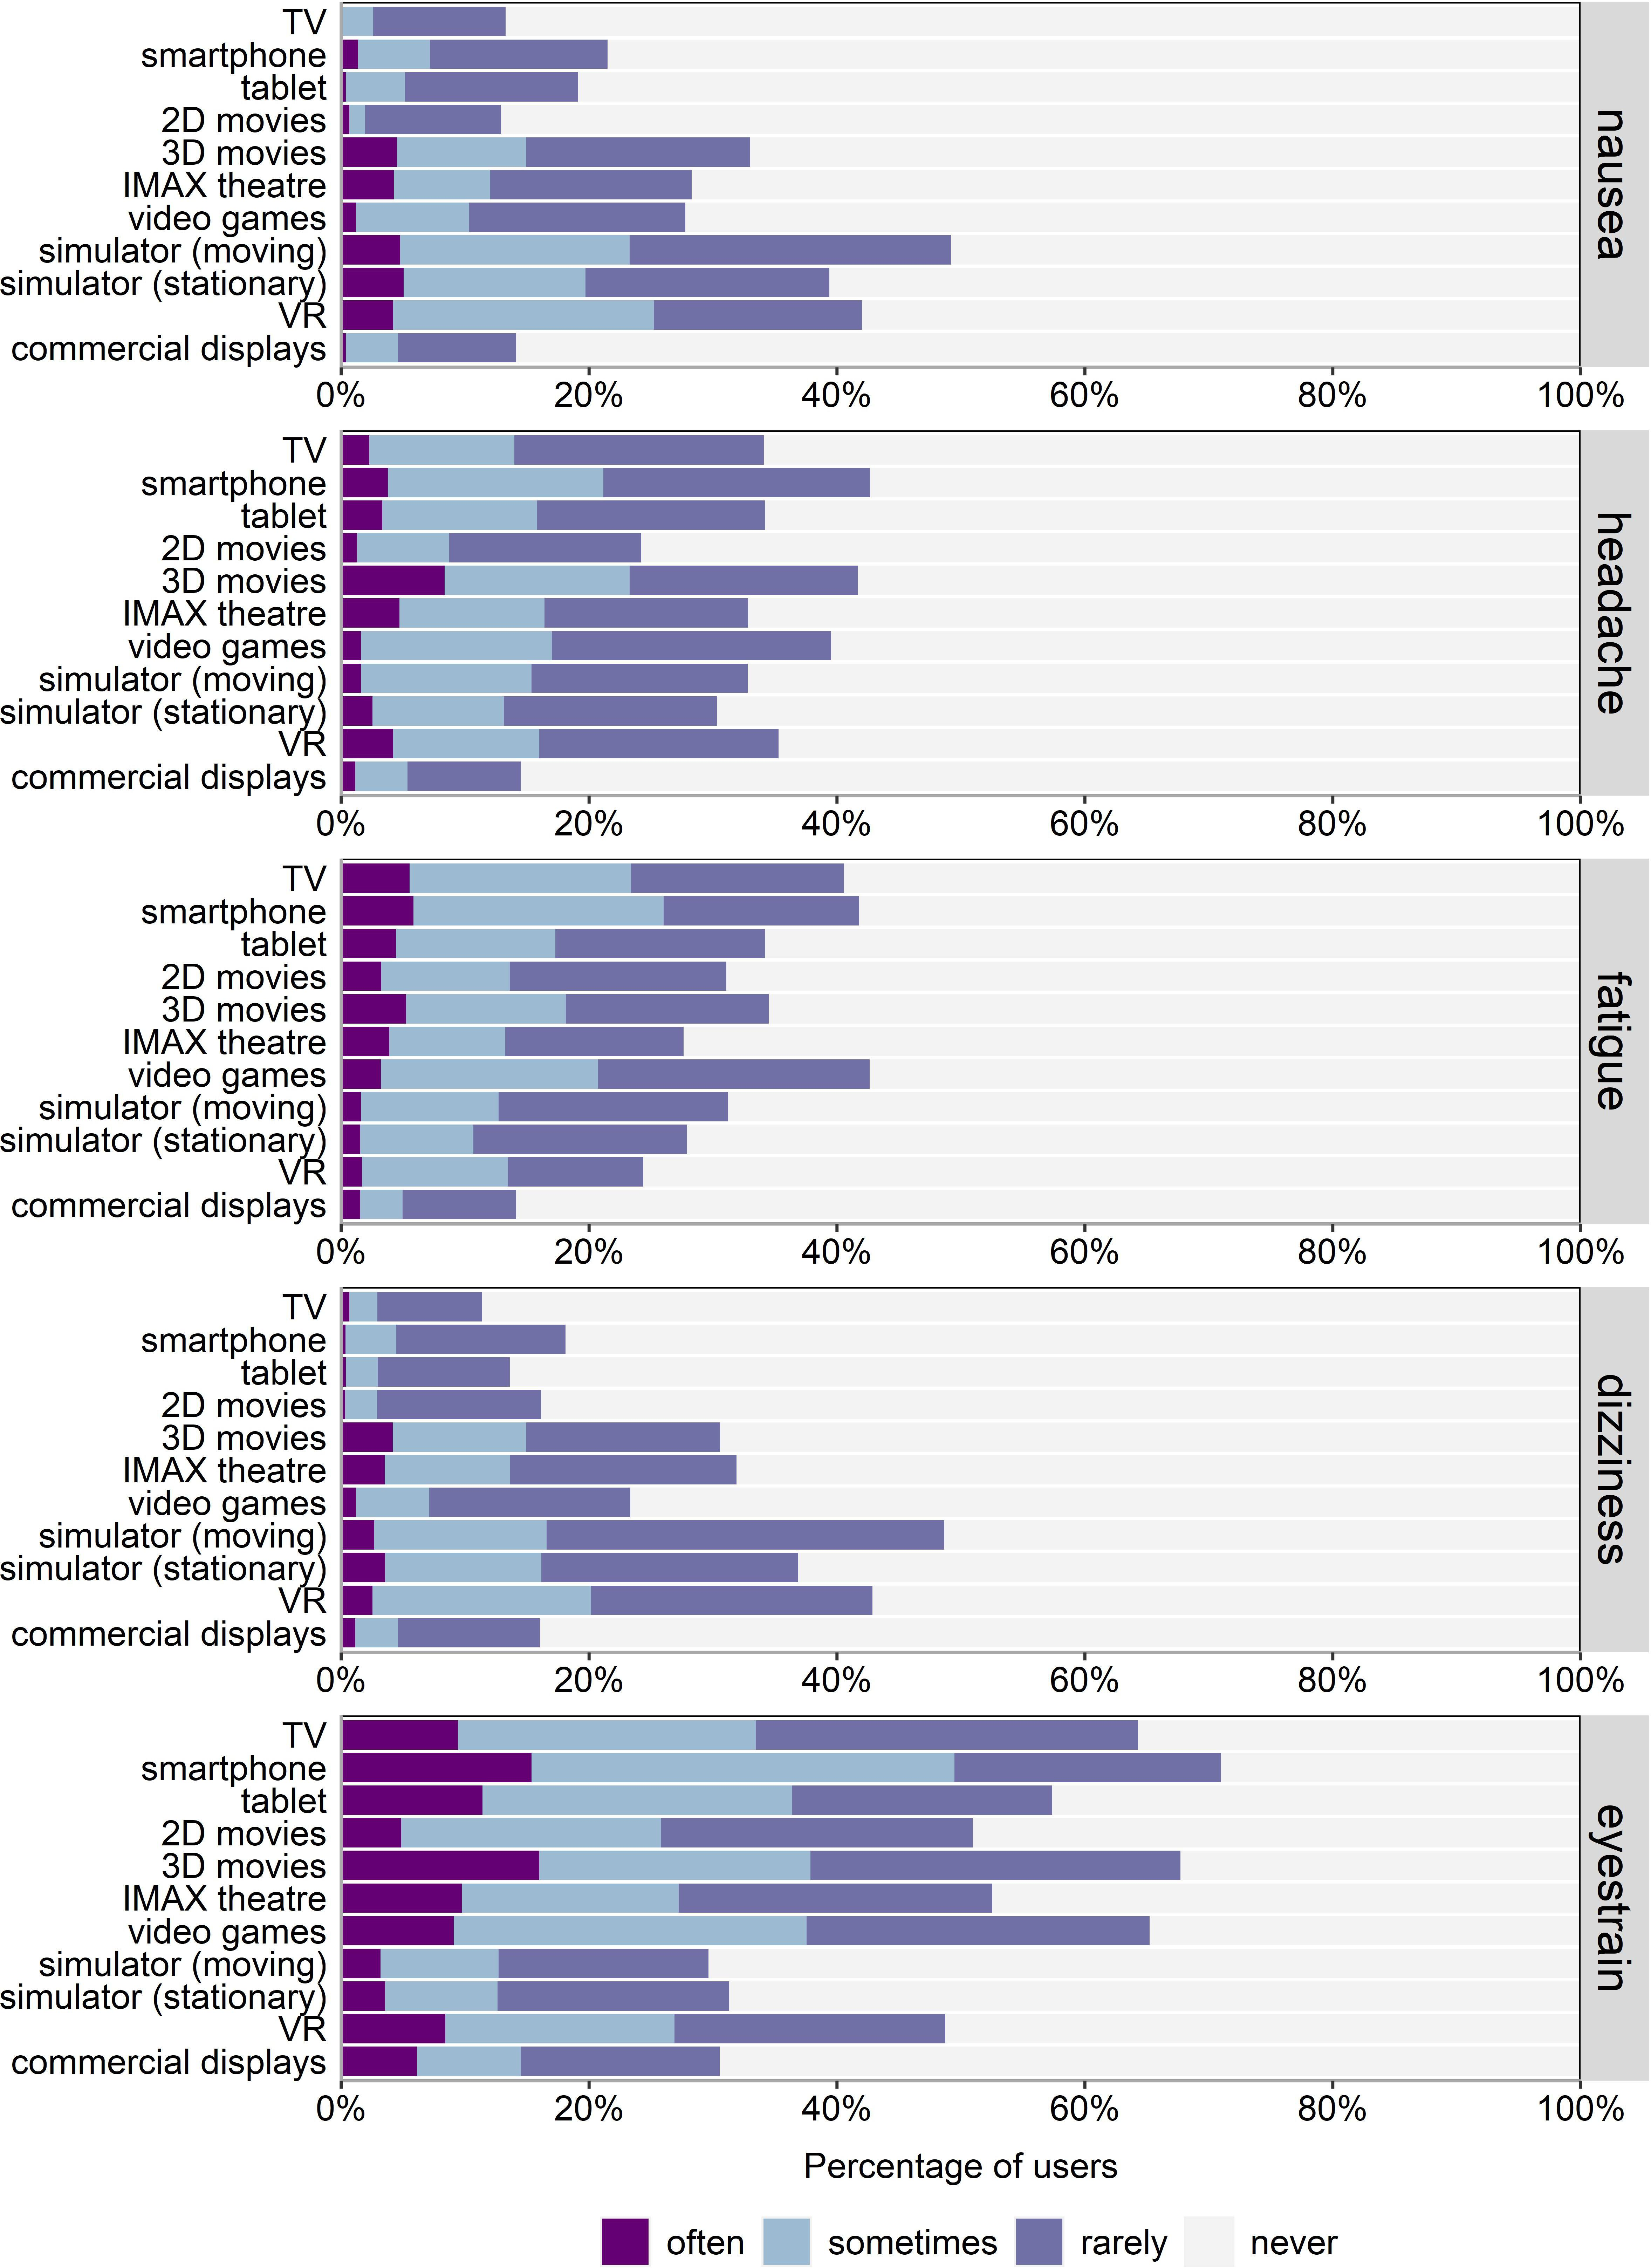
Relative frequency of reported symptoms for each of the visual devices averaged across sex. Note. Participants who never have used a particular visual device were removed to enhance comparability across devices, resulting in different sample sizes for TV (n = 309), smartphone (n = 293), tablet (n = 272), 2D movies (n = 310), 3D movies (n = 288), IMAX theatre (n = 256), video games (n = 252), simulator moving (n = 189), simulator stationary (n = 298), VR (n = 119), and commercial displays (n = 262). VR = virtual reality.
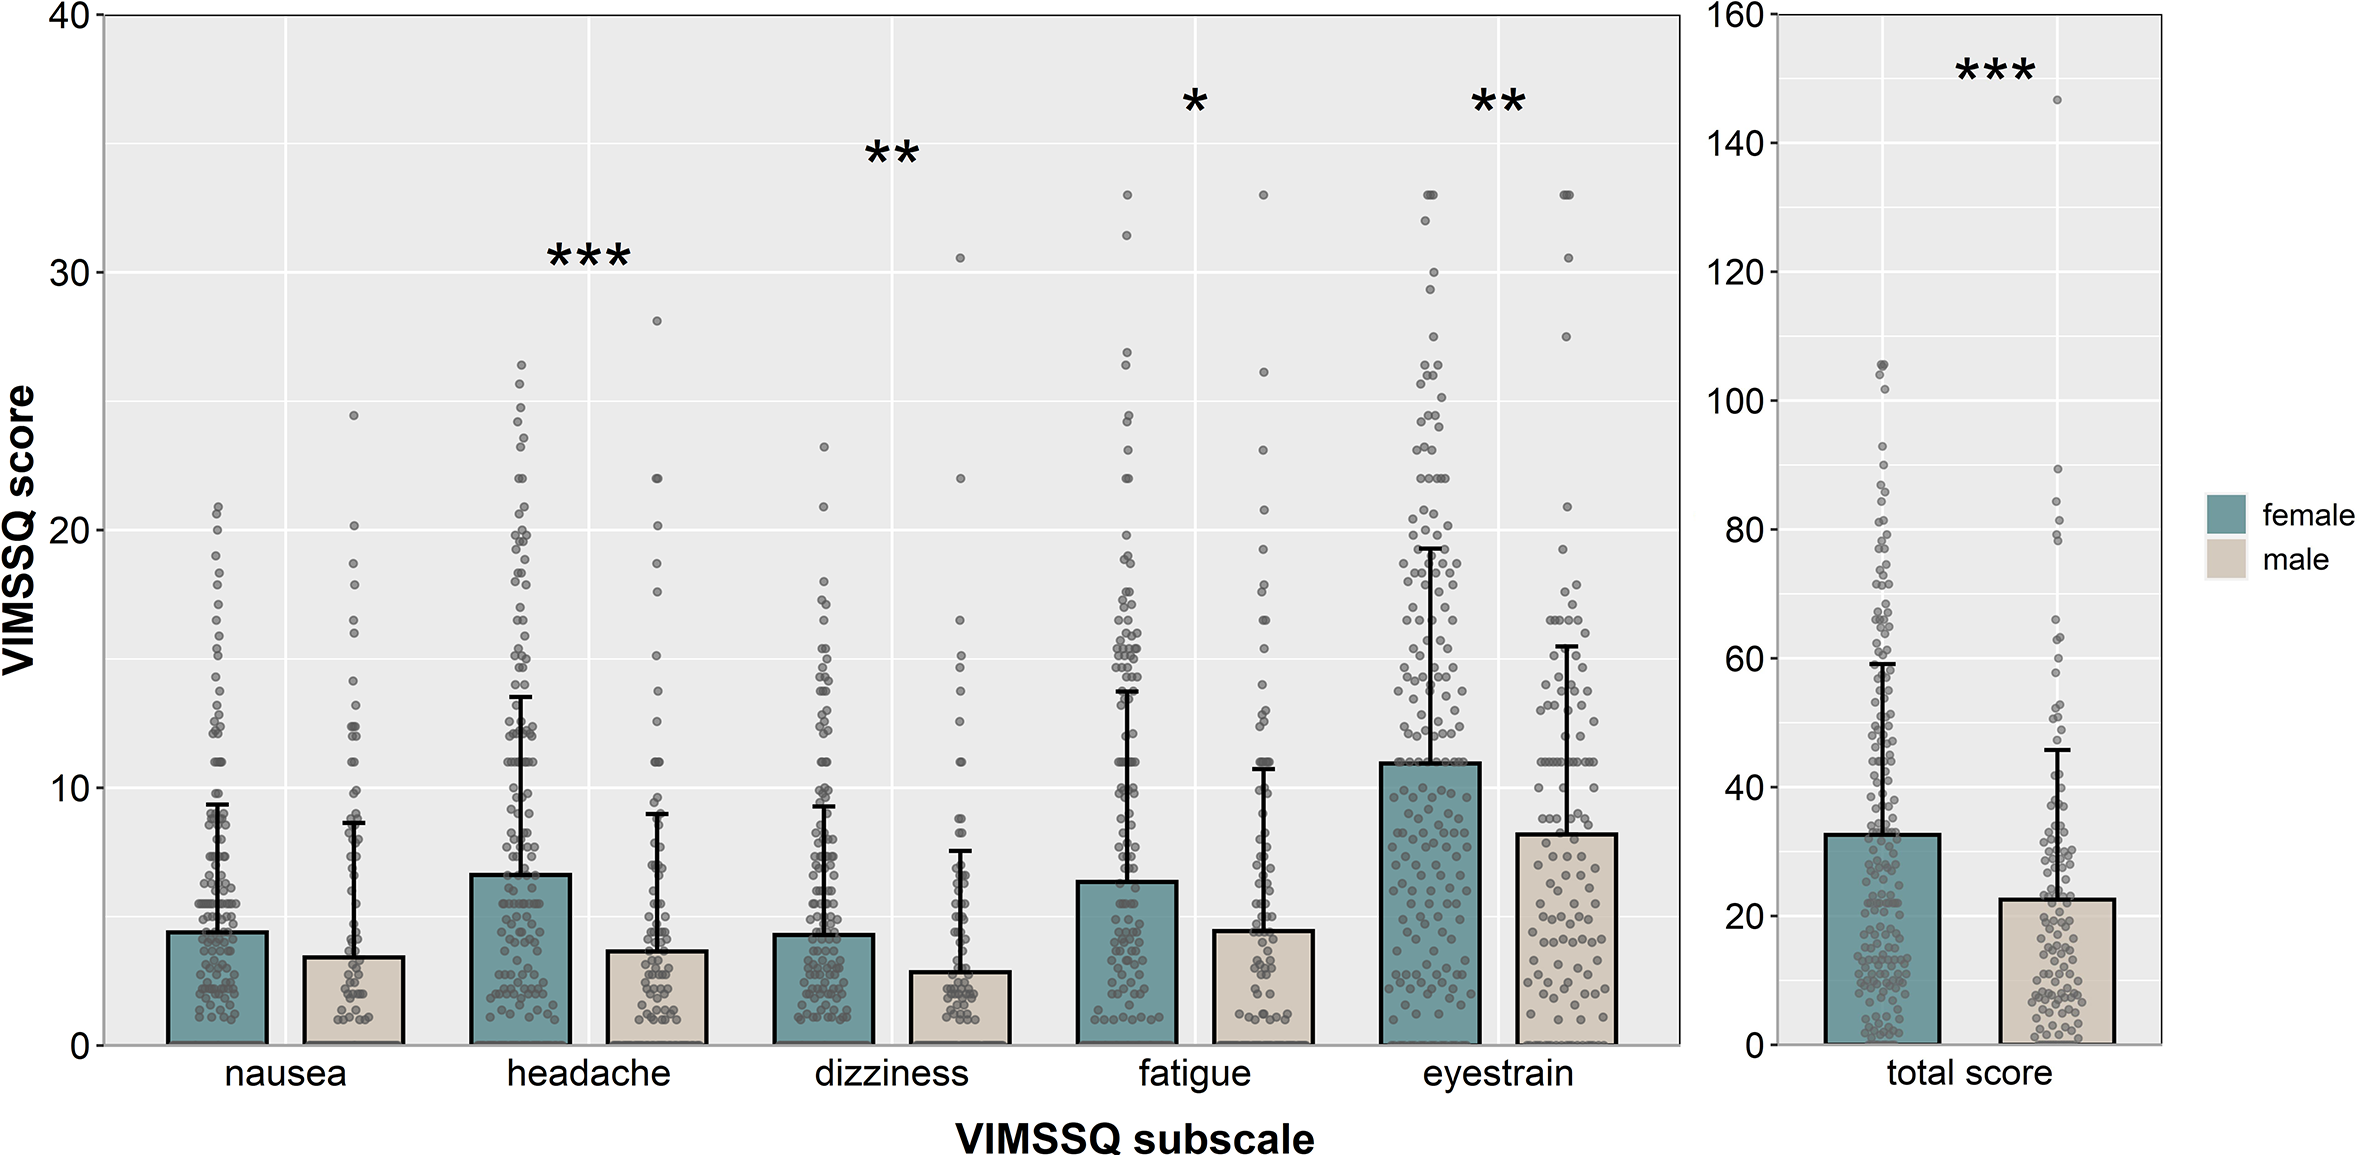
Mean scores for the VIMSSQ subscales nausea, headache, dizziness, fatigue, and eyestrain averaged across visual devices and separated by sex. Note. Error bars represent SD. Single dots represent individual scores for each participant. *p < .05, **p < .01, ***p < .01. VIMSSQ = Visually Induced Motion Sickness Susceptibility Questionnaire.
Descriptive Statistics for the VIMSSQ Subscales Separated by Sex
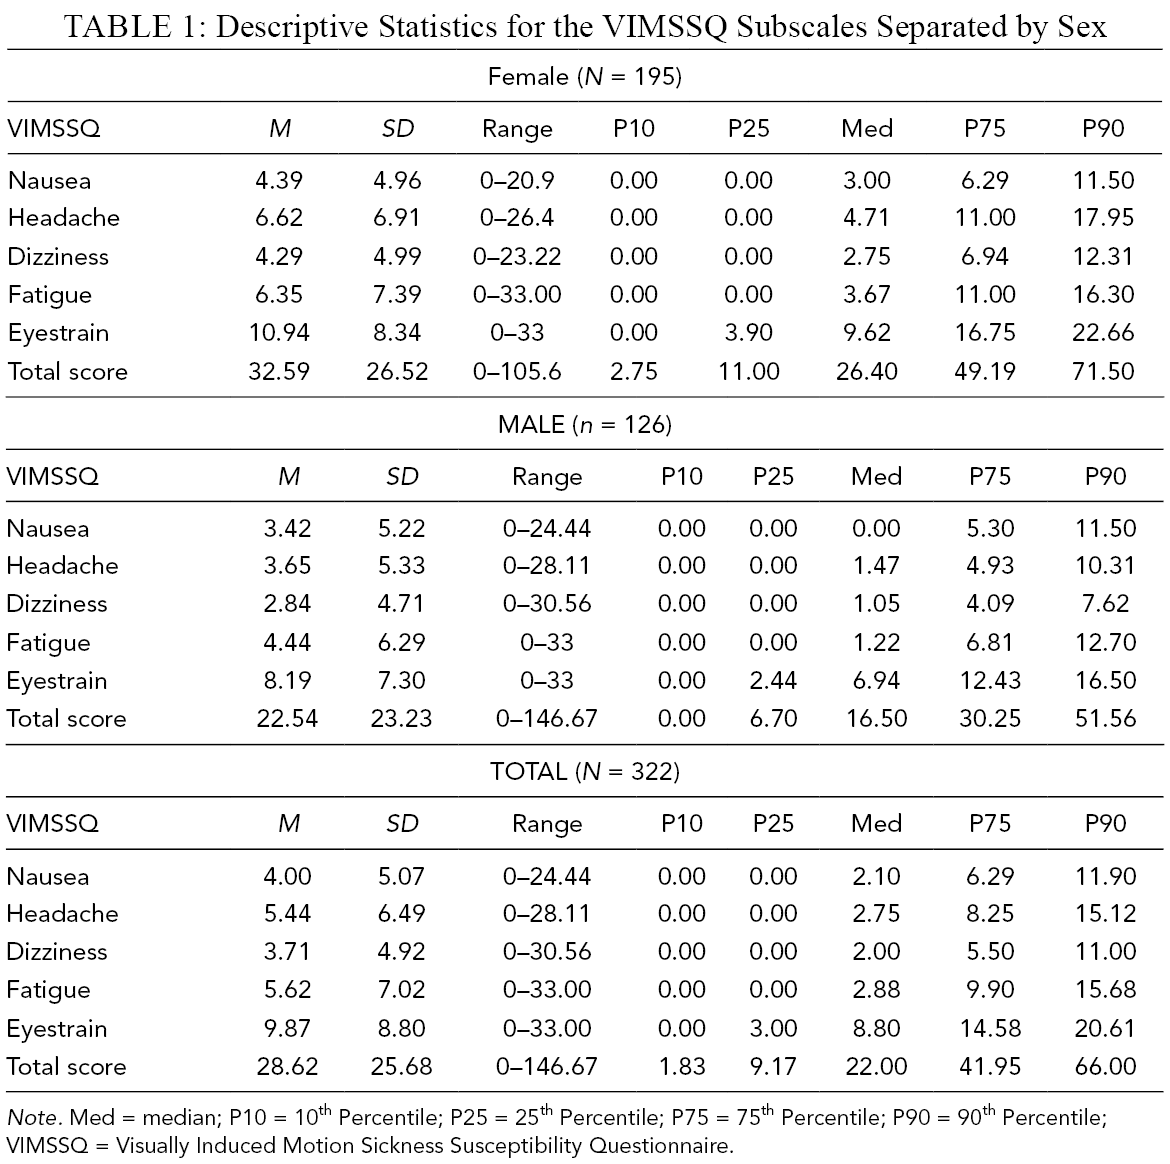
Note. Med = median; P10 = 10th Percentile; P25 = 25th Percentile; P75 = 75th Percentile; P90 = 90th Percentile; VIMSSQ = Visually Induced Motion Sickness Susceptibility Questionnaire.
Overall, 29.5% of all users indicated that the presence of VIMS-related symptoms caused them to stop (or significantly reduce) the use of certain visual devices. The most common devices that users try to avoid include 3D movies (14.3%), smartphones (5.3%), IMAX theaters (4.3%), video games (3.4%), simulators (4.0%), and VR (2.8%).
Scale Reliability and Factor Analysis
An exploratory factor analysis was conducted on the VIMSSQ subscales nausea, dizziness, fatigue, headache, and eyestrain (frequency of use and avoidance items were omitted) to examine the factor structure of the VIMSSQ. Bivariate distributions between each variable did not suggest the presence of nonlinearity. To account for ordinal nature of the items comprising each subscale, Spearman rank-ordered correlations (N = 322) were utilized for the factor analysis and were all significant (Table 2).
Spearman Correlations Between VIMSSQ Subscale Measures
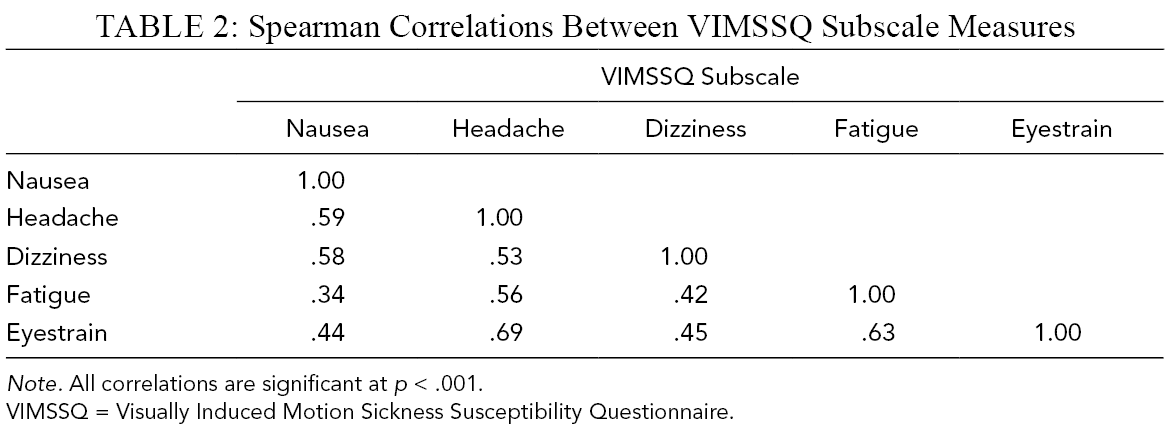
Note. All correlations are significant at p < .001.
VIMSSQ = Visually Induced Motion Sickness Susceptibility Questionnaire.
Due to violations of the multivariate normality assumption as assessed by Mardia’s Test (skewness coefficient = 622.76, p < .001; kurtosis coefficient = 29.57, p < .001), a Weighted Least Squares (WLS) estimation method was chosen (Flora & Curran, 2004). All factor models were estimated using the lavaan Package (Rosseel, 2012) on the statistical software R (version 4.0.2; R Core Team, 2020). Results suggested a one-factor solution for the set of five VIMSSQ subscales (Eigenvalue: 3.27), with a reasonable model fit for the latent factor accounting for 57% of the variance (root-mean-square residuals = .07). All variables had factor loadings of at least .68 and communality values within the range of .46 (VIMSSQ-N) and .77 (VIMSSQ-H). Specifically, it was found that for every 1 SD increase in the latent factor, VIMSSQ-N, VIMSSQ-H, VIMSSQ-D, VIMSSQ-F, and VIMSSQ-ES subscales are predicted to increase by a factor of .68, .88, .71, .73, and .77 of SD units, respectively. A moderate to high MacDonald’s omega of .87 demonstrated good scale reliability of the VIMSSQ.
VIMSSQ and Other Variables
Mean scores for participants’ susceptibility to traditional motion sickness, migraines, and dizziness are shown in Table 3. Independent samples t tests showed that females reported higher scores than males with respect to the MSSQ-adult subscale, t(288) = 5.051, p < .001, d = .57, and the MSSQ-child subscale, t(279) = 2.32, p = .021, d = .27. Nonparametric tests (Wilcoxon) showed that females also reported significantly higher scores than males with regard to migraines, W = 14931.0, p < .001, dizziness, W = 13271.0, p = .032, and syncope, W = 14557.0, p < .001. Correlations were calculated for each of the VIMSSQ subscales, the MSSQ-child and MSSQ-adult, migraine, dizziness, and age. Results are given in Table 4 and indicate that VIMS and MS are significantly correlated with each other. Interestingly, we found significant, negative correlations between age and all VIMSSQ subscales, indicating that VIMS is less severe with increasing age.
Mean (SD) Scores for MSSQ, Migraine, and Dizziness Separated by Sex
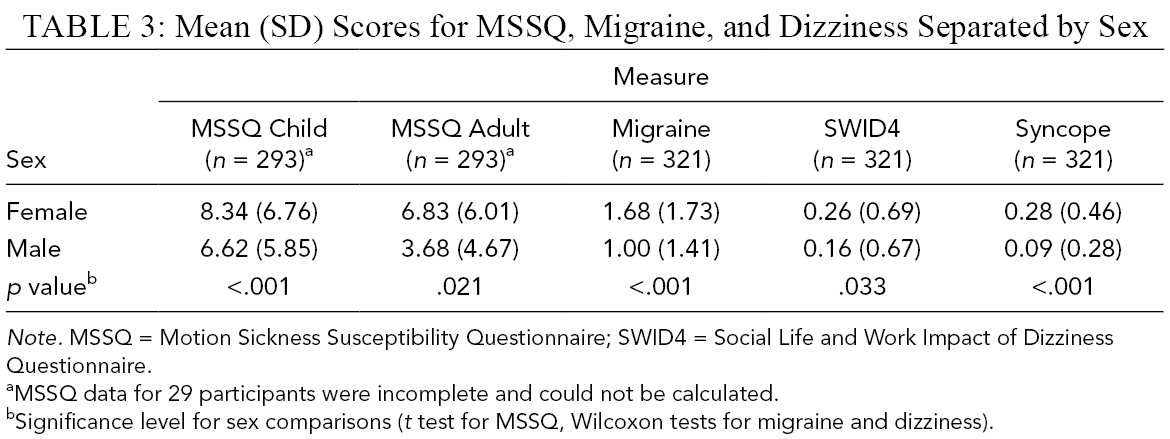
Note. MSSQ = Motion Sickness Susceptibility Questionnaire; SWID4 = Social Life and Work Impact of Dizziness Questionnaire.
aMSSQ data for 29 participants were incomplete and could not be calculated.
bSignificance level for sex comparisons (t test for MSSQ, Wilcoxon tests for migraine and dizziness).
Correlations Between VIMSSQ, MSSQ, Migraine, Dizziness, and Age
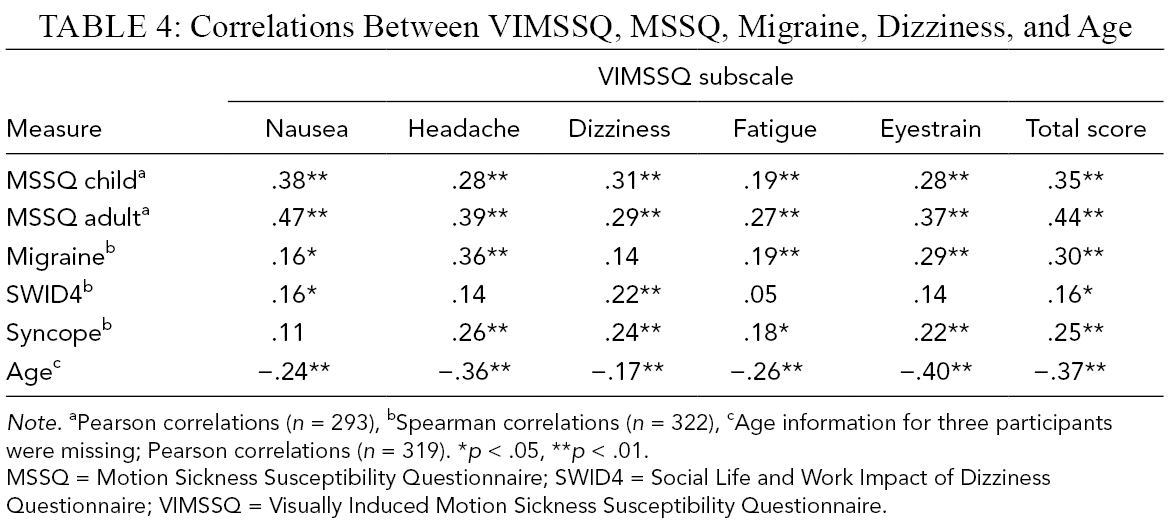
Note. aPearson correlations (n = 293), bSpearman correlations (n = 322), cAge information for three participants were missing; Pearson correlations (n = 319). *p < .05, **p < .01.
MSSQ = Motion Sickness Susceptibility Questionnaire; SWID4 = Social Life and Work Impact of Dizziness Questionnaire; VIMSSQ = Visually Induced Motion Sickness Susceptibility Questionnaire.
Discussion: Survey Study
The results of the online survey delivered insights into the frequency and severity of different VIMS-related symptoms associated with each device. We found that eyestrain is the most common symptom reported by users, whereas nausea and dizziness are experienced less frequently across all visual devices. Oculomotor issues such as eyestrain have been known to be one of the primary symptoms of VIMS, and this family of symptoms is typically more prominent than gastrointestinal disturbances in VIMS compared with traditional motion sickness (Keshavarz, Hecht, Lawson, et al., 2014; Stanney & Kennedy, 1997). Thus, it seems plausible that eyestrain was the most common symptom when using visual devices.
We also found that females reported significantly higher VIMS scores compared with males across all symptoms but nausea. Sex-related differences in VIMS (Flanagan et al., 2005; Klosterhalfen et al., 2006) and traditional motion sickness (Dobie et al., 2001; Stanney et al., 2003) have been documented in previous studies. The reason for these differences are not well known; hormonal aspects have been discussed as a potential cause, as the menstruation cycle has been shown to affect women’s susceptibility to motion sickness (Golding, Kadzere, et al., 2005; Grunfeld & Gresty, 1998; Hemmerich et al., 2019). It has also been speculated that females may be more open and more willing to report VIMS compared with men (Ladwig et al., 2000), but scientific evidence supporting this claim is weak (Dobie et al., 2001). Note, however, that Cohen’s effect sizes indicate that the sex-related differences found for the VIMSSQ subscales are rather weak or moderate at best. Furthermore, we found negative correlations between age and the VIMSSQ subscales, suggesting that users report less VIMS with increasing age. This finding is surprising, as laboratory research showed that older adults typically report more VIMS compared with younger adults (Brooks et al., 2010; Keshavarz et al., 2018). However, our findings could be due to the fact that older adults tend to use fewer visual displays than younger adults and use them less frequently, which could explain the overall lower VIMS scores. It could also be possible that older adults report less VIMS due to habituation as a result of continuous exposure to visual devices. More thorough and systematic studies are needed to better understand the relationship between VIMS and age.
Moderately strong correlations between the VIMSSQ scores and other related concepts such as the susceptibility to traditional motion sickness, dizziness, and migraine were found. These correlations suggest that the susceptibility to VIMS is indeed linked to the susceptibility to traditional motion sickness, but that these two phenomena are also independent from each other to some extent, highlighting the need to develop a tool that can specifically predict an individual’s susceptibility to VIMS.
With regard to the general usage of visual devices, we found that TV, 2D movies, and smartphones are the most frequently used visual devices for dynamic visual content. In contrast, VR glasses were not commonly used and more than 60% of all participants have never used VR glasses before. This finding is somewhat surprising, given that VR devices are becoming more popular in various domains, such as entertainment, research, or teaching, and have become more affordable and accessible to a broader population. However, our findings suggest that VR is yet to become mainstream and is still a novelty to the majority of survey participants. Around 30% of participants indicated that VIMS-related symptoms make them reduce or fully avoid the use of certain visual devices, particularly 3D movies. This demonstrates that VIMS is indeed a severe issue that interrupts almost a third of users and requires them to adjust their behavior. Interestingly, the only sex-related difference with regard to the usage of devices showed for video games, with males playing significantly more video games than females, supporting previous studies that showed similar sex differences for video game usage (Ogletree & Drake, 2007; Terlecki et al., 2011). No other differences between males and females showed with respect to the usage of visual displays.
The scale reliability of the VIMSSQ was high as indicated by MacDonald’s Omega and was similar to previous findings (Golding & Keshavarz, 2017). A one-factorial solution for the VIMSSQ was found to be the best fit, suggesting that all subscales of the VIMSSQ indeed measure the latent construct of VIMS susceptibility. Of note, headache and eyestrain had a stronger influence on overall VIMS susceptibility compared with dizziness, fatigue, and nausea. As a next step, we empirically tested the efficacy of the VIMSSQ questionnaire to predict VIMS provoked in an experimental study. The next section will describe the validation process for the VIMSSQ.
Part 2: Validating the VIMSSQ—Experimental Study
Methods
Participants
Twenty-three healthy younger adults (15 females, Mage = 25.26 years, SDage = 3.89) participated in an experimental study at KITE-Toronto Rehabilitation Institute, UHN. The study complied with the tenets of the Declaration of Helsinki and was approved by the Institutional Review Board at UHN. Participants were naïve with respect to the purpose of the study. Written consent was obtained prior to the beginning of the study, and participants were reimbursed for their time commitment.
Study Design, Stimuli, and Experimental Procedure
The objective of this study was to investigate the influence of multisensory cues on the perception of illusory self-motion, or vection. As vection and VIMS are known to often co-occur (see Keshavarz et al., 2015, for an overview), we saw this study as an appropriate choice to validate the VIMSSQ. Participants were seated in a rotatable chair in the center of a dome-shaped laboratory (KITE’s StreetLab) with five projectors creating a large, curved image with a field-of-view (FOV) of 240° horizontally and 110° vertically surrounding them. Participants were exposed to a revolving stimulus that induced the sensation of self-motion along the yaw axis (circular vection). The stimulus contained visual, auditory, and/or tactile cues (Figure 6): the visual cues consisted of a photorealistic virtual office scene, the auditory cues contained three stationary sound sources (continuous and simultaneous sounds of a fan, telephone, and printer) corresponding to objects visible within the virtual office scene, and the tactile cues were administered through a table-like structure supporting a rotating foam ring encircling participants. All participants were exposed to trials that either included a single sensory input (visual-only, auditory-only, tactile-only), a combination of two (audio-visual, audio-tactile, visual-tactile), and a combination of all three sensory cues (audio-visual-tactile). Additionally, the visible FOV was systematically manipulated by occluding the periphery of the projection screen to 0° (no visual cues), 45° (small FOV), 120° (medium FOV), and 240° (large FOV). Thus, a 4 × 2 × 2 factorial design including the within-subjects factors visual cues (no visual cues, small, medium, and large FOV), auditory cues (present, absent), and tactile cues (present, absent) was chosen, resulting in 16 trials with different sensory cue combinations. Each trial was 45 s long (2.5 s acceleration phase, 40 s constant circular motion, 2.5 s deceleration) and was repeated four times, resulting in a total of 64 trials with a combined duration of approximately 45 min. Participants were asked to focus on a fixation point superimposed at the center of the screen (as seen in Figure 6). Between trials, the screen was blackened and participants were asked to verbally rate vection intensity and duration. Trials were separated into four different blocks (16 trials each, randomized order) with a short rest break between the blocks. The vection results and their relationship to multisensory cues are presented and discussed elsewhere (Murovec et al., 2020).
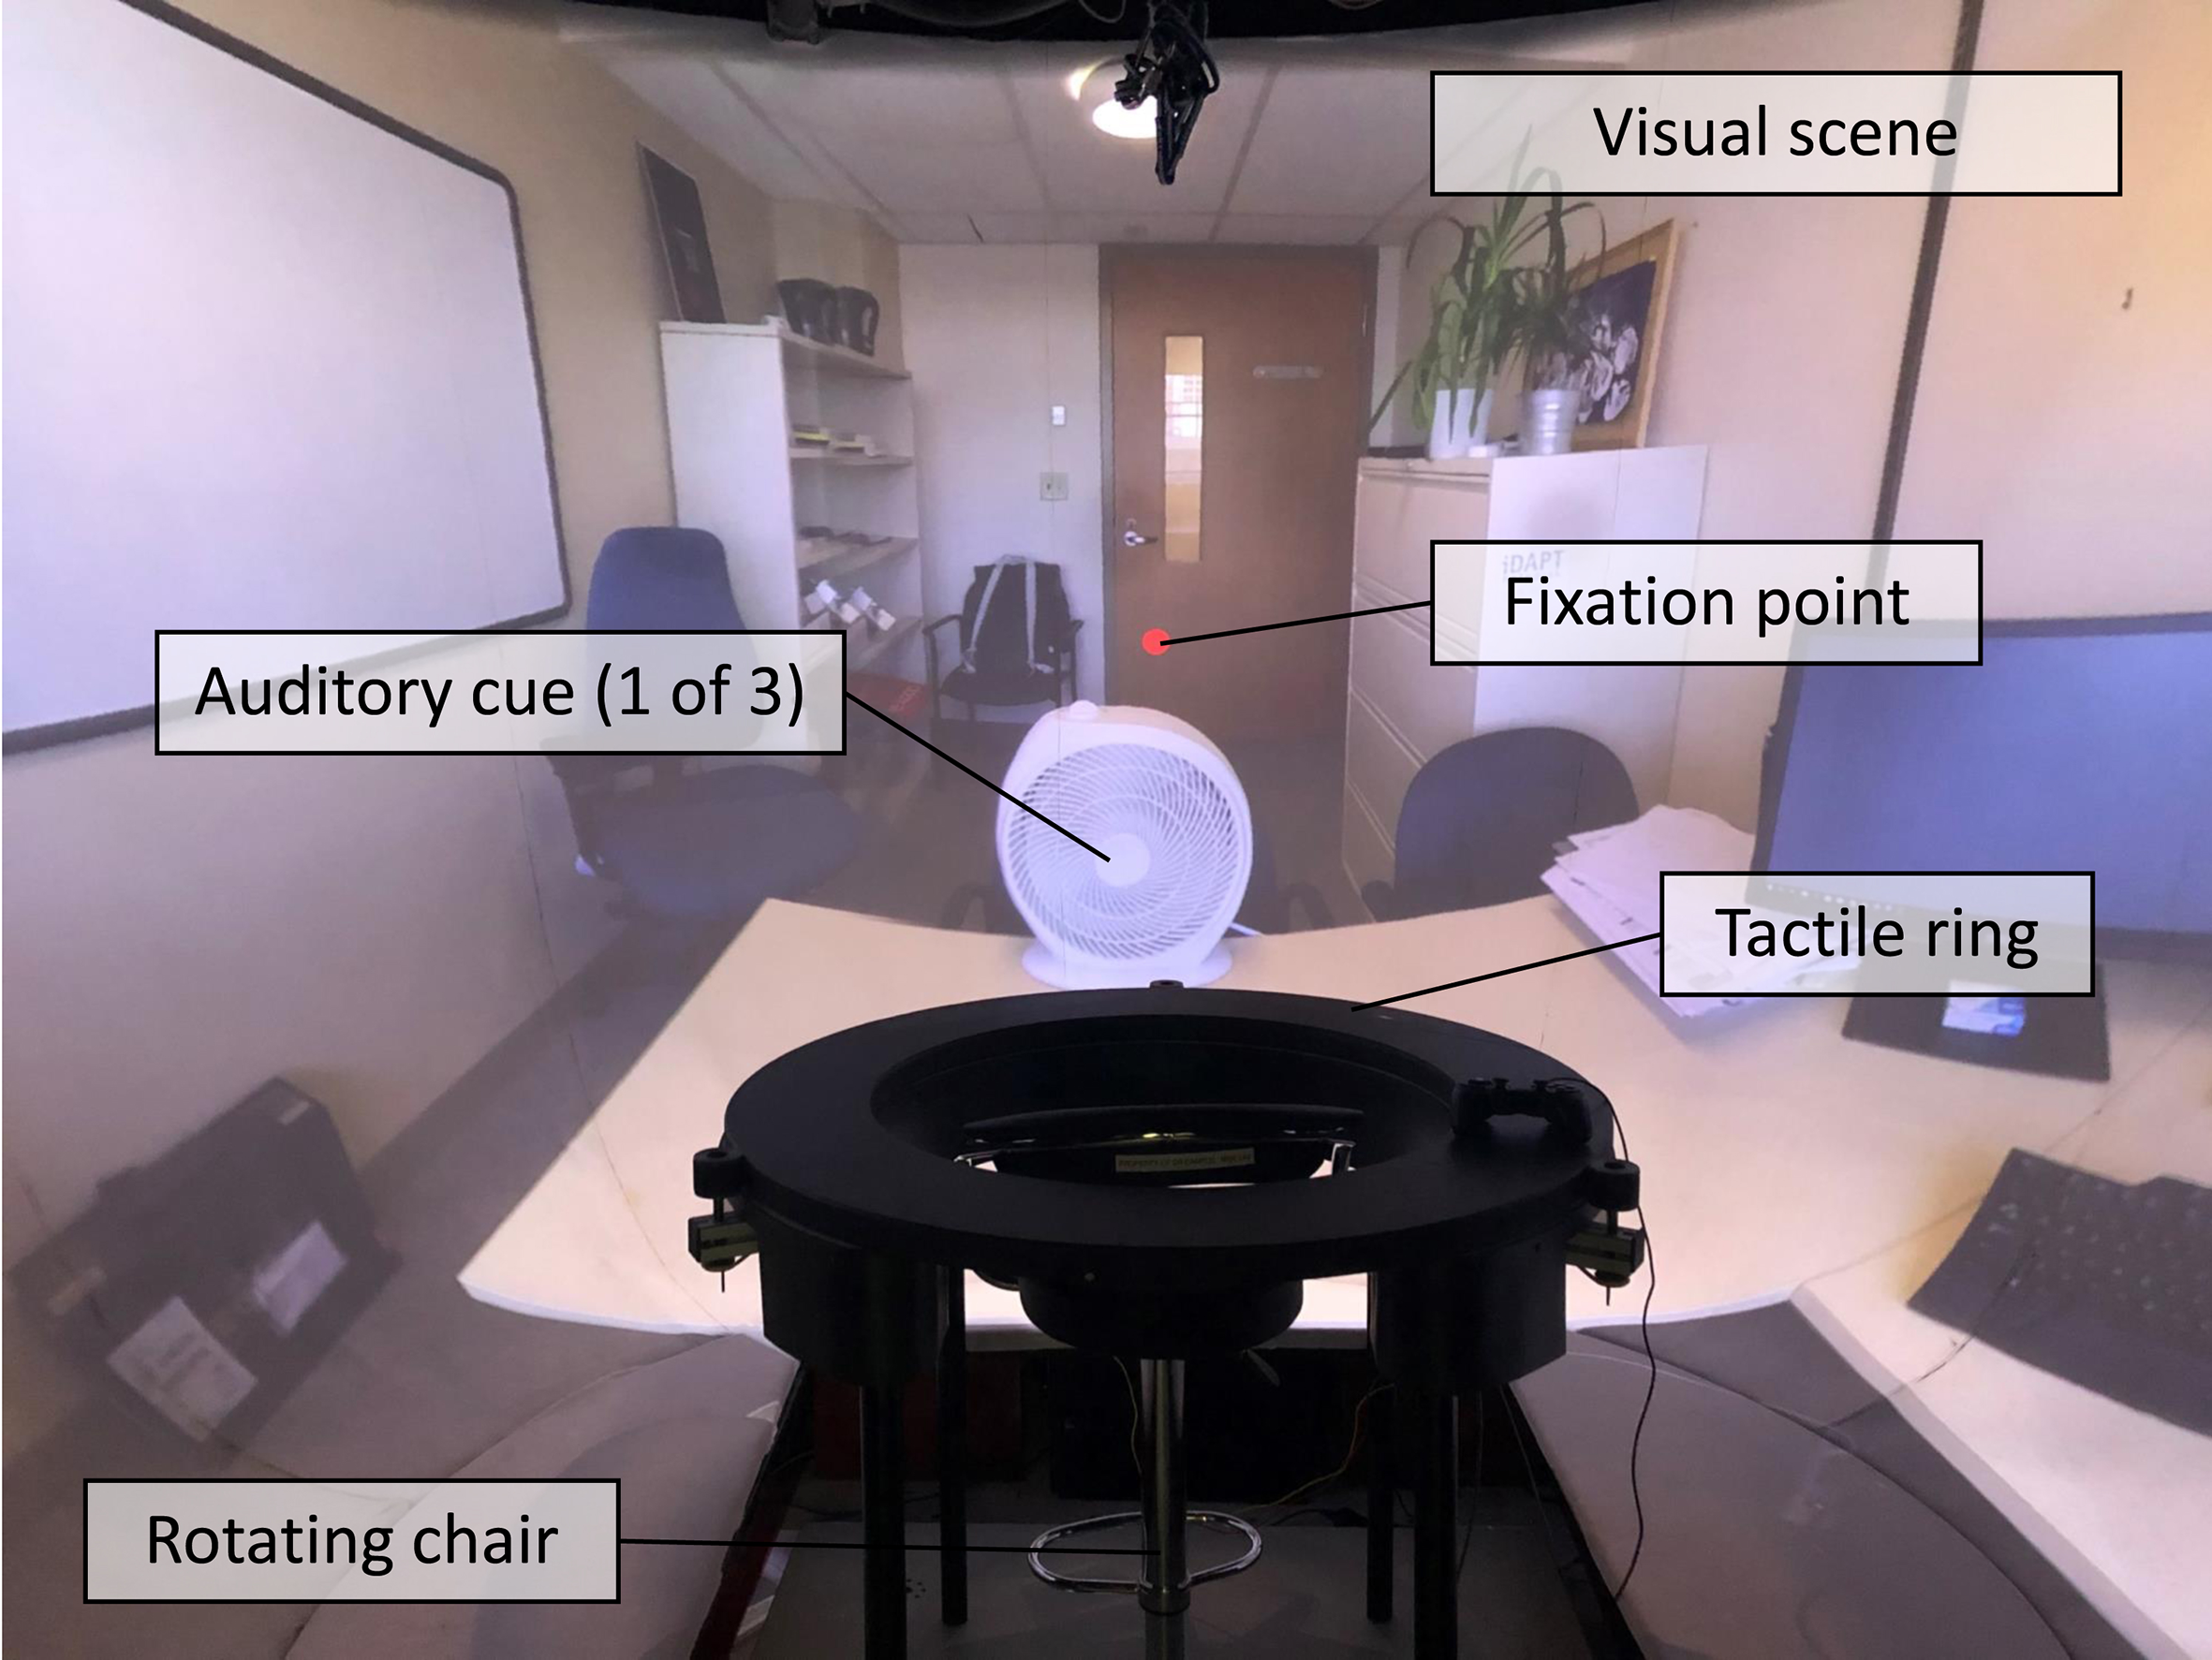
Picture of the experimental setup showing the visual, auditory, and tactile stimuli.
Prior to the experiment, participants filled out the same questionnaires used for the online survey, including the VIMSSQ, the avoidance question, the MSSQ-short, the Migraine Screen Questionnaire, the SWID4, and the single binary item concerning the susceptibility to vasovagal syncope. Note that the response format for the avoidance question was modified to match the VIMSSQ response format (0 = never, 1 = rarely, 1 = sometimes, 3 = often). Following the experiment (i.e., after the last trial), VIMS symptomology was measured using the SSQ (Kennedy et al., 1993). The SSQ contains 16 items associated with VIMS, such as nausea, dizziness, fatigue, or blurred vision, that have to be rated on a scale from 0 (not at all) to 3 (severe). Three subscales (nausea, disorientation, oculomotor) as well as a total score can be generated using specific factor weightings suggested by Kennedy et al. (1993).
Results
All participants reported elevated levels of VIMS after the experiment as measured by the SSQ subscales: nausea (M = 22.81, SD = 19.02), oculomotor (M = 28.34, SD = 19.01), disorientation (M = 36.92, SD = 39.95), and the total score (M = 32.85, SD = 24.37). The results for the VIMSSQ subscales and the total score, the MSSQ-short, the Migraine Screen Questionnaire, and the SWID4 are given in Table 5. With regard to avoidance, 39.1% of the participants reported that they occasionally avoid visual devices due to VIMS (17.4% rarely, 21.7% sometimes), whereas the majority of the participants do not avoid using visual devices (60.9%). Four of the 23 participants (17.4%) experienced syncope in the past.
Mean and SD for All Questionnaire Data
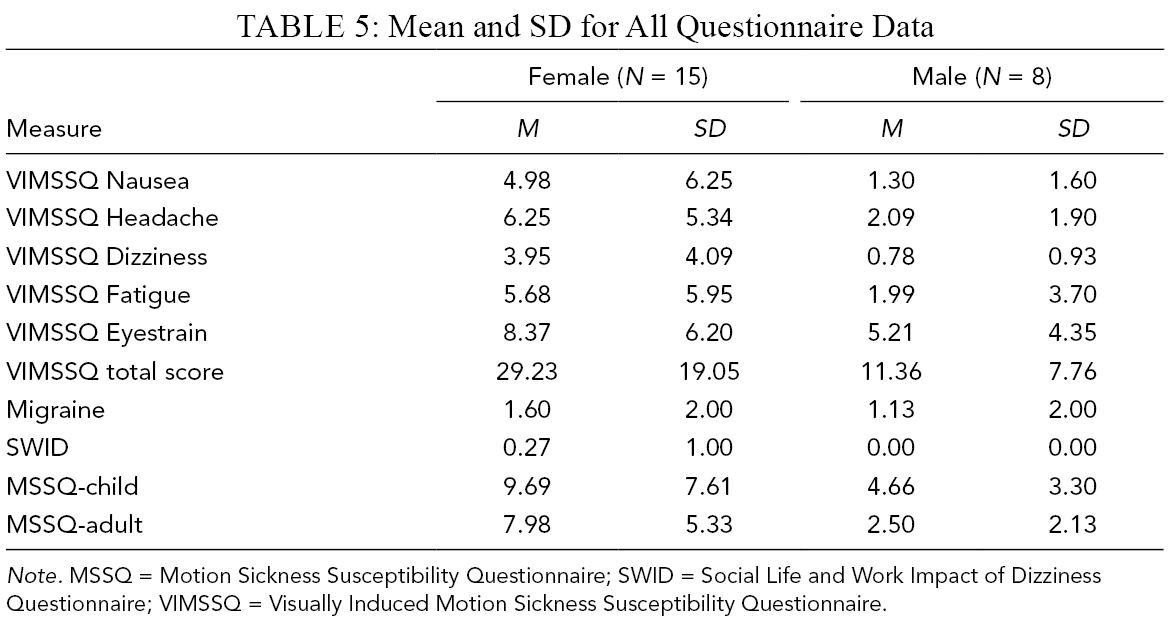
Note. MSSQ = Motion Sickness Susceptibility Questionnaire; SWID = Social Life and Work Impact of Dizziness Questionnaire; VIMSSQ = Visually Induced Motion Sickness Susceptibility Questionnaire.
Linear regression models were calculated to estimate the amount of VIMS variance (measured by the SSQ total score) explained by different predictive variables. That is, the VIMSSQ total score, the MSSQ-short subscales child and adult, the Migraine Screen Questionnaire total score, the SWID4 total score, the avoidance tendency score, and the syncope score were included in the regression model. A stepwise forward approach was chosen. Correlations between the SSQ and the predictive factors are shown in Table 6.
Correlations (Pearson) Between the SSQ Total Score and the Predictor Variables
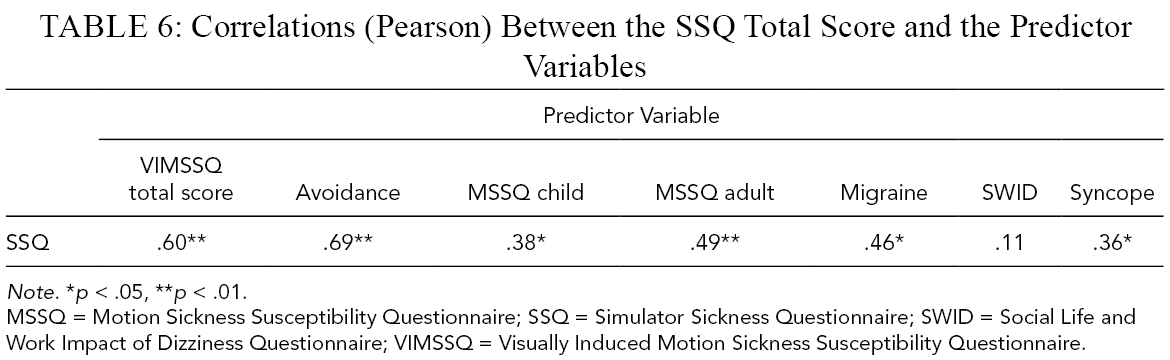
Note. *p < .05, **p < .01.
MSSQ = Motion Sickness Susceptibility Questionnaire; SSQ = Simulator Sickness Questionnaire; SWID = Social Life and Work Impact of Dizziness Questionnaire; VIMSSQ = Visually Induced Motion Sickness Susceptibility Questionnaire.
Prior to the stepwise procedure, an initial baseline regression model was constructed to examine the raw relationship between the VIMSSQ total score and the SSQ total score (Figure 7). This model was found to be significant, F(1, 21) = 11.52, p = .003, accounting for 35.4% (multiple R2) of the variance in VIMS symptomology. Specifically, it was found that the SSQ total score is predicted to increase by .595 SSQ SD units for every 1 SD increase in the VIMSSQ total score. The model that explained the largest amount of variance contained the VIMSSQ total score, avoidance, and syncope as predictors, accounting for 59% (adjusted R2) of the total variance in the SSQ total score. This model was shown to be a significant improvement from the baseline model, F(2, 19) = 7.85, p = .003. The standardized regression coefficients indicated that avoidance had the strongest influence on the SSQ total score, followed by the VIMSSQ total score and syncope, where every 1 SD increase in these variables predicted an increase in the SSQ total score by a factor of .506, .381, and .196 SSQ SD units, respectively. No other variables significantly increased the explained variance further.
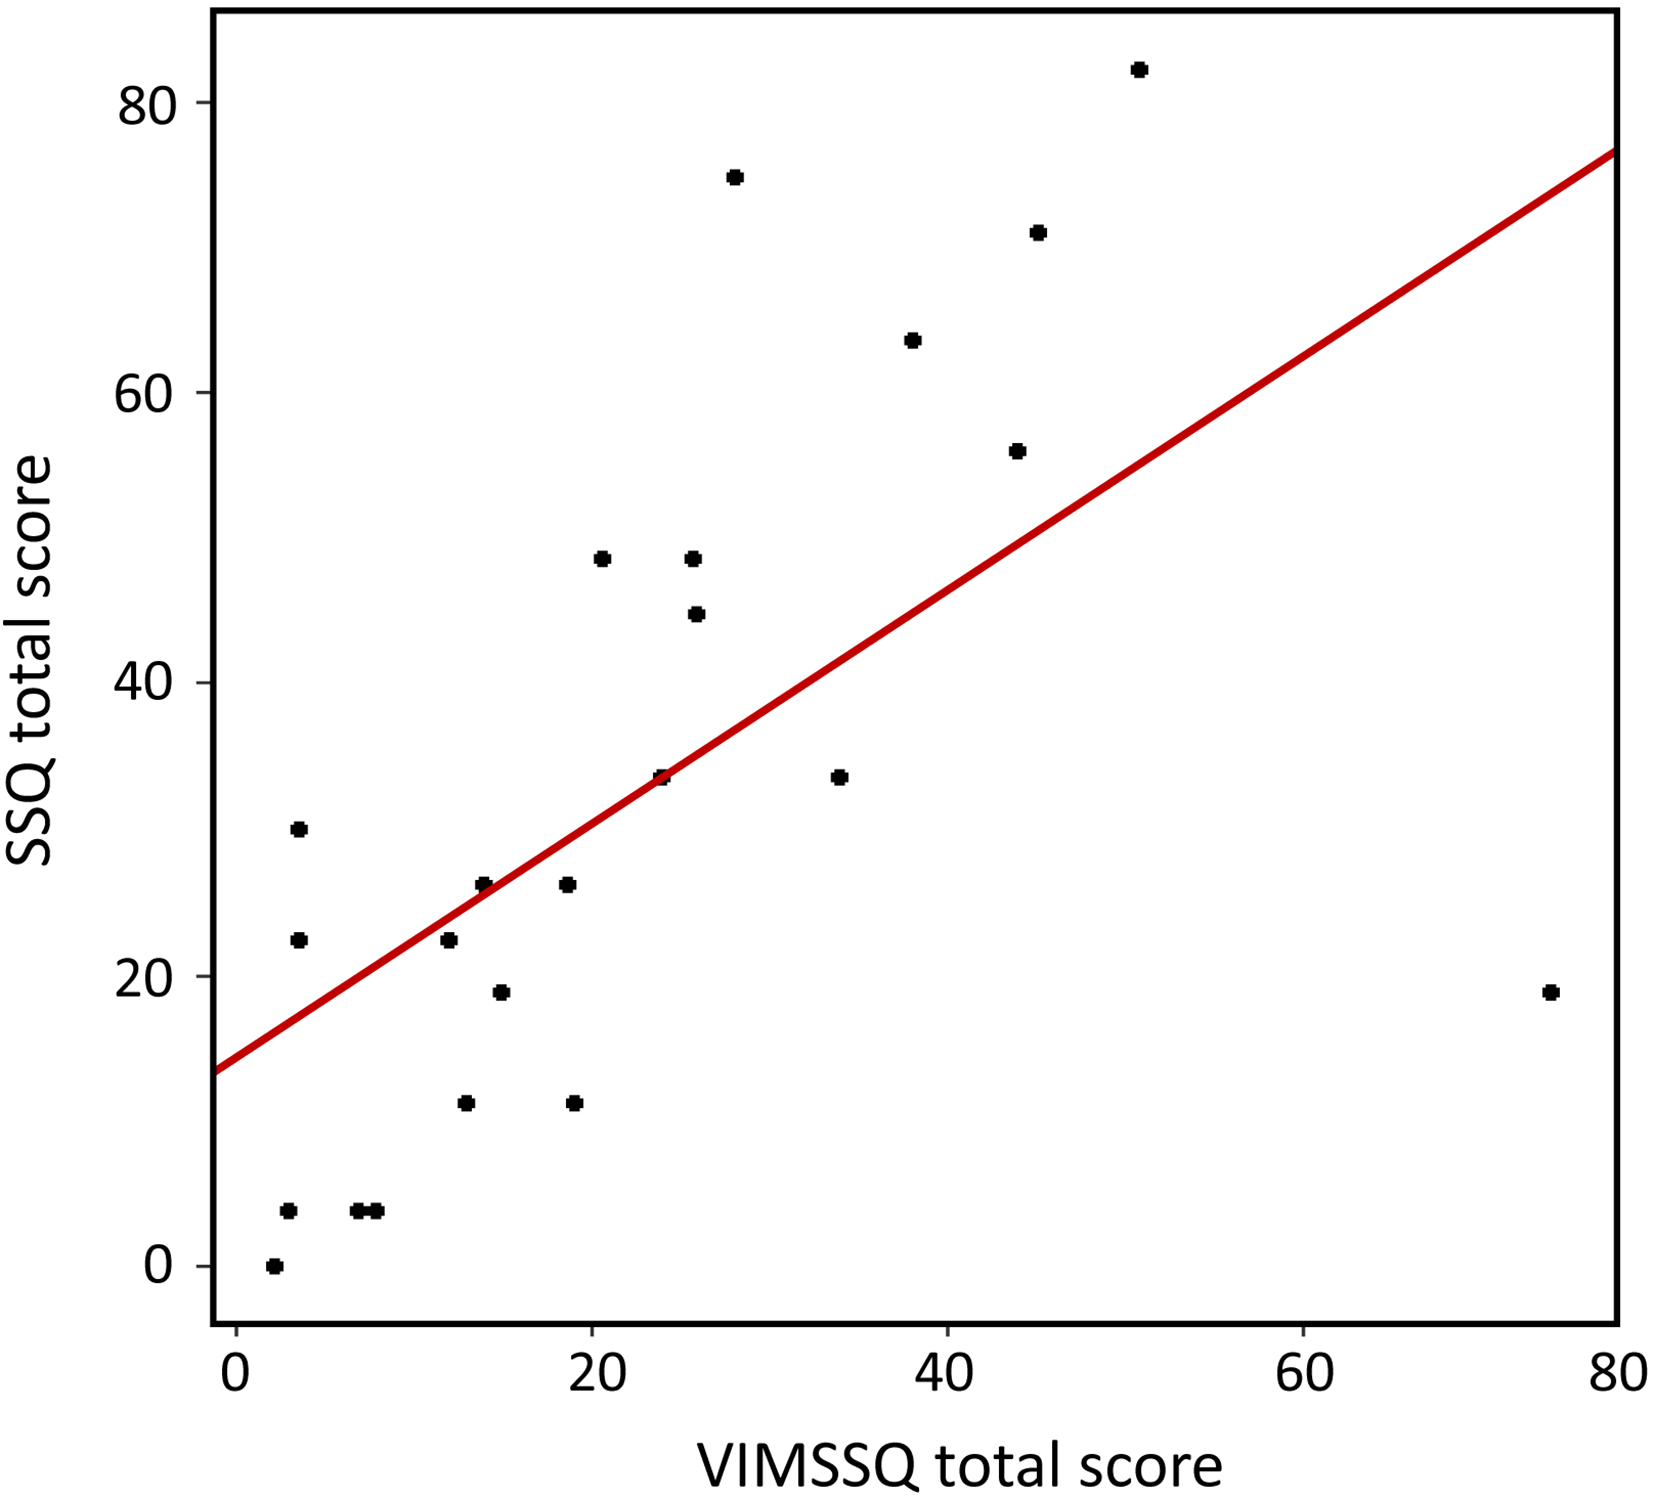
Scatterplot displaying the relationship between the SSQ total score and the VIMSSQ total score (multiple R2 = .354). Note. SSQ = Sickness Susceptibility Questionnaire; VIMSSQ = Visually Induced Motion Sickness Susceptibility Questionnaire.
Discussion: Experimental Study
The results of the experimental study demonstrated that the VIMSSQ is a valuable tool to predict the occurrence of VIMS, particularly when combined with other questionnaires; the VIMSSQ alone explained 34% of VIMS variance as measured by the SSQ total score, and this score increased to 59% when questions about avoidance tendencies and syncope experiences were added. In contrast, adding the MSSQ (child and adult) or questions about migraines and dizziness did not increase the amount of explained variance.
These results are in support of previous findings, suggesting that the VIMSSQ can be useful in predicting the occurrence of VIMS (Golding & Keshavarz, 2017). For instance, a study by Keshavarz, Saryazdi, et al., 2019 measured the level of VIMS in older and younger adults who participated in a simulated driving study. The VIMSSQ was administered before the drive and was compared with the level of reported VIMS as measured via the FMS (Keshavarz & Hecht, 2011). Results showed that the VIMSSQ worked equally well for younger and older adults and that the VIMMSQ subscale nausea alone was able to predict approximately a third of the variance in the FMS data. When other variables were added, the predictive power increased to more than 40% of the variance.
General Discussion and Conclusion
The aim of this work was to introduce the VIMSSQ as a questionnaire that can be assessed prior to a VIMS-inducing stimulus to estimate an individual’s susceptibility to VIMS. Thus, the present paper described the development process of the VIMSSQ, gathered data from a large sample in order to establish first normative data that could be used as a benchmark, and demonstrated in an experimental study that the VIMSSQ can be a useful tool predicting the occurrence of VIMS as measured by the SSQ. Together with our previous work on the VIMSSQ (Golding & Keshavarz, 2017; Keshavarz, Saryazdi, et al., 2019), we are gaining confidence in recommending the use of the VIMSSQ in combination with other scales and questions to detect those users of visual devices who might be at elevated risk of experiencing VIMS. Notably, the VIMSSQ seems superior to other existing questionnaires (e.g., MSSQ) in predicting the occurrence of VIMS.
Despite the promising results, additional investigations, particularly with larger participant samples across various populations and various experimental settings (e.g., different visual displays, different stimuli), are highly desirable to further determine the predictive power of the VIMSSQ. For instance, the scatterplot shown in Figure 5 depicts an “outlier” with a very high VIMSSQ score (above 90th percentile of the norm). Removing this participant from the regression model substantially increased the explained variance of the SSQ to 75%. Thus, studies with larger samples sizes are recommended to establish a more robust model of the VIMSSQ’s predictive power. In addition, future studies should also compare the VIMSSQ with different VIMS measures that are more tailored to certain visual devices. Although the SSQ is the most commonly used questionnaire for assessing VIMS, it was originally designed for the use of simulators. More recent studies questioned the appropriateness of the SSQ for instance in the context of VR, suggesting that modified versions of the SSQ might be more useful (Sevinc & Berkman, 2020). Thus, we recommend further investigate the predictive power of the VIMSSQ for alternative measures of VIMS.
One of the main disadvantages of the VIMSSQ is that it is quite lengthy and can be somewhat overwhelming for participants. Thus, a short version of the VIMSSQ was recently proposed and tested (Golding et al., 2021). The short version of the VIMSSQ has a similar structure to the VIMSSQ (i.e., same five symptoms), but does not differentiate between the different visual devices. Instead, users are asked to rate the occurrence of nausea, headache, dizziness, fatigue, and eyestrain for all visual displays together (ranging from 0 = never to 3 = often), resulting in a total of five symptom items. The avoidance question from the VIMSSQ was retained, making the short version of the VIMSSQ a six-item long questionnaire. In the experimental study by Golding et al. (2021), 30 participants were exposed to a nauseating visual stimulus and filled out the short version of the VIMSSQ together with the same set of questionnaires described in the present study (e.g., migraine, SWID4, syncope, MSSQ). Similar to the present findings, the VIMSSQ-short explained approximately 34% of the total variance of VIMS as measured by the VIMSSQ, and this number increased to 56% when other questionnaires were added. This is first proof that a short version of the VIMSSQ might be similarly effective to the long version of the VIMSSQ. However, a direct comparison between the VIMSSQ long and short version is needed in the future and should be conducted with a larger sample size.
Key Points
Visually induced motion sickness (VIMS) is a common issue when using visual devices.
Most common symptoms include eyestrain, fatigue, headache, dizziness, and nausea.
Two studies were conducted to develop and validate the Visually Induced Motion Sickness Susceptibility Questionnaire (VIMSSQ)
The VIMSSQ can be a valuable tool to estimate individual susceptibility to VIMS.
Supplemental Material
Online supplementary file 1 - Supplemental material for The Visually Induced Motion Sickness Susceptibility Questionnaire (VIMSSQ): Estimating Individual Susceptibility to Motion Sickness-Like Symptoms When Using Visual Devices
Supplemental material, online supplementary file 1, for The Visually Induced Motion Sickness Susceptibility Questionnaire (VIMSSQ): Estimating Individual Susceptibility to Motion Sickness-Like Symptoms When Using Visual Devices by Behrang Keshavarz, Brandy Murovec, Niroshica Mohanathas and John F. Golding in Human Factors: The Journal of Human Factors and Ergonomics Society
Footnotes
Acknowledgments
BK is supported by a Discovery Grant from the Natural Sciences and Engineering Council (NSERC) of Canada RGPIN-2017-04387. We like to thank Dr. David Flora for his comments regarding the statistical analysis and Robert Shewaga for technical support.
Supplemental Material
The online supplemental material is available with the manuscript on the HF website.
Author Biographies
Behrang Keshavarz is a Scientist at KITE-Toronto Rehabilitation Institute, University Health Network, and an assistant professor (adjunct) at the Department of Psychology at Ryerson University, Toronto, Canada. He received his PhD in general and experimental psychology from the Johannes Gutenberg University Mainz, Germany, in 2012.
Brandy Murovec is a PhD student at KITE-Toronto Rehabilitation Institute, University Health Network, and the Department of Psychology at Ryerson University, Toronto, Canada. She received her MA in psychology from Ryerson University, Canada, in 2020.
Niroshica Mohanathas is a PhD student at KITE-Toronto Rehabilitation Institute, University Health Network, and the Department of Psychology at the University of Toronto, Toronto, Canada. She received her MA in psychology from the University of Toronto, Canada, in 2020.
John F. Golding is a Professor for Applied Psychology at the University of Westminster in London, UK. He received his PhD in experimental psychology from Oxford University, UK, in 1980.
References
Supplementary Material
Please find the following supplemental material available below.
For Open Access articles published under a Creative Commons License, all supplemental material carries the same license as the article it is associated with.
For non-Open Access articles published, all supplemental material carries a non-exclusive license, and permission requests for re-use of supplemental material or any part of supplemental material shall be sent directly to the copyright owner as specified in the copyright notice associated with the article.