
Abstract
Objective:
This study presents anthropometric data for individuals with high body mass index (BMI). Modified anthropometric dimensions were also developed to address the challenges of obtaining accurate and repeatable data for this population segment.
Background:
The prevalence of obesity affects approximately 40% of the U.S. adult population. Anthropometric data are needed to guide product design and safety, but few individuals with high BMI have been measured in available datasets.
Method:
Anthropometric data for a convenience sample of 288 adults with high BMI (≥30 kg/m2) were collected. To increase participation and minimize participant discomfort, measurements were collected at three bariatric weight loss clinics and one academic research institution.
Results:
The current obese cohort are heavier than the U.S. general population, with a difference in mean body weight of 47 kg for women and 56 kg for men. The obese cohort are also heavier and have a higher BMI compared with the NIOSH (National Institute for Occupational Safety and Health) truck driver population. Waist circumferential measures of the current obese cohort were larger than women or men in either population compared, a result indicative of meaningful body shape differences.
Conclusion:
To our knowledge, this study is the first to collect anthropometric data for the obese population segment and conduct comparisons to the U.S. general population and available occupational databases. The obese cohort differed substantially with respect to the distributions of anthropometric variables.
Application:
These data provide insights about the obese population segment that are relevant to product design, and establish a foundation for future data collection efforts.
Introduction
Over the past few decades, the proportion of adults with obesity has increased markedly in the United States and around the world. Body mass index (BMI), the most widely used metric to describe an individual’s weight relative to height, is calculated as the body weight in kg divided by the square of the stature in meters. Obesity is defined as a BMI greater than or equal to 30 kg/m2 and severe or extreme obesity as a BMI greater than or equal to 40 kg/m2 (Centers for Disease Control and Prevention [CDC], 1998). In the United States, the prevalence of adulthood obesity rose to 35.7% in 2009–2010, from 22.9% in 1988–1994 (Flegal, Carroll, Kit, & Ogden, 2012). After some indication of a plateau in the last decade (Flegal, Kruszon-Moran, Carroll, Fryar, & Ogden, 2016; Ogden, Carroll, Kit, & Flegal, 2014), a recent study found continued increases in obesity prevalence to 40% for BMI ≥30 kg/m2 and 8% for BMI ≥40 kg/m2 (Hales, Fryar, Carroll, Freedman, & Ogden, 2018). The prevalence of obesity has also increased worldwide, affecting 18% of adults (World Health Organization [WHO], 2018). The prevalence of clinically severe (BMI ≥ 40 kg/m2) or morbid obesity (BMI ≥ 50 kg/m2) also continues to increase. Since 2000, the growth rate of the U.S. population with a BMI ≥40 kg/m2 and BMI ≥50 kg/m2 has doubled and tripled, respectively, the growth rate of moderate obesity (BMI between 30 and 40 kg/m2; Sturm, 2007; Sturm & Hattori, 2013).
The increasing prevalence of individuals with high BMI has created challenges in many areas of product design, particularly in accommodating the size of users and assuring safety. Many products and environments fail to properly serve individuals with high BMI, largely due to dimensional mismatches. For example, medical devices or equipment, furniture, vehicle selection, or mobility devices may also be limited by the space and design available for a morbidly obese individual. Increased patient size can complicate even the most basic medical interventions, as can the lack of proper equipment to lift and move the patient (Kumpar, 2014), and hospital beds that fail to accommodate patients often result in negative outcomes such as pressure injuries or increased length of stay (Wiggermann, Smith, & Kumpar, 2017). Increased numbers of obese occupants also raise challenges for the occupant protection in motor vehicle crashes. Field data analyses have shown that obese occupants have higher risks of fatalities and injuries in frontal crashes than normal-weight individuals (Carter, Flannagan, Reed, Cunningham, & Rupp, 2014; Cormier, 2008; Viano, Parenteau, & Edwards, 2008). Obese occupants are at an increased risk of injury due to anatomical and physiological variations that alter fit of the restraint system and clearance to airbags (Hu et al., 2013; Jones, Ebert, Hu, & Reed, 2017; Jones, Ebert, & Reed, 2017; Turkovich, Hu, van Roosmalen, & Brienza, 2013).
One contributor to the increasing disaccommodation of individuals with high BMI is a lack of anthropometric data for this population segment. Individuals with a BMI ≥40 kg/m2 are rarely included in anthropometric datasets because they are infrequently present in the samples from which detailed anthropometric data are gathered. The 2010–2012 Anthropometric Survey of U.S. Army personnel (ANSUR-2) is arguably the most comprehensive anthropometric dataset available with over 90 body dimensions measured on 11,961 individuals (Gordon et al., 2014). Among volunteers included in this survey, 9.5% of women and 27.1% of men measured had a BMI ≥30 kg/m2. However, this database includes only military personnel, a population segment that has an age distribution different from the general population and is further restricted by physical capability requirements. The National Health and Nutrition Examination Survey (NHANES) is an ongoing survey conducted by the CDC that produces results weighted to represent the U.S. population as a whole (Fryar, Gu, Ogden, & Flegal, 2016). This survey provides the best available data on the population prevalence of obesity in the United States, but records only a few anthropometric variables beyond stature and body weight; hence, NHANES data alone are insufficient for most design applications. The National Institute for Occupational Safety and Health (NIOSH) conducted an anthropometric survey of nearly 2,000 U.S. truck drivers who were measured for a number of useful design dimensions. This sample was heavier than the overall U.S. population, given that 67.8% of women and 63.4% of men sampled had a BMI ≥30 kg/m2 (Guan et al., 2012). However, the sampling strategy and size restricts the generalizability of these data, as only 10% of the participant sample were female and all were from the same occupational category. Moreover, only summary statistics from this survey have been released to the public.
The current study was conducted to address the need for anthropometric data from individuals with high BMI. Modified anthropometric dimensions were also developed to address the challenges of obtaining accurate and repeatable data for this population segment.
Method
Individuals with high BMI are difficult to recruit because of mobility and fatigue challenges they experience. To increase participation and to minimize participant discomfort and inconvenience, anthropometric measurements were collected at three bariatric weight loss clinics and one academic research institution. The approach to participant recruitment and sampling strategy differed between the clinical and research sites. Across all of the data collection sites, the eligibility criteria for participation were BMI greater than or equal to 30 kg/m2 for both women and men and the ability to sit, stand, and lay supine for the time required to conduct anthropometric measures. Collection occurred from October 2015 to September 2017, and data from all sites were combined for analysis.
Participant Recruitment and Facilities
Bariatric Weight Loss Centers
A convenience sample of two hundred thirty-six participants (182 women and 54 men) from bariatric weight loss clinics at three geographical locations (Birmingham, AL; Seymour, IN; and Austin, TX) was used in this study. Research protocols were approved by each clinic’s associated Institutional Review Board (IRB). All patients pursuing or interested in medical or surgical weight loss at these clinics were eligible for the study. During their visits, participants were recruited in person by health care providers. If patients indicated interest, written informed consent was obtained using a form approved by the IRB and the anthropometric measurement protocol was initiated. The data collection was conducted in medical exam rooms within the bariatric clinics.
Laboratory Study (University of Michigan [U-M])
Fifty-two volunteers (26 women and 26 men) participated in a laboratory study that was part of a larger research effort to quantify 3D anthropometry of adults with high BMI (Jones, Ebert, Horn, & Reed, 2016). Participants were recruited based on gender, BMI, and stature. BMI stratifications were based on CDC classifications of obesity: Class I (BMI of 30 to < 35 kg/m2), Class II (BMI of 35 to < 40 kg/m2), and Class III (BMI of 40 kg/m2 or higher; CDC, 1998). Stature was sampled to span the range from less than 5th percentile for U.S. women (<1,511 mm) to greater than 95th percentile for U.S. men (>1,869 mm; Fryar et al., 2016).
The study protocol was approved by the U-M IRB for Health Behavior and Health Sciences (IRB #HUM00102426). Participants were recruited through online postings and through health care providers at the U-M Adult Bariatric Surgery program. If patients indicated interest, the surgeons provided patients detailed information about the study and patients were asked to contact the research team. Physicians did not track or have record of patients’ participation in the study. The data collection was conducted in a laboratory space at the U-M.
Anthropometric Instruments
Bariatric Weight Loss Centers
Weight and stature were measured using the equipment that was standard at each bariatric weight loss facility. Otherwise, common measurement equipment was used across the three clinical testing sites. Haglof calipers (Haglöf Sweden AB, Långsele, Västernorrland, Sweden) were used for breadth measurements. A second set of Haglöf calipers was machined and fabricated into a stand for measuring abdominal extension depth (supine posture) and omphalion height (standing posture). Accuracy of the modified calipers was verified with error <1 mm. For the comfort of participants, flexible vinyl tape measures were used for circumference measurements. The lengths of these tape measures were verified every 500 mm with error <1 mm. A Lufkin Executive steel tape was used for verification (Apex Tool Group, Sparks, Maryland, USA).
Laboratory Study (U-M)
A Medweigh MS-4600 high-capacity platform scale was used for weight measurement. GPM anthropometers (Stuttgart, Germany) were used for height and breadth measurements. A second set of 610 mm–long branches was fabricated for use with the GPM system for measurements where standard branches were insufficient. Similar to the clinical sites, a flexible vinyl tape measure was used for circumference measurements. The lengths of these tape measures were verified every 500 mm with error <2 mm. A GPM beam was used for verification.
Procedure
Bariatric Weight Loss Centers
The measurement protocol required approximately 10 min of measurement time for each patient. Participants wore their own clothes during the data collection protocol conducted at the clinical sites. Upon arrival, each participant was briefed on the purposes and methods of the study and written consent was obtained. Across the testing sites, participants were measured either with or without shoes. For seated and supine measurements, participants sat or laid on the medical exam tables. Supine measurements were taken at the preferred head section angle of the participant that was identified by placing the head section at 30 degrees and incrementally lowering the angle until the participant identified the angle that was preferred for sleeping. Each clinical site had one or two health care practitioners that served as measurers throughout the duration of the study.
Laboratory Study (U-M)
All measurements were taken during a single session that was part of a larger data collection protocol. Upon arrival, each participant was briefed on the purposes and methods of the study and written consent was obtained. Participants changed into close-fitting garments provided by the experimenters to facilitate palpation of skeletal landmark locations and measurement of anthropometric measures. All measurements were obtained minimally clad. Stature was measured with and without footwear to characterize shoe heel height. For seated measurements, participants sat unsupported on a wooden anthropometry table. Supine anthropometric dimensions were recorded while participants laid supine on a hard-acrylic scan table. Preferred head section angle was the only supine measure recorded at an inclined angle. Photos were taken to document the measurements. A single research staff member took anthropometric measurements for all study participants.
Anthropometric Dimensions
Individuals with high BMI often have difficulty standing for long periods and may experience fatigue. Bariatric medicine specialists from the clinical sites advised that the data collection protocol not exceed 10 min for each participant. Consequently, anthropometric dimensions were prioritized, favoring those needed for the design of furniture and clothing design, as well as characterization of general body shape.
Standard Dimensions
Sixteen standard anthropometric dimensions including stature, body weight, and linear breadths, depths, heights, and circumferences were gathered from participants to characterize the overall body size and shape. Measurement definitions were identical to those in Hotzman et al. (2011) except as described below.
Modified Dimensions
Subsets of the anthropometric measures were obtained at multiple measurement sites to provide preliminary data on points of maximal breadth, depth, or girth. The intention of these maximal measures was to capture body shape variability, for example, the location and contour of the panniculus during standing, supine, and seated postures.
New or modified dimensions were also introduced to better quantify the range and postural effects of obesity. For example, knee-to-knee breadth, sitting, is typically measured with the knees pressed together. This is an uncomfortable position for individuals with large thighs. In this case, additions included measuring participants with a natural leg splay or stance breadth in supine and standing postures respectively. This modification again accommodated participants with larger thighs or balance impairments. Standard and modified anthropometric dimensions are listed in Table 1 and described in the appendix.
Anthropometric Dimensions Coded as Standard or Modified and by the Number of Data Collection Sites Each Dimension Was Gathered
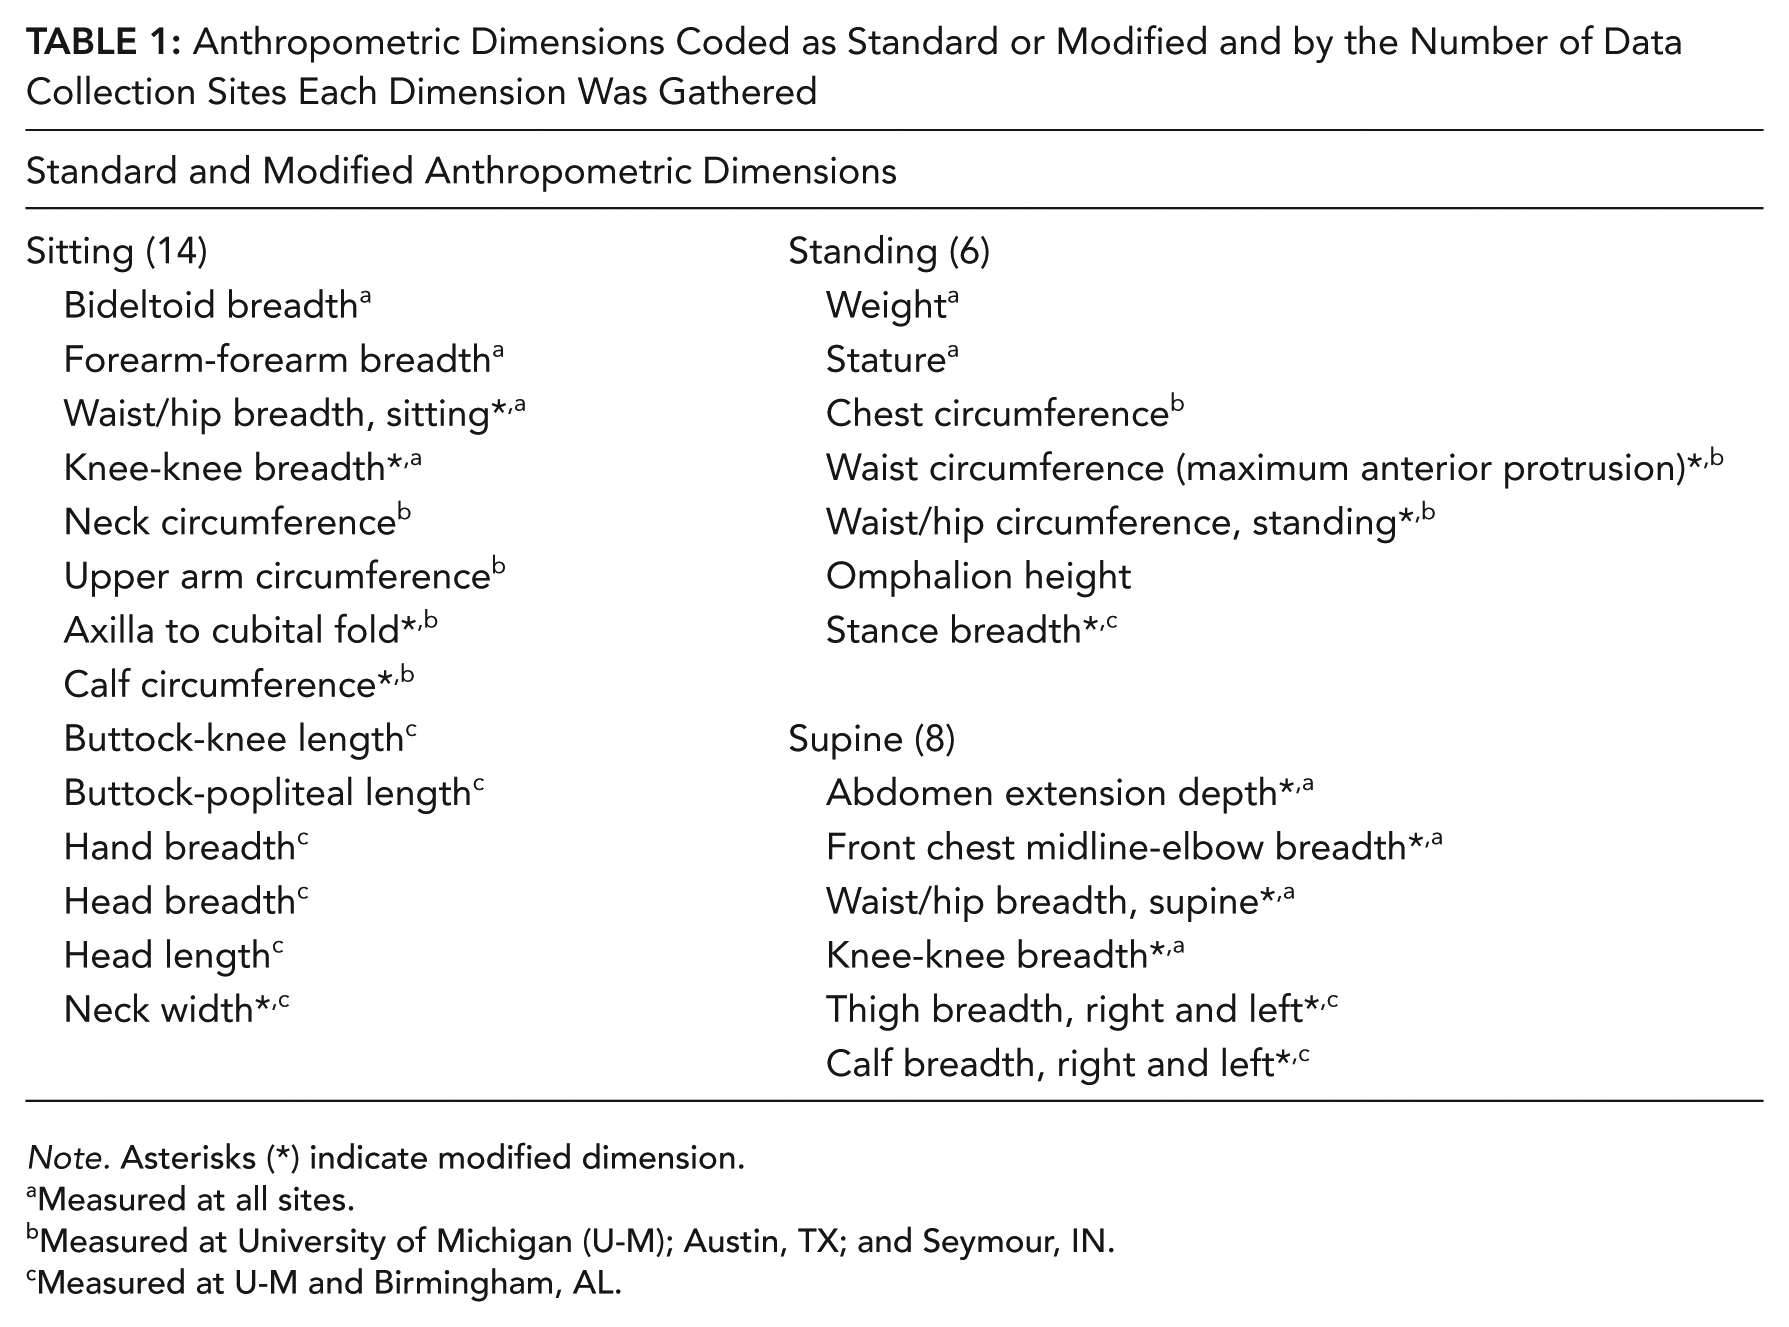
Note. Asterisks (*) indicate modified dimension.
Measured at all sites.
Measured at University of Michigan (U-M); Austin, TX; and Seymour, IN.
Measured at U-M and Birmingham, AL.
All measurers were trained together in a practice session administered by an experienced anthropometrist. In the training session, five participant volunteers with obesity were measured repeatedly to achieve accuracy and consistency across measurers.
Study Design
A total of 30 dimensions were measured, but not all dimensions were measured at all of the four data collection locations. To limit the burden on health care practitioners and patients at the clinical sites, a split-plot design was employed. Ten measurements were gathered from every participant to maximize the size of the sample for analysis. The remaining 20 dimensions were stratified across the clinical sites. All anthropometric dimensions were obtained from the laboratory study participants.
Data Analysis
To address the inconsistency of patients who were measured either with or without shoes at the bariatric weight loss centers, the mean difference in stature with and without shoes obtained in the laboratory study (27 mm) was subtracted from standing height measurements of the patients in the clinic that were measured wearing shoes.
The distributions of selected anthropometric dimensions by gender were contrasted with corresponding percentiles from 2011 to 2014 NHANES (Fryar et al., 2016) and the NIOSH truck driver study (Guan et al., 2012). Cumulative distribution plots were also used to illustrate the probabilities of anthropometric dimension percentiles for BMI and waist circumference.
The mean, minimum, maximum, median, standard deviation, and percentiles were calculated for each measurement. Shapiro–Wilk goodness of fit tests were conducted to identify dimensional distributions that were non-normal. These tests were carried out at the 5% significance level.
Results
In all, 208 women and 80 men, adults with high BMI (BMI ≥ 30 kg/m2), were measured (total N = 288). Participants were categorized using the CDC (1998) classifications of obesity: 28 Class I (BMI of 30 to <35 kg/m2), 47 Class II (BMI of 35 to <40 kg/m2), 126 Class III (BMI of 40 to <50 kg/m2), and 87 were Class III (BMI ≥ 50 kg/m2). Age range of the participants was 20 to 79 years with a mean of 46 years, and 47 of the participants were 60 years or older. Participant self-reported race and ethnicity were as follows: 62% White, 18% Black, 2% Hispanic, and 18% did not report either race or ethnicity.
Comparison of Obese Cohort (Current Study), U.S. General Population (NHANES), and NIOSH Truck Drivers
Figure 1 shows the cumulative distributions of BMI for women and men in the current obese cohort, the U.S. general population, and the NIOSH truck driver study. For women, the median BMI was 28, 33, and 45 kg/m2 for the U.S. general population, female NIOSH truck drivers, and current obese cohort, respectively. For men, the corresponding median BMI was 28, 32, and 46 kg/m2. The cumulative distribution plot illustrates that a woman with a BMI of 40 kg/m2 is approximately 28th percentile in the current obese cohort, 92nd percentile in the U.S. general population, and 77th percentile in the NIOSH truck driver data. Similarly, a man with a BMI of 40 kg/m2 is approximately 30th percentile in the current obese cohort, 96th percentile in the U.S. general population, and 88th percentile in the NIOSH truck driver data.
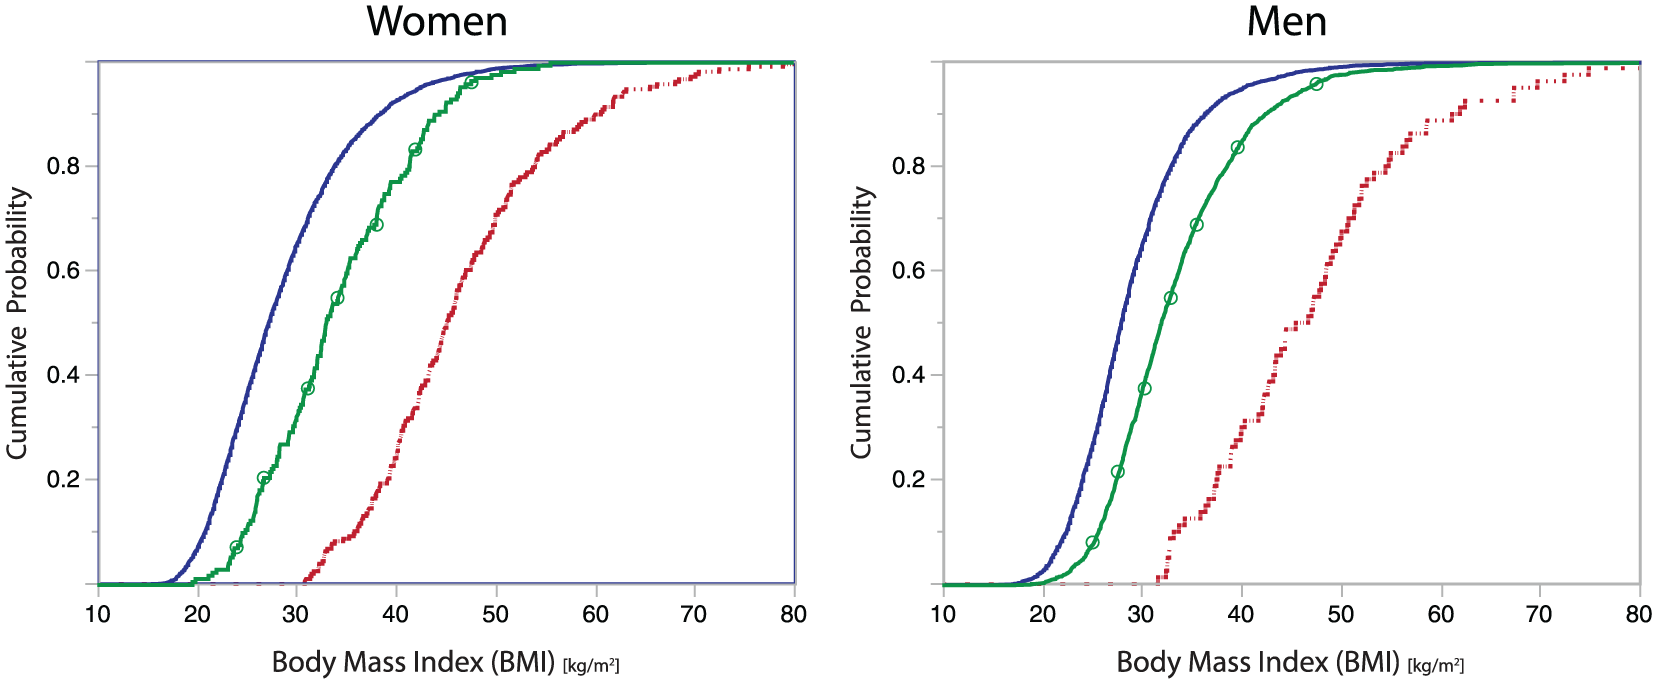
Cumulative distributions of BMI for women and men in NHANES 2011–2012 (blue, solid), NIOSH truck driver sample (green, circle overlay), and current obese cohort (red, dashed). NHANES = National Health and Nutrition Examination Survey; NIOSH = National Institute of Occupational Safety and Health.
Figure 2 show the cumulative distributions of waist circumference across the three populations. The cumulative distribution plot illustrates that the 95th percentile of the waist circumference dimension was 1,277 mm, 1,250 mm, and 1,567 mm for women sampled in U.S. general population, NIOSH truck driver, and the current obese cohort, respectively. For men, the corresponding 95th percentile of the waist circumference was 1,294 mm, 1,374 mm, and 1,711 mm sampled in U.S. general population, NIOSH truck driver, and the current obese cohort, respectively.
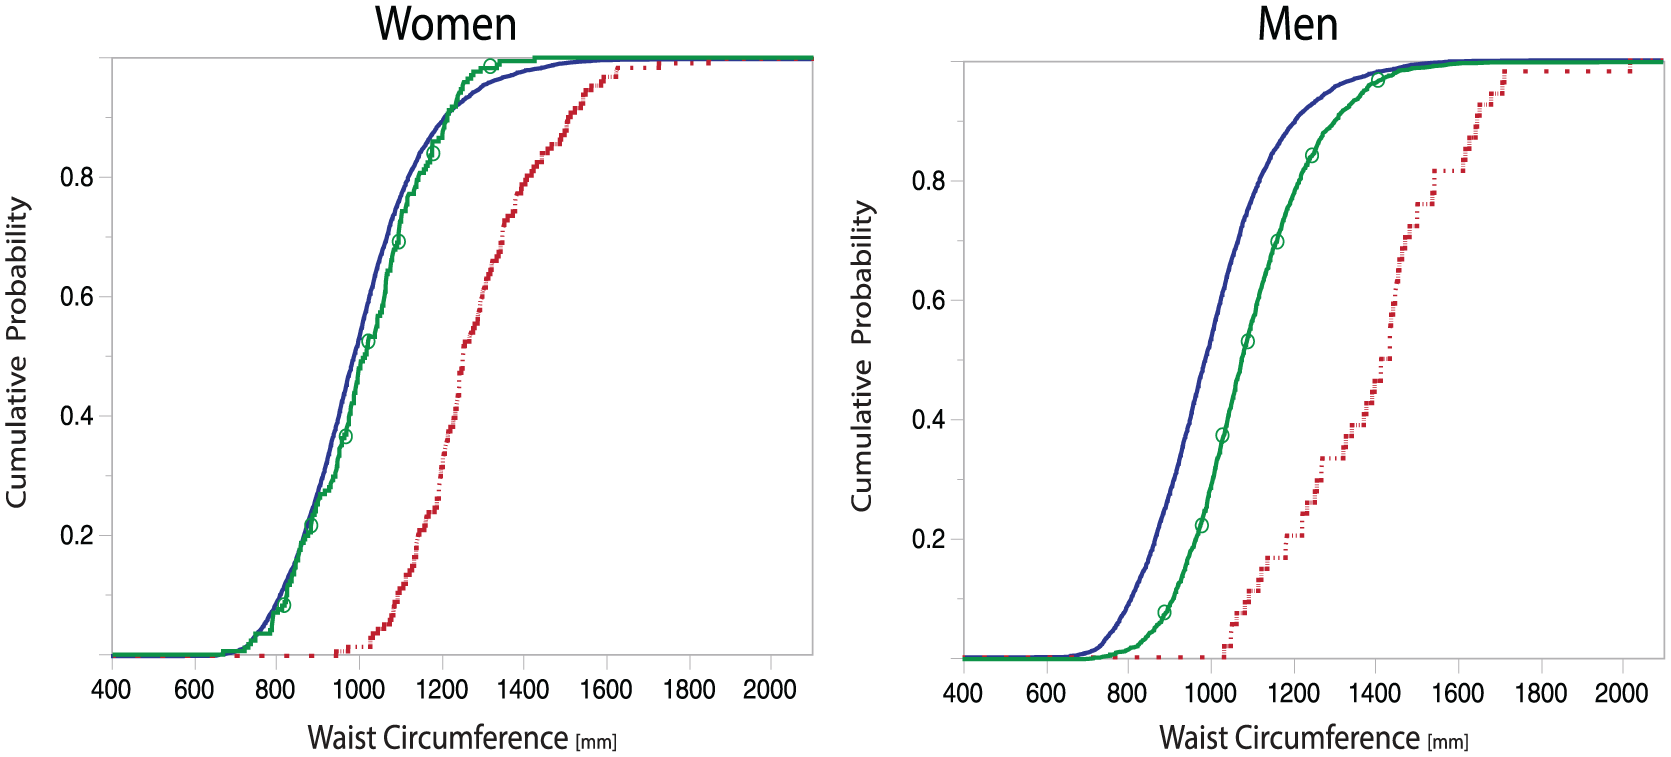
Cumulative distributions of stature and waist circumference for women and men in NHANES 2011–2014 (blue, solid), NIOSH truck driver (green, circle overlay), and current obese cohort (red, dashed). NHANES = National Health and Nutrition Examination Survey; NIOSH = National Institute of Occupational Safety and Health.
Table 2 details comparisons of four anthropometric measures (BMI, weight, stature, and waist circumference) between the obese cohort from the current study and the U.S. general population (NHANES) and the NIOSH truck driver populations (Fryar et al., 2016; Guan et al., 2012).
Comparison of Primary Anthropometric Measures for Current Obese Cohort, U.S. General Population (NHANES 2011–2012), and NIOSH Truck Driver Sample
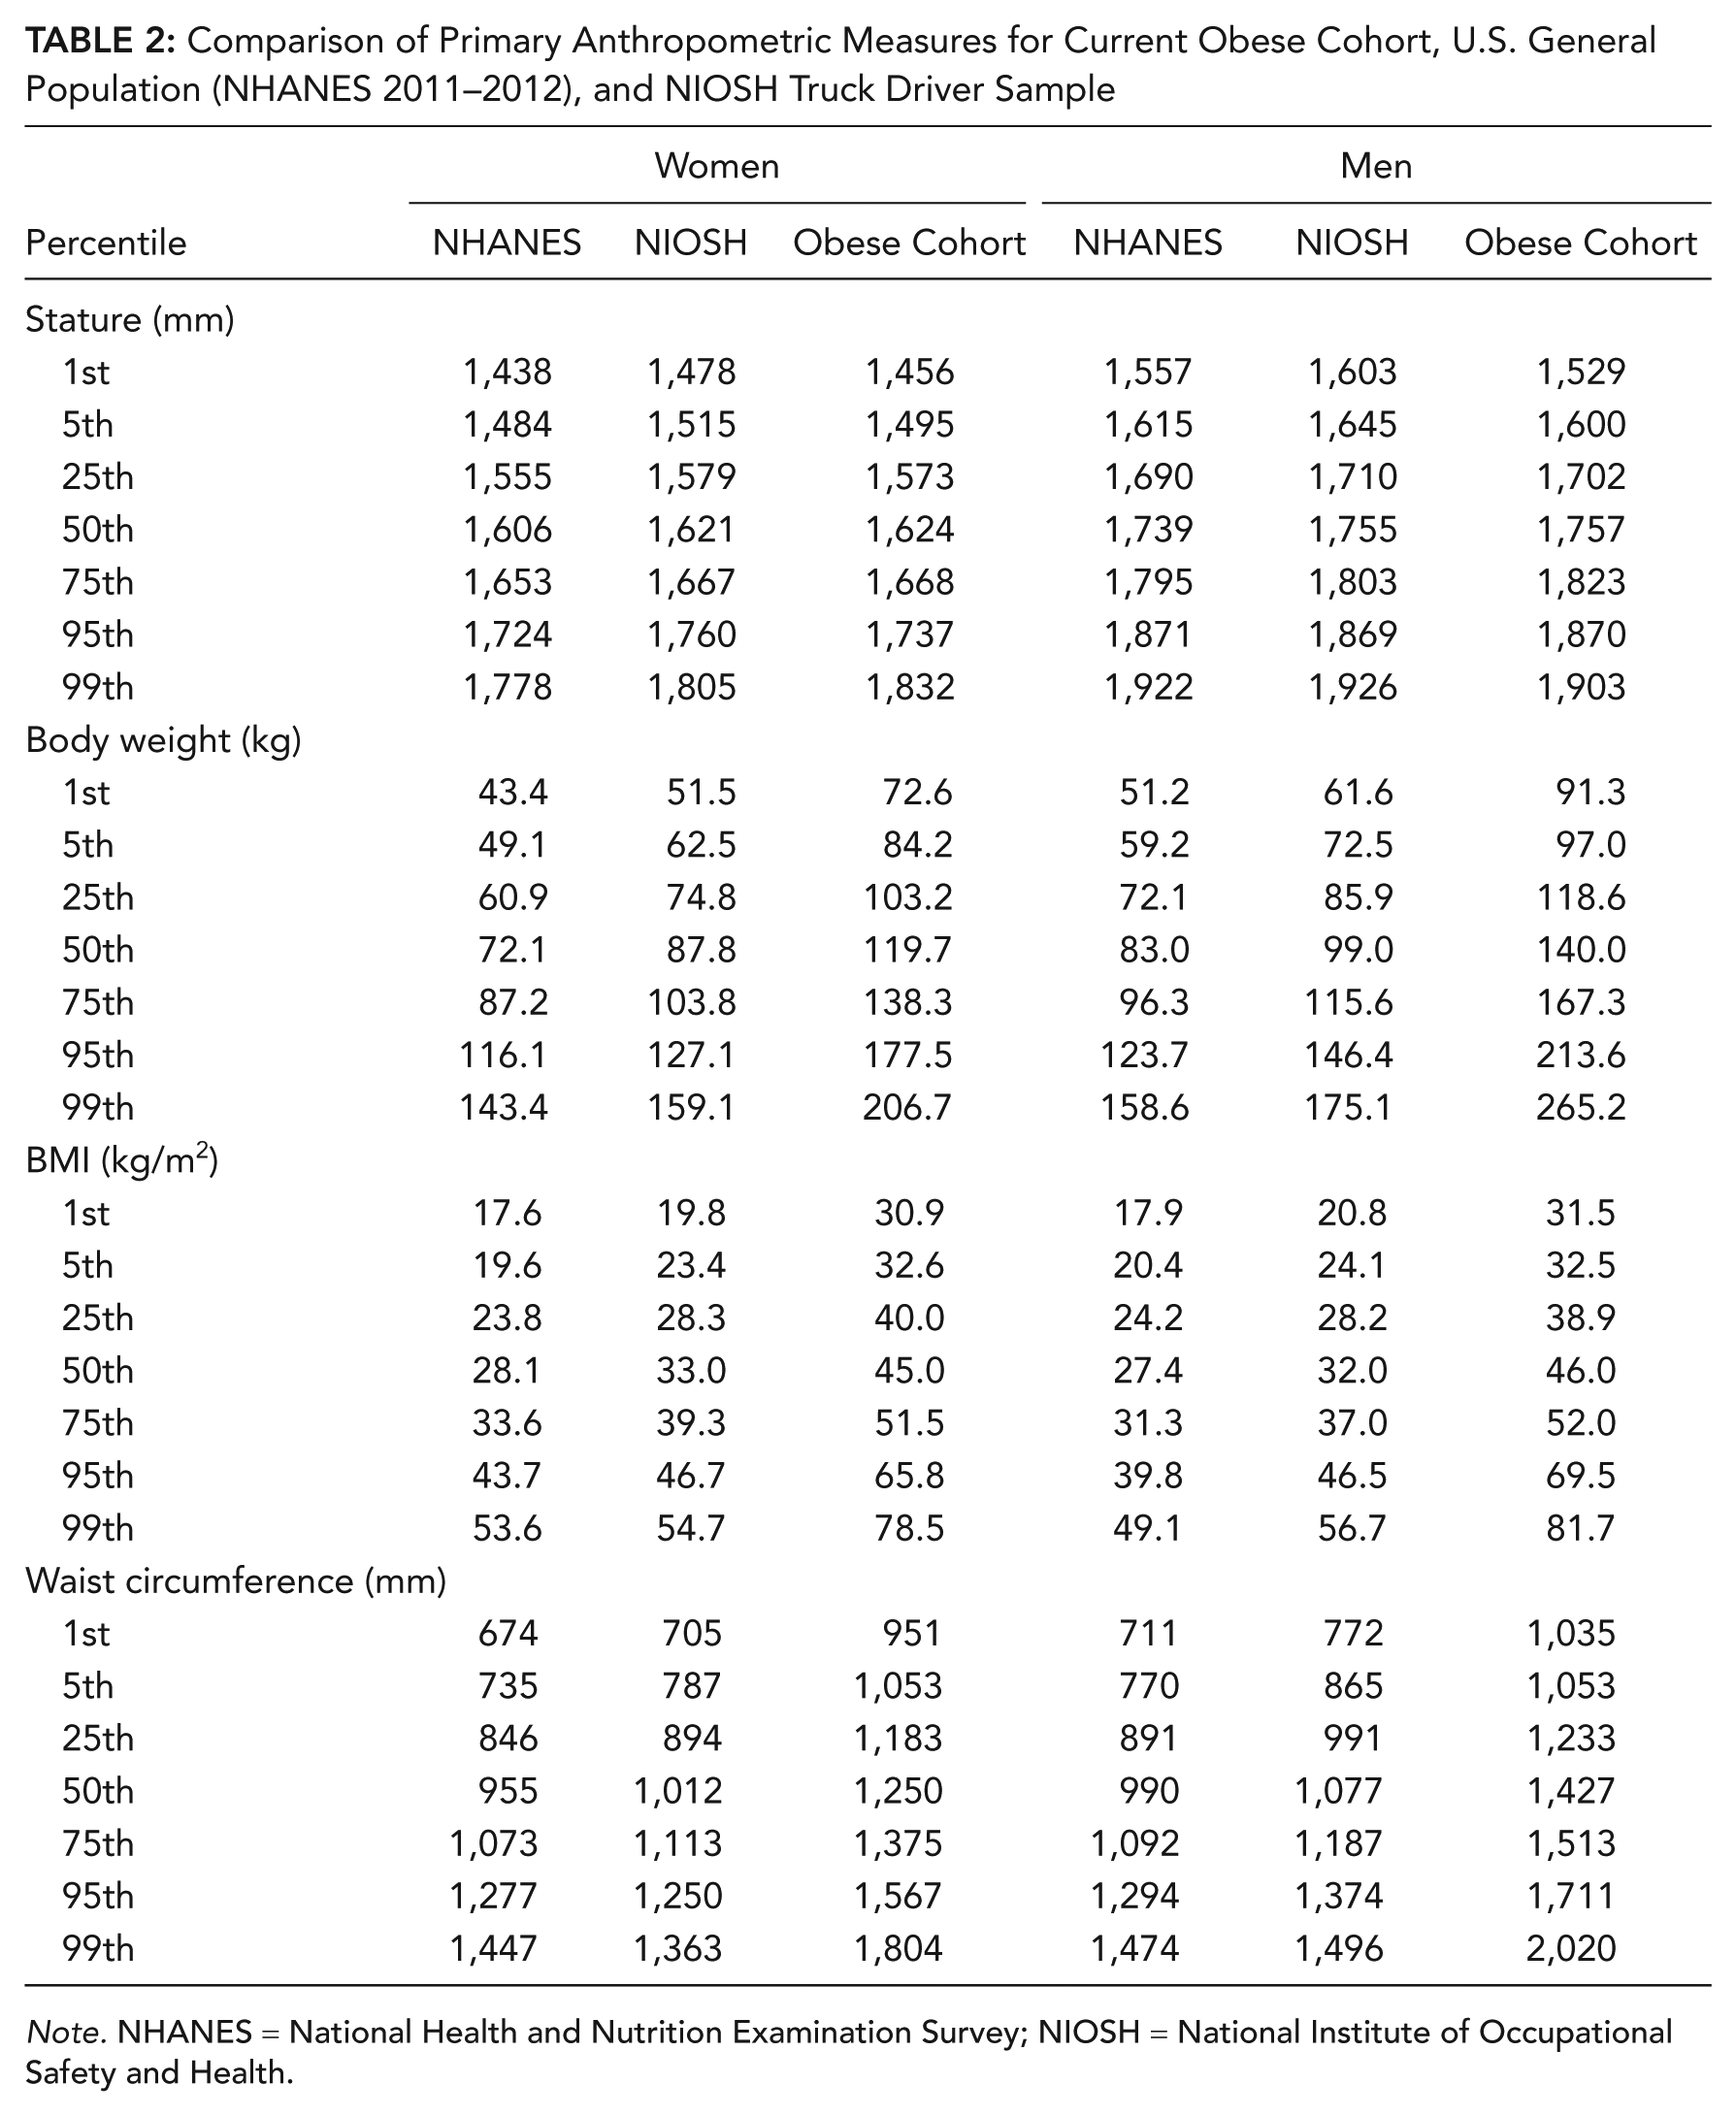
Note. NHANES = National Health and Nutrition Examination Survey; NIOSH = National Institute of Occupational Safety and Health.
For women, differences in BMI, weight, and waist circumference measures were statistically significant across the datasets. On average, the women from the current obese cohort were 47 kg heavier and had a BMI of 17 kg/m2 higher than women in the U.S. general population. Women in the current obese cohort were, on average, 33 kg heavier and had a BMI of 13 kg/m2 greater than the female NIOSH truck drivers. Notwithstanding differences in definitions of waist circumferential measures, the current obese cohort were significantly larger than women in either population compared.
Men from the current obese cohort were significantly heavier and had a higher BMI than those men in the U.S. general population (56 kg and 18 kg/m2) and the NIOSH truck driver sample (42 kg heavier and 14 kg/m2), respectively. Waist circumferences of the current obese cohort were also significantly larger than those of men in the U.S. general population and the NIOSH truck driver study.
Stature was not significantly different between the current obese cohort and U.S general population and the current obese cohort and the NIOSH truck driver sample, with one exception. The obese women from the current study were on average 6 mm taller than women in the U.S. general population, and were heavier, as expected.
Summary Statistics of the Current Obese Cohort for the Measured Dimensions
Summaries of anthropometric data are typically presented in terms of mean, standard deviation, and percentiles. Data from some anthropometric dimensions in large-scale anthropometric surveys often are approximately normally distributed as a result of the sampling strategy and a large sample size. However, most dimensions for this convenience sample recruited based on BMI are not normally distributed. Figures 3 and 4 illustrate the size distribution of the participants. Shapiro–Wilk goodness of fit tests were conducted to identify dimensional distributions that were non-normal (α level = .05).
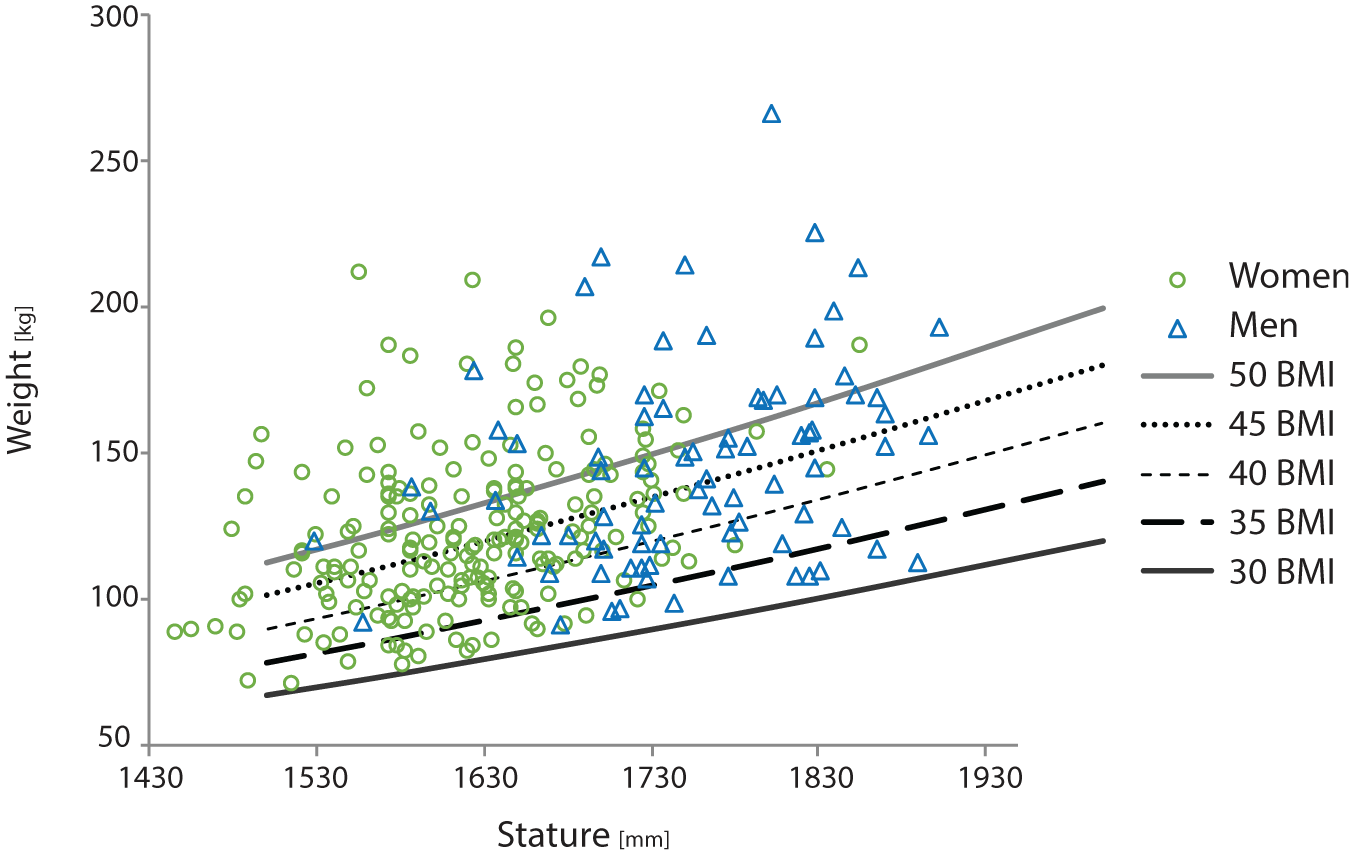
Weight versus stature for women (green, circle) and men (blue, triangle). BMI = body mass index.
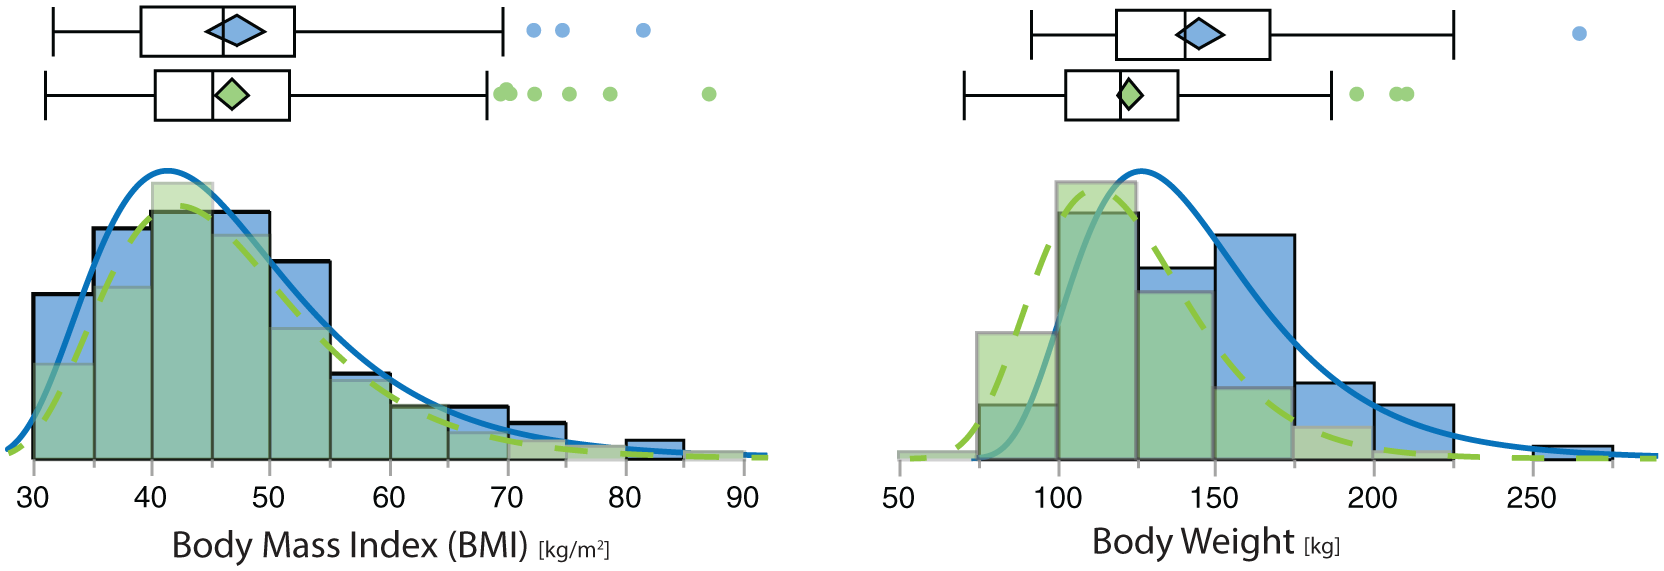
Distribution of BMI and weight for women (green, dashed) and men (blue, solid). BMI = body mass index.
Selected percentiles for each measure are listed in the appendix. Summary statistics (minimum, maximum, mean, standard deviation) of the 30 anthropometric dimensions are presented in Table 3.
Summary Statistics for Standard and Modified Anthropometric Dimensions, in Millimeters
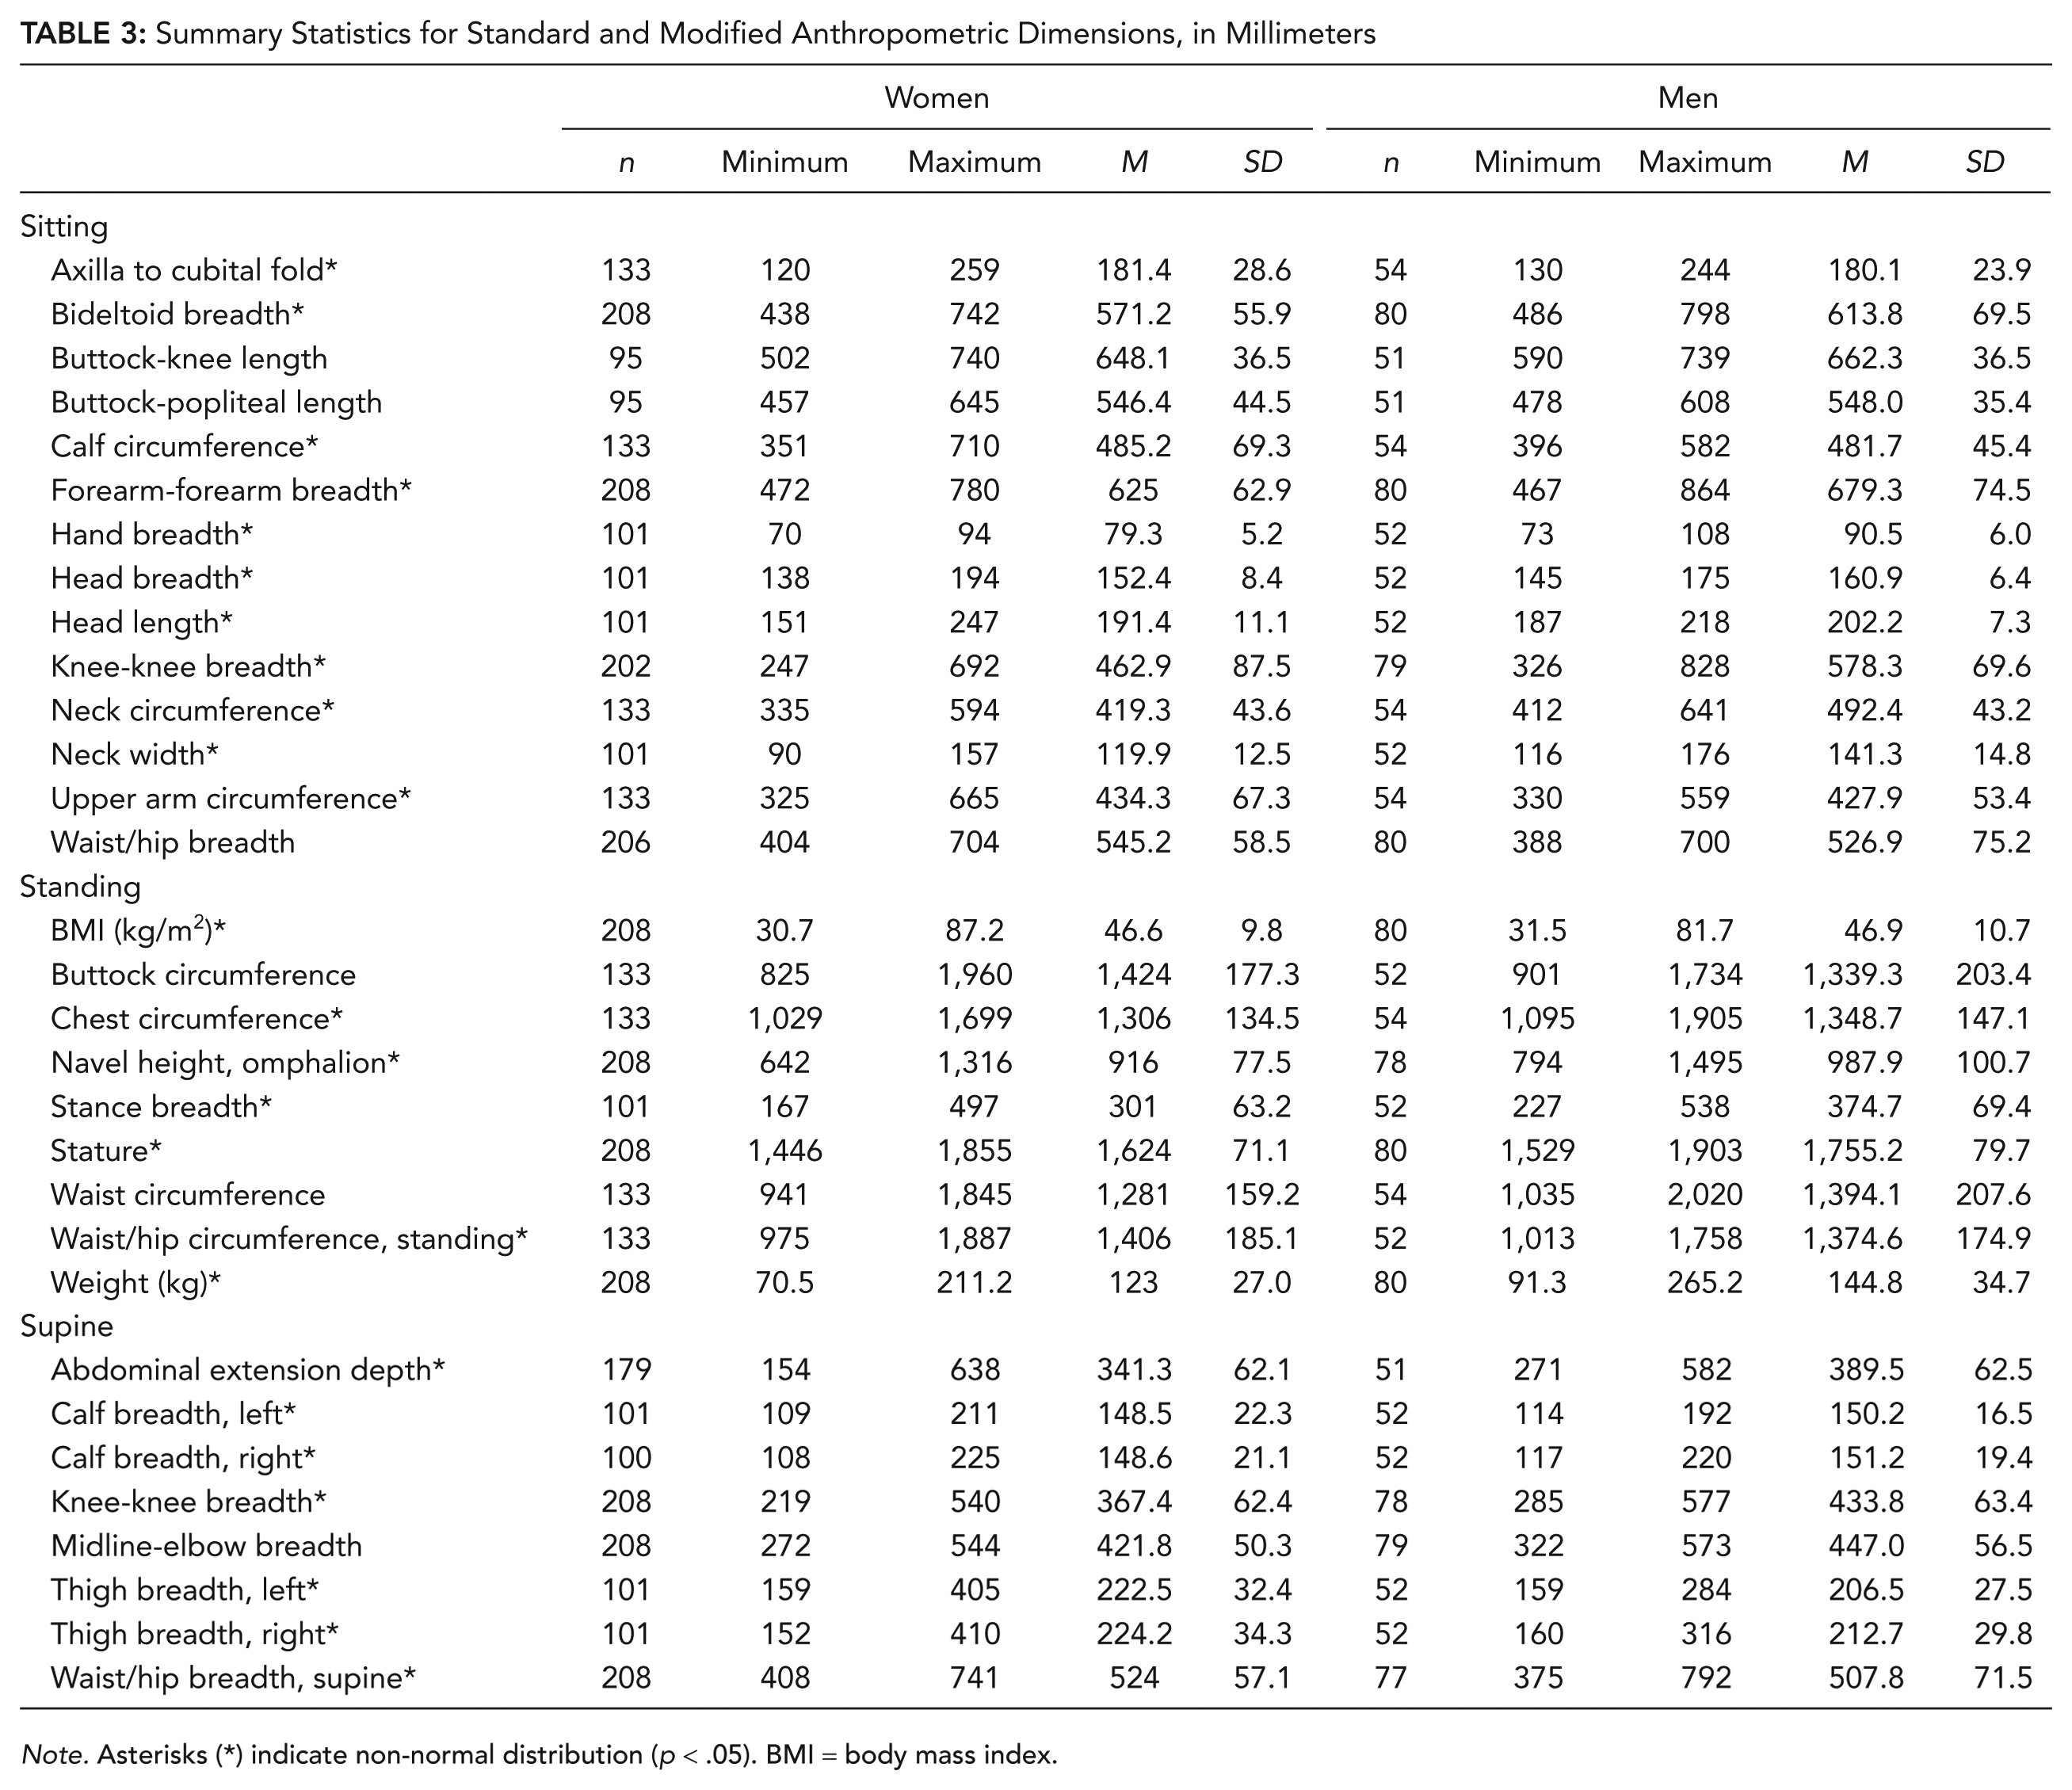
Note. Asterisks (*) indicate non-normal distribution (p < .05). BMI = body mass index.
Discussion
To our knowledge, this study is the first to collect anthropometric data for the obese population segment and conduct comparisons to the U.S. general population and available occupational databases. The current obese cohort differed substantially with respect to the distributions of anthropometric variables common across the datasets, notably BMI, weight, and waist circumference.
The substantial differences in the body dimensions of the populations were not unexpected, because the current obese cohort is not represented in available anthropometric databases. By design, the distribution of BMI for the study participants was skewed toward individuals with high BMI. As anticipated, there were no meaningful differences in stature between the anthropometric datasets. Table 2 shows that the obese cohort is significantly heavier than the U.S. general population and the NIOSH truck driver data. Body mass ranged from 71 to 265 kg for the current obese cohort versus 29 to 89 kg for the U.S. general population, and 43 to 263 kg for the NIOSH truck driver sample. Waist circumference measures were also larger among the obese cohort despite disparities in measurement definition. Across gender, the range of waist circumference dimension in obese cohort extends from 940 mm to 2,020 mm, in comparison with the U.S. population which extends from 555 to 1,015 mm.
Anthropometric measures for the obese cohort are highly variable across individuals. The current findings indicate the associated distribution of the anthropometric dimensions were mostly non-normal. The non-normal distributed dimensions are the result of the inclusion criterion defined as BMI ≥30 kg/m2and the body shape variability associated with obesity. Percentiles are used to characterize the sample because they are nonparametric—equally valid regardless of the data distribution. Mean and standard deviation are also still meaningful in the absence of normality; they are just no longer sufficient to characterize the distribution.
Definitions of standard anthropometric dimensions were developed based on measurements of individuals with low BMI. Applying these methods to obtain comparable data from individuals with high BMI poses some challenges due to the large variance in adiposity and body fat distribution in obese and morbidly obese participants. Palpating bony landmarks needed for standard measures can also be difficult, and appropriate measurement sites are often hard to determine as a result of greater tissue thickness that is increased in a nonuniform manner. The modified measures developed in the current study address the limitations of the conventional set of measures available to estimate adiposity and quantify of fat distribution in large samples of obese adults. For example, dimensions that capture maximum measurement sites quantify the space occupied by adipose deposits such as the panniculus or gluteal shelf.
A portion of the variability in the present study is due to participant posture. Comorbidities related to mobility and joint range of motion are common in this cohort, and they challenge the ability to achieve standardized body postures included as part of a measurement definition. For example, standing hip breadth and seated knee-to-knee breadth are dimensions traditionally measured with the knees pressed together (Gordon et al., 1989), an infeasible and uncomfortable posture for individuals with large amounts of soft tissue in the thighs. In this study, we adapted the traditional protocol and anthropometric measurement definitions. In most cases, we adjusted the posture to a “comfortable” stance, or “comfortable” sitting posture. This necessarily added variation to the data, but it also accurately reflects the normal positions that obese adults typically assume. The resulting data are therefore more directly applicable to design than data from a traditional anthropometric survey when the participants are all in stiff postures that most people do not normally use. Nevertheless, the postural variation certainly added to the overall dimensional variation seen in the resulting statistics.
Limitations
The most substantial limitation of the obese cohort sample is that it is convenience sample biased toward obese individuals who are considering or are actively participating in a surgical weight loss program, in addition to volunteers for a laboratory study. This sampling approach limits the generalizability of these data. In addition, women are overrepresented with respect to men.
Data from the two samples were pooled because neither were representative of any particular design population and hence the combination did not jeopardize generality. Combining the datasets also allowed for larger participant sample per measurement, as all measures (n = 30) were obtained for each participant in the U-M dataset whereas a subset was gathered for each participant at the bariatric weight loss centers.
Data collection procedures were standardized across sites. Measurements were obtained using a consistent protocol and equipment. All measurers were also trained together under the guidance of an experienced anthropometrist to ensure accuracy and consistency. One key difference between samples was the clothing worn by the participants. At the clinical sites, participants remained in their street clothes, while participants changed into lab-issued close-fitting garments during the laboratory study. A second limitation resulted from a difference in supine measurement protocols between the sites. For the laboratory study, all measurements were taken with the participant on a planar horizontal surface (0°), constructed of hard-acrylic materials. At the bariatric weight loss centers, supine measurements were completed on examination tables to assure patient comfort. These measurements were taken at the preferred head section angle of the participant which was identified by placing the head section at 30° and incrementally lowering the angle until the participant identified the angle that was preferred for sleeping. The range of preferred head angle ranged from 23° to 44° (SD = 8.4). This difference in protocol may affect torso body shape quantified by three supine measures; specifically, abdominal extension depth, midline-elbow depth, and to lesser extent waist/hip breadth.
A broader sampling strategy will be required to quantify differences in body shape attributable to gender, age, and nationality after taking into account body dimensions. The objective of the current study was to provide baseline data on the variability of the anthropometric measures. That assessment of variability is necessary to develop a sound determination of sample size for a larger, nationwide, study. The standard deviations presented here can be used to estimate statistical confidence in future studies. In the interim, the data may be used for short-term solutions to design problems, until data from a more comprehensive study are available.
Future Work
Well-informed product and workspace design considers the anthropometric characteristics of the user population. Typically, the design range is the central 90% or 95% of the distribution of a given population. Because the population segment including individuals with high BMI is typically at the extreme end of the anthropometric distribution of the overall population, this segment is likely to be systematically excluded from the design space. Disaccommodation of obese adults can increase stigma, impact safety, and reduce participation in society. Although limited in scope, by specifically collecting anthropometric data from individuals with high BMI, the current study provides insights about this population segment that are relevant for design and establishes a foundation for future data collection efforts.
Key Points
The current obese cohort are heavier than the U.S. general population, with a difference in mean body weight of 47 kg for women and 56 kg for men.
The current obese cohort are heavier and have a higher BMI compared to available occupational datasets, specifically the NIOSH (National Institute for Occupational Safety and Health) truck driver population.
Modified measures have been developed to address the limitations of the conventional set of anthropometric measures available to estimate adiposity and quantify fat distribution in large samples of obese adults.
Anthropometric measures for the obese cohort are highly variable across individuals. Distribution of these dimensions are mostly non-normal.
Footnotes
Appendix
Acknowledgements
This work was supported in part by Hill-Rom, the University of Michigan–Ford Motor Company Alliance, and the Center for Advancing Transportation Leadership and Safety (ATLAS). The ATLAS Center is supported by a grant from the U.S. Department of Transportation, Office of the Assistant Secretary for Research and Technology, University Transportation Centers Program (DTRT13-G-UTC54). The authors would like to thank the staff of Anthrotech and the large number of staff and students who all contributed to the success of this project. We also thank the participants who volunteered to be measured.
Neal Wiggermann is a specialist research scientist in Human Factors and Ergonomics at Hill-Rom. He received his PhD in industrial and operations engineering from the University of Michigan in 2011.
Bruce Bradtmiller is a specialist in applied anthropometry and president of Anthrotech, a firm that focuses on the collection, analysis, and application of anthropometric data to product design and development. He received his PhD in physical anthropology from Northwestern University in 1984.
Sue Bunnell is the bariatric program manager of Princeton Baptist Medical Center. She received her MA in health care administration from Purdue Global in 2018.
Cathy Hildebrand is a nurse practitioner with Schneck Medical Center. She completed her APN at Indiana State University in 2007.
John Archibeque is a certified bariatric nurse and the coordinator of bariatric surgery at the Bariatric Center at St. David’s North Austin Medical Center. He has an MS in nursing and an MBA in health care administration from the University of Phoenix.
Sheila Ebert is a research area specialist lead at the University of Michigan Transportation Research Institute. She received her MS in entomology from Michigan State University in 1999.
Matthew P. Reed is a research professor at the University of Michigan. He received his PhD in industrial and operations engineering from the University of Michigan in 1998.
Monica L. H. Jones is an assistant research scientist at the University of Michigan. She received her PhD in industrial and operations engineering from the University of Michigan in 2011.