
Abstract
Objective:
The aim of this study was to understand how to secure driver supervision engagement and conflict intervention performance while using highly reliable (but not perfect) automation.
Background:
Securing driver engagement—by mitigating irony of automation (i.e., the better the automation, the less attention drivers will pay to traffic and the system, and the less capable they will be to resume control) and by communicating system limitations to avoid mental model misconceptions—is a major challenge in the human factors literature.
Method:
One hundred six drivers participated in three test-track experiments in which we studied driver intervention response to conflicts after driving highly reliable but supervised automation. After 30 min, a conflict occurred wherein the lead vehicle cut out of lane to reveal a conflict object in the form of either a stationary car or a garbage bag.
Results:
Supervision reminders effectively maintained drivers’ eyes on path and hands on wheel. However, neither these reminders nor explicit instructions on system limitations and supervision responsibilities prevented 28% (21/76) of drivers from crashing with their eyes on the conflict object (car or bag).
Conclusion:
The results uncover the important role of expectation mismatches, showing that a key component of driver engagement is cognitive (understanding the need for action), rather than purely visual (looking at the threat), or having hands on wheel.
Application:
Automation needs to be designed either so that it does not rely on the driver or so that the driver unmistakably understands that it is an assistance system that needs an active driver to lead and share control.
Keywords
Introduction
The potential of automation to revolutionize vehicle safety is widely recognized, given that as many as 94% of crashes have been attributed to driver-related critical reasons, such as recognition errors, decision errors, and performance errors (National Highway Traffic Safety Administration, 2015). At the same time, if we look at exposure, crashes in manual driving are very rare events (Lindman, Isaksson-Hellman, & Strandroth, 2017; Nidhi & Paddock, 2016). The level of human crash avoidance performance that must be surpassed by automation to achieve the vision of zero fatalities and serious injuries is very high (Eugensson, Ivarsson, Lie, & Tingvall, 2011; Johansson, 2009), for example, 39.1 million kilometers per crash with severe or fatal injury in passenger cars considering all traffic environments (126 million kilometers for motorways only) in Sweden (Lindman et al., 2017).
Furthermore, extensive experience with human factors in automation over the past 50 years indicates that human factors issues are a key hurdle to overcome (Bainbridge, 1983; Billings, 1988; Endsley & Kiris, 1995; Lee, Wickens, Liu, & Boyle, 2017; Parasuraman & Riley, 1997; Sarter & Woods, 1995; Sheridan, 1992; Wiener & Curry, 1980).
The current status is thus a kind of catch-22, or “crash-22,” whereby automation may prevent crashes but crashes may occur because of automation. There are human costs with both waiting and with being too permissive toward automation (Nidhi & Groves, 2017).
To resolve this crash-22 situation, the human factors challenges in driving automation must be overcome (see, e.g., reviews by Lee et al., 2017; Seppelt & Victor, 2016). Given the literature reviews of key human factors studies (de Winter, 2014; Onnasch, Wickens, Li, & Manzey, 2013; Seppelt & Lee, 2012; Trimble, Bishop, Morgan, & Blanco, 2014) and the guidelines that have been developed (Endsley, 2015; Lee et al., 2017), it is clear that success will depend on recognizing and supporting the two new driver roles that come with driving automation: the delegated and the shared driving role, or unsupervised and supervised autonomous driving, respectively (Seppelt & Victor, 2016).
In unsupervised autonomous driving, the driver delegates full control and responsibility to the vehicle, to be free to do something else (work, watch a film, etc.). This type of automation requires a vehicle designed for complete support and crash avoidance in all conflict situations (see, e.g., Lindman et al., 2017; Victor, Rothoff, Coelingh, Ödblom, & Burgdorf, 2017). Supervised automation, on the other hand, only partly supports the driving task (e.g., headway control with some degree of steering assistance), and the driver is still required to supervise the driving and intervene at sensing or actuation limits (e.g., conflict situations). Until unsupervised autonomous driving exists, automation is assistance and the driver is not free to disengage from the driving task.
Reduction of Human Performance and Irony of Automation
A general relationship between the degree of automation and reduction in human performance (such as complacency, skill degradation, and loss of situation awareness) has been found in meta-analyses. For instance, Onnasch et al. (2013) found that although increased automation support results in improved routine task performance, operators reduce their awareness of the situation or operating environment and show difficulty troubleshooting and recovering if something goes wrong with the automation or if something unexpected happens. This finding—reduced situation awareness and limited capability to recover as automation increases—is based on a meta-analysis of 18 studies from process control, supervisory control, and aviation, and is robust across domains.
This human performance reduction is largely attributed to operators’ tendency to reduce their monitoring of highly reliable automation because of its ability to function properly for an extended period (e.g., Parasuraman & Manzey, 2010; Parasuraman, Sheridan, & Wickens, 2008). It is difficult for humans to monitor automation or to be out of the loop for some time and then suddenly solve critical issues (Strand, Nilsson, Karlsson, & Nilsson, 2014). Of particular concern are first-failure effects. These are circumstances in which the operator encounters perfect automation for some period, and then “complacency” or overtrust in automation is reflected by a very poor response when the automation first fails (Metzger & Parasuraman 2005; Molloy & Parasuraman 1996; Wickens, Hooey, Gore, Sebok, & Koenicke, 2009). Approaches to modeling first-failure mechanisms include the “black swans” in N-SEEV (e.g., Wickens et al., 2009) and as automation prediction error within the predictive processing framework (Clark, 2013; Engström et al., 2017, p. 180). As concluded by Seppelt and Victor (2016), the better the automation, the less attention drivers will pay to traffic and the system, and the less capable they will be to resume control. This general phenomenon is an irony of automation (Bainbridge, 1983). In short, as automation becomes more reliable during routine driving and the operational design domain expands (e.g., more situations, speeds, and road types), drivers may develop misconceptions that the automation can handle all safety-conflict situations, leading to driver disengagement and performance reduction.
System Limitations, Automation Transparency, and Driver Mental Models
Another important aspect of the aforementioned human performance reduction under automation (i.e., in addition to reduced monitoring) is that operators often have gaps and misconceptions in their mental models of automated systems (Sarter & Woods, 1994) due to their complexity. Consequently, operators are often surprised by the automation; they do not understand why it behaves in a certain manner or what it will do next (Parasuraman et al., 2008). It is thus necessary that a correct mental model of the system, along with the associated required driver behavior, is clearly described in supporting product material and human–machine interactions. Gaps and misconceptions in mental models underline the importance of the key human factors concept of automation transparency (Endsley, 2015).
The reason why drivers must supervise is because supervised driving automation and crash avoidance systems have limitations. Common current limitations include restrictions in operating speed ranges; how much steering, braking, and acceleration the system can apply; and limitations in lane and object detection (e.g., pedestrians, animals, on-road objects, and oncoming vehicles). Additionally, the driver needs to supervise for system faults ranging from sensor blockage to brake pump failure, as these may require immediate intervention. Thus the driver both supervises ongoing automation performance and detection of precrash conditions. For drivers, conflict detection limitations are difficult to understand (Larsson, 2012; Seppelt, 2009). Events where such detection is needed are rare, and the technology may react to some but not all threats. To the driver, they essentially represent unknown or invisible system limitations, especially if detection performance is dependent on sensor quality and environmental conditions. In this context, driver training has been highlighted as a promising solution for development of proper mental models (Beggiato & Krems, 2013; Payre, Cestac, & Delhomme, 2015; Sarter & Woods, 1995).
Understanding Mechanisms Influencing Supervision
As stated earlier, human performance reduction in automation is largely attributed to reduction in monitoring. However, more clarity is needed regarding whether this reduction depends on reduced use of physical controls (steering wheel and pedals), reduced eyes-on-road time, or problems understanding the system. This clarity is particularly important when considering what is required to be a fallback-ready user that “is receptive to [dynamic driving task (DDT)] performance-relevant system failures in vehicle systems and, upon occurrence, performs DDT fallback in a timely manner” (SAE, 2016). For example, one assumption could be that if drivers have sufficient supervision engagement (look toward conflict events and objects), then they would achieve high conflict-intervention performance (understand and respond). Attention and understanding are often implicitly mixed together in descriptions of monitoring (see, e.g., Merat et al., 2018; SAE, 2016).
The ability of people to effectively supervise automation is also clearly related to difficulties in achieving calibrated trust, in which the user’s trust matches the automation capabilities (Hoff & Bashir, 2015; Lee & See, 2004). Higher levels of trust are associated with less eyes-on-road time and less monitoring (Hergeth, Lorenz, Vilimek, & Krems, 2016; Muir & Moray, 1996), presumably because of a reduction in the need to update predictions (Engström et al., 2017).
Aims
General driver engagement–related research questions emerge from the literature: (a) How do we mitigate the classic irony of automation (the better the automation, the less attention drivers will pay to traffic and the system, and the less capable they will be to resume control) and secure driver engagement? (b) How should we communicate system limitations that avoid mental model misconceptions for drivers-in-the-loop (help drivers understand what they should be watching out for)? Specifically, the main aim of this paper is to understand how to secure driver supervision engagement and conflict intervention performance while using highly reliable (but not perfect) automation.
In Experiment 1 we aimed to understand how driver engagement and mental model misconceptions could be a problem in highly reliable driving automation for drivers with limited system knowledge (low instruction level) and without feedback on supervision engagement (no attention reminder). Experiment 1 serves as a reference (or baseline) for the following experiments.
In Experiments 2 and 3 we aimed to understand the effects of (a) adaptive automation (Parasuraman, Sheridan, & Wickens, 2000) in the form of different types of supervision reminders (to secure driver engagement) and (b) automation transparency (Endsley, 2015) in the form of different levels of instruction detail (to secure a correct mental model of system limitations). These effects are studied in different conflict scenarios (stationary car fully or partially in lane, garbage bag, drift out of lane).
General Method
Overview
All three experiments shared a similar general methodology; see Table 1 for an overview of key differences between experiments and conditions. The independent variables were level of instruction detail, supervision reminder type, conflict scenario type, and vehicle response to conflict, as shown in the last four columns in Table 1.
An Overview of Key Differences Between Experiments and Conditions
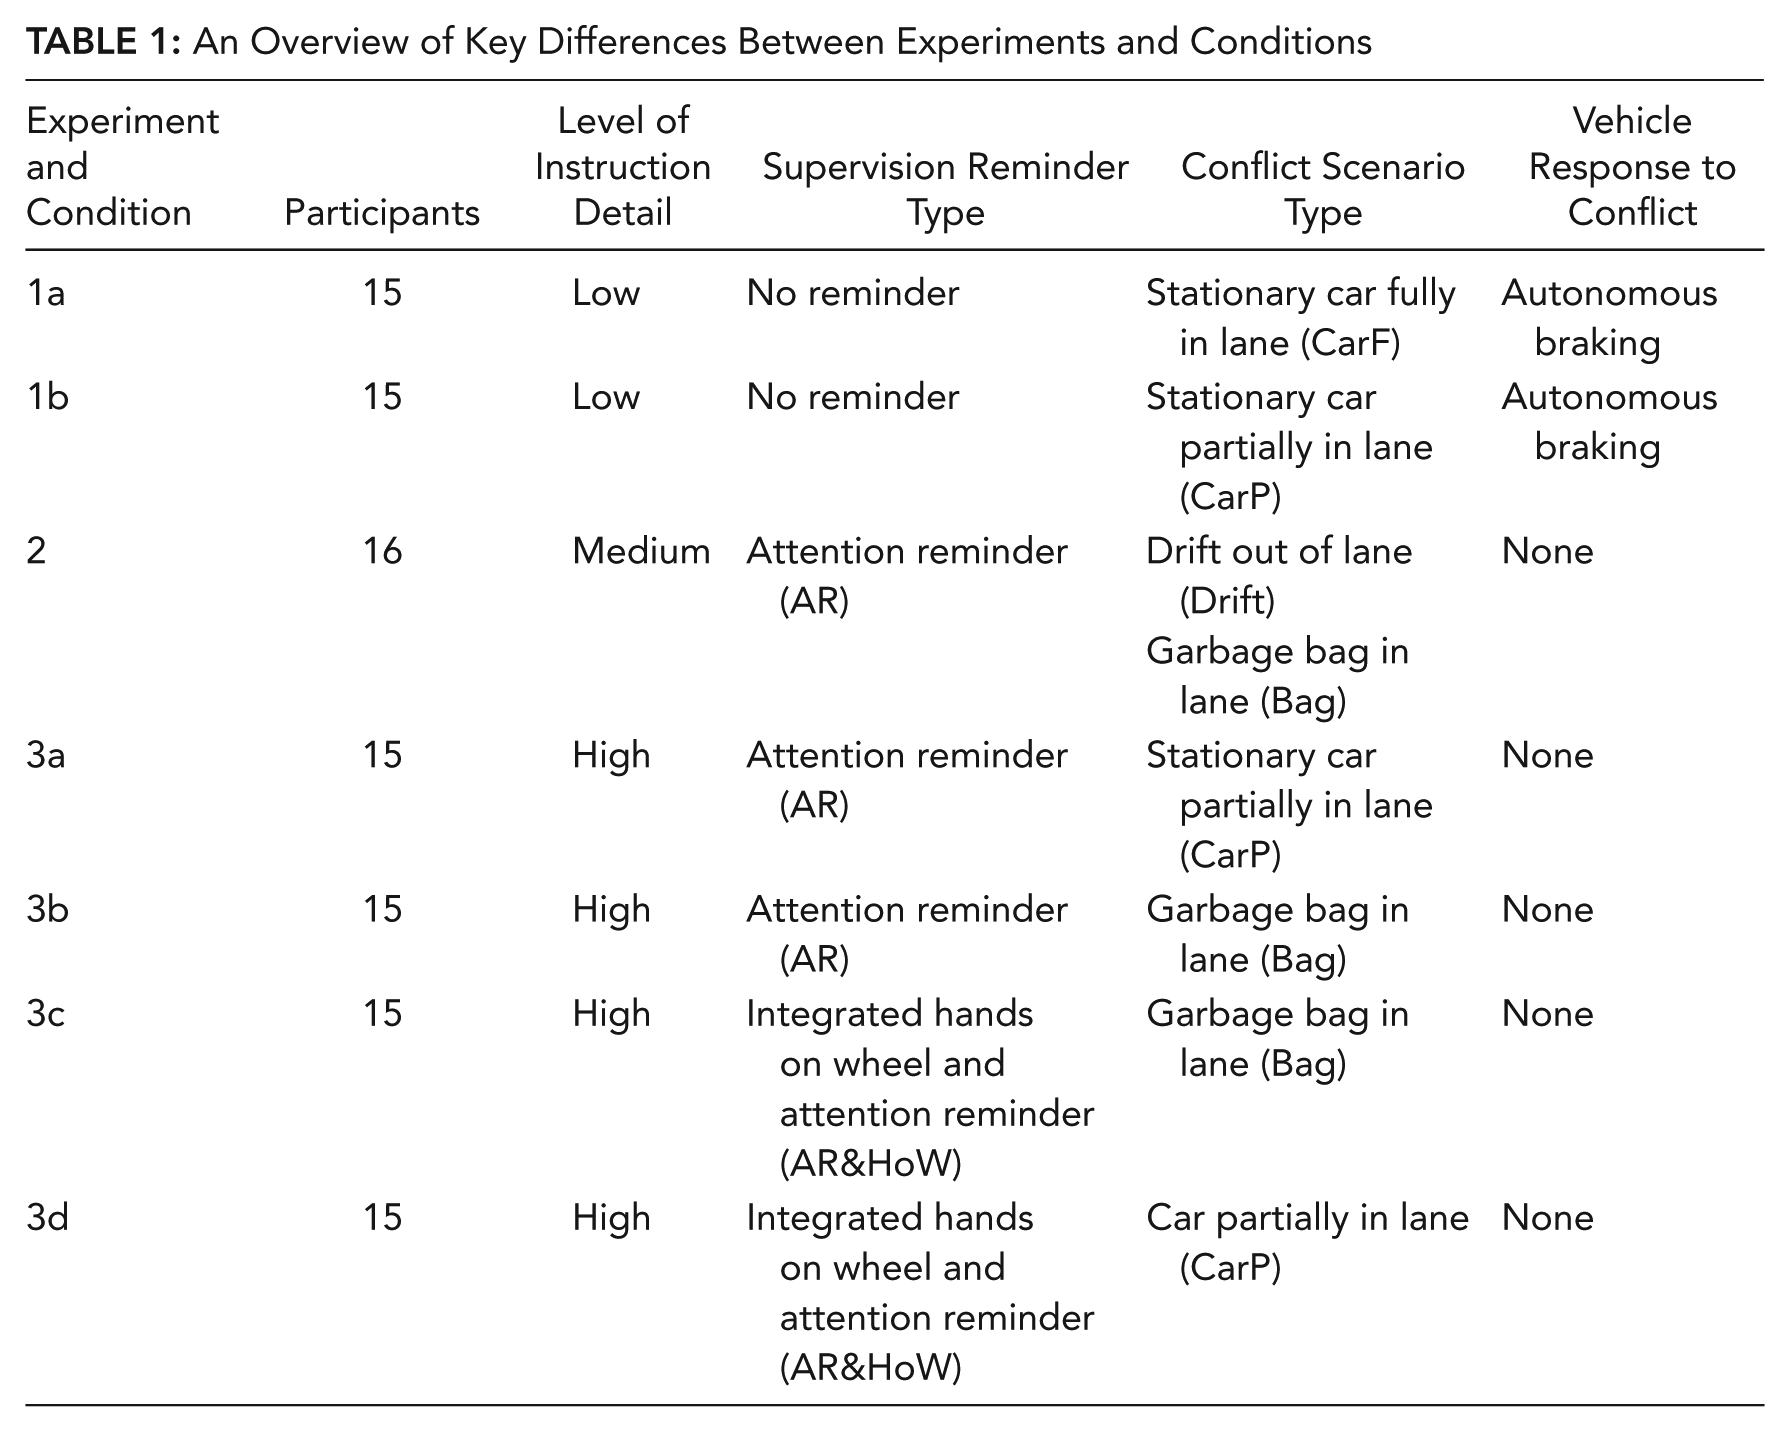
In Experiment 1, test participants were given a low level of instruction (short, general instructions regarding supervision responsibilities and vehicle capabilities). The conflict object was a stationary car placed either fully or partially in lane (CarF, CarP); see Figure 1. Only in Experiment 1 did the test vehicle (TV) automatically brake and avoid the conflict.
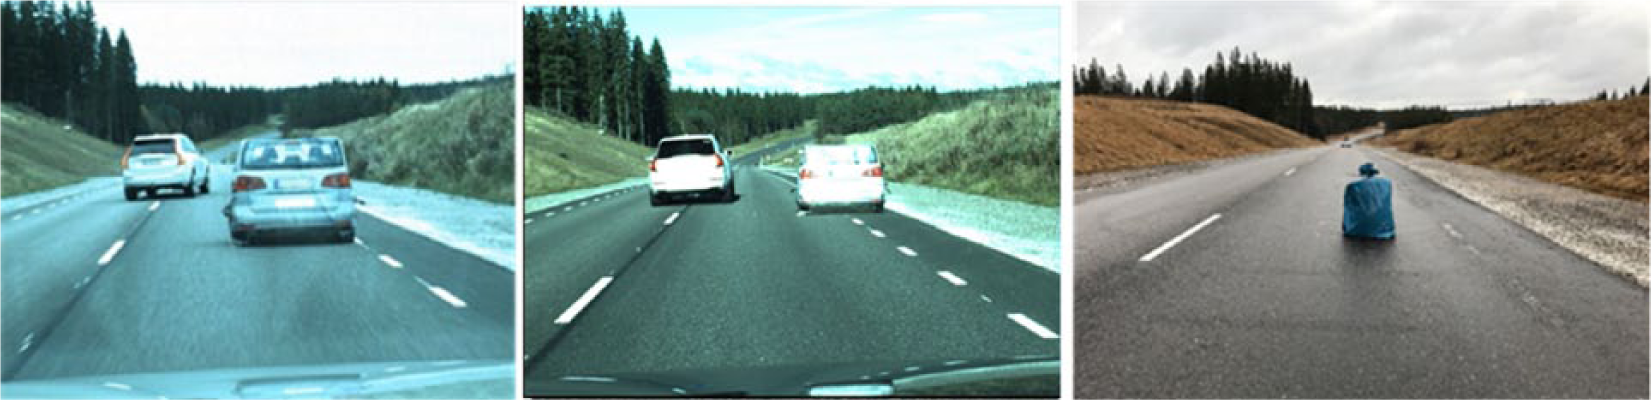
The conflict event types used in the experiments. Left: Stationary car conflict object and car fully in lane position used in Experiment 1 (CarF). Center: Stationary car conflict object and car partially in lane position used in Experiments 1 and 3 (CarP). Right: Garbage bag and position in lane used in Experiment 2 and 3 (Bag).
In Experiments 2 and 3 we examined the effect of different design solutions to secure safe supervision and conflict intervention by the driver. Across all studies, we examined the effect of level of instruction detail (low, medium, and high) and supervision reminder type (no reminder, attention reminder, and integrated hands-on-wheel and attention reminder) on supervision and intervention performance across the experiments and experimental conditions with a between-subjects design. Further, we examined the effect of supervision and intervention performance in different conflict scenarios: stationary car (positioned fully or partially in lane), object on road (a garbage bag positioned in lane), and TV drifts out of lane.
In Experiment 2, participants were given a medium level of instruction: detailed written instructions that emphasized the driver’s responsibility to supervise and intervene whenever needed. The supervision reminder type the participants received was an attention reminder (AR; warning messages in the instrument cluster behind the steering wheel) if they were visually inattentive (determined from patterns of off-path eye glances). In Experiment 2 we also examined whether intervention performance is associated with the first-failure effect, that is, if intervention performance problems occur only at first failure and performance improves thereafter in a second conflict event (the garbage bag event). A drift out of lane (drift event) took place after 15 min, and the garbage bag event occurred after 30 min of driving. In the drift event, the vehicle drifted over into the left-adjacent lane and returned to the right lane after some time if the driver did not intervene (between 8 and 18 s for the participants who did not steer back). The TV did not brake automatically for the garbage bag, so participants needed to intervene to avoid a crash.
In Experiment 3, participants were given a highly detailed level of instruction in the form of explicit classroom training on the vehicle’s limitations and risk scenarios they needed to be aware of about a week before the actual test. The training was provided as a PowerPoint presentation, which included examples of desired driver behaviors in videos, and as written material. In Experiment 3 we also compared the effect of two supervision reminder types. In Conditions 3a and 3b, participants received an AR that was improved following subjective feedback from Experiment 2 or an integrated hands-on-wheel and AR (AR&HoW) that required hands on wheel and eyes on path at regular intervals. The conflict object was either the stationary balloon car from Experiment 1a or the garbage bag from Experiment 2. The TV did not brake automatically for any of the conflict object events, so participants needed to intervene to avoid a crash.
Participants
All 106 participants were Volvo Cars employees. Recruitment criteria were set up to achieve a between-group design where participants could not have work duties associated with driving automation development, could not work as a test driver, had no prior participation in similar studies, and had a minimum driving experience of at least 5,000 km during the previous year. To the extent possible, a gender- and aged-balanced test population was targeted.
Materials, Procedure, and Scenario Design
On arrival, the test leader gave participants general information about the test and asked them to read through written participant information as well as sign an informed consent form. Participants were also asked to fill in a predrive questionnaire with background information. The stated purpose of the study was to evaluate driver experiences during autonomous driving.
Next, participants were escorted to the TV, a Volvo XC90 (MY2016), and positioned themselves in the driver’s seat. Further verbal information about the test and vehicle was given, along with an introduction to the Karolinska Sleepiness Scale (KSS; Kaida et al., 2006) and the Self-Assessment Manikin (SAM) scale (Bradley & Lang, 1994). Participants were also told that they could override the automation by steering or braking at any time. Before starting to drive, participants reported their current KSS level (1–9) and then reported their KSS level once every lap (approximately every 6 min). The SAM scale was answered twice, once mid-drive after approximately 18 min into the drive and once after the conflict. Two test leaders rode along in the TV: one who administered the KSS and SAM scale and acted as an “interaction wizard,” and another who acted as (backup) safety driver. There was no conversation with test participants during the drive, except when asking for their KSS and SAM scores.
The TV followed behind a robot-controlled XC90 lead vehicle (LV), which kept a speed of 70 km/h, except through some curves, where speed was lowered by the LV to about 50 km/h. The same (prerecorded) LV path and velocity were used for all participants. No other traffic was present. In all experiments, the TV was equipped with special, test-unique software which had self-driving capability to precisely follow the road, maintain speed, and keep a constant headway with highly-reliable driving performance behind a robot-controlled LV on the AstaZero test track. The majority of the rural road test track is in a forest environment. On certain road stretches it is possible to briefly (<10 s) see the test track center and views of other test areas. After 30 min, the TV encountered a conflict object placed in the driving lane (Figure 1): either the ADAC Advanced Emergency Braking System stationary target (stationary car) or a filled garbage bag. The conflict object was positioned so participants could see it when passing through a curve just prior to the event 14 s before reaching the conflict object. The conflict object became obscured again by the LV when the road straightened out.
About 20 m from the conflict object, or about 3 s prior to the TV passing or collision with the conflict object, the LV did a cutout (an evasive steering maneuver around the object), revealing the conflict object in full to the participants. In all three experiments, drivers were instructed to supervise the driving at all times and that they could override the automation by steering or braking at any time. In Experiment 3c and 3d, drivers were told that “for this particular drive, we want you to have your hands on the steering wheel throughout the drive.” In all other experiments and conditions, drivers were free to place their hands however they wanted, as long as they felt it was in accordance with their supervisory role.
After the conflict, participants were asked to stop and fill in a postdrive questionnaire, which also served as a basis for a semistructured interview. Free text responses and interview transcriptions were coded and clustered into themes and were analyzed together with responses on rating scales using a combination of qualitative and quantitative methods. After the interview, the full purpose of the study was disclosed, and participants were asked not to reveal this purpose to colleagues until a later date to preserve the surprise element of the test method.
Data Collection
Vehicle controller area network data from an XC90 (MY2016), GPS data, and video data were recorded using a Dewesoft S-Box measurement system (https://www.dewesoft.com/products/sirius#sbox). Vehicle data were recorded at 33.3 to 200 Hz depending on signal, GPS data were recorded at 40 to 100 Hz, and video data were recorded at 20 Hz in Experiments 1 and 2 and at 30 Hz in Experiment 3.
This research complied with the tenets of the Declaration of Helsinki and was approved by the Regionala Etikprövningsnämnden i Göteborg, Dnr:369-16. Informed consent was obtained from each participant.
Dependent Variables
Response process variables
Objective measures of overt driver behaviors in relation to the conflict events were determined from recorded video and vehicle data: driver steering, driver braking, hands on wheel, and crash involvement (contact with balloon car or garbage bag). Video and interview data were reviewed to assess whether a crash had occurred during the conflict event. Any contact between TV and the conflict object was classified as a crash.
Eyes-off-path glances variables
Eye movements were reduced into two categories of glances: either on or off the forward vehicle path. A glance is the transition of the eyes to an area of interest (here, either on-path or off-path areas) followed by one or more continuous fixations within that area, until the eye moves to another area of interest (International Organization for Standardization, 2014).Glances were manually annotated from recorded video. All unknown glances shorter than 0.3 s or eye closures shorter than 0.4 s were interpolated if the values before and after were the same. Otherwise, the glances before and after were included as two separate glances. Glances ongoing at a time series data cutoff point (e.g., 15 s before conflict or at SAM rating onset/offset) were cut into two glances (before and after the cutoff point) included in analysis. Glance analyses exclude time segments when the SAM ratings were collected. Eyes-off-path glances include eye closures, as is common procedure (see, e.g., Morando, Victor, & Dozza, 2018; Victor et al., 2015).
Percentage road center (PRC) is the proportion of time that glances fall within a road center area (i.e., on-path glances; Victor, Harbluk, & Engström, 2005). PRC is essentially the on-road inverse of the percentage of eyes-off-road time defined in ISO 15007-1:2014. Several metrics of percentage of extended duration glances (included in ISO 15007-1:2014) were calculated to quantify long glances as percentage off-path glance durations exceeding X seconds (%GDoff>Xs). Extended-duration glances have previously been associated with increased crash risk, in particular glances >2 s (see, e.g., Victor et al., 2015). Glance duration data were analyzed, at aggregate level, as empirical probability density functions in cumulative frequency distributions. Further, off-path glance frequency per hour (GFoff/h) and PRC were calculated for all driving, excluding short segments with missing glance data (e.g., due to strong sun in a curve blinding the camera).
Subjective variables
Subjective data from each participant were gathered from scores on the KSS (Kaida et al., 2006) and the SAM scale (Bradley & Lang, 1994). Postdrive questionnaire responses were gathered on trust on a scale between 1 (not at all) and 7 (completely). Open interview questions were asked on impulse to intervene (categorized as intervened, intervened late, intervened too late, or did not intervene) and realization of the need to intervene (categorized as realized, realized late, realized too late, or did not realize).
Statistical Analysis
The Mann-Whitney U test was used to compare glance metrics across studies during all driving (e.g., %GDoff>2s). PRC during a time interval 10 to 15 s prior to impacting or passing the conflict object was compared across test conditions (with and without AR; with and without hands-on-wheel conditions) using Mann-Whitney U. The number of participants reporting extreme sleepiness (KSS ≥ 8; binary: 1/0) was compared across studies using Fisher’s exact test. The number of participants who crashed or did not crash (binary: 1/0) was compared across study conditions using Fisher’s exact test. The calculated p values were corrected for multiple tests using the Benjamin and Hochberg false discovery rate (Benjamini & Hochberg, 1995) and were considered statistically significant at the .05 level. In addition, descriptive statistics were provided for GFoff/h and PRC during all driving per test person, as well as a comparison of interviews and subjective ratings (e.g., trust, reported experience/response during the conflict) and overt behavioral response to the conflict across groups (e.g., crashes/noncrashes) and conditions (e.g., position of conflict object).
Experiment 1
What would happen if drivers were simply told their role is to supervise highly reliable automation? Would they intuitively monitor the road at the same rate as in manual driving? Would they react to conflicts in a similar manner as in manual driving? The main aim of Experiment 1 is to understand driver engagement in highly reliable driving automation when drivers do not have much education (low level of instruction detail) and without feedback about supervision engagement (no supervision reminder). A secondary aim is to study the effect that different conflict scenarios—a stationary car either fully or partially in lane—has on intervention performance. Experiment 1 is intended to provide a reference (baseline) for following experiments.
Method
Participants
Thirty participants were included in the final sample, 17 male and 13 female, ages 26 to 56 years (M = 42.0, SD = 8.78). Driving experience ranged from 1 to 35 years (M = 23.1, SD = 8.96).
Materials
The following differences to general methods were introduced. The TV automatically braked for the stationary car. The human–machine interface (HMI) was identical to current-production Volvo XC90 (MY2016) and did not have a hands-on-wheel reminder or AR.
Experimental and scenario design
Experiment 1 employed a between-group design with two lateral positions of the stationary ADAC balloon car. The car was positioned such that its right side was either adjacent to the right-lane markers (fully in lane) or 80 cm outside the right-lane markers (partially in lane). An automated brake intervention that would make the TV stop just in front of the conflict object was implemented, with a maximum deceleration rate of 5.5 m/s2. To give all participants the same intervention regardless of balloon car position, standard auto braking triggers were temporarily disabled and the intervention was instead triggered from GPS coordinates at a time to collision of 2.0 s. A low level of instruction was given verbally and in written form: You will ride in a self-driving car which will follow a lead vehicle for about 30 minutes. The car is designed to be capable of driving itself during the whole drive on the rural road. Despite this, we want you to supervise the car, and focus on how it is driving. If you feel like you need to, you can override the automation during driving by steering, or using the accelerator and brake pedals. As we are interested in your experience of the ride, you are not allowed to use your mobile phone or do anything else that takes your focus away too much from driving.
Participants were verbally told not to have their hands on the steering wheel when automated driving was activated, in order to minimize the risk of unintentional steering maneuvers. There was no reminder to supervise (e.g., AR or hands-on-wheel reminder).
Results
Response process
Six of the 30 participants (20%) intervened in the conflict event by steering away from the balloon car. Four out of 15 (27%) steered to avoid the balloon car when it was positioned fully in lane (CarF), and only 2 out of 15 (13%) steered to avoid it when in was positioned partially in lane (CarP), χ2(1) = 0.833, p ≥ .05. Two out of these 6 (both in CarF) also braked. Only 1 participant (in CarF) grabbed the steering wheel and applied steering prior to the automated brake intervention.
Eyes-off-path glances
Many participants exhibited long periods of eyes off path during the 30 min of driving; see Figure 2. All participants had off-path glances longer than 2 s, and more than one third (11/30) of the participants had glances longer than 8 s. The maximum off-path glance was 39.6 s long and was spent gazing at the center of the steering wheel. In addition, 10% (3/30) of the participants had off-path glances longer than 18 s. The participants with off-path glances longer than 8 s were either looking at the surroundings, looking at the interior of the car, or had their eyes closed.
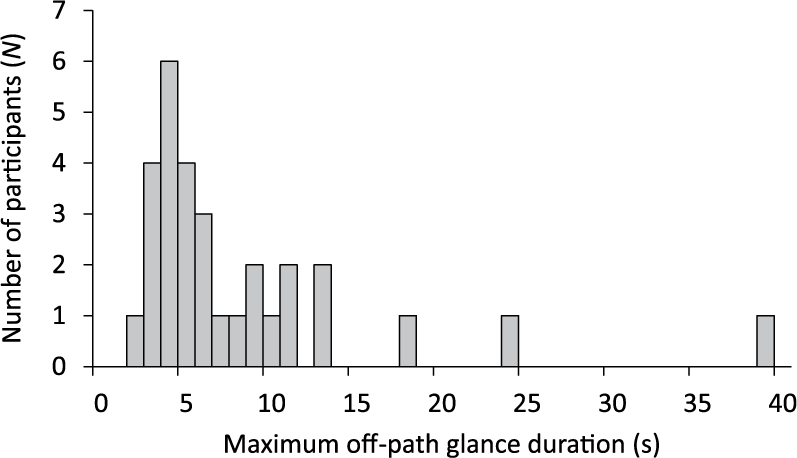
Histogram of maximum off-path glance duration for each participant (N = 30) during all driving. Note that off-path glances include eye closures.
Subjective Data
Sleepiness
Three out of 30 participants (10%) reported extreme sleepiness (KSS ≥ 8). One participant fell asleep during the drive and was sleeping at the time of the conflict event. This participant also accidentally pressed the accelerator pedal when asked to press the brake pedal after the event when the vehicle had stopped just prior to colliding with the stationary car.
Realization of the need to intervene
Fourteen participants or 47% (7 in each group) reported that they intervened or felt an impulse to intervene, showing no difference between balloon car being positioned fully or partially in lane, χ2(1, N = 30) = 0.000, p ≥ .05. The majority of these participants (4 fully in lane and 6 partially in lane) did not intervene but reported that they felt an impulse to either brake or steer before the TV braked. Two of the 6 participants who had applied steering intervention were unaware of their own actions, and the remaining four participants stated that they wanted the TV to follow the LV into the oncoming lane. Two participants explained this statement further, with 1 stating that the TV’s brake intervention came too late and the other that it was unnecessary to stop because the oncoming lane was clear. The most frequent explanation among the 16 persons who did not intervene or feel an impulse to was that they trusted the car.
Trust
Participants reported a high level of trust in the car to handle the conflict situation, both when the balloon car was fully in lane (M = 6.07, SD = 0.96) and when it was partially in lane (M = 5.93, SD = 1.33).
Discussion and Conclusions
The results of Experiment 1 were surprising, yet they confirm concerns about reduction of driver engagement and the irony of automation applying also to driving automation. Drivers displayed both extreme visual distraction and sleepiness, with one participant sleeping when the conflict occurred, all within 30 min of driving. This level of inattention during driving has, to our knowledge, never been reported in driving research. For example, the 2-s off-road glance length is typically used as a maximum visual distraction criterion. In this experiment, we see more than a third of participants with glances over 8 s.
One interpretation for the high level of trust in the car being able to handle the situation is that the participants received unspecific information about the capabilities and limitations of the car. Thus, we can conclude that driver engagement is a problem in highly reliable driving automation when drivers have a limited understanding of the system (low level of instruction detail) and without feedback reminding them to supervise driving (no supervision reminder). However, the different conflict event types, including a stationary car either fully or partially in lane, did not show any difference with regard to intervention performance.
These results can be taken as a baseline against which the effectiveness of countermeasures can be compared. The obvious question is whether these drivers would have avoided the conflict if the system had not braked for the conflict. The next two experiments address this issue.
Experiment 2
What if we were to give more explicit instructions and ARs? Would that fix the driver engagement and conflict intervention problems encountered in Experiment 1? In Experiment 2 we aimed at understanding the effect of a medium level of instruction and an AR on supervision and conflict intervention performance in a conflict event with a garbage bag.
The following countermeasures were implemented: (a) a medium level of detailed instructions that emphasized the driver’s responsibility to supervise and intervene whenever needed and (b) an AR (a type of supervision reminder) that detected patterns of eyes-off-path behavior and issued warning messages. These reminders were provided together with a custom supervised-automation graphic design of the instrument cluster. Do these countermeasures create appropriate levels of eyes on road and prevent crashes?
On the basis of experiences from Experiment 1, we wondered whether drivers would intervene and avoid the conflict if there was no autonomous brake intervention (i.e., would they intervene if they got closer to the conflict object?). Also, a more realistic conflict event type—a garbage bag—was used. It was believed that a filled garbage bag would create a greater sense of criticality at the conflict event as the garbage bag was presumed to be more a realistic hazard than the balloon car used in Experiment 1. Also more realistically, in Experiment 2 we also examine whether intervention performance is associated with the first-failure effect (Metzger & Parasuraman, 2005; Molloy & Parasuraman, 1996, Wickens et al., 2009). That is, do intervention performance problems occur only at first failure (a drift-out-of-lane event), or do they persist thereafter at the conflict event (the garbage bag event)?
Method
Participants
Sixteen participants were included in the final sample, 2 females and 14 males. Ages spanned from 27 to 66 years (M = 45.9, SD = 12.0) with driving experience spanning from 6 to 49 years (M = 26.9, SD = 13.7).
Materials
The following differences to general methods were introduced. The original XC90 driver information display was modified to display a custom supervised-automation HMI (see Figure 3), which also could give ARs to participants according to predefined thresholds for visual inattention, a similar algorithm to Victor (2005), and the multidistraction detection algorithm in Lee et al. (2013). Two AR levels were used. Both levels of reminders were presented for a maximum of 7.0 s. If participants looked back on the road for at least 2.0 s after the reminder or were judged to be more attentive, the system reset and the reminder disappeared from the display.
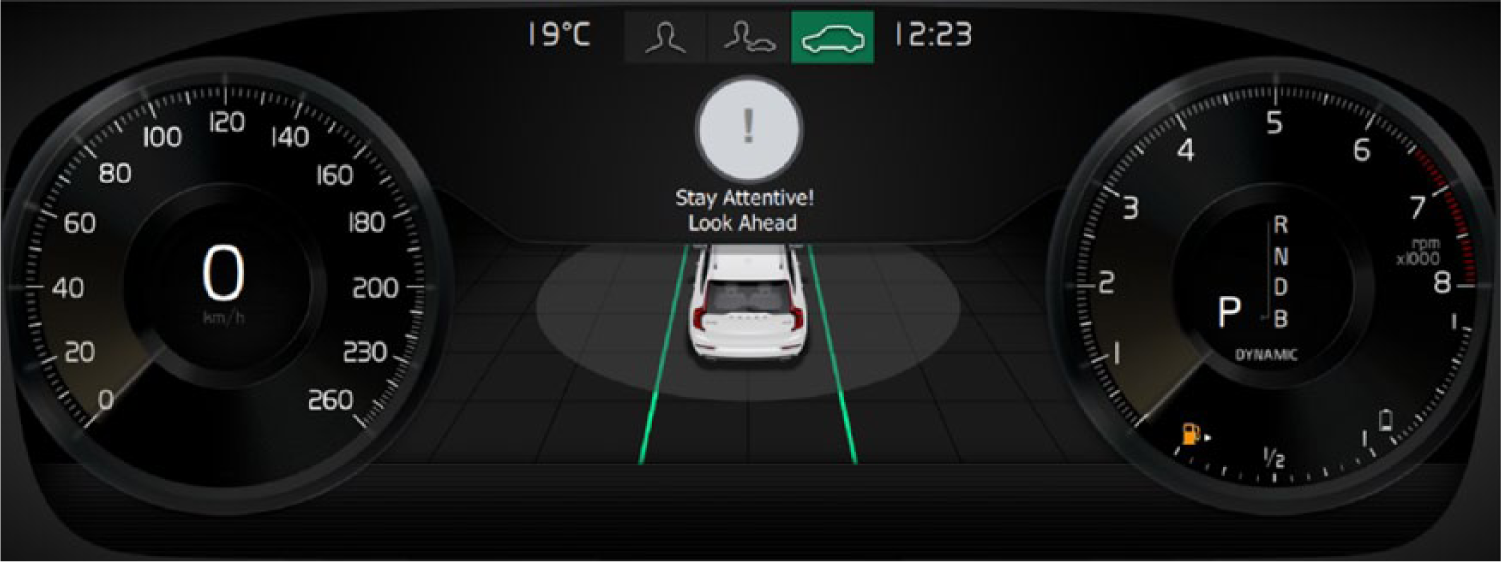
A custom supervised-automation human–machine interface with a Level 1 attention reminder.
The Level 1 reminder was a driver information message without sound (see Figure 3). It was issued if a single off-path glance longer than 3.4 s was detected or if the driver had been looking predominantly off path for a period of 12.0 s (total glance duration history). A Level 2 reminder was issued for single off-path glances longer than 7.0 s, if attention did not return to the road after having been issued a Level 1 warning, for eye closures longer than 3.0 s, or if the driver received a new Level 1 reminder within 10 s of a Level 1 or 2 reminder. The only visual design difference for the Level 2 warning was a red icon. In addition, the Level 2 warning was combined with a soft deceleration of the TV. The detection of eyes off path and triggering of warnings according to the specified algorithm was managed by a human “interaction wizard” watching driver face video from the back seat. No ARs were given while the participants filled in the SAM scale.
Experimental and scenario design
Prior to driving, participants were instructed to read a two-page driver manual, which emphasized the driver’s role as supervisor, the limitations of the vehicle, and the driver’s responsibility for the safety of the vehicle even while the automation was engaged. The manual also included information about override possibilities and the AR system. A key excerpt from these instructions follows: The car you will drive is a so called Supervised AD-car, which means that the car itself, under certain circumstances and on chosen road stretches, can control steering and adapt speed and distance. Due to limitations in the car’s sensor platform the driver can’t yet engage in non-driving activities, and you are instead expected to supervise the drive continuously, as you would in normal driving.
Halfway through the drive (about 15 min), a drift event occurred in which the TV slowly drifted into the left-adjacent lane. Participants had the possibility to override and steer the car back into the host lane. If they did not intervene, the TV eventually steered back into the host lane (after 8 to 18 s). A garbage bag was used as a conflict object when the LV performed the cutout maneuver after 30 min at the same location as the balloon car in Experiment 1a (see Table 1). However, in contrast to Experiment 1, the TV did not brake or warn the driver for the garbage bag.
Results
Eyes-off-path glances during all driving
Figure 4 shows cumulative eyes-off-path distributions with glance durations from all participants in Experiment 1 and Experiment 2 during all driving. The off-path glance distribution was clearly shifted toward shorter off-path glances in Experiment 2 (gray line) compared with Experiment 1 (black line). For reference, a log-normal reference model fit for naturalistic manual driving data is also included as a gray dotted line (Morando et al., 2018) similar to Strategic Highway Research Program 2 and 100-car baseline data. There were significantly fewer (U = 282.0, p < .05, r = –.32) off-path glance durations exceeding 2 s in Experiment 2 (Mdn2 = 7.0%) compared with Experiment 1 (Mdn1 = 11.3%), and there were significantly fewer glance durations exceeding 4 s (Mdn1 = 1.3%, Mdn2 = 0.4%, U = 266.0, p < .05, r = –.37). None of the participants had off-path glances longer than 8 s in Experiment 2, compared with one third (11/30) in Experiment 1, resulting in a statistically significant difference for %GDoff>8s between Experiments 1 and 2 (Mdn1 = 0.0%, Mdn2 = 0.0%, U = 288.0, p < .05, r = –.40).
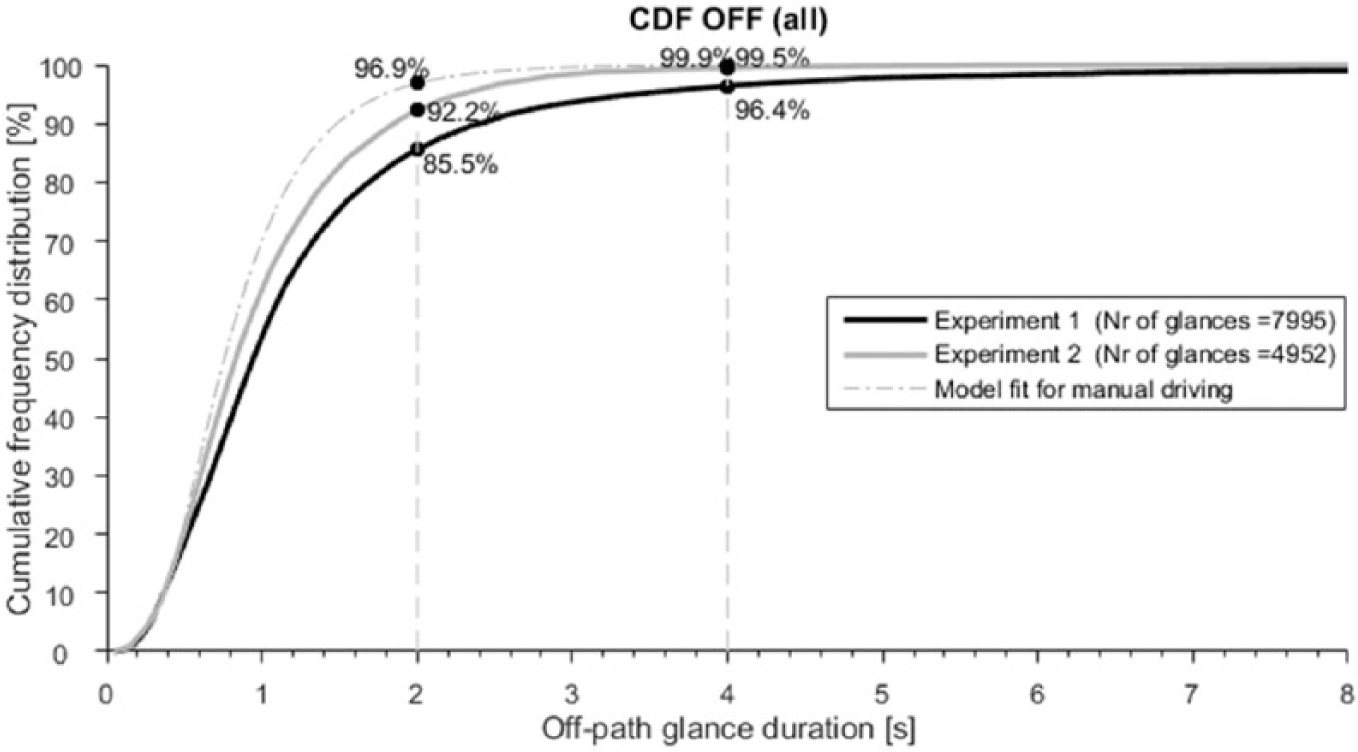
Empirical cumulative frequency distribution function (CDF) at aggregate level for off-path glance durations during all driving in Experiment 1 and Experiment 2. For comparison, a reference model fit for naturalistic manual driving data is also included (Morando, Victor, & Dozza, 2018). Cumulative percentage values at 2 s and 4 s are shown for all three distributions.
The overall off-path glance frequency per hour (GFoff/h) during all driving was higher in Experiment 2 (M = 664, SD = 205) than in Experiment 1 (M = 566, SD = 207), and PRC for all driving was still slightly higher in Experiment 2 (M = 81.6%, SD = 7.0%) than in Experiment 1 (M = 78.8%, SD = 11.3%).
Response Process
Crash involvement
Six out of 16 participants (38%) did not intervene when the car drifted over into adjacent lane, and 5 participants (31%) did not intervene and crashed into the garbage bag, showing no clear difference due to conflict type.
Eyes on path and hands on wheel prior to conflict
The average PRC of the 5 participants who crashed into the garbage bag was 83.6% in the time interval 10 to 15 s before the crash, 96.8% 5 to 10 s before the crash, and 100% during the last 5 s when the LV evasive cutout maneuver happened. None of the 5 participants who crashed with the garbage bag had their hands on the steering wheel at any time during the 15 s prior to the crash, whereas all 11 noncrashers had grabbed the steering wheel during the last 5 s of the conflict.
Subjective Data
Sleepiness
None (0/16) of the participants in Experiment 2 reported extreme sleepiness (KSS ≥ 8), in comparison with 10% (3/30) in Experiment 1. This difference was, however, not statistically significant (p ≥ .05).
Perception of the conflict object
Although four out of the five participants who crashed reported that they did not perceive the bag before the LV had evaded, all of the five participants who crashed had their eyes on path toward the bag when it actually was visible before the evasive maneuver (14 s before the conflict point).
Realization of the need to intervene
Twelve out of the 16 participants (75%) realized the need to intervene at some moment during the garbage bag conflict event; 4 did not.
Of the five participants who crashed, the most common themes in the responses to the question of realization of the need to intervene were trust in the car, that they realized it too late, and that they felt uncertain about how they were expected to act in accordance to their role as supervisors. For example, one participant said, When I approached the garbage bag I was almost on my way to steer but I did not because I thought the car would steer away from the bag. When you drive a car like this and know that the car does not evade for such things, then you take the steering wheel and evade by yourself. Now I did not know anything and did not know that I should act on my own.
The most common response (of the five participants who crashed) to why they did not intervene in the situation was that they trusted the car and thus believed it would act on its own, for example, “No I did not do it [intervene] because I trusted the car.” There were also responses stating that this is a controlled test and that it probably would not have been dangerous to crash into the target. Two participants out of the five who crashed expressed that they actively decided not to intervene.
Trust
Participants reported to what extent they trusted the car to handle the situation as neutral on average (M = 4.31, SD = 1.89), but the five participants who crashed reported higher trust (M = 6.20, SD = 0.84) than the participants who did not crash (M = 3.45, SD = 1.57).
These five participants were unable to explain the reasons that built up their trust in the car. Three of the five participants simply stated that they trusted the car completely. The other two both stated that they expected and required that the technology was developed enough to be able to handle situations like this, or else the car is not ready for use.
Discussion and Conclusions
The AR worked well to bring visual attention to more appropriate levels. In combination with instructions, the reminder removed extreme sleepiness and very long eyes-off-path durations (e.g., 4-s glances). The percentage of off-path glances longer than 2 s is somewhat lower in a reference model fit for naturalistic manual driving (Morando et al., 2018), and more work should be done to find out if these differences are due to differences between test track and real traffic. A lower threshold in the AR for the single off-path glance longer than 3.4 s would likely improve glance behavior, but driver acceptance issues would need to be studied. Note that longer off-path glances are an understandable consequence of a perceived reduction in need to update that the predictive (generative) model is proceeding according to plan (see Engström et al., 2017).
The novel finding in this study, however, is that looking at the road does not equate to acting upon a threat. The decision to act in a conflict situation hinges on the belief of whether the driver needs to act or if the car will act to resolve a conflict. Despite more specific instructions about the driver’s role to supervise and system limitations, during 30 min of driving, enough trust was built up that about one third of the drivers did not avoid the conflict or respond to the drift event. These drivers believed the car would intervene or did not realize or realized too late that they had to act on their own. Clearly, looking at the road and the conflict object is not the same as being in the loop, at least not for some drivers. Driver engagement not only is dependent on seeing a threat (a precondition for action), but it also requires recognition and a decision to act by physically engaging in braking and/or steering. Further, there was a higher level of trust in the vehicle to resolve the conflict among participants who crashed than among those who did not.
Thus it appears that although visual ARs and a medium level of instructions detail create more appropriate levels of eyes on path, they do not fully prevent crashes. The question remains, can we solve the problem of driver engagement (securing driver-in-the-loop) and communicating system limitations with more effective countermeasures?
Experiment 3
Will drivers avoid crashes if they have their eyes on threat, have their hands on wheel, and are explicitly told that they need to intervene for certain obstacles because the automation will not? An assumption in the development of automation is that drivers will be able to take on this fallback role for automation. Most of the human factors literature on driver-in-the-loop assumes that an attentive and fallback-ready driver will intervene to avoid crashes. That is, the assumption is that a decision to act (cognitive control of action; Miller & Cohen, 2001) will automatically follow upon threat perception.
In Experiment 3 we aimed to understand the effect of a high level of instruction detail and two supervision reminder types (AR and AR&HoW) on supervision and conflict intervention performance in two conflict scenarios (stationary car partially in lane and a garbage bag). Participants were given highly detailed instructions that explicitly stated that the vehicle would not brake for certain events. They were also given one of two different supervision reminder types: an improved AR or an AR&HoW. Do these countermeasures prevent crashes?
Method
Participants
Sixty test participants were included in the final sample, 18 female and 42 male. Ages spanned from 26 to 65 years (M = 45.2, SD = 9.6) and driving experience from 1 to 47 years (M = 25.3, SD = 10.4).
Materials
The following differences to general methods were introduced. The original XC90 driver information display was modified to display a custom supervised-automation HMI (the same as in Figure 3, except with different icons and messages); see Figure 5. It also displayed two types of supervision reminders; see Figure 5. Half of the participants received ARs only and were not reminded to keep their hands on wheel, and half of the participants received an integrated AR&HoW, where they were reminded to keep eyes on path and hands on wheel; see Figure 5. Reminders were also sent while the participants filled in the SAM scale.

Supervision reminder messages used in Experiment 3. Left: Attention reminder message. Right: Hands-on-wheel reminder message. In AR, only the left message was used; in AR&HoW, both messages were used.
The AR was updated based on the feedback received in Experiment 2. Three levels of visual reminders were used. Level 1 reminders were issued in the instrument cluster behind the steering wheel if participants had been looking predominantly off path during a period of >17.0 s (total glance duration history). Level 2 reminders used the same message but added a sound and were triggered either by a 3.4-s off-path glance, by an eye closure longer than 3.0 s, or if the driver received a new reminder within 10.0 s of a Level 1 or 2 reminder. Level 3 reminders were issued as a text (“Autopilot deactivated–Driver inattention”) with a hands-on-wheel icon and a more urgent sound if a 15-s glance off path or a 15-s eye closure was detected, if the driver was glancing more than 75% off path in a period of 20 s (glance history), or if the driver received a third Level 2 reminder within 15 s.
The AR&HoW used the same messages as the AR for visual inattention but added two additional hands-on-wheel reminder levels. Level 1 hands-on-wheel reminders were issued in the instrument cluster and showed an icon of two hands gripping a steering wheel, with a message saying “Driver inattention–Apply steering.” Level 1 reminders were issued if hands were off the steering wheel for more than 5.0 s. Level 2 hands-on-wheel reminders used the same message and icon but added a sound and were issued if hands were off the steering wheel for more than 10.0 s. Thus, a driver could experience both ARs and hands-on-wheel reminders at different periods during the same trip.
Experimental and scenario design
Study 3 employed a between-group design with two independent variables: supervision reminder type and conflict event type; see Table 1. All 60 participants had the same training and instructions. To study the additional effect of hands on wheel, 30 participants drove the system with only an AR (Conditions 3a and 3b; Table 1), and 30 participants drove the system with both a hands-on-wheel reminder and an AR (Conditions 3c and 3d; Table 1). To study differences between the conflict types, after 30 min the vehicle encountered either the same garbage bag as in Experiment 2 or the same balloon car as in Experiment 1a (car partially in lane), resulting in four conditions with 15 participants in each (Table 1).
Instructions in Experiment 3 were highly detailed. Participants attended a 30-min classroom training prior to their drive. The time between attending the course and participating in the tests varied from 1 day to 2 weeks between participants. Six participants did not participate in the classroom training for different reasons and instead underwent the training with a test leader at the test track the same day as their participation in the test. The training covered these areas:
Driver responsibilities
The driver is responsible and should monitor, supervise, and intervene whenever needed. The driver is active and attentive at all times and supervises the traffic so that the car is driven in a safe manner for passengers in the vehicle and surrounding traffic. Sensors and cameras judge the driver’s ability to actively supervise the automation and traffic and detect if the driver has hands on the steering wheel (for Conditions 3c and 3d) or if the driver looks on the road. Drivers will get notifications after periods of inattentiveness or inactivity, and the system will deactivate after a longer period of inactivity.
System limitations
Objects and obstacles in the traffic environment, such as potholes in the roadway, high curbs, and objects on road, are not detected. Obstacles can also be falsely detected as lane markings and thus pose a risk that the car will collide with these obstacles. Cameras and sensors have a limited field of view. Indistinct lane markings might lead to erroneous steering by the automation. Other limitations may occur with road design (e.g., road works), oncoming vehicles, pedestrians, and animals. There are restrictions in steering/braking/acceleration force that can be applied by the system.
Instruction videos
Videos were shown regarding risk scenarios, including a video showing when a car starts to depart from the roadway and the driver needs to steer back and can then let the function resume. A risk scenario where the function does not detect obstacles in the roadway was explained, in which the driver needs to brake and/or steer away from the obstacle and, after that, let the function resume control.
Results
Response Process
Crash involvement
Figure 6 shows crash involvement with the garbage bag or balloon car in Experiments 2 and 3. There was an average of 28% (21/76 drivers) crash involvement with all the bag and car conflicts. Figure 6 shows that crash involvement ranged from 20% (3/15) for balloon car conflicts in Experiment 3 without hands on wheel to 33% (5/15) for balloon car conflicts in Experiment 3 including the hands-on-wheel conditions. There were no statistically significant differences across test conditions (p ≥ .05). Hands on wheel did not improve crash outcomes. There was even a slightly higher crash involvement with AR&HoW, compared with just the AR, as shown in Figure 6. In addition, 38% (6/16) did not intervene when the car drifted over into the adjacent lane in Experiment 2.
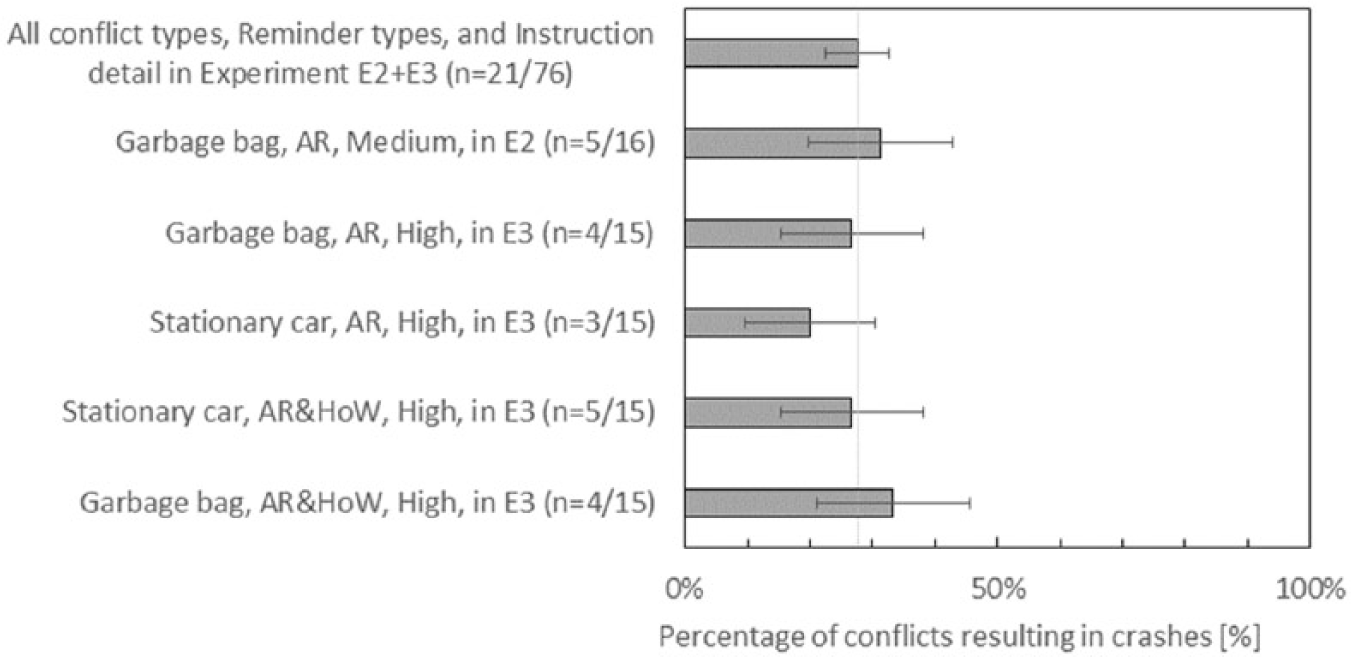
The percentage of conflicts resulting in a crash are indicated on the x-axis for each condition in Experiment 3 (E3) and in Experiment 2 (E2). The type of conflict involves either a stationary car or a garbage bag. The integrated hands-on-wheel-and-attention-reminder condition is indicated as AR&HoW, and the attention reminder based on visual attention only, as AR. The level of instruction detail is indicated as medium or high. The error bars show the standard error of mean for each group.
Eyes on path and hands on wheel prior to conflict
Figure 7 shows the average PRC (top panel) and percentage hands on wheel (bottom panel) during three 5-s time intervals prior to the conflict anchor. The participants in Experiment 1 (without AR) had a lower average PRC at 76.4% (N = 30) during the first time interval than the participants in Experiments 2 and 3 (including both types of supervision reminders) that had an average PRC at 93.0% (N = 76) when including all conflicts with potential collision objects. This difference was statistically significant (Mdn1 = 89.0%, Mdn2+3 = 100.0%, U = 1263.5, p < .05, r = –.27). The hands-on-wheel condition in Experiment 3 (N = 30) compared to no hands on wheel in Experiments 2 and 3 (N = 46) also increased the level of PRC in the 10- to 15-s interval prior to the conflict from 90.7% to 96.5%, but this finding was not statistically significant (MdnAR = 100.0%, MdnAR&HoW = 100.0%, U = 1256.0, p ≥ .05, r = .15).
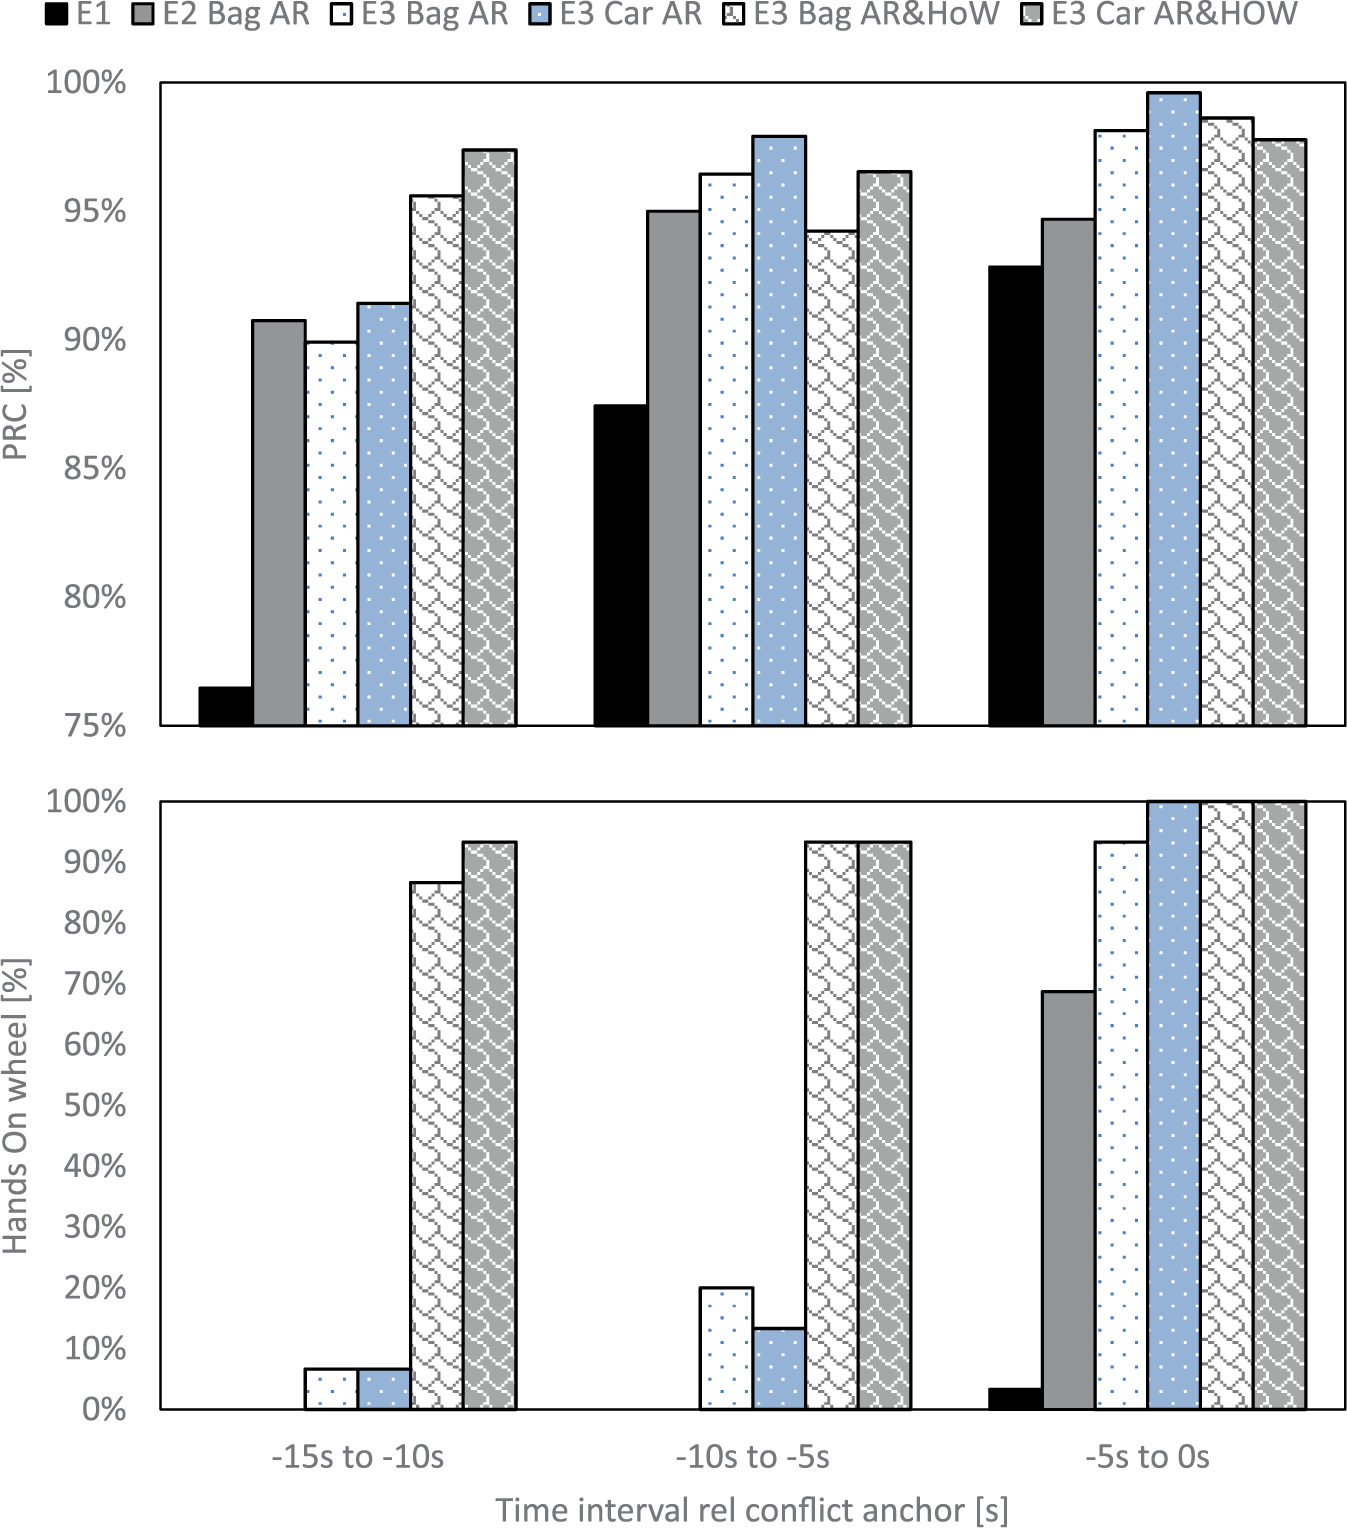
Percentage road center (PRC; top panel) and percentage hands on wheel (bottom panel) for three time intervals leading up to the conflict anchor time. The legend explains the individual conflict setups, including all three experiments (E1, E2, E3), type of conflict scenario (garbage bag [bag] or balloon car [car]), and supervision reminder type (attention reminder [AR] or integrated hands-on-wheel-and-attention reminder [AR&HoW]).
About half of the 16 participants who crashed had off-path glances during the three consecutive time intervals prior to the crash (50%, 56%, and 38%), whereas the corresponding values were lower for the 44 participants who did not crash (25%, 18%, and 7%).
None of the participants (0/7) who crashed in the AR-only condition had their hands on wheel 15 s before collision, whereas most of the crashers in the hands-on-wheel condition did (78%, 7/9).
Subjective Data
Sleepiness
Two participants reported extreme sleepiness (KSS ≥ 8) in Experiment 3, but none fell asleep. There is no statistically significant difference in extreme sleepiness between Experiment 3 (3%, 2/60) and Experiment 2 (0%, 0/16) (p ≥ .05) or between Experiment 3 (3%, 2/60) and Experiment 1 (10%, 3/30) (p ≥ .05).
Perception of the conflict object
Six of the participants who crashed reported that they did not perceive the target until the LV had evaded, and one was unsure. All of these seven who crashed had their eyes on path toward the target when it actually was visible prior to the LV cutout maneuver (14 s before the conflict point).
Realization of the need to intervene
Fifty-two out of the 60 participants (87%) realized the need to intervene at some moment during the conflict; 8 did not. Analysis of the responses of the 16 participants who crashed is presented next.
Of the 16 participants who crashed, the most common response theme (by 11 participants) was that they realized too late that they needed to intervene to be able to do anything about it, for example, “Well yes, but it was really late. At first I thought, no it might handle this…” or “No I probably did not realize that. It was afterwards.” Three participants who crashed said that they realized in an early stage that they had to intervene. Three others mentioned the feeling of trust, or that the car was in control, as an explanation to why they did not realize the need to act, for example: “I will have to say no then, since I did nothing . . . [I] perceived that the car had control.” The participants either realized too late that they had to intervene or they believed that the car would avoid a collision. The main reason for acting both too late and not at all was trust in the car.
Trust
The participants in Experiments 2 and 3 rated trust at 4.50 on average (SD = 2.10), and the participants who crashed rated a higher trust (M = 6.24, SD = 0.62) compared with the ones who did not crash (M = 3.84, SD = 2.09).
The participants who crashed also reported high levels of trust in the car, and two answers in particular kept recurring when they were asked to explain why. The first was that they simply expected the car to be able to handle the situation. The other common answer was that they felt safe during the drive, which some participants explained as good driving performance in lane keeping and distance keeping to the LV. Some example comments follow:
Was there any special reason for you to trust the car a lot?
It never felt unsafe at any point in how it adapted its speed. . . . It did not feel like it was unsure about the positioning in the roadway or that it came too close or far away from the car ahead, so yes it just felt stable.
Was there any special reason for you to trust the car that much?
Nah I thought that the systems in the car would, since it was a direct obstacle and that it had braked towards the lead car all the time. Because the car had acted error-free during the drive thus far.
General Discussion
The synthesis in Figure 8 indicates the extent to which the countermeasures affected behavioral and crash outcomes and are discussed below.
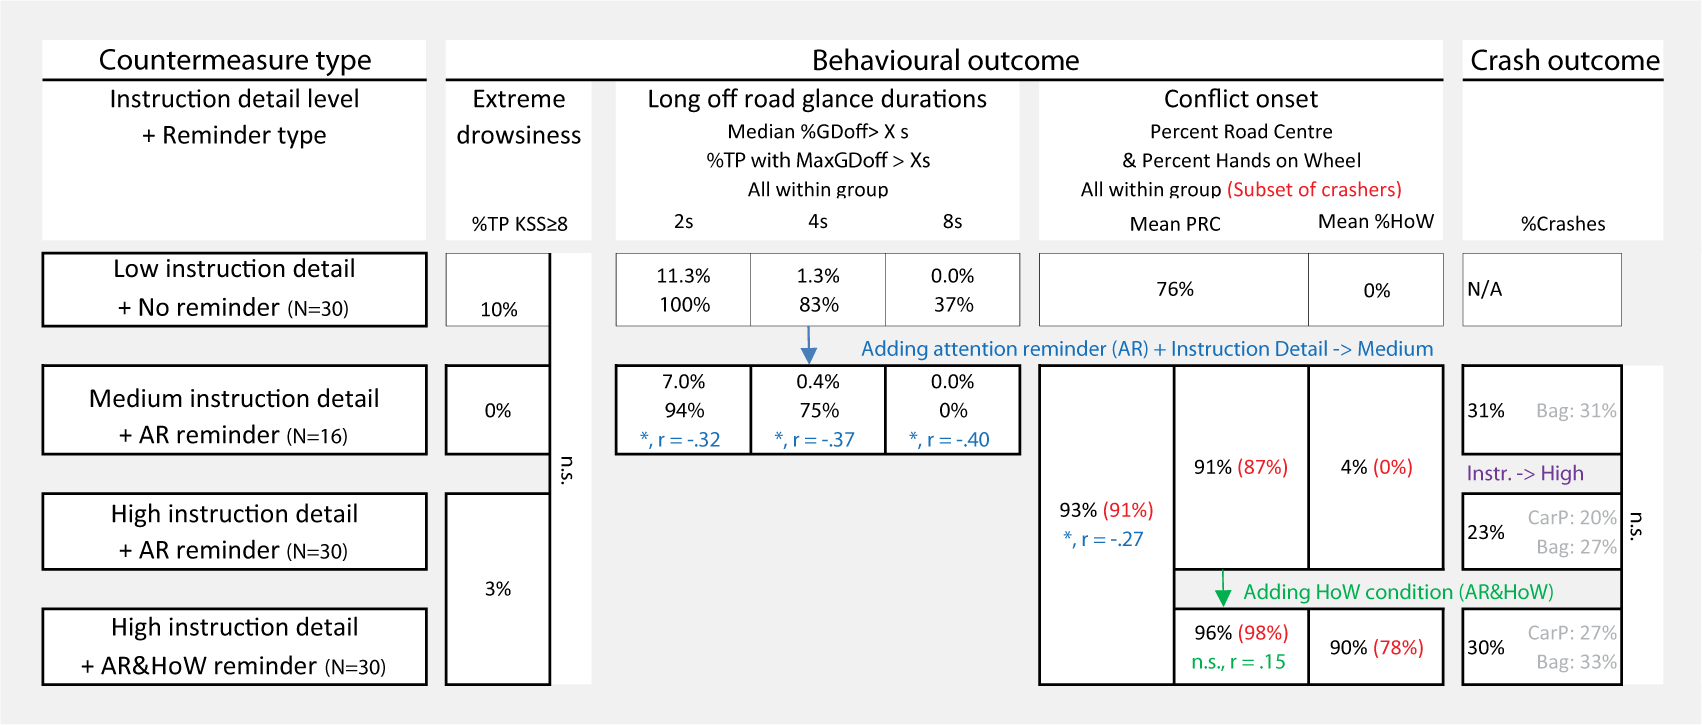
Synthesis table over effects of countermeasures on behavioral and crash outcomes.
Encouragingly, the visual AR and hands-on-wheel reminders worked, that is, they produced high levels of visual attention and hands on wheel prior to the conflict and during all driving. It is also likely that the AR effect can be enhanced further by affecting vehicle control algorithms, which has been shown to improve eyes on road in highly automated vehicles (Price, Lee, Dinparastdjadid, Toyoda, & Domeyer, 2017).
However, these results also indicate that “eyes on path” is not sufficient to secure driver crash outcome performance for all drivers in all situations. Thus, even though off-path glances at the time of a conflict is known to be a major factor in crash involvement (e.g., Victor et al., 2015), looking at the road should be seen as a necessary, but not sufficient, precondition for drivers’ understanding of when they need to act. To avoid crash involvement, drivers need not only to be able to see the threat; their prediction of whether the automation will brake or steer to avoid a conflict must also be correct. The key contribution of this research is in controlling for the separate effects of eyes on road and hands on wheel (sensory-motor components) from understanding and expectation to act (cognitive components). Supervision and monitoring problems have largely been assumed to be caused by not looking rather than by cognitive components (e.g., Lee et al., 2017; Merat et al., 2018; Parasuraman et al., 2008; Parasuraman & Manzey, 2010).
Neither of the two investigated countermeasures for securing driver engagement (supervision reminders) and avoiding mental model misconceptions (driver instruction/education) was completely effective at preventing crash involvement. Contrary to expectations regarding driver training (Beggiato & Krems, 2013; Payre et al., 2015; Sarter & Woods, 1995), that is, despite explicit and detailed instructions on specific system limitations in risk scenarios, 28% of the drivers still crashed. As for supervision reminders, even when drivers both had their eyes on the road and their hands on the wheel, 30% of the drivers still crashed. In general, these results are in line with Onnasch et al.’s (2013) meta-analysis of 18 studies, which found that operators have a reduced awareness of the situation or operating environment during automation and show difficulty troubleshooting and recovering if something goes wrong with the automation or if something unexpected happens.
The subjective data indicate that the drivers who crashed in the current studies mistakenly believed that highly reliable automation could solve more emergency situations than it actually could, thereby confirming irony of automation (Bainbridge, 1983). Overtrust (Hoff & Bashir, 2015; Lee & See, 2004) and expectations seem to be intimately related. In fact, expectations seem to matter so much that some drivers can have their hands on wheel and eyes on threat and still crash because they expect and trust the system to act. This is summed up some quotes: “No I did not do it [intervene] because I trusted the car,” and “At first I trusted the car. I thought that the car would brake or stop, thus I did not act. Actually I should have braked but when I was going to brake it was too late.” Thus, a central problem to address in further research is potential gaps and misconceptions in drivers’ mental models and transparency of automated systems, as argued by Sarter and Woods (1994) and Endsley (2015).
The results also address first-failure effects, or circumstances in which an operator encounters perfect automation for some period, and then “complacency” or overtrust in automation is reflected by a very poor response when the automation fails (Metzger & Parasuraman, 2005; Molloy & Parasuraman, 1996; Wickens et al., 2009). In the current experiments, the automation preceding the conflicts was largely perfect. However, in Experiment 2, the garbage bag conflict, where 31% crashed, was preceded by an unexpected lane drift event 15 min earlier, where 38% did not intervene. This result may indicate that exposure to one conflict type does not necessarily mitigate the outcome in a subsequent conflict type or may indicate that trust is regained in 15 min (in agreement with the quick regaining of trust in Hergeth, 2016).
Hoff and Bashir (2015) differentiate between initial learned trust—automation trust in advance of interaction with a system—and dynamic learned trust—which responds to the variable performance of automation. Although the former may be influenced by driver training and instruction, the present results demonstrate the importance in future research of understanding how dynamic learned trust from ongoing usage experiences of a system may override initial learned trust.
These results should be tempered by the experimental limitations. In particular, the realism, or real-world representativeness, of the experiments is lacking. The drivers knew they were participating in a study, there were test leaders present in the vehicle, they were on a test track without traffic in adjacent lanes, and the stationary balloon car did not look like a real car. For these reasons, it is currently not possible to precisely assess whether similar results would appear in naturalistic driving. Interestingly, these limitations apply to most every experiment in driving simulators or on test tracks and thus should be part of a larger discussion on to what extent results from studies in these environments can be extrapolated to the real world.
Summary and Concluding Discussion
The results uncover the important role of expectation mismatches, showing that a key component of driver engagement is related to cognitive control (understanding the need for action), rather than purely visual (looking at the threat) or having hands on wheel. Experiment 1 showed that without attention or hands-on-wheel reminders and with limited instructions, drivers became highly inattentive and disengaged. Experiments 2 and 3 showed that supervision reminders are an effective way to maintain eyes on path and hands on wheel. However, a level of sensory-motor engagement does not equate to satisfactory conflict intervention performance for all drivers, even when explicit instructions are given regarding the need for driver intervention. Monitoring and supervision involves a stronger cognitive component of understanding and expecting to act than has been identified in previous research.
The idea that all drivers can act as a fallback in highly reliable automation is thus not supported. Consequently, drivers cannot be completely relied upon to fill in for automation because there may not be enough time for them to act once they notice the automation does not act. The results from these experiments confirm that irony of automation may also apply to the driving domain—the better the automation, the less attention drivers will pay to traffic and the system, and the less capable they will be to resume control.
Going forward, two main solution alternatives present themselves: either the automation is designed so it does not rely on the driver (as in unsupervised automation), or it is designed so that the driver unmistakably understands that it is only a driving assistance system (a teammate) that needs an active driver who shares control at all times (at least when using highly reliable, near-perfection automation as tested here). Perhaps further research using the shared-control paradigm (Mulder, Abbink, & Carlson, 2015) or adaptive automation (Parasuraman et al., 2000), for example, in the form of adaptive vehicle control or warning/intervention algorithms that respond to driver engagement analysis (e.g., Price, et al., 2017), are viable ways forward. Note that if drivers do understand the limitations of the automation, or if drivers do not overtrust the automation, then conflicts can easily be handled, as indicated by the majority (72%) of drivers who easily avoided the conflicts.
On the whole, the results identify the strong role expectation mismatches and mental models play in human factors and automation. These results show what may happen if the system is perceived to have more capability than it actually has. Thus, it does not only matter whether drivers are looking at the road or have their hands on the steering wheel; it also matters what they think the technology can and will do. This situation can be likened to the expectation mismatches encountered in sports when two players mistake who will catch a fly ball or hit a badminton birdie and it falls between players. As with coordination between athletes, there should be no doubt in the driver’s mind that he or she is in the lead, that he or she can and should act, and that automation has a supportive role only. Promising approaches for further research on understanding and modeling underlying cognitive control mechanisms include predictive processing (Clark, 2013; Engström et al., 2017, p. 170) and N-SEEV (Wickens et al., 2009). The degree to which the predictive processing interpretation—an incorrect “generative model”—explains this effect (as argued here) remains to be tested. Alternate explanations, such as change blindness (Simons & Levin, 1997) or inattentional blindness (Mack & Rock, 1998), are more related to limitations in perception or memory. Arguably, participants were attending but incorrectly predicting.
Evidently, the “supervising role” is more challenging to understand than we previously thought and seems to contain a key cognitive-control engagement component (understanding in the mind the need for action) in addition to a visual/manual engagement component (looking at the threat, ready to act). The education and instructions did not have the desired effect, so more research is needed to understand how we should communicate system limitations so that drivers understand what they should be watching out for.
Practical Implications
Attention and hands-on-wheel reminders are effective at improving visual monitoring (eyes on path) and getting the driver to have his or her hands on wheel.
Dynamic learned trust, achieved through driving with highly reliable automation, may override education and training about the system’s crash avoidance limitations in conflict events.
Automation needs to be designed either so it does not rely on the driver (as in unsupervised, delegated automation) or so that the driver unmistakably understands that it is an assistance system (a teammate) that needs an active driver to share control at all times. Solutions further emphasizing a driver who leads or directs automation are needed to achieve correct expectations and mental models of system limitations.
Key Points
Understanding the need to act is a crucial component of driver engagement in automation.
Expectation mismatches between automation and drivers led to a 28% crash involvement despite drivers having eyes on threat.
Supervision reminders effectively recover and maintain eyes on path and hands on wheel.
Supervision reminders and explicit instructions on system limitations and supervision responsibilities did not prevent overtrust and mental-model misconceptions for all drivers.
Footnotes
Acknowledgements
This research was supported by the Swedish FFI project ADEST, Grant No. 2014-06012, within the Drive Me program. The authors would like to thank John D. Lee for valuable comments.
Trent W. Victor received his PhD in psychology in 2005 from Uppsala University, and he is the Senior Technical Leader Crash Avoidance at Volvo Cars Safety Centre. He serves as an adjunct professor at the Department of Mechanics and Maritime Sciences at Chalmers University of Technology and the University of Iowa.
Emma Tivesten received her PhD in applied mechanics in 2014, and a MSc in mechanical engineering from Chalmers University of Technology in 1994. She is currently a research leader at Volvo Cars Safety Centre where her main focus is on driver behavior in manual and assisted driving.
Pär Gustavsson received his MSc in cognitive science in 2011 from Linköping University, and is a human factors specialist working with research on driver behavior, active safety systems, and autonomous vehicles. He has six years of experience working with human factors and safety in the nuclear and automotive industry.
Joel Johansson received his upper secondary qualification in 2006 from Östrabogymnasiet, and is an active safety analysis engineer working with research on driver behavior, active safety systems, and driving automation systems. He has six years of experience working with human factors and safety in the nuclear and automotive industry.
Fredrik Sangberg received his MSc in mathematical statistics in 2016 from University of Gothenburg, and is a first analysis engineer with a background in mathematical statistics. He has been working at Volvo Cars Safety Center for the last two years with data analysis and data processing of experiments and field operational test data.
Mikael Ljung Aust received his PhD in applied mechanics in 2012 and a MSc in cognitive science from Linköping University in 2002. He is currently a technical expert at Volvo Cars Safety Centre where his main focus is driver behavior in manual and assisted driving as well as evaluation of ADAS performance with drivers in the loop.