
Abstract
Objectives:
To (1) determine the weight-reducing effect of the Koa Family Program (KFP), a community-based, telewellness obesity intervention and (2) examine the impact of the KFP on improving weight-related health indicators.
Design:
Randomised controlled trial.
Setting:
Community-based in Sacramento, California, USA.
Methods:
Seventy women with overweight or obesity (25 ⩽ BMI < 40), aged 21–45 years and with low income (⩽ 185% of the US Federal Poverty Level) were randomly assigned to an intervention (n = 34) or control (n = 36) group. Data were collected by phone-administered questionnaire at weeks 0, 18 and 25. The intervention consisted of three components: (1) weekly, health coach-led, health education meetings on Zoom; (2) social media support through texting and private Facebook groups; and (3) a tree planting and stewardship campaign. The treatment effect on outcome measures (95% confidence intervals) was analysed with adjustment for variables including age, race/ethnicity, education and intake of fruit and vegetables.
Results:
The overall treatment effect of the KFP was weight loss at both Week 18 (–7.69 pounds [p < .000; 95% confidence interval (CI) = −11.97 to −3.41]) and Week 25 (−7.72 pounds [p = .002; 95% CI = −13.02 to −2.42]) of the study. KFP-associated improvements in diet, physical activity, stages of change and self-efficacy were also observed.
Conclusions:
The KFP resulted in weight loss significant at individual and population levels.
Introduction
The prevalence of obesity among adults in the USA has been rising steadily since the late 1970s (Fryar et al., 2020). It is predicted that by 2030, nearly half of all adults in the USA will be obese (Ward et al., 2019). Obesity is strongly associated with elevated morbidity and mortality related to cardiovascular disease, type 2 diabetes, cancer and other chronic diseases (Abdelaal et al., 2017). Obesity is also associated with a higher risk of COVID-19-related death (Williamson et al., 2020). Furthermore, Bhutani et al. (2021) have described pandemic-related weight gain in the USA. Given these concerning trends, there remains a need to develop effective interventions to address the ongoing obesity epidemic. Women represent a population of particular concern since their obesity prevalence and weight-related morbidity and mortality risks are considerably higher than men (Kapoor et al., 2021).
The objectives of this study were to: (1) determine the effect of the Koa Family Program (KFP), an obesity intervention using telewellness and community-based, health education approaches, on reducing overweight/obesity among women with low income; and (2) examine the impact of the KFP on improving weight-related behavioural and health indicators among women with low income.
Methods
Study design
A prospective, randomised controlled trial (RCT) was used to determine the effects of the KFP on study participants. Since the trial met the requirements for a minimal risk research project, the study protocol underwent expedited review and was approved by the University of California, Davis Institutional Review Board. The study was registered with ClinicalTrials.gov (NCT04662593).
Power calculation
Based on an online sample size calculator developed by the University of California, San Francisco (Kohn and Senyak, 2020), a study population of 63 intervention participants and 63 control participants was estimated to provide 80% statistical power to detect an effect size observed as a 5-pound difference in mean weight between intervention and control groups. This calculation assumed a standard deviation for participants’ weight of 10 pounds.
Recruitment and group assignment
Participants were recruited from the Sacramento, California region between December 2020 and February 2021, using four techniques: (1) StudyPages, a study recruitment and engagement platform (Yuzu Labs PBC, 2022); (2) flyer distribution in local parks; (3) Facebook advertising and Zoom presentations to community groups; and (4) in-person, email, text message, social media and telephone outreach through 19 partners including city departments, schools, neighbourhood associations, low-income housing organisations and social service providers. Written informed consent from participants meeting study criteria was obtained via DocuSign (DocuSign Inc, 2014). Participants received a copy via email for their review and signature, and a fully executed email copy after signature.
A study statistician (DJT) prepared the stratified permuted block randomisation with strata defined by city region (North vs South), using Stata/SE Version 15 software (StataCorp LLC, 2016). To ensure allocation concealment, the randomisation schedule was uploaded into the REDCap randomisation module (Harris et al., 2009) by a research staff member not directly involved in participant recruitment. Participants were assigned with this method into either the intervention or control group. Figure 1 displays participant recruitment in accordance with the Consolidated Standards of Reporting Trials 2010 Statement (Schulz et al., 2010).
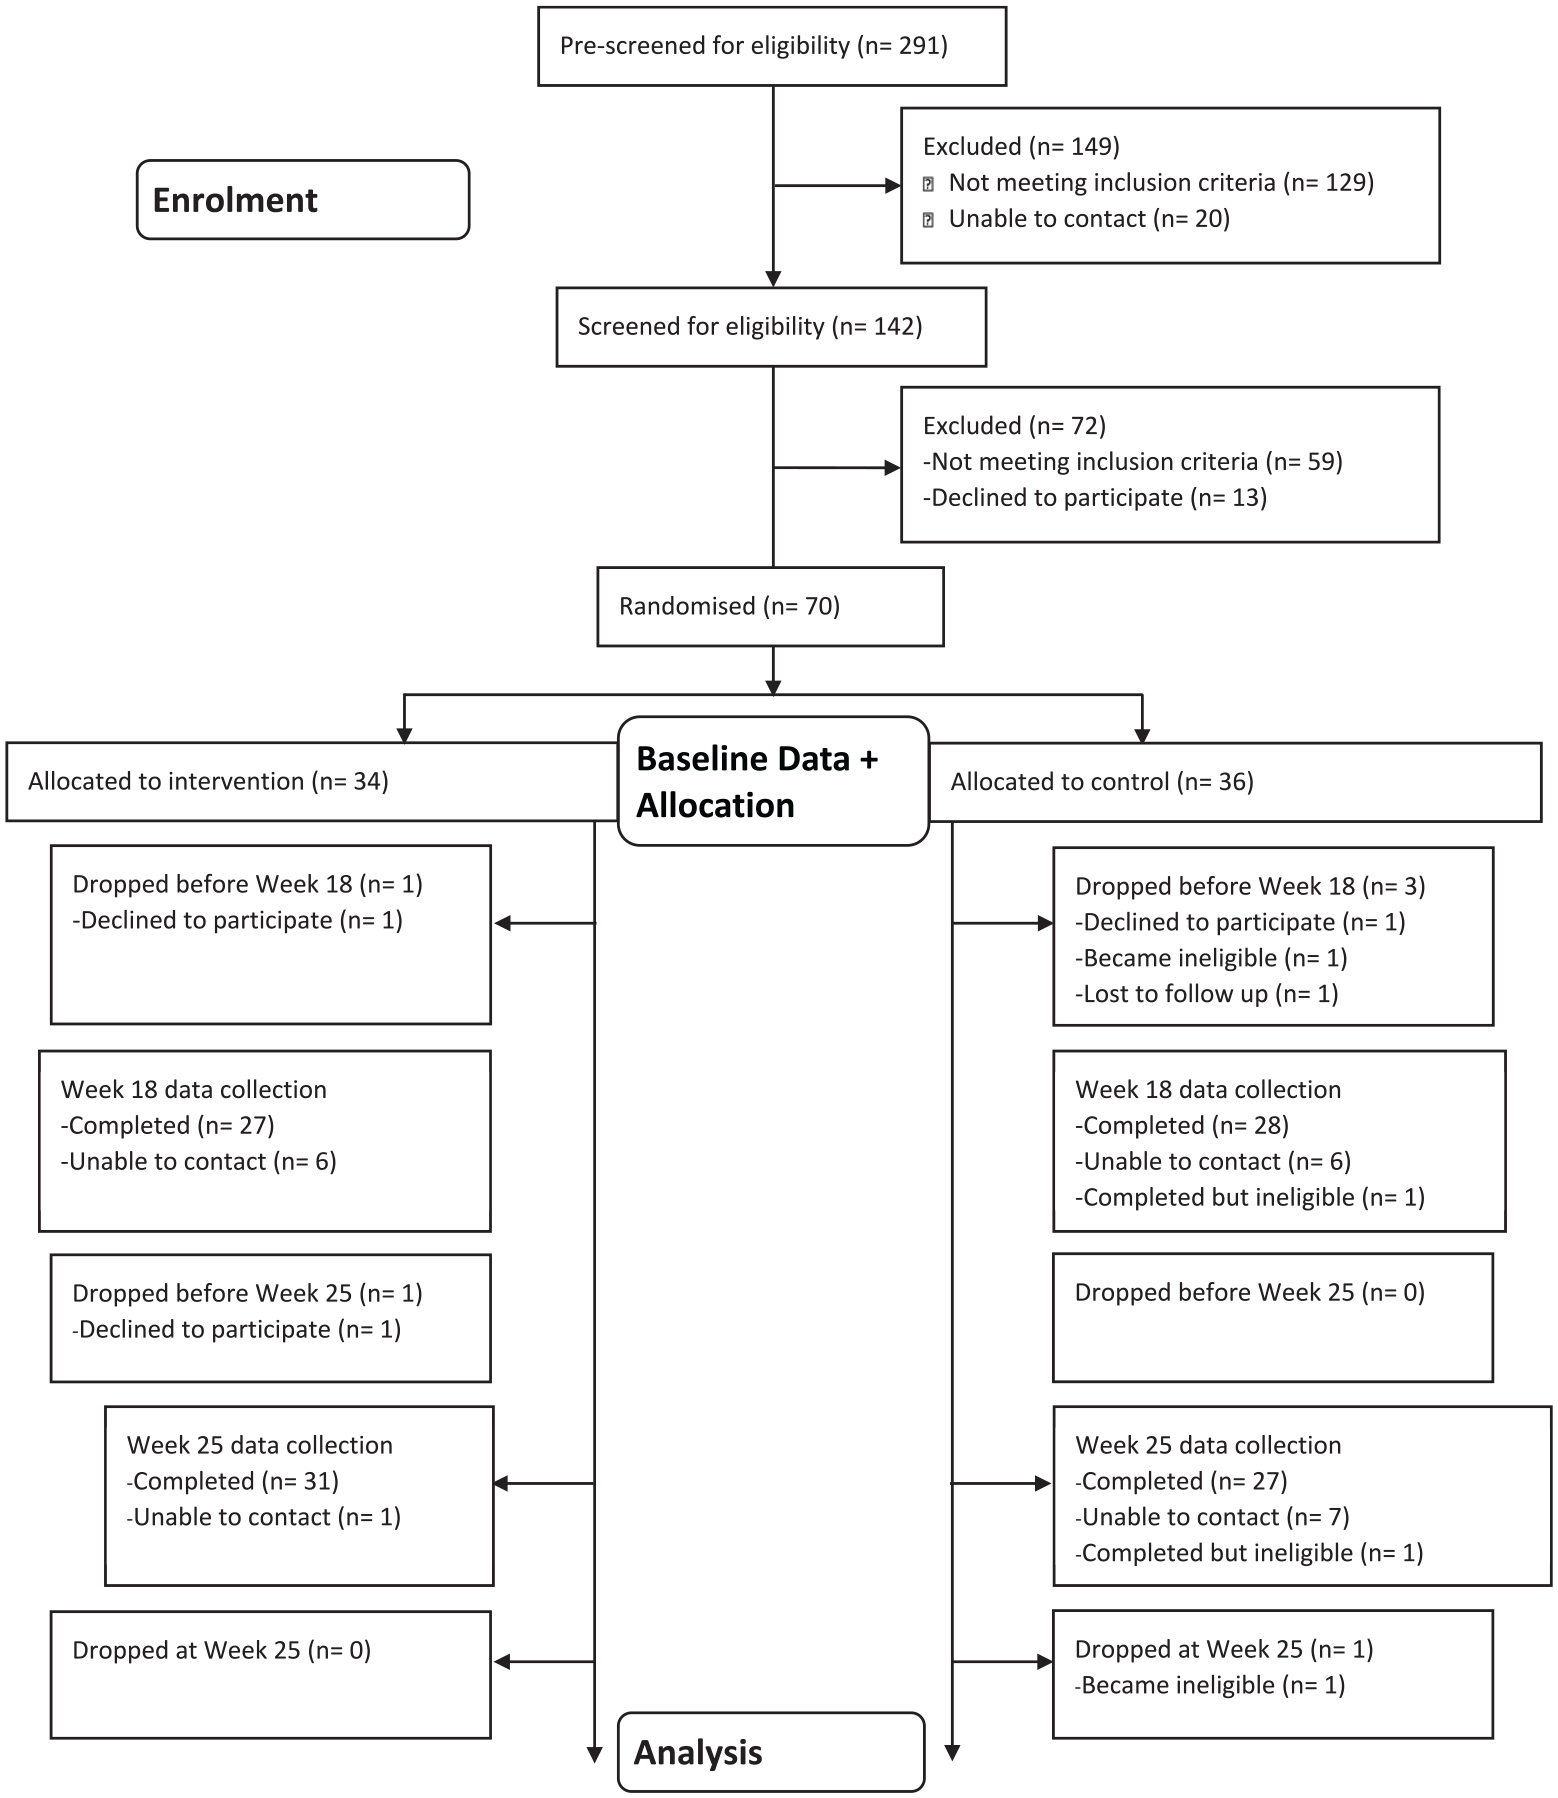
CONSORT diagram. This diagram details the recruitment, screening, enrolment and retention of participants (n = 36; n = 34).
Seventy women with overweight or obesity (25 ⩽ body mass index [BMI] < 40) aged 21–45 years, living in the Sacramento area, and CalFresh-eligible (household income ⩽ 185% of the Federal Poverty Level) at study entry were randomly assigned to the KFP intervention group (n = 34) or control group (n = 36). Of these 70 women, 5 participants reported having diabetes; they received clearance for study participation from their physicians. Study exclusion criteria included current pregnancy or intention to become pregnant, current breastfeeding, current mental illness or eating disorder that would be aggravated by participating in the study, receiving nutrition therapy from a health provider, having had or currently considering bariatric surgery, taking weight-reducing medication, patients with diabetes without medical clearance from a physician, unable to speak and read English fluently, no access to Internet and plans to relocate within the study period. A history of heart disease was not an exclusion criterion nor was it assessed as part of participant screening. Women with BMI ⩾ 40 were excluded since individuals in this high-risk category could likely require medical or surgical intervention.
Intervention group
The KFP comprised three components: (1) the Whole Health Program (WHP), (2) social media support and (3) a tree planting and stewardship campaign. The WHP consisted of 17 weekly, 90-minute, interactive, health education sessions on Zoom, facilitated by a lay health coach. Two health coaches were assigned to two groups each, and a third coach facilitated one group. Two of the coaches were recruited by a community partner, Lead4Tomorrow, and one coach was the communication specialist on the study team (C.D.). All the coaches were women, one was Asian, another was Black and a third was White. They were all within the age range of the study participants and lived in the Sacramento region. The coaches were trained for approximately 8 hours by two of the investigators (D.R.B. and N.D.K.) to ensure they were well-versed on all intervention content, the use of Zoom, the study protocol and their roles and responsibilities.
The WHP was delivered to five groups, each with the same 5–10 members over the duration of the intervention. Session topics included: nutrition, physical activity and related lifestyle and environmental factors conducive to weight loss, such as resilience (Walker et al., 2019), social connection (Calle et al., 2003) and an environment with adequate tree canopy (Ulmer et al., 2016). The complete list of topics is displayed in Table 1. The content and structure were based, in part, on the US Centers for Disease Control and Prevention’s Prevent T2 Program (Centers for Disease Control and Prevention, 2016), the US Department of Agriculture’s MyPlate resources (US Department of Agriculture) and Family Hui (Lead4Tomorrow, 2014), a peer-led programme to reduce trauma and increase positive parenting skills. All KFP materials, however, were specifically designed for the study population and incorporated additional evidence-based content and a more integrated perspective than the individual source materials. Each participant had up to three, 15-minute personal check-ins with her coach over the course of the 17-week intervention. The participants received booklets and other WHP support materials at the beginning and mid-point of the programme. Four participants were also lent a tablet to enable them to participate in the Zoom sessions.
Koa Family Program foci by session.
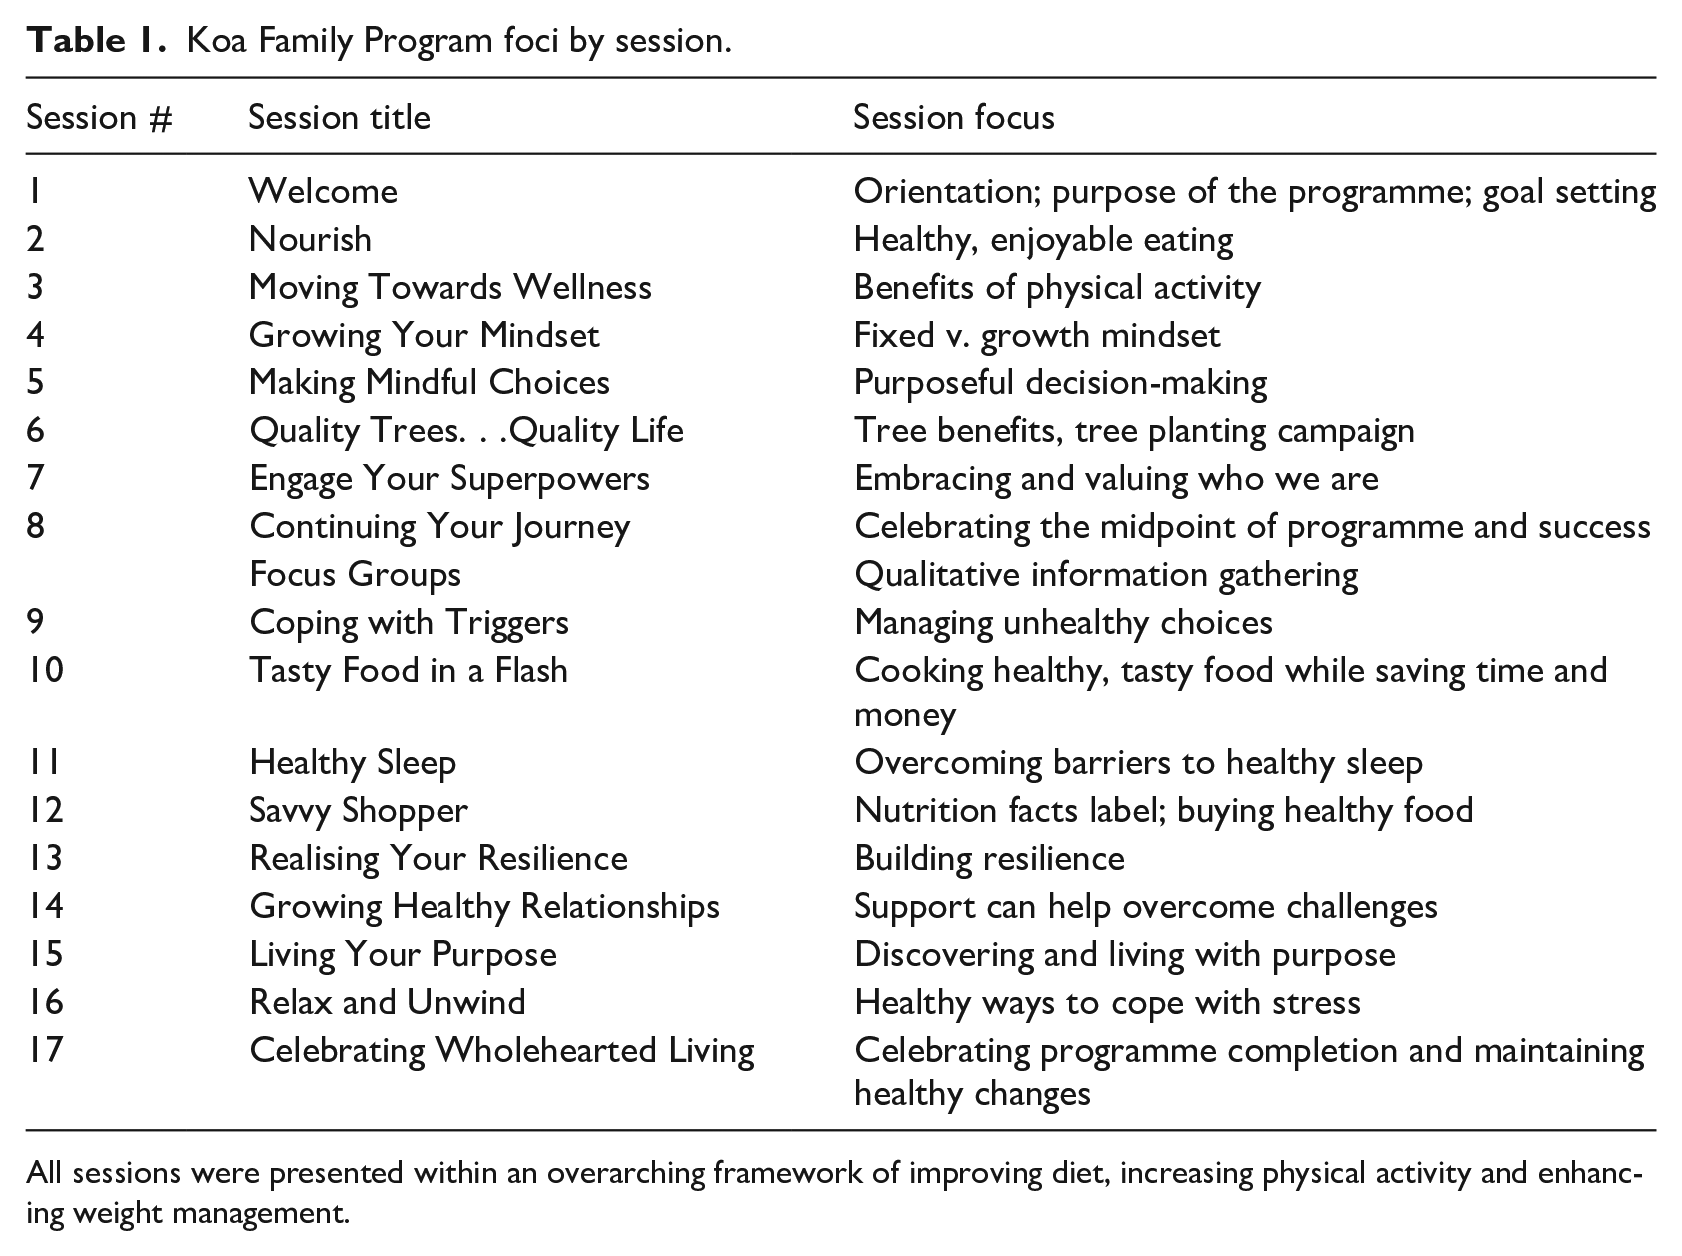
All sessions were presented within an overarching framework of improving diet, increasing physical activity and enhancing weight management.
As part of the social media support component of the KFP, each WHP group was assigned to a private Facebook group. The Facebook groups received WHP content posted by programme staff and health coaches three to five times per week and access to resources linked to each weekly session. The Facebook groups gave participants an opportunity to post and share their support, experiences, resources and ideas for behaviour change. In addition, the participants received a weekly text message reminder to weigh themselves, and they received a morning motivational quote for encouragement.
The third KFP component involved intervention participants being invited to plant and look after 200 new trees in the Sacramento region, providing an opportunity to foster social support while enhancing community engagement. Fundamentally, this component was included because greening (including trees, parks, gardens and other natural settings) has been associated with a wide variety of beneficial health outcomes, including increased physical activity, reduced overweight/obesity and improved mental health (James et al., 2015). In addition, studies suggest that greening is associated with the reduced impact of chronic diseases such as cardiovascular disease and cancer (Kondo et al., 2018; Twohig-Bennett and Jones, 2018). Residential greening may also be linked with reduced mortality (Gascon et al., 2016; Twohig-Bennett and Jones, 2018). A number of potential causal pathways for achieving these beneficial health effects have been proposed, including mediation through increased physical activity, reduced stress, enhanced social interaction and healthier physical environments through heat and noise mitigation, reduced air pollution and in other ways (James et al., 2015; Kuo, 2015).
Control group
Control group participants were directed to the MyPlate website (U.S. Department of Agriculture, 2020). Providing access to the online resources at this website constituted usual care for the control participants. Following the Week 25 survey, the control group members received all KFP materials and were invited to attend three, 1-hour webinars delivered by a health coach featuring content from the WHP. The research team had no contact with control group participants during the study period, with the exception of administrative communication concerning the end of the study and how to return research equipment. The content delivered to control group participants, both materials and webinars, occurred after the last data collection at Week 25.
Measurement
Researchers administered a baseline survey via telephone on a rolling basis up to 2 weeks before the intervention commenced and in Weeks 18 and 25. Participants and researchers learned of the randomisation assignment at the conclusion of the baseline survey. Diet and physical activity were assessed using validated surveys used for many years in US public health practice: the National Health and Nutrition Examination Survey Dietary Screener Questionnaire (National Cancer Institute, 2009) and the Behavioral Risk Factor Surveillance Survey physical activity core set (Centers for Disease Control and Prevention, 2019). Additional questions from previously validated questionnaires measured stages of change (Wee et al., 2005); self-efficacy related to diet, physical activity and trees and health knowledge (Sallis et al., 1987); social support (Sallis et al., 1987); demographics (Centers for Disease Control and Prevention, 2019); and self-reported height and weight (Centers for Disease Control and Prevention, 2019).
One diet and two exercise composite self-efficacy measures were constructed (Sallis et al., 1987). Self-efficacy was assessed in several areas, including a participant’s ability to stick to exercise, stick to a healthy diet and confidence in explaining how trees support health and well-being. For each self-efficacy domain, participants assessed themselves on an 11-point scale from 0 to 100, with 0 meaning cannot do it at all, and 100 meaning highly certain can do it. Surveys at Weeks 18 and 25 also had de novo programme evaluation questions for intervention participants. The survey was pilot tested in 2020 among 34 women with low income to ensure it was comprehensible and appropriate, and that the questions were well defined and clearly understood.
All study participants received a remote monitoring scale that transmitted weight data via cellular network and the Internet to a secure server (Vitally Health, 2021). Data transmission and storage were Health Insurance Portability and Accountability Act-compliant and managed as a research database (Vitally Health, 2021). Participants were provided with written and video scale instructions and asked to weigh themselves weekly.
Statistical analysis
Stata/MP 17 was used to conduct the statistical analyses (StataCorp LLC). We addressed potential covariate imbalance between the intervention and control groups with entropy balancing, targeting mean and variance. The intervention and control groups were balanced using a set of demographic variables: age, race/ethnicity, education, employment, a student indicator, a homemaker indicator, married or not, number of children in household, South Sacramento resident or not, covered by Medi-Cal or not, CalFresh or not, Women, Infants and Children or not; and on a set of baseline questionnaire responses regarding: level of physical activity, whether strengthening recommendations were met, as well as mean daily intake of fruit and vegetables including potatoes, dairy, sugar and sugar from beverages.
We were unable to achieve perfect balance due to limited sample size, but achieved superior balance compared to weights derived from other methods such as propensity scores or coarsened exact matching. Covariate balancing, even in RCTs, controls for chance imbalances occurring in a single trial, improving internal validity, statistical efficiency and power.
We focused on measuring the average treatment effect, conditional on treatment, also called the average-treatment-effect-on-the-treated (ATET), to assess benefit of the KFP among individuals assigned to the intervention group (Morgan and Winship, 2014). As such, we constructed ATET weights by weighting the control group such that the distribution of covariates matched the intervention group. The ATET estimator is robust to model misspecification after covariate balancing.
The ATET for all outcomes is estimated using the same longitudinal empirical equation
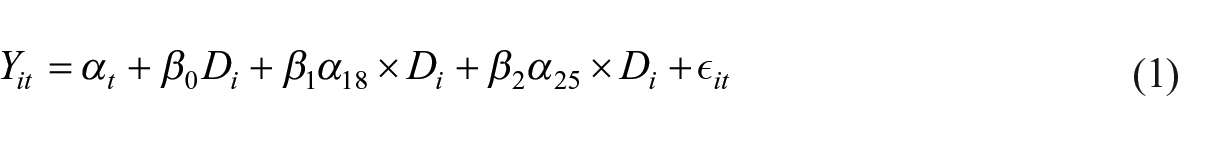
where
The model used to estimate equation (1) differed according to each outcome measure’s data type and distribution. For example, weight and BMI outcomes were analysed by rearranging equation (1) as a difference equation and estimated by ordinary least squares regression, as the change in weight and BMI were continuous real variables. For ordinal outcomes, with a clear ranking but unknown interval width, equation (1) was estimated by ordered logistic regression. For outcomes that were always non-negative real numbers, equation (1) was estimated by Poisson regression. In addition, equation (1) was estimated by logistic regression for binary outcomes. All models were estimated using the previously described entropy weights and cluster-robust standard errors, clustered at the individual level. All significance testing was assessed at the 95% confidence level with p < .05.
Results
Characteristics of participants at baseline
Table 2 displays the demographic characteristics of participants in the control and intervention groups. There were no significant (p < .05) differences in age, BMI, weight, race/ethnicity or education between groups. At baseline, the mean weights for the intervention and control groups were 189.3 and 189.0 pounds, respectively.
Characteristics of study participants at baseline.
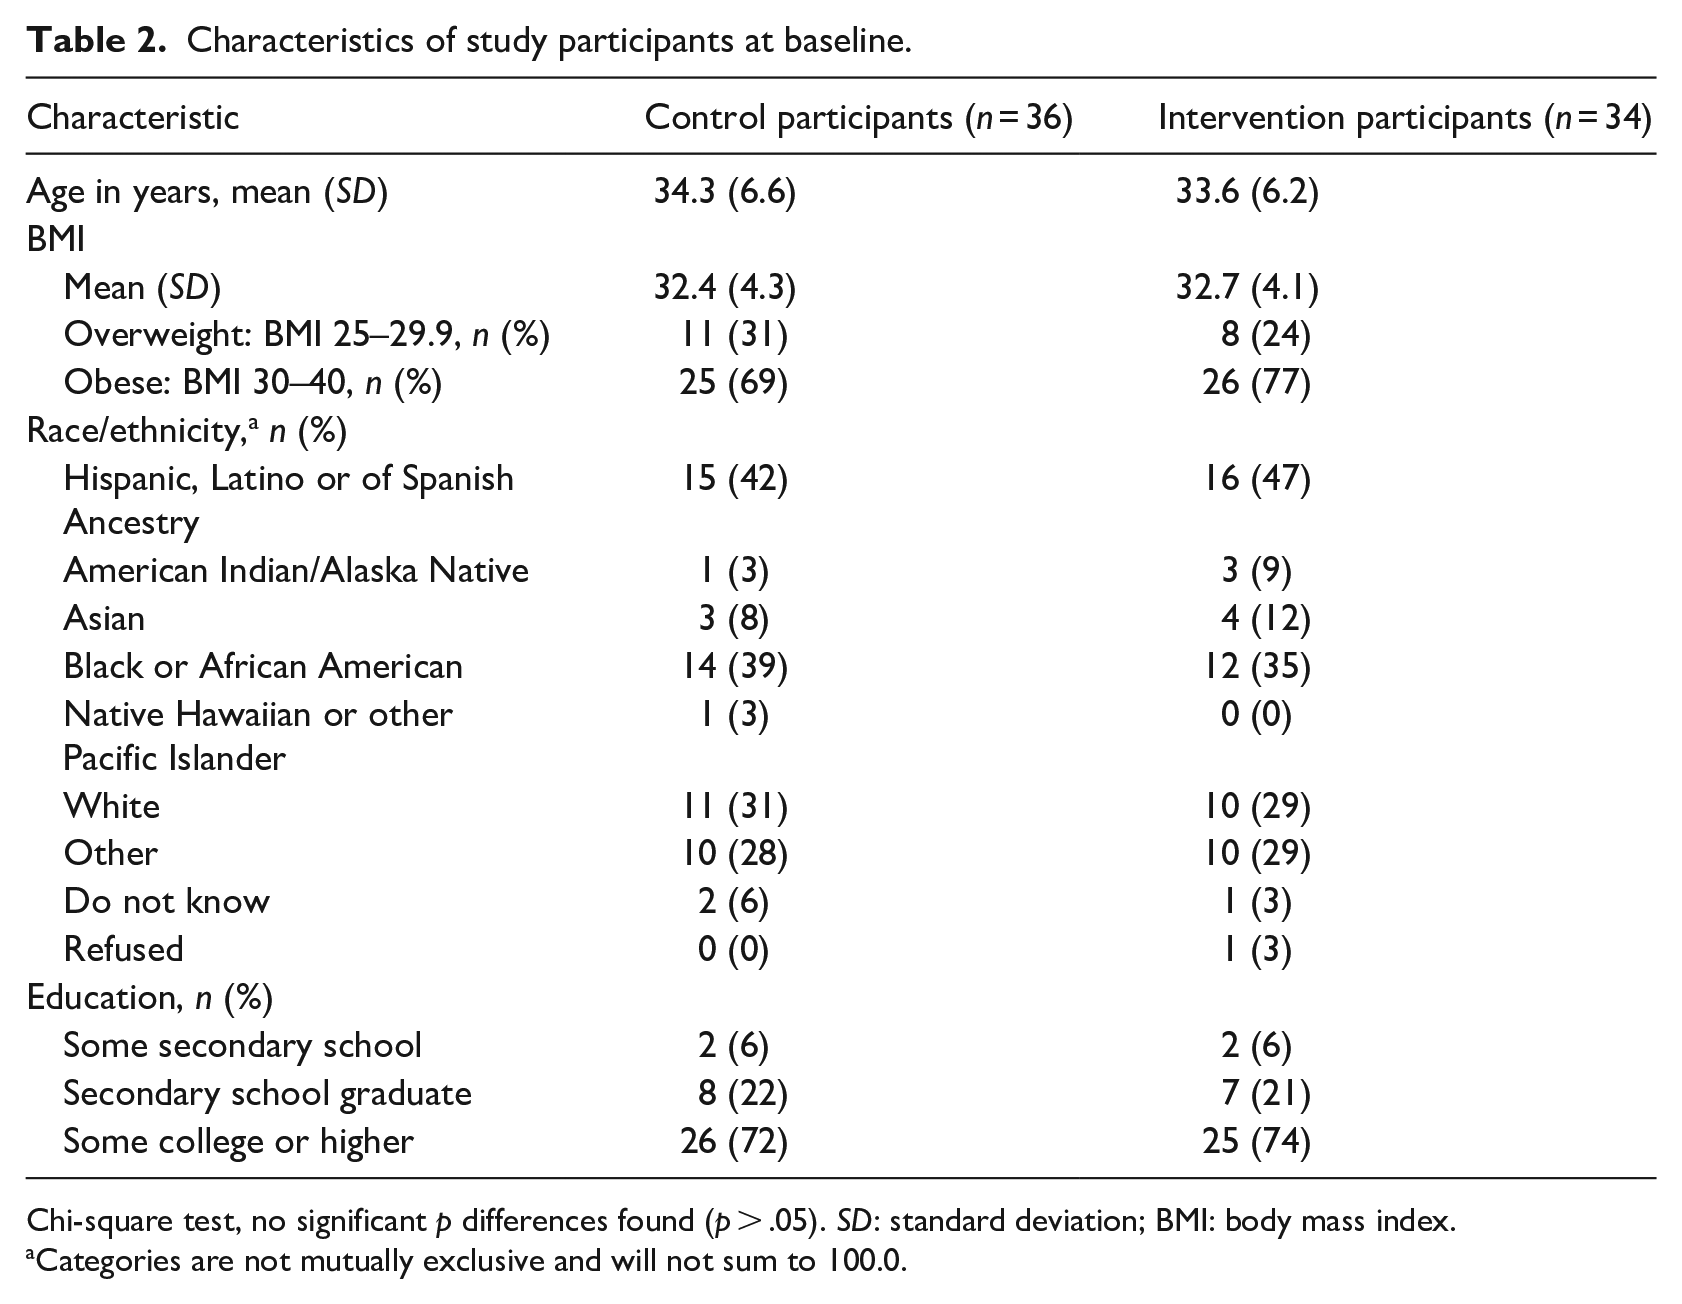
Chi-square test, no significant p differences found (p > .05). SD: standard deviation; BMI: body mass index.
Categories are not mutually exclusive and will not sum to 100.0.
Weight change
The ATET (following adjustment for covariates) of the intervention was a significant change in weight of −7.69 pounds, p < .000; 95% confidence interval (CI) = −11.97 to −3.41, and change in BMI of −1.28 (p < .000; 95% CI = −1.95 to −0.6) at Week 18 compared with baseline. There were significant changes in weight of −7.72 pounds (p = .002; 95% CI = −13.02 to −2.42) and BMI of −1.24 (p = .003; 95% CI = −2.1 to −0.38) at Week 25 compared with baseline. This treatment effect weight reduction at Week 25 corresponds to a 4% reduction in weight based on the mean study population baseline weight of 189 pounds. Overall, 67% of the intervention group lost weight in the baseline-to-Week 18 interval (range: −1.1 to −39.2 pounds) and 74% lost weight in the baseline-to-Week 25 interval (range: −2.6 to −41.5 pounds).
Participants were asked to use their scales to weigh themselves on a weekly basis but were free to use the scales more frequently if they desired. Eleven participants (16.2%) used their scale every week, 21 (30.9%) used their scale for 21–25 of the 26 weeks, 16 (26.5%) used their scale for 16–20 of the 26 weeks, 10 (14.7%) used their scale for 11–15 of the 26 weeks and 4 (5.9%) used their scale for 6–10 or 1–5 of the 26 weeks. Each participant used the scale at least once.
Dose response
We examined the relationship between group session attendance and weight loss in the intervention group. Attending one additional session was associated with 0.54 pounds (p = .117; 95% CI = −1.33 to 0.26) of additional weight loss at Week 18 and 0.85 pounds (p = .038; 95% CI = −1.65 to −0.05) of additional weight loss at Week 25. In addition, one additional session was associated with a change in BMI of 0.08 (p = .168; 95% CI = −0.21 to 0.04) at Week 18 and −0.13 (p = .037; 95% CI = −0.26 to −0.01) at Week 25.
There were 17 weekly intervention sessions. One participant (3.0%) attended no sessions, four participants (12.1%) attended between one and four sessions, 13 participants (39.4%) attended between five and 10 sessions, nine participants (27.3%) attended between 11 and 15 sessions and six participants (18.2%) attended 16 or 17 sessions.
No comparisons were made between participants who dropped out and those who completed the study.
Diet
From baseline to Week 18, the intervention group showed greater changes than the control group, all in a healthful direction, for seven of eight estimated mean daily intakes: fruit and vegetables, fruit and vegetables excluding fried potatoes, fruit, sugar, sugar from beverages, whole grains and fibre. For dairy, there was a small reduction in estimated mean daily intake. None of these changes, however, reached statistical significance.
From baseline to Week 25, the intervention group showed greater changes than the control group, in a healthful direction for the following estimated mean daily intakes: fruit and vegetables, fruit and vegetables excluding fried potatoes, sugar from beverages, whole grains and fibre. The intervention group, however, had modest decreases in estimated mean daily intakes for fruit and dairy, and a slight increase in estimated mean daily intake for sugar. However, none of these baseline-to-Week 25 changes reached statistical significance.
Physical activity
Between baseline and Week 18, the ATET of the weight loss intervention on level of physical activity showed a 23.7% reduction (p = .008; 95% CI = −41.2% to −6.1%) in the probability of being inactive and 1.6% reduction (p = .864; 95% CI = −20.4% to 17.2%) of being insufficiently active; however, the probability of being active increased 6.4% (p = .575; 95% CI = −16.0% to 28.9%) as did the probability of being highly active (18.9%; p = .296; [95% CI = −16.6% to 54.3%]). Although only the ATET point estimate for inactive was statistically significant (i.e. there was a greater reduction in the proportion in the inactive category for the intervention group compared to the control group), the trend in point estimates across levels of physical activity was consistent with an effective intervention: participants receiving the KFP, overall, were less likely to be inactive and more likely to be active than control participants. For the baseline-to-Week 25 period, ATETs for inactive, insufficiently active, active, and highly active were: −14.5% (p = .053; 95% CI = −29.2 to 0.2); −10.2% (p = .061; 95% CI = −21.0 to 0.5); −8.5% (p = .109; 95% CI = −18.8 to 1.9); and 33.2% (p = .041; 95% CI = 1.4–65.1), respectively. As with the baseline-to-Week 18 period, these findings are consistent with an increase in physical activity in the intervention group relative to the control group.
Stages of change
From baseline to Week 18, the ATET consisted of higher probabilities of reaching the maintenance phase than the control group for each of the following behaviours: reduce portion size, 39.0% (p = .019; 95% CI = 6.5–71.4); reduce fat, 45.4% (p = .001; 95% CI = (17.4–73.4); increase fruit in diet, 27.2% (p = .083; 95% CI = −3.6 to 58); plans to increase exercise, 9.5% (p = .543; 95% CI = −21 to 39.9); and plans to lose weight, 42.7% (p < .000; 95% CI = 19.2–66.3). Statistical significance was observed for reduce portion size, reduce fat and plans to lose weight. Overall, the stages of change findings were consistent with the intervention group having higher probabilities than the control group of achieving the maintenance phase for an array of healthful behaviours.
Self-efficacy
There were higher self-efficacy scores (scale = 0–100) for the intervention group compared with the control group in several areas. For being able to stick with a healthy diet, ATETs were 11.4 (p = .082; 95% CI = −1.4 to 24.2) at Week 18 and 11.3 (p = .063; 95% CI = −0.6 to 23.3) at Week 25. ATETs for being able to stick to exercising were 9.31 (p = .316; 95% CI = −8.9 to 27.5) at Week 18 and 6.00 (p = .495; 95% CI = −11.2 to 23.2) at Week 25. ATETs for being highly certain I can explain how trees support health and well-being were 1.57 (p = .125; 95% CI = −0.36 to 3.5) at Week 18 and 1.72 (p = .213; 95% CI = −0.87 to 4.31) at Week 25. These results suggest that the intervention group acquired greater self-efficacy than the control group for sticking with a healthy diet, sticking to exercising, and explaining how trees support health and well-being. However, none of the comparisons reached statistical significance.
Participants’ evaluation of the KFP
At Week 25, 83.9% of intervention group participants expressed strong agreement with the statement, I feel healthier due to the KFP, and 87.1% expressed strong agreement with the statement, the KFP was worth my time.
Discussion
For the primary study outcome, the KFP resulted in a statistically significant treatment effect consisting of a 7.7-pound weight loss for the intervention group compared with the control group at both Week 18 and Week 25 of the study. In addition, the intervention group demonstrated improvements in diet, physical activity and behavioural measures of self-efficacy and maintenance of favourable lifestyle change. The control group also showed some improvements in these variables, but in almost every instance, the magnitude of positive change was greater for the intervention group compared with the control group. Demonstration of statistical significance on these variables, however, showed mixed results. Regarding a dose–response effect, at Week 25 (but not at Week 18), increased group session attendance was significantly associated with greater weight loss.
A review of the literature did not find studies of similar community-based interventions targeting populations with low income that used the gold-standard, RCT design. Our findings, though, are consistent with several other studies. For example, the overall magnitude of KFP-associated weight loss at 4% is similar to the results reported by Katzmarzyk et al. (2020), evaluating an intensive, clinically oriented weight loss programme for men and women with low income, which had a 5% overall weight loss among intervention participants. Their clinic-based study, however, had a significantly longer time period to achieve its results; the intervention was conducted over 24 months in patients with a mixture of individual and small group visits, the majority of which were in-person. Notably, the nearly 8-pound weight loss treatment effect attributable to the KFP was greater than a 5.3 pound weight loss treatment effect seen for Weight Watchers, as reported in a cost-effectiveness study of commercial weight loss interventions (Finkelstein and Kruger, 2014).
As for the KFP being anchored by weekly, health coach-facilitated, group sessions, Borek et al. (2018) conducted a systematic review and meta-analysis of RCTs examining the effectiveness of group-based diet and physical activity weight-loss interventions. They concluded that interventions delivered in groups were generally effective in promoting clinically meaningful weight loss at 12 months, although there was limited evidence as to what optimises the effectiveness of such interventions. In this study, we did not identify any of the intervention components as having the predominant impact on the outcomes observed.
The telehealth literature contains several studies on the effect of clinical weight loss programmes typically featuring coaching by a healthcare professional (e.g. dietitian, physician, nurse). For example, Kempf et al. (2019) studied a telemedical coaching programme among employees at a large, German biotechnology company. While the intervention group lost approximately 8 pounds with coaching from nurses with diabetes expertise along with remote monitoring via scales and pedometers, the weight loss of the coaching intervention groups (lower and higher intensity coaching groups) was not statistically different from the control group that received scale and pedometer telemonitoring but no coaching.
Alencar et al. (2019) reported on the efficacy of a telemedicine-based, 12-week, weight loss programme, with health coaching support via video conference. All of the 25 participants (mean BMI of 34.6) received telemonitoring devices including an accelerometer, a blood pressure monitor, and a body composition scale. The intervention group participants were instructed by a physician to follow a caloric deficit diet. They received weekly counselling via videoconference from a registered dietitian and monthly counselling from a physician. At the conclusion of the 12-week study, the intervention group lost 13.4 pounds more than the control group. However, long-term weight data were not reported.
Hurst et al. (2021) conducted a 16-week telehealth intervention pilot study using wearable devices, automated text messaging, and trained health coaching, with the aim of promoting weight loss and physical activity in primary care patients with overweight. Of the 30 patients enrolled, most were men with 4 years of college education. Of the 22 patients with follow-up weights, the average weight loss was 7.8 pounds, comparable to the weight loss seen with the KFP. This, however, was a pilot study in a different patient population and without a control group.
Strengths and limitations
Strengths of our study include the RCT design, the community-based recruitment and intervention programme, the focus on an under-resourced population, and the broad application of telewellness in the midst of the COVID-19 pandemic. As compared with the control group, the KFP intervention group achieved significant weight loss, increased physical activity and other favourable improvements in lifestyle and healthful behavioural metrics despite pandemic-associated stressors such as higher mental health burdens (Liu et al., 2021) and increased weight (Bhutani et al., 2021).
The primary limitation of the study was the relatively small sample size resulting from the challenges recruiting women during a pandemic. The number of participants was adequate to test the main outcome variable of weight loss but was underpowered to assess changes in related lifestyle measures. Specifically, there were too few participants to ensure adequate variation to estimate the ATET with precision, hence the wide confidence intervals on secondary outcome coefficients. Overall, however, there was a striking consistency in improved health and lifestyle measures of greater magnitude in the intervention group as compared with the control group. This is in alignment with a potentially synergistic effect of a whole health programme on weight loss. In addition, the KFP demonstrated weight loss that was significant at the individual and population levels. While long-term follow-up data are unavailable, the level of weight loss seen at Week 25 was as great as that observed at Week 18.
Another limitation of the study was the requirement to have Internet access, which may have prevented women with very low income from participating. However, about 85% of US residents are reported to own a smartphone (Pew Research Center, 2021) and a federal programme provides free smartphones to individuals with low income (Federal Communications Commission, 2022). While we offered tablets to all intervention group members, most elected to use their own smartphone and only four borrowed a tablet.
Conclusion
This study demonstrated that a community-based, telewellness programme can help women with low income and overweight or obesity lose significant weight. Telewellness has the potential for large scale application while avoiding COVID-19 exposure risk. Future work should explore and evaluate the implementation of the KFP in other populations differing by age, gender, income, geography and culture.
Footnotes
Acknowledgements
The authors gratefully acknowledge Daniel J. Tancredi, for performing the independent block randomisation; Sabrina Loureiro, Marissa Huston, Katrine Padilla and Ruchi Rawal, for assisting with data collection; Greg Bourne, Lucy Roberts, Rachel Hilbert, Julia Smith and Leigh Burns, for supporting the delivery of the weekly intervention group sessions; and Anne Fenkner for conducting the tree planting and stewardship components of the intervention.
Funding
The author(s) disclosed receipt of the following financial support for the research, authorship, and/or publication of this article: this project used REDCap as a survey and data entry platform. REDCap was developed with support from the National Center for Advancing Translational Sciences (NCATS), US National Institutes of Health (NIH) (UL1 TR001860). This study was supported by funds from the California Department of Social Services (Agreement Number 18-3110) and the California Department of Forestry and Fire Protection (Agreement Number 8GA19400).
Data availability
Requests regarding underlying research materials (e.g. data, samples or models) may be addressed to the Corresponding Author. Information may be shared but is restricted by the University of California, Davis Institutional Review Board which would need to approve any data sharing related to research participants.