
Abstract
The main raison d’être of the Southern African Development Community (SADC) Free Trade Area (FTA) implemented in 2012 was to inter alia boost intra-regional trade and promote regional trade integration. The low levels of growth and mixed trade performance of countries, eight years after, raises questions about the success of the FTA. The success of the recently launched African Continental Free Trade Area (AfCFTA) partly hinges on the performance of the regional FTAs like the SADC FTA. This is because it is unlikely that the African Union through the AfCFTA will achieve continentally what regional economic communities failed to achieve at the regional level. We use a gravity model as well as the difference in difference estimator to evaluate, ex-post, the impact of the SADC FTA on total and sectoral intra-exports. Using data from 2001 to 2019, results show that the full implementation of the SADC FTA did not significantly affect export performance with the export difference between countries that joined the FTA and those that did not being insignificant. These results do not change even when using sectoral exports.
Introduction
The Southern African Development Community (SADC), established through the SADC treaty of 1992 in Windhoek, is a regional economic community (REC) made up of 16-member states, the fourth largest African REC in terms of population but third in terms of the gross domestic product (GDP) (World Development Indicators [WDI], 2022). The fact that 16 out of 46 Sub-Saharan African (SSA) countries contribute 37% of SSA GDP suggests that SADC is not only one of the biggest economic regions in the Sub-Sahara but is also the continent’s growth pole.
Although SADC has been growing steadily as a group, there is so much heterogeneity in the economic performance of member states and this compromises the region’s economic convergence and the degree of economic integration. South Africa has always been the region’s economic powerhouse, accounting for the largest share of SADC’s GDP at about 51% followed by Angola at 15% (WDI, 2022). All the other countries except the Democratic Republic of Congo (DRC) and Tanzania contributed less than 4% to SADC GDP each in 2019. Annual GDP growth has also varied greatly from country to country and for the period 2011 to 2020, Mozambique, DRC and Tanzania were the only countries that grew by at least 5% whilst South Africa and Angola grew by less than 2% (WDI, 2022). Thus, all countries are growing at less than the 2013–2018 SADC’s GDP macroeconomic convergence target of 7% per annum (AfDB, 2019).
Trade promotion is one of the economic drivers the SADC region is using to enhance economic development, diversification, industrialisation and integration of the region. For the period 2011–2019, in all the countries except Tanzania, trade as a percentage of GDP was above 60%, but in countries like Lesotho, Mauritius, Mozambique and Seychelles (WDI, 2022), it was above 100%. SADC countries appear to import more than they are exporting and all of them except eSwatini and Botswana have consistently been running negative current account balances. Malawi, Mozambique and Seychelles are the countries running relatively large current account deficits above 16%, which is also higher than the region’s convergence target of 9% (AfDB, 2019; WDI, 2022). SADC continues to trade more with the rest of the world than with itself. For the period 2001–2011, the region exported about 84% of its products to the world market, and this share dropped slightly to 78%, for the period 2012–2020. Thus, the introduction of the SADC Free Trade Area (FTA) in 2012 did not significantly change the direction or destination of exports.
The SADC Protocol on Trade signed in 1996 aims to liberalise intra-regional trade by eliminating barriers to trade, easing customs procedures, harmonising trade policies and prohibiting unfair business practices (SADC, 2022). The protocol provided the foundation for the formation of the SADC FTA 1 through a phased programme of tariff reduction which began in 2001. The FTA was achieved in August 2008, when minimum conditions were attained. By 2008, 85% of intra-regional trade among the partner states attained zero duty. Maximum tariff liberalisation was, however, only attained at the beginning of 2012, when the tariff phase-down process for sensitive products was completed (SADC, 2022).
In total, 13 out of the 16 SADC member countries are part of the FTA, whilst Angola, DRC and Comoros did not join. Malawi, Zimbabwe and Tanzania were the only countries that were given derogations expiring latest in 2015. The objectives of the SADC FTA are inter-alia to increase domestic production, create more business opportunities, increase the level of intra-regional imports and exports, and improve access to cheaper inputs and consumer goods (SADC, 2022).
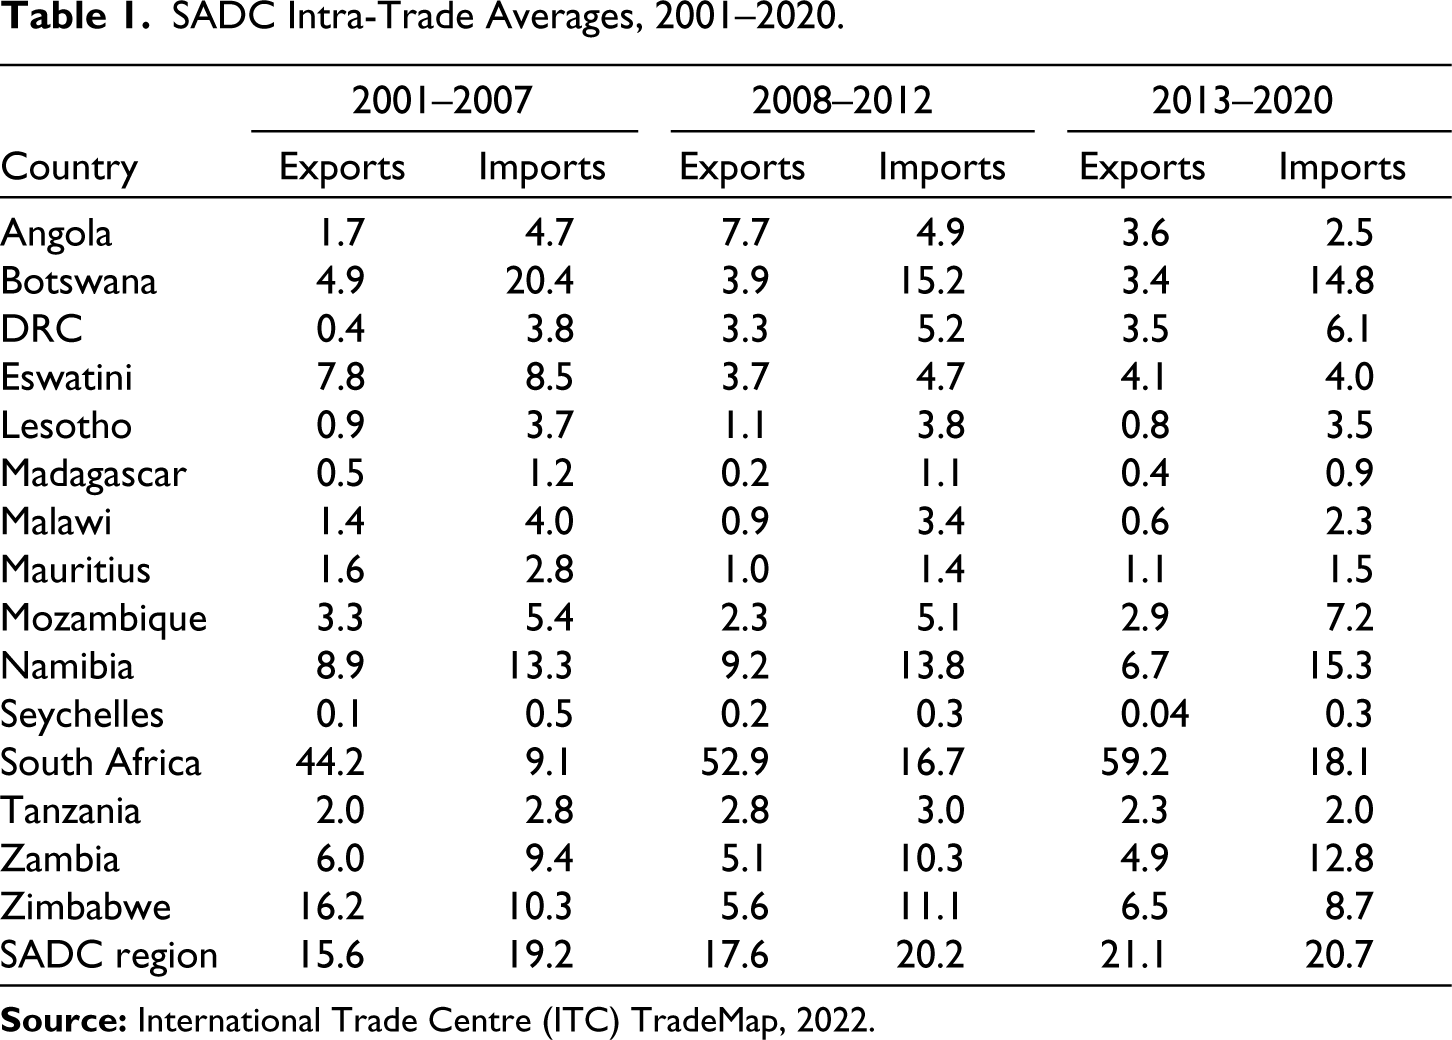
Table 1 shows the level of intra-trade before and after the full establishment of the SADC FTA in 2012. Total SADC exports and imports as a percentage of SADC trade with the rest of the world have only risen to 21% and have increased by less than five percentage points since 2001. The finalisation of SADC FTA and introduction of zero-rated tariff lines in 2012 has done very little to spur regional exports and imports. From 2013–2020, exports increased by four percentage points whilst imports by 0.5 percentage points. More than 50% of what is exported in the region comes from South Africa even though the country’s share of SADC intra-imports has been low and never exceeded 20%. South Africa is the only country whose exports into the region increased though marginally by six percentage points from 53% in 2012. For the past eight years since 2013, no SADC country increased its imports from the region by an average of three percentage points (International Trade Centre [ITC], 2022).
SADC Intra-Trade Averages, 2001–2020.
Although SADC continues to import and export more than 75% of its goods from countries outside the region, the share traded with traditional markets like the European Union (EU) and the United State of America (USA) has been falling. This is despite the existence of preferential trade arrangements such as economic partnership agreements with the EU and the African Growth and Opportunity Act (AGOA) with the USA. Exports to the EU fell from an average of 35.1% for the period 2001–2011 to 19.7% for the period 2012–2020. For the same periods, imports also fell from 31.5% to 24.1%. In the case of the USA, exports fell from 15% to 6% and imports fell from 7% to 5% whilst in the case of Africa, exports increased from 20% to 25%. Exports to China appear to be picking up as from 2016 (see Figure 1).
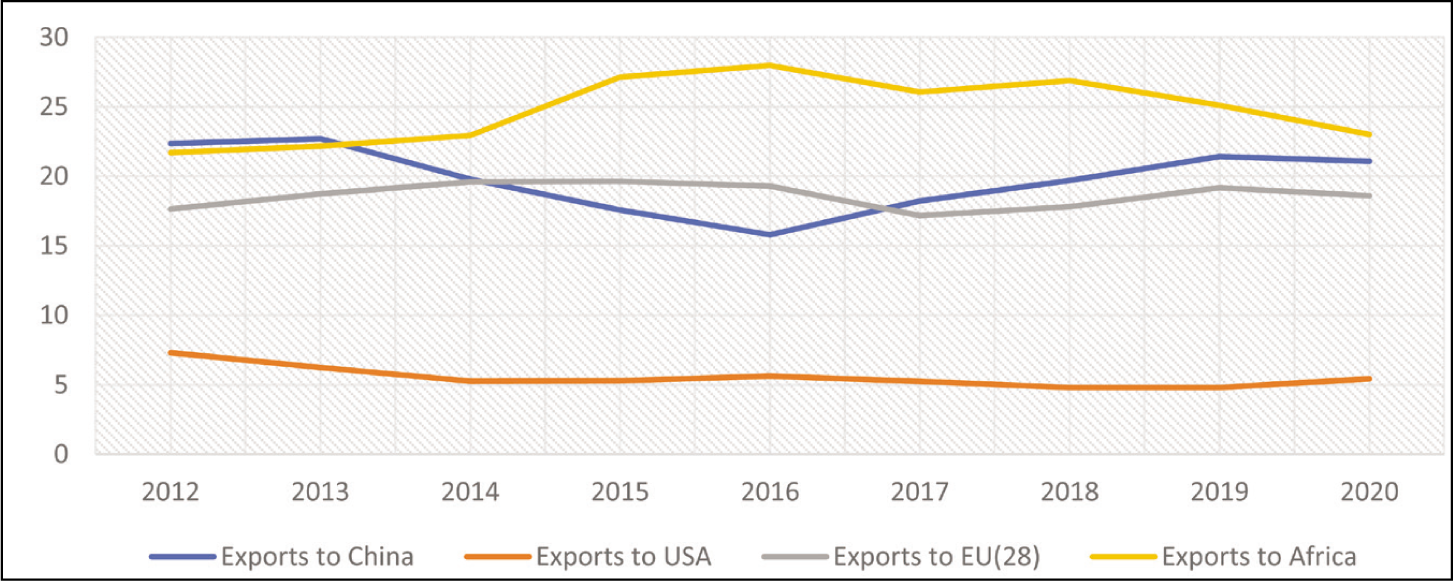
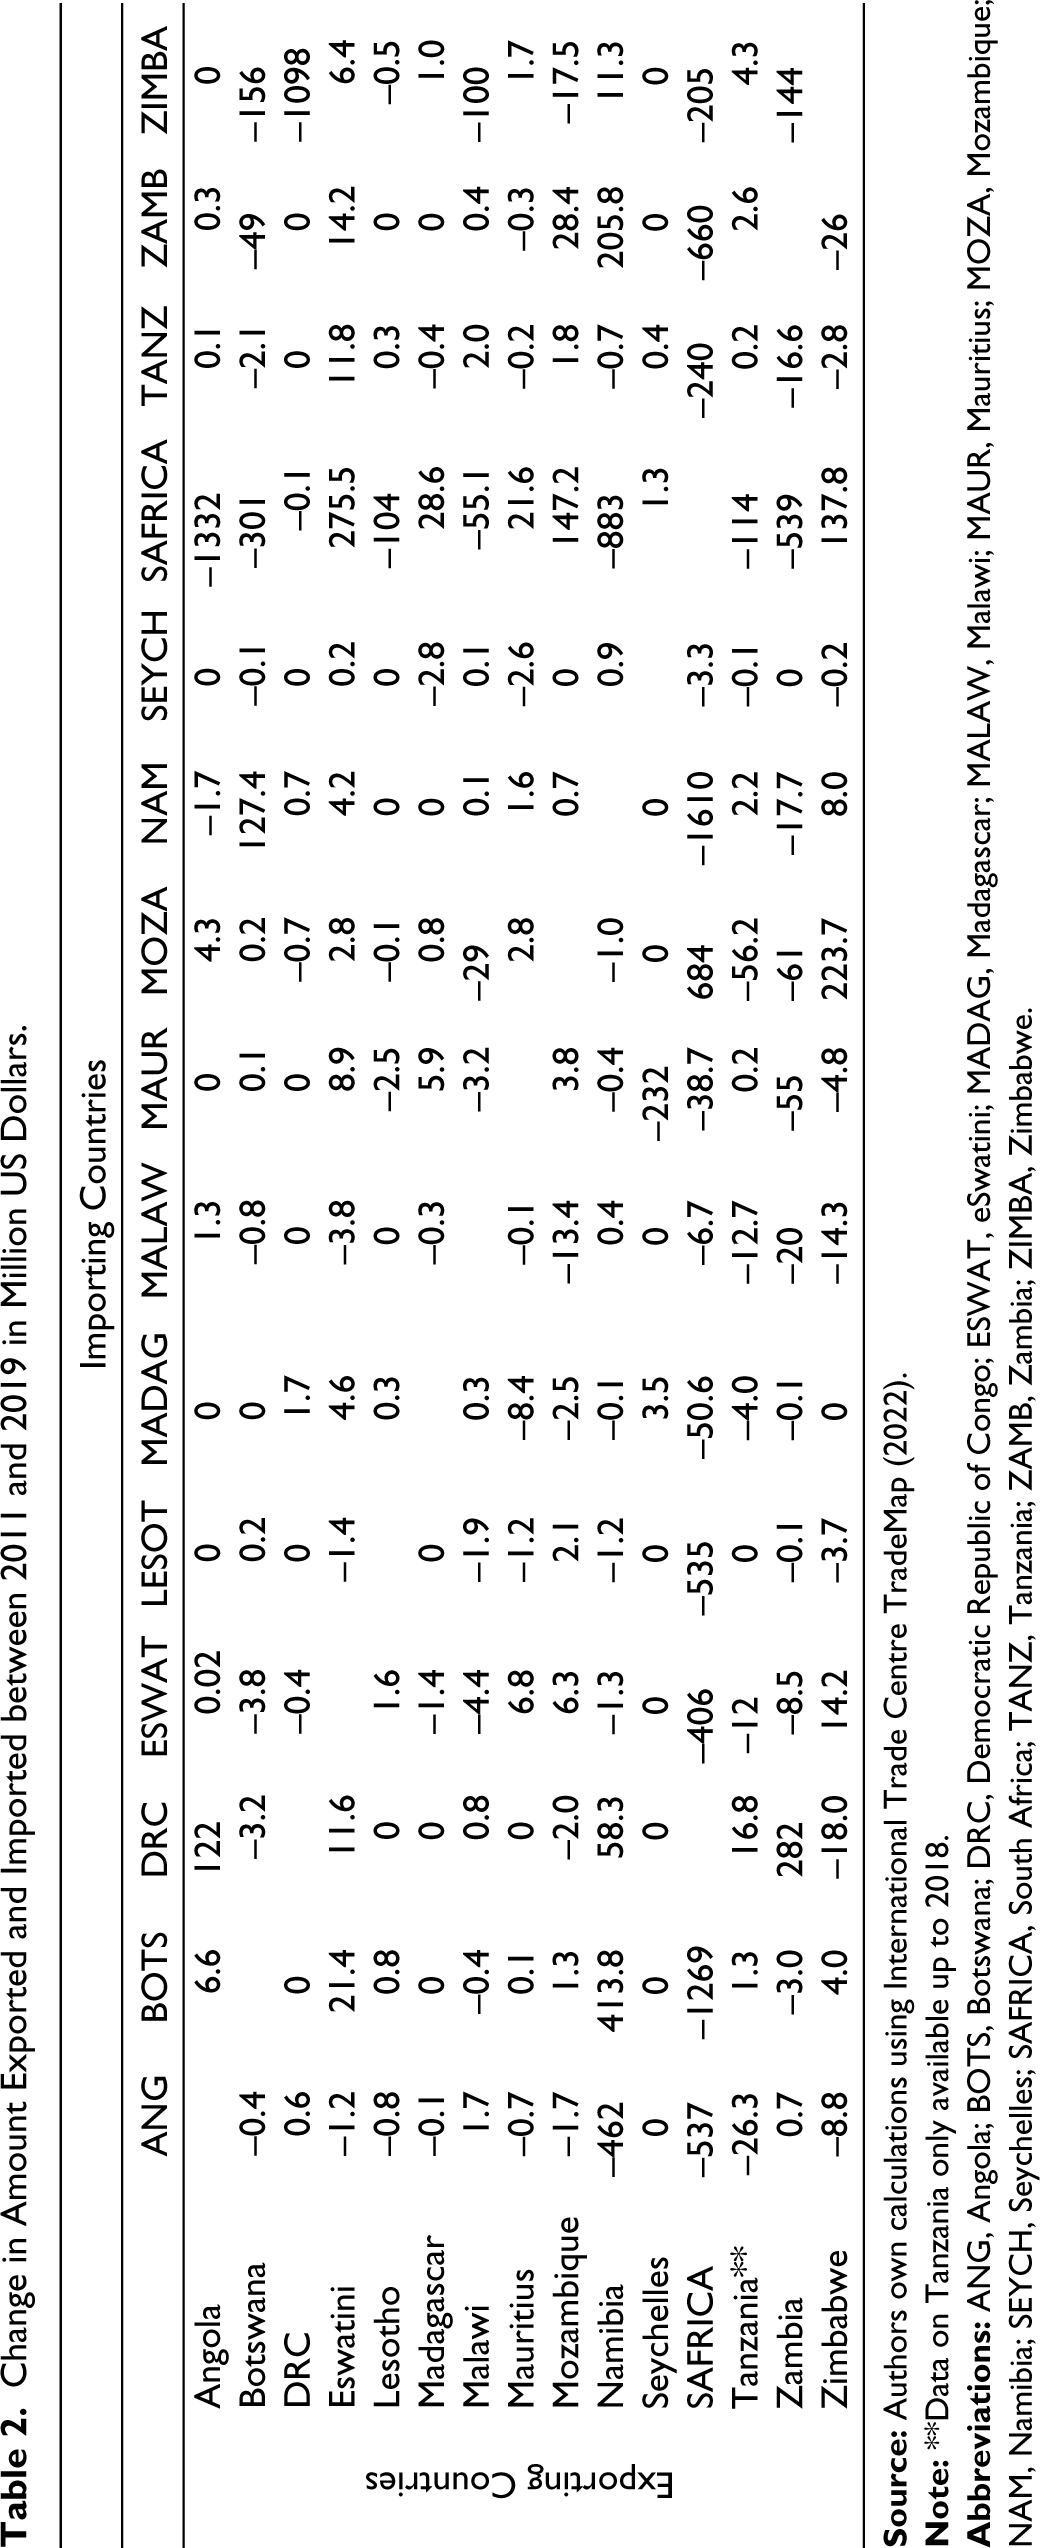
Table 2 is a matrix showing how much imports and exports have changed between 2011 and 2019 at the country level. The finalisation of the SADC FTA was done at the beginning of 2012, so this table indicates whether full trade liberalisation had resulted in a reduction or increase in trade among member countries in the SADC region. Generally, most countries have reduced their total imports and exports to the region and the only countries that have increased their exports are Eswatini by US$356m, Madagascar by US$31m, Mauritius by US$21m and Mozambique by US$155m. Countries that have increased their imports from the region after trade liberalisation include Mozambique by US$771m and the DRC by US$468m. The biggest decline in exports and imports was recorded in South Africa with exports to the region falling by US$4877m whilst imports by US$2716m probably due to the economy’s sluggish growth.
Change in Amount Exported and Imported between 2011 and 2019 in Million US Dollars.
The other feature coming from the statistics on Table 7 appendix is that SADC imports as a percentage of world imports are lower in 2019 compared to 2011 before the finalisation and attainment of maximum tariff reductions. These countries continue to import more from the rest of the world than from themselves. The pattern is also similar when looking at exports, the share of SADC exports in world exports has been going down in most countries and in some cases increasing marginally.
All these statistics prima facie paint a gloomy picture of the performance of the SADC FTA and suggest that full tariff liberalisation has probably resulted in trade diversion instead of trade creation. Therefore, the question that we want to answer in this study is: Does the fall in imports and exports experienced by most countries in the region suggest that tariff liberalisations have so far had negative effects on intra-trade promotion? We ask this question because the African Union recently launched the African Continental Free Trade Area (AfCFTA) on the 1st of January 2021, whose main raison d’etre is to boost intra-Africa trade performance. Simulation models on the AfCFTA have predicted increases in trade and GDP growth and if this is indeed the case, then countries in regional FTAs should be exporting more to each other and should have significantly reduced trade with the rest of the world. However, if eight years after the full liberalisation of tariffs in the SADC region, intra-trade is still very low, and country-level performance mixed, one wonders whether the AfCFTA will produce different results. The success of the SADC FTA as well as other five 2 regional FTAs has a strong bearing on the success of the AfCFTA and is it possible for the AfCFTA to achieve continentally what RECs like SADC are failing to achieve at the regional level? This is because statistics show that the share of SADC imports in the region’s world imports has averaged 19% since 2002 3 (ITC, 2022) suggesting that the region is still importing more from the rest of the world than from REC members whose products are zero rated. Cassim (2001) also argued that the SADC region is typical of many developing regions showing high extra-regional trade intensities but low intra-regional trade biases.
There are several studies that have investigated the impact of the SADC REC on trade performance (Admassu, 2019; Afesorgbor, 2017; Kohl, 2014; Mukwaya, 2019; Sun & Reed, 2010) but the difference is that SADC as a REC came into existence in 1992 but the SADC FTA was fully established in 2012. The REC captures trade and non-trade related issues whilst the FTA only focuses specifically on tariff liberalisation. Some of the studies on SADC were done before or few years after the actual implementation of the FTA and hence simulated the ex-ante potential benefits using computable general equilibrium (CGE) models (Cassim, 2001; Chauvin & Gaulier, 2002; Evans, 2000; Fadeyi et al., 2014; Hullaert, 2007; Lewis et al., 2001; Mashayekhi et al., 2012; Mukwaya & Mold, 2017). We believe enough time has passed for us to be able to do an ex-post impact assessment of the FTA to check whether reducing tariffs by 100% has really benefited intra-trade in the region.
Many studies have used gravity models to evaluate the impact of RECs or FTAs, but we want to take the analysis further by using a before and after technique called the difference in differences (DID). The binary dummies used to proxy FTAs or REC effects in gravity models do not capture the breadth and depth of these agreements and in some cases may falsely attribute increased trade to an FTA. This is because these dummies might be correlated with other factors like regional production sharing, diplomatic efforts, etc. DID estimation thus minimises these challenges and provides robustness checks. Instead of only looking at total intra-exports, our study will further disaggregate exports into sectors (manufacturing, agriculture forestry and fisheries as well as mining) to check whether the impact of the FTA is sector dependent. The SADC industrialisation strategy and roadmap launched in 2015 aims to inter-alia diversify and broaden the industrial base of the region by doubling manufacturing value added as a percentage of GDP to 30% in 2030 and promoting agricultural value chains and mineral beneficiation (SADC, 2022). This is because the economic structure of SADC countries is heterogenous with countries like South Africa and Angola dominating the manufacturing sector whilst Botswana, Zimbabwe and Zambia are rich in mining-related resources with Madagascar and Mozambique biggest contributors to agriculture (AfDB, 2019). This study attempts to analyse how the establishment of the FTA-affected sector-level intra-regional exports. Yang and Martinez-Zarzoso (2014) suggest that disaggregated data for specific commodities are important, in terms of differences in the trade structures and integration impacts.
Therefore, the main aim of the study is to carry out a detailed analysis of the impact of the SADC FTA on intra exports performance, eight years after maximum tariff reforms were attained. The study will use data for the period 2001 to 2019, to avoid distorting the impact of the FTA by the Covid-19 pandemic. We also believe that policymaking with respect to free trade agreements should start and end with impact assessments. In 2012, when the SADC FTA was launched, an assessment of the potential costs and benefits of the FTA was done to shape the program objectives, inform consultations and formulate effective negotiation strategies. Therefore, after implementation, an assessment of the FTA’s actual versus projected impact is necessary for determining whether the FTA’s objectives have been met and what adjustments are needed (Plummer et al., 2010). According to Plummer et al. (2010), this kind of impact assessment is especially important when the negative effects of the FTA seem to be larger than the positive effects. As much as policymakers are more interested in being informed of the potential economic effects of decisions that they are considering making, they should also be equally informed of the impact and economic implications of decisions made several years ago.
Using the gravity and DID estimator, results show that the full implementation of SADC FTA has not significantly increased the level of intra-trade in the region. This pattern is also replicated at the sectoral level. Results also show the presence of trade creation and diversion in the region but it is difficult to determine which effect is stronger than the other.
Literature Review
The growth of economic regionalism in the world has resulted in the number of free trades agreements (FTAs) between countries increasing from 23 in 1988 to 683 in 2019 with 469 of these FTAs in force (Timsina & Culas, 2020). Preferential trading arrangements, such as free trade agreements, have both positive and negative effects and are therefore known as second-best initiatives alternatively pursued if first-best multilateral liberalisation is not possible. An FTA is a commitment by signatory members to remove tariffs across member states whilst continuing to maintain independent tariff regimes on imports from non-member countries. It is a first step towards achieving a customs union, common market and economic union. Although so many studies have been done to analyse the impact of FTAs, there is still no consensus in the literature. According to Bhattacharyya and Mandal (2014), FTAs are beneficial for countries that have a higher priority for elastic tariff goods compared to countries preferring inelastic tariff goods.
Some of the benefits associated with free trade include increased competitiveness as new players enter home markets resulting in expensive goods being replaced with cheaper goods, increasing the variety and quality of goods and hence consumer welfare. Increased competition also spurs innovation and the use of recent technology further resulting in lower prices of goods (Chinembiri, 2010; Jansen & Lee, 2007). Free trade also pushes countries to specialise and produce in line with their comparative advantage and thus take advantage of efficiencies generated from economies of scale and scope (Keane et al., 2010). By creating a larger market for firms operating in partner countries, an FTA will allow producers to take advantage of a larger customer base and, hence, produce at a lower average cost on all sales. FTAs also facilitate intra-industry trade between countries that produce similar products by encouraging firms to specialise in certain parts of a production process and to concentrate on certain market segments. By so doing, FTAs create a web of positive interactions and interdependencies which will build trust, raise the opportunity cost of war and hence reduce the risk of conflicts between countries. Integration through an FTA will make the regional market larger, more attractive to investors both within and outside the FTA and can further create a platform that increases the region’s visibility and bargaining power when negotiating trade agreements. The patterns of FDI that follow the creation of an FTA may be similar to the effects of trade creation and trade diversion.
In his seminal contribution, Viner (1950) also identified two aspects that may result in response to the creation of a FTA or customs union. If joining the FTA leads to the replacement of high-cost domestic production with low-cost imports from other members of the FTA, trade creation has occurred and the country gains. However, if low-cost imports from the rest of the world are replaced by higher-cost imports from members of the FTA, this is trade diversion and the country loses (Viner, 1950). Trade creation results in an improvement in resource allocation and economic welfare, whilst trade diversion worsens efficiency in resource allocation. However, the Kemp–Wan (Kemp & Wan, 1976) theorem which was extended to FTAs by Panagariya and Krishna (2002) argues that it is always possible to form a regional agreement that maintains or improves the welfare of its individual members, creates a net improvement for the group and does not harm the rest of the world. The three conditions that need to hold are that: countries in the regional agreement need to implement a set of external tariffs such that the imports from outsider countries do not change, and secondly, the regional agreement would have to embrace total internal free trade, thereby leading to greater efficiency through trade creation. Lastly, a compensation mechanism should be used, such that any country that loses would have to be fully compensated. This approach would, therefore, have no trade diversion, as it would be non-discriminatory, and yet it would have trade creation in addition to being unambiguously efficient.
The empirical studies in this area are grouped into two: we have simulation studies done using CGE models and those that use econometric approaches. In the econometric group, Wu and Zeng (2008) studied the impact of trade liberalisation on imports, exports and overall trade balance for developing countries and found strong and consistent evidence that trade liberalisation resulted in higher imports and exports, but no robust evidence that liberalisation had a negative impact on the trade balance. Similar results were found by Paulino and Thirlwall (2004) using 22 developing countries. Serrano et al. (2015), evaluated the impact of the FTA between the EU and Mexico and found that the implementation of the treaty benefited the commercial flows of the goods for which each region presents a comparative advantage. They also found that foreign direct investment from the EU to Mexico had a positive and significant effect on Mexican exports to the world. Shujiro and Misa (2007) examined the changes in trade patterns before and after an FTA and using a gravity equation found that FTAs bring about trade creation and that the trade diversion effect is limited. Using disaggregated trade data results show different patterns among different products, and they identify trade diversion effect for many products in the case of the EU, the NAFTA and the MERCOSUR but not for the case of the Asian Free Trade Area (AFTA). These results were partly in line with those by Soloaga and Wintersb (2001) who analysed trade creation and trade diversion effects of major multilateral FTAs, finding positive trade creation effects for the FTAs in Latin American countries, and trade diversion effects for EU and the European Free Trade Area (EFTA). Based on the notion that the impact of FTAs on trade differs depending on the products, Gilbert et al. (2004) analysed the effects of major FTAs and natural trading blocs in East Asia by the sector and found that natural trading blocs in East Asia exist in merchandise and manufacturing sectors.
In the case of Africa, most of the studies focus mainly on analysing the impact of regional trade agreements (RTAs) on trade growth finding mixed results. Admassu (2019), using a comprehensive dataset of 148 countries for the period 1970–2010, found robust evidence that African RECs increase their members’ exports and imports, albeit with varying degrees whilst Olayungbo and Iqbal (2021) found that Common Market for East and Southern Africa (COMESA) has the highest contribution to the global exports, followed by East African Community (EAC), Economic Community for West African States (ECOWAS) and SADC with Economic Community of Central African States (ECCAS) and Southern African Customs Union (SACU) the lowest contributors. The positive effect of EAC on trade is confirmed by Umulisa (2020) and Buigut (2016) with the later finding that the EAC customs union produced a moderate positive effect on intra-EAC trade of about 22.1%. These findings are also confirmed by Afesorgbor (2017) whose meta-analysis study found positive effect of African RTAs of about 27%–32% even though his gravity model results show that ECOWAS and SADC are the only regional blocs that have significant positive impact on trade. The positive effect of ECOWAS on trade was confirmed by Osabuohien et al. (2019). However, Afesorgbor (2017), found that bilateral diplomatic exchange is a more significant determinant of bilateral exports among African states compared to regional integration. Using agriculture sector level data, Tegebu and Seid (2019) found that African RTAs have mixed effect on trade creation and trade diversion. Net trade creation is positive in three of the eight RTAs and it is negative in two. Sun and Reed (2010) found similar results for the SADC agriculture sector. These results however differed from those by Allaro (2012) who examined the impact of trade liberalisation on Ethiopia’s trade balance and found that the policy led to a worsening trade balance because of a rapid increase in imports. The trade-creating and trade-diverting effects of the SADC FTA were analysed using the gravity model by Fadeyi et al. (2014). The overall effects of the SADC trade agreement on South African agricultural trade are positive and significant, indicating that the trade agreement induces and generates trade among member countries. The problem with Fadeyi et al. (2014) study is that it was done just a year after the full implementation of the SADC FTA and its possible that the effects had not fully permeated into the economies. The mixed results found by studies by Afesorgbor (2017), Afesorgbor (2019), Olayungbo and Iqbal (2021) and Admassu (2019) on regional integration effects show that there is no consensus and results probably depend on data timelines used and data analysis techniques followed etc.
Simulation studies on FTAs also show mixed results. Mukwaya and Mold (2017) using a static CGE model analysed the effects of COMESA-SADC-EAC FTA on the East African region and found that the tripartite led to increased exports and imports. Simulation results from the Global Trade Analysis Project (GTAP) model suggested a net welfare gain of $10.7 billion, however, the distribution of these gains was heavily skewed with 92% of them going to consumers in Egypt, South Africa and Zimbabwe. Mold and Mukwaya (2017) also estimated the welfare effect of the COMESA-SADC-EAC FTA, using a Globe CGE model and GTAP database. The results indicate a significant increase in intra-regional exports as a result of tariff elimination, boosting intra-regional trade by 29%.
At the country level, Hallaert (2007) uses a CGE model to evaluate the impact of the SADC FTA on Madagascar finding that the FTA would have a limited impact on the country’s real GDP. However, Madagascar’s trade and production pattern would change, benefiting the textile and clothing sector. These findings, however, differ from those by Chauvin and Gaulier (2002) and Cassim (2001) whose results indicated that SADC trade potentials are rather small, especially for South African exports. These results show that FTAs are not always equally beneficial to all parties, confirming Bhattacharyya and Mandal’s (2014) argument that FTAs are beneficial for countries that have a higher priority for elastic tariff goods compared to countries preferring inelastic tariff goods.
Generally, the most important message coming from these empirical studies that focused on assessing the impact of African RTAs is that results depend on several factors, such as the specification of the model, estimation methods, the regional blocs being studied, sample size, data timelines and how the econometric issues such as the multilateral resistance of trade (MRT) and zero flows are dealt with (Afesorgbor, 2017). The result gives credence to the UNECA (2012) report that African RTAs have shown contrasting trade outcomes, with some achieving tangible and modest impacts whereas others show disappointing results.
Methodology
Empirical studies of economic integration can be divided into partial equilibrium analyses, CGE models and econometric studies. When analysing ex-ante trade liberalisation or tariff reforms, CGE models are preferred because of the way they capture complex interactions between and within sectors. However, when carrying out ex-post analysis, as in this study, gravity models are commonly used. Thus, CGE studies compared to econometric studies, are prospective rather than retrospective and are simulated rather than estimated (Krueger, 1999).
In the case of econometrics studies, one limitation raised in the literature is related to the problem of endogeneity or measurement issues (Rodriguez & Rodrik, 2001). Thus, gravity models capture the FTA impact using binary variables and such variables are extremely basic indicators of regional integration policy and do not capture the breadth and depth of an FTA. Binary variables may falsely attribute increased trade to an FTA because they are likely to be correlated with other factors, such as regional production sharing, technology diffusion, intraregional travel, and diplomatic efforts, that may be the true drivers of increased regional trade (Plummer et al., 2010). Considering these shortcomings, we supplement our gravity model results by using a statistical framework that compares trade performance of countries in FTA area to those in non-FTA areas to help minimise the impact of discretion (Billmeier & Nannicini, 2013). We use a before and after technique called DID. We ask whether tariff liberalisation in year T results in higher intra trade growth in years T + 1 compared to similar countries that did not liberalise or are not treated. The untreated or synthetic control comparison countries are those that did not join the SADC FTA, including Angola, DRC and the Comoros.
The Gravity Model
The gravity model has been used not only for estimating trade flows but even the impact of FTAs, customs union, migration flows as well as foreign direct investment. The main benefit of the gravity model in evaluating an FTA is that it can control for the effects of as many other trade determinants as necessary and can therefore isolate the effects of the FTA on trade. The basic gravity model of trade relates the exports of country i to country j (Xij)
4
positively to the GDP of the exporting country (Yi) and the GDP of the importing country (Yj), but negatively to the geographical distance between the importing and exporting countries (Dij):
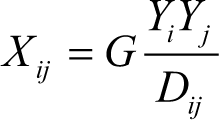
where G is a constant and when expressed in logarithmic form and after including an error term, the model becomes:

Other variables that capture trade costs (e.g., adjacency or common border, common language etc., will be added to this basic equation along with other control variables like exchange rate and population resulting in an augmented gravity model. Anderson and van Wincoop (2003) emphasised that bilateral trade is not only a function of distance between the two countries but also the distance of the pair from other countries. Thus, multilateral trade resistances denote the distance between the pair vis-à-vis the rest of the world: These resistances are the barriers which each of i and j face in their trade with all their trading partners. The higher the multilateral resistance, the more the pair of countries should trade with each other and vice versa. Multilateral trade resistance (MTR) will be easily included in the basic gravity equation as a set of fixed exporter (MTRi) and importer effects (MTRj)
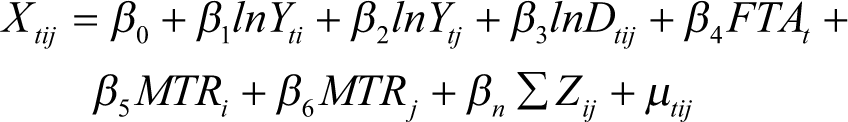
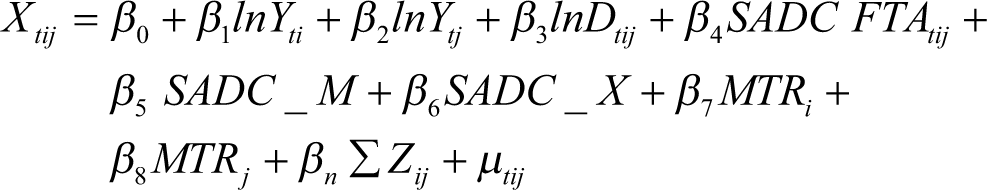
We use t subscripts here to indicate the time dimension of our data since we are using a panel dataset. FTA is a dummy capturing the agreement taking a value of one if the two countries are members of the FTA and zero otherwise. Zij captures other controls like exchange rate, common language, adjacency, etc. For the analysis of an FTA, we add two variables to the augmented gravity equation to capture trade creation and diversion and the first is an indicator variable (SADCM)which take the value of 1 if the destination country j belongs to the FTA and the origin country i does not and 0 otherwise. It captures REC imports from the rest of the world. SADC_X, which is equal to 1 if the origin country i, belongs to the FTA and the destination country j does not and 0 otherwise. It captures FTA exports to the rest of the world. This is the approach used by Carrère (2006) and Martínez-Zarzoso et al. (2009):
The Difference in Differences Technique
The D-I-D method is defined as the difference in the average outcomes in a treated group before and after treatment, minus the difference in the average outcome in the control group before and after the treatment period, hence the ‘difference of the differences’. The treated countries are the 13 countries that belong to the SADC FTA whilst the untreated are the three SADC non-FTA members (Angola, DRC and Comoros) and other African countries that are not SADC members. The estimator must meet the following assumptions for it to be unbiased: the model equation must be correctly specified, the error term must average zero, and it must not be correlated with any of the variables in the model equation (i.e., cov (ei, Ti) = 0; cov (ei, ti) = 0; and cov (ei, Ti,ti) = 0. The last assumption is very important and is also called the parallel trend assumption.
The D-I-D estimator can be represented as follows:
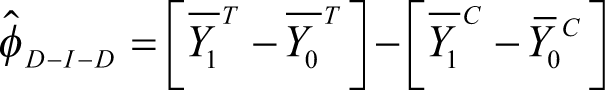
where the first part of the equation represents the difference in outcomes of the treated group before and after treatment; and the second part represents the difference in outcomes of the control group in the before and after treatment periods. Taking expectations of the estimator in Equation (5) yields the unbiased D-I-D estimate (δ), taking into account the time trend from the treatment group’s estimator:
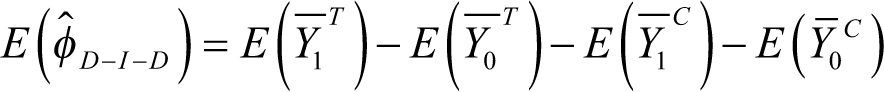
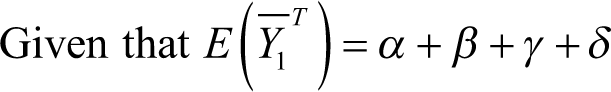
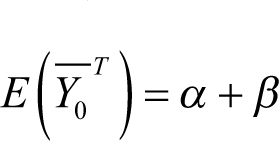
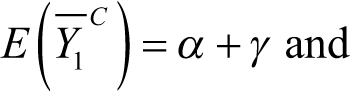
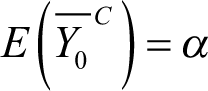
where α is the constant term; β is the group-specific treatment effect (accounting for the average permanent differences between the treatment and the control groups); γ is the time trend common to treated and untreated groups; and δ is the true effect of the treatment.
The D-I-D estimate can be calculated using the following regression:

where δ is the coefficient on the interaction between the SADC FTA treatment variable (Ti) and the time variable (t, which ranges from 2001 to 2019) and it gives the average D-I-D effect of the SADC FTA. Thus, δTit is the DID estimate that we will obtain via a regression model. We also include t and Ti variables separately to pick up any individual mean effects that vary across time and across countries that are treated against those that are not treated, respectively. X is a vector of controls that can also affect exports (e.g., income, exchange rate, distance and common official language). The assumptions above must hold for the estimate to be unbiased. One of the common problems with the estimator is the violation of the parallel trend assumption. This however can be resolved by getting longer data series before and after the treatment to establish if there are any pre-existing differences in the trends (Meyer, 1995). Our dataset is from 2001 to 2019 and the SADC FTA was fully implemented at the beginning of 2012. Since it is not possible to test for the parallel trend assumption, we hope the time before and after FTA implementation is long enough not to violate this assumption. The inclusion of African countries not members of SADC is to increase the number of non-treated countries so as not to infringe the parallel trend assumption.
Data and Variables Measurement
The variables used in this study will be largely borrowed from the gravity models of trade and these include GDP to measure income levels, exchange rate and population to measure market size. There are three common official languages used by SADC countries, namely, French, English and Portuguese and these will be used to create the bilateral common language dummy. The variables will be sourced from various databases such as World Bank World Integrated Trade Solution (WITS), International Trade Center - TradeMap, CEPII and World Bank World Development Indicators. Intra-trade will be measured as a sum of exports and imports expressed in US dollars. We will use data for the period 2001 to 2019 5 to capture the before and after scenarios. We do not include year 2020 data specifically to avoid the impact of the Covid-19 pandemic on our results. Since according to the SADC Integrated Regional Electronic Settlement System (SIRESS) about 60% of transactions are settled in US dollars and 35% in South African rands, we will include the exchange rate variable capturing the amount of local currency needed to purchase one US dollar.
Results Presentation and Analysis
The objective of this study is to evaluate the impact of the SADC FTA on intra-exports. We do this using an ex-post technique called the gravity model as well an impact evaluation technique in the form of a DID estimator. In the gravity model, we use a dummy to capture the impact of the SADC FTA whilst in the DID we estimate the significance of the difference between the performance of the treated (those countries that joined the FTA) and untreated (countries that did not join) the arrangement. The panel gravity model can be estimated using many static panel techniques like fixed and random effects models. The fixed effects model assumes that the specific effects of each pair of countries may be correlated with the independent variables without being correlated with the error term whilst in the random effects, the account is made for unobserved heterogeneity. The Hausman test is normally used to select between the two. Even though according to Kepaptsoglou et al. (2010), the fixed effects model is ideal for capturing country heterogeneity and multilateral resistances to trade the random effects is recommended when interested in time invariant effects. The RTA dummy is time invariant and only changes when membership changes and in the case of SADC, the composition of FTA membership has not changed since 2012 even though Comoros joined the bloc in 2017.
Although the theoretical framework of the gravity model has been robust, there have been challenges with the empirical estimation. Issues related to missing multilateral resistance effects, selection bias (in the presence of zero bilateral trade), heteroscedasticity and endogeneity have led to biased estimators (Piermartini & Yotov, 2016). Outward and inward multilateral resistances are corrected for using country pair fixed effects in line with Baier and Bergstrand (2009). Kohl (2014) also recommends using time-varying fixed effects as multilateral resistances are dynamic. The selection effect associated with the presence of zero trade flows can be minimised by adding a one to the zero trade flows and then taking logs or using a Tobit model. However, Silva and Tenreyro (2011) argue that estimation of the gravity model in log linear form using ordinary least squares (OLS) and the Tobit model produces biased estimates due to heteroscedasticity. They found that the Poisson pseudo-maximum likelihood (PPML) estimator (multiplicative form) produced consistent estimators in the presence of zero trade values because the zero observations did not matter for the estimation of gravity equations in their multiplicative form.
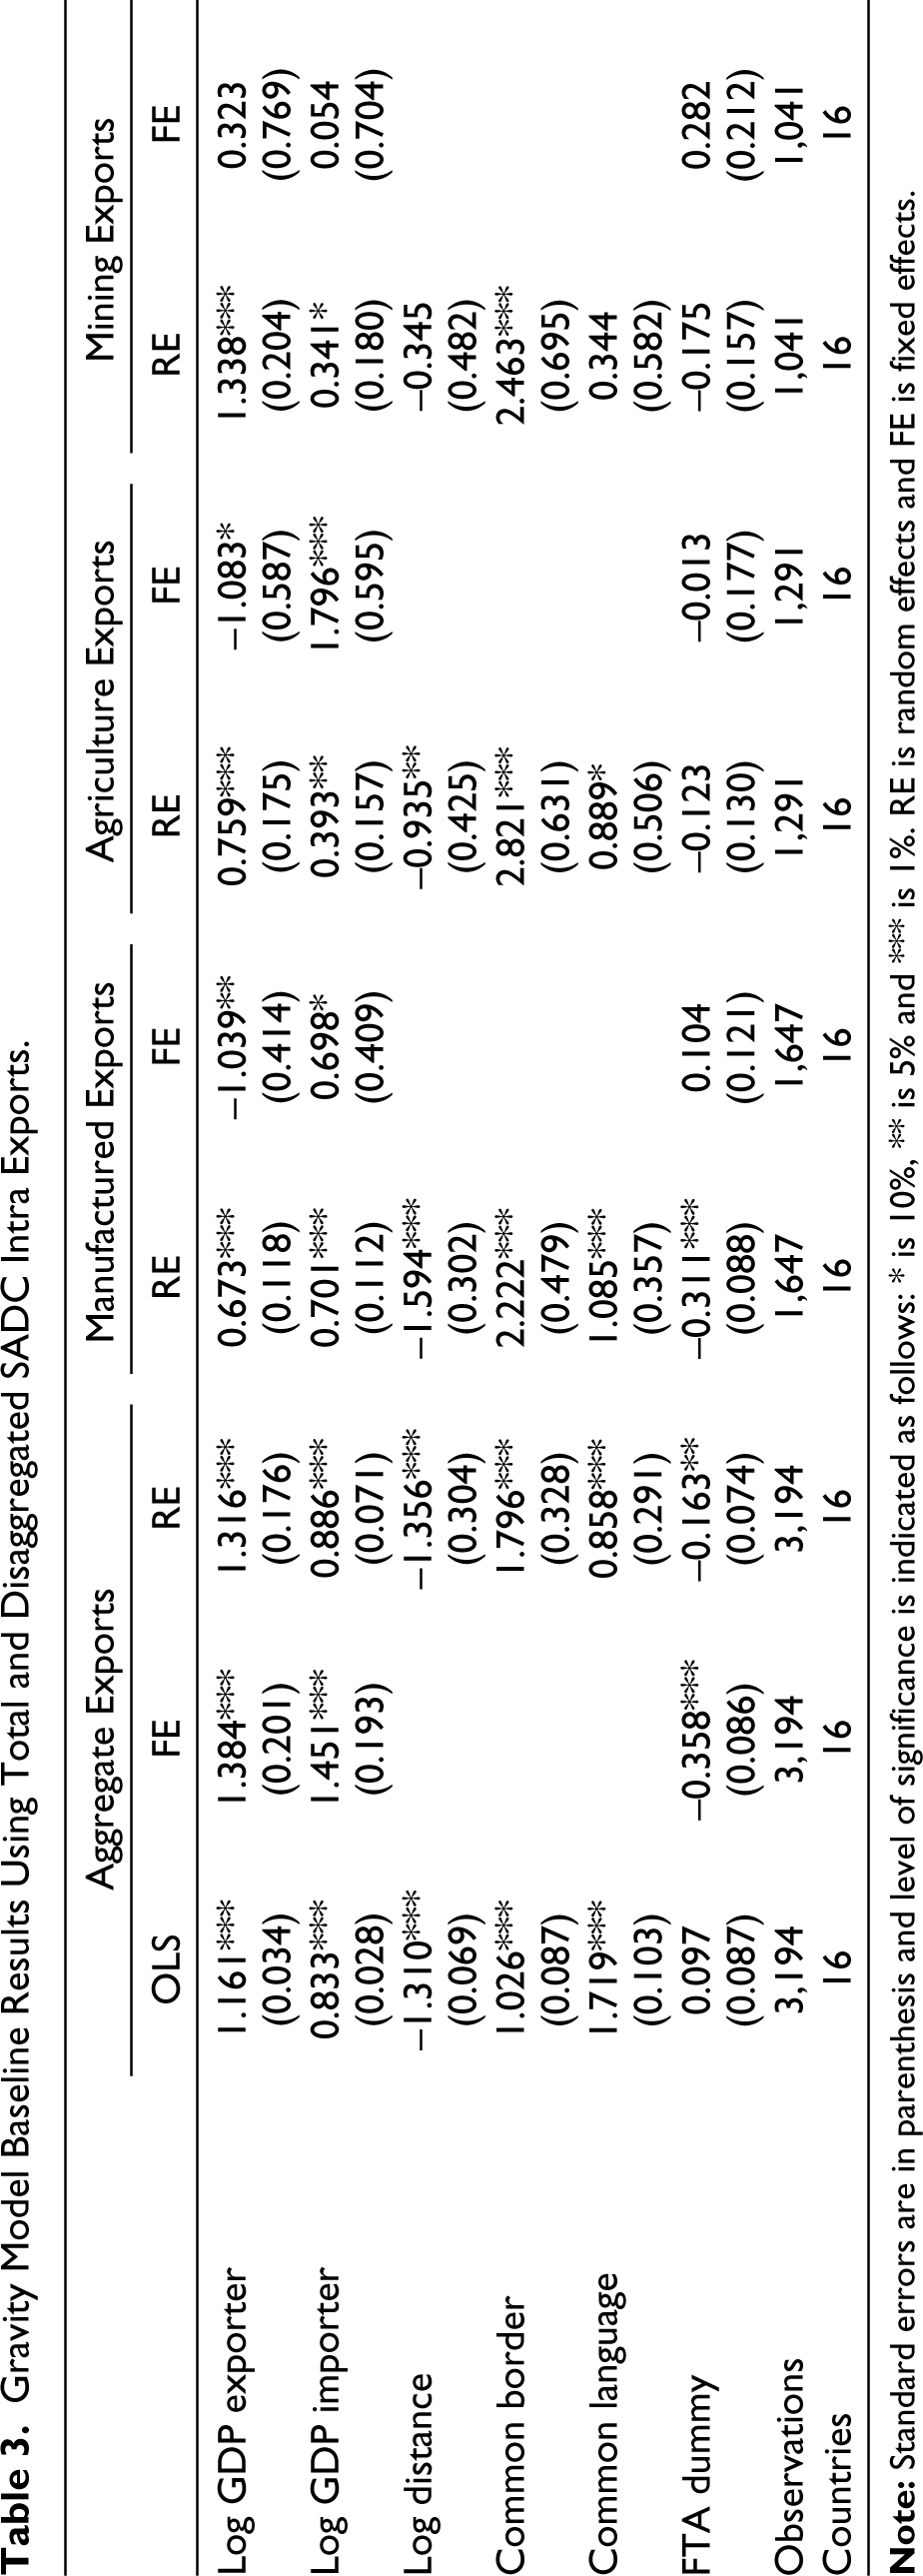
The results using the gravity model are presented in Table 3. Baseline models were estimated using the pooled OLS, random and fixed effects. Results are generally the same across the models and the variable of interest, SADC FTA dummy is generally insignificant in some cases significant but negative. Other gravity variables are significant carrying the expected signs. These results suggest that removing tariffs in the SADC region did not improve intra exports. This finding is similar to what Evans (2000) found using partial equilibrium model. He found that the proposed SADC FTA, will have a low effect on total demand, imports and employment. Evans model was re-estimated several times partly as a reaction to criticisms of the data and elasticities used but the re-estimated model still showed marginally different results (Cassim, 2001).
Gravity Model Baseline Results Using Total and Disaggregated SADC Intra Exports.
According to Silva and Tenreyro (2011), the presence of heteroskedasticity under the assumption of a multiplicative error term in the original nonlinear gravity model can be corrected using PPML estimator. Other advantages of using the PPML is that it is consistent in the presence of fixed effects and is still efficient even in the presence of zero trade flows. Zero trade flows in OLS leads to sample selection bias, and Table 2 clearly shows that there are some countries in the region with zero trade flows. Although the dependent variable for the Poisson regression is specified as exports or total trade in levels rather than in logarithms, the coefficients of any independent variables entered in logarithms can still be interpreted as simple elasticities. We therefore went further and used the PPML model, to control for heteroscedasticity and the presence of zero trade flows as well as account for multilateral resistances. 6 Results are presented in Table 4.
Main Gravity Results Using PPML.
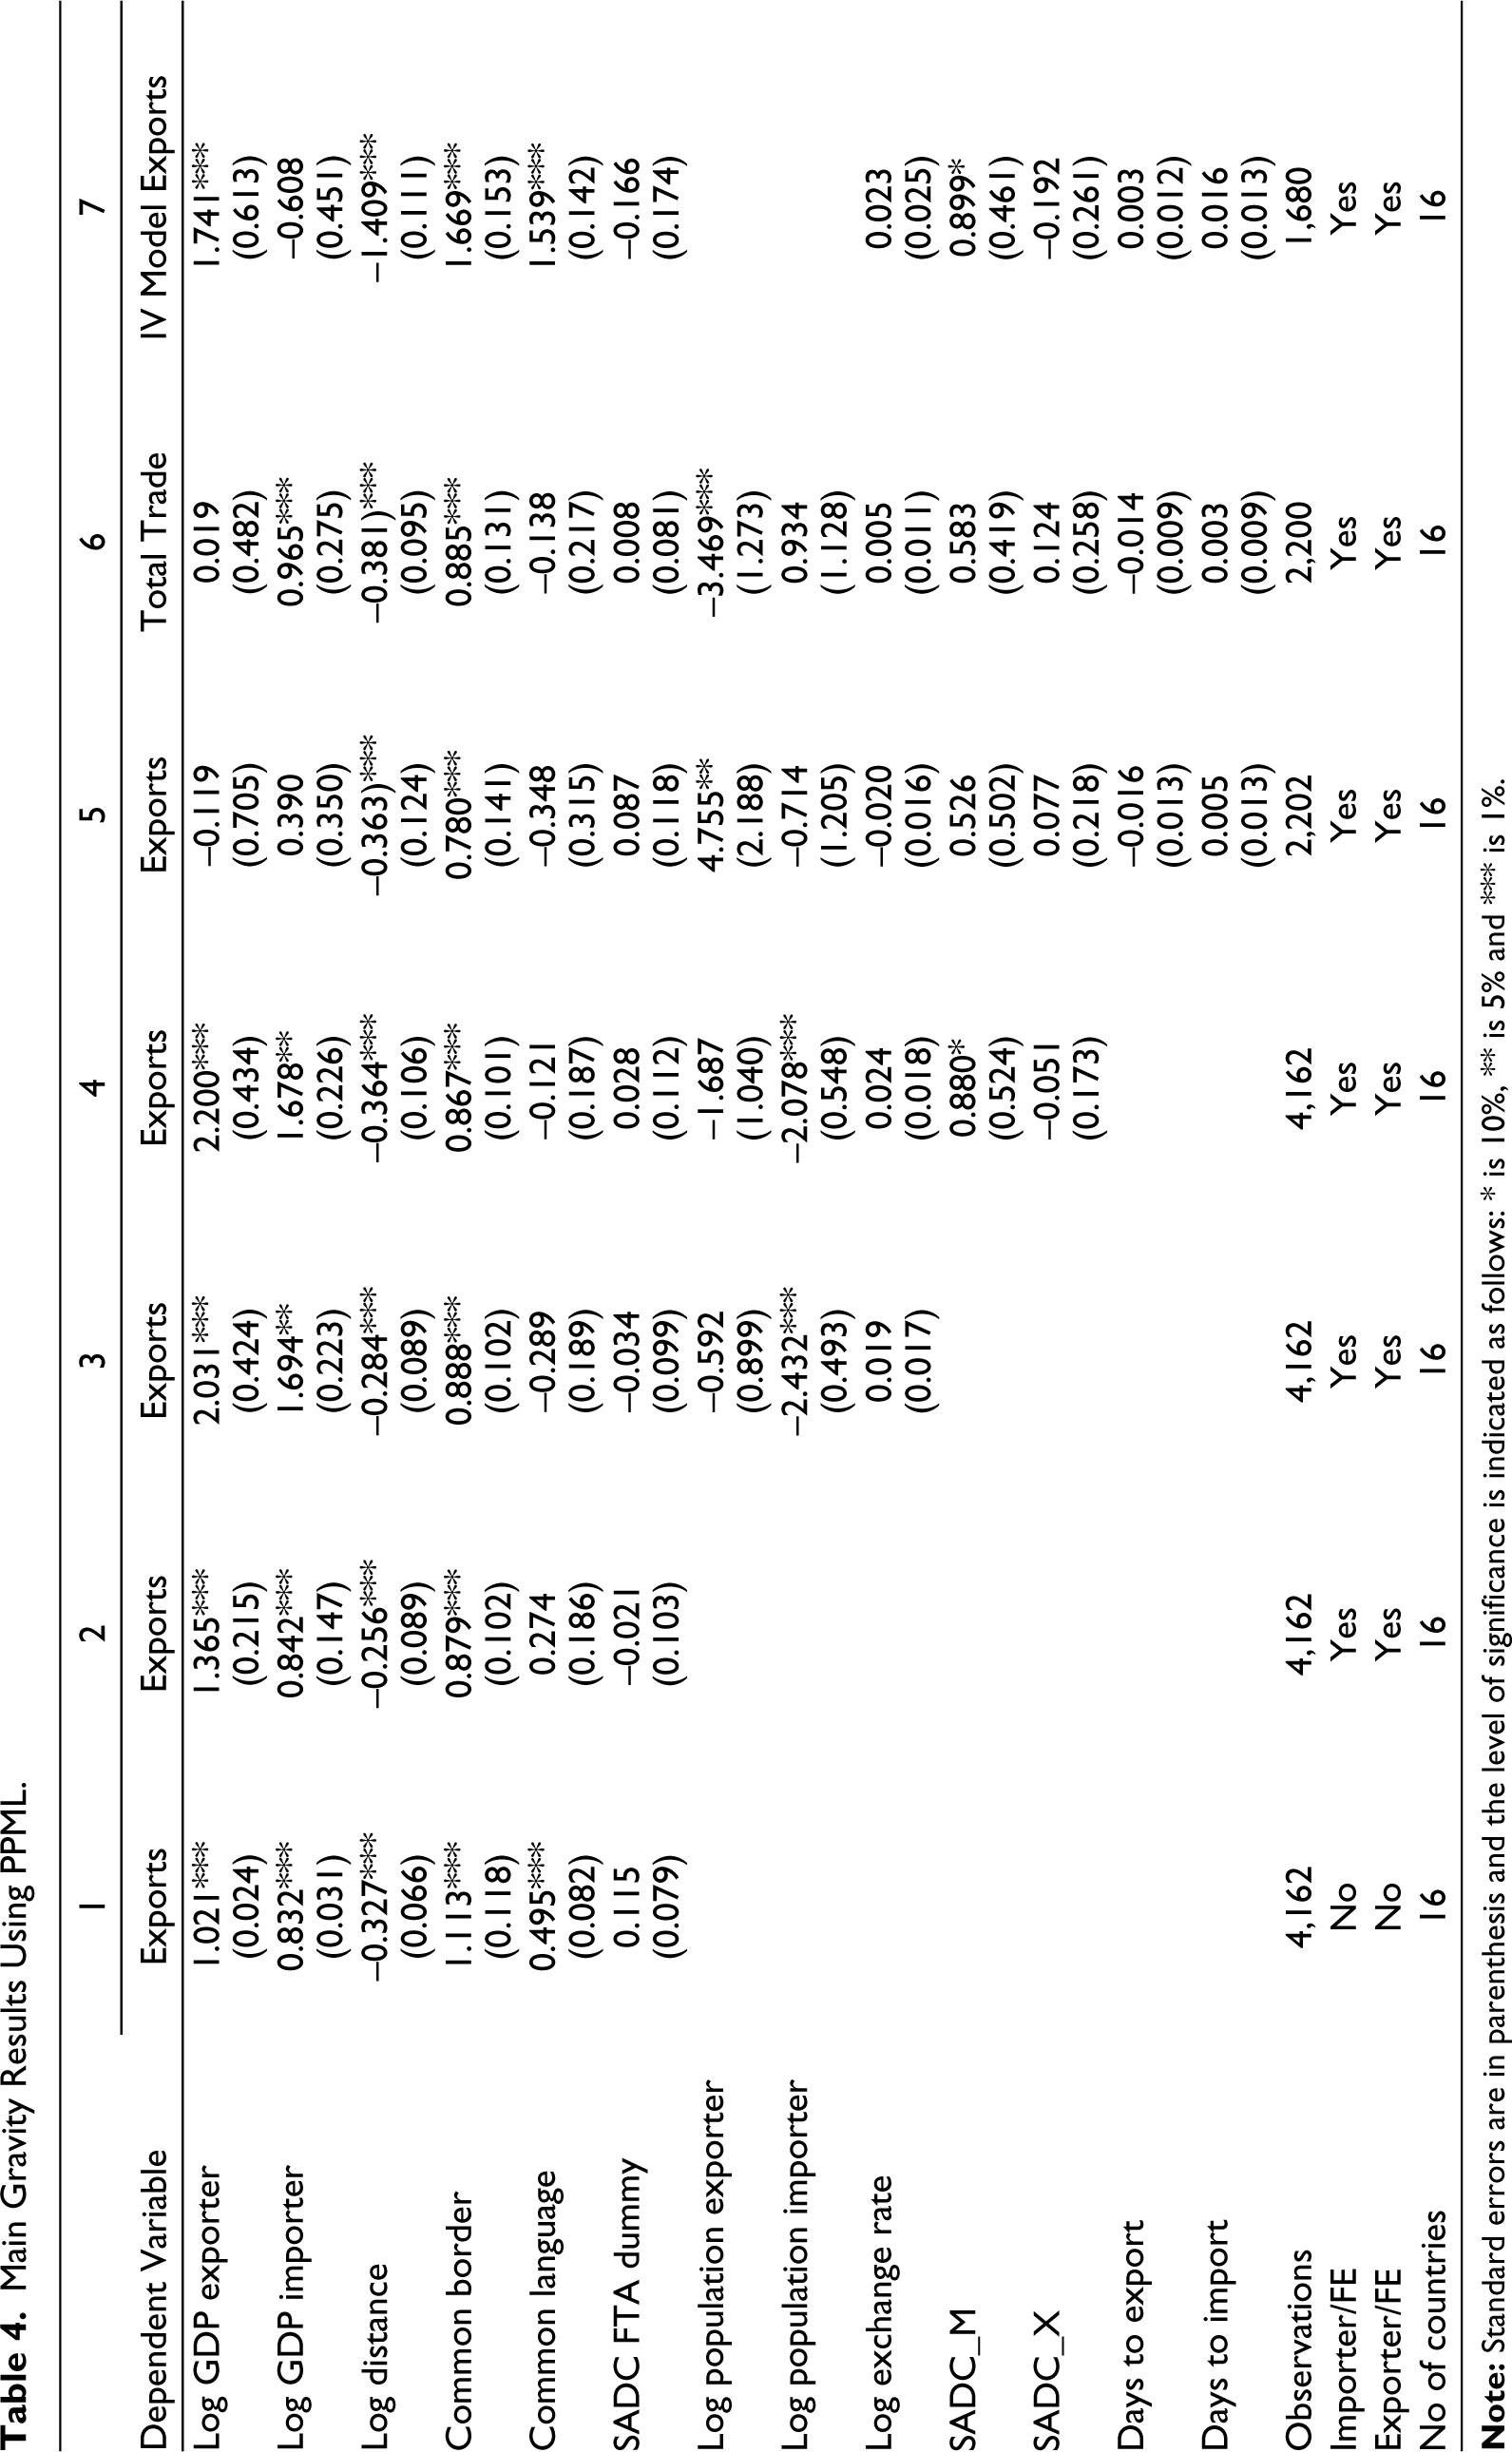
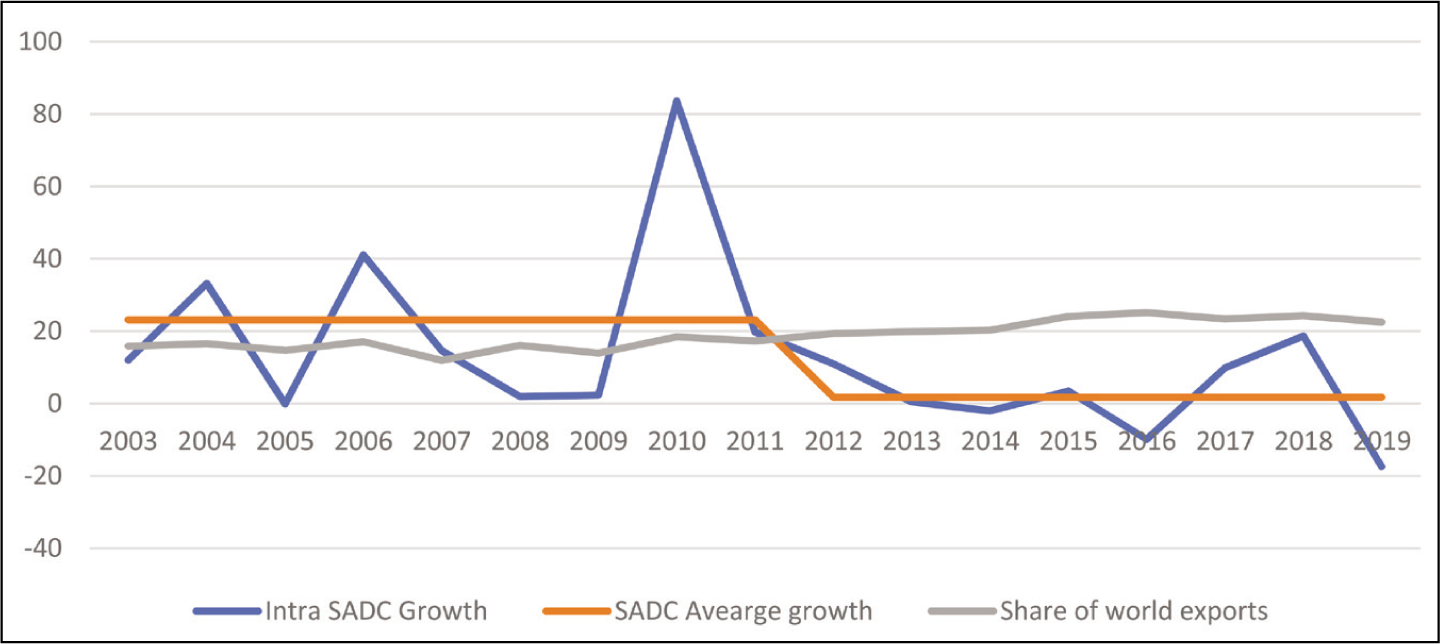
The SADC FTA dummy is generally positive though not significant across all the PPML models suggesting that the FTA has a weak positive effect on intra-exports in the region and these results are similar to what Fadeyi et al. (2014) as well as Mukwaya and Mold (2017) found. These results are replicated even after considering that sometimes MTRs are not fixed but time-varying in line with Kohl (2014). The FTA dummy is positive and significant at 10% when using exports as a dependent variable but remains insignificant when using disaggregated data (see Table 9, appendix). Buigut (2016) found something slightly similar when looking at the impact of the EAC customs unions, whilst Admassu (2019) found SADC effect on exports to be statistically insignificant. We also interrogated the fact that FTAs are typically implemented gradually with some provisions of the agreements being phased-in later. The SADC FTA minimum conditions were attained in 2008 when about 85% of intra-regional trade attained zero duty and to capture this, we decided to lag our FTA dummy by 4 years (FTA lag 4) and results show that this variable though insignificant is negative (see Table 8 appendix). This suggests that as long as maximum conditions of 100% tariff reduction have not been attained, the SADC FTA was also not effective in boosting intra-trade flows. Mukwaya (2019) also found similar results when looking at impact of RECs on manufactured exports in Africa. Afesorgbor (2019), in a study of 45 African countries, found that African RTAs have a positive but insignificant effect on bilateral exports affirming the fact that African RTAs are not particularly effective in promoting trade compared to RTAs in other developing regions, a conclusion also in line with results found by the United Nations Economic Commission for Africa (2012). The weak effect of the FTA dummy is also in line with what Kohl (2014) found when assessing the economic effects of economic integration agreements (EIAs). He found that more than half of the EIAs investigated have had no discernible impact on trade at all, whilst only about one-quarter of the agreements are trade promoting. Cassim (2001) and Chauvin and Gaulier (2002) argue that except if structural changes take place in SADC countries, trade potential seems low. Chauvin and Gaulier (2002) argue that low trade potential can be explained by the fact that comparative advantages of SADC countries remain concentrated in similar products and that South Africa continued trade surplus vis-à-vis SADC region suggest that potential trade opportunities may have already been exploited. To also try and explain the insignificancy of the SADC FTA dummy, we looked at the annual growth of SADC exports before and after the implementation of the FTA. Before the implementation of the FTA in 2012, exports were growing on average at around 20% per annum and this growth fell in 2012 to about 2% per annum (ITC Trademap, 2022). The share of intra-SADC exports in world exports has generally been constant and been improving mildly (see Figure 2). This shows that the direction and destination of the region’s exports has not significantly changed. The fact that SADC’s share of world exports appears to be improving since 2011 suggests that SADC’s preference for extra trade is higher than that of intra trade.
Two countries are more likely to liberalise trade between themselves if they are already significant trade partners, implying that there is possible reverse causality between trade and FTA and hence endogeneity. To test this potential for reverse causality between trade and FTA, we include a lead variable of FTA, FTAijt+3 or FTA lead 3. If the lead variable is statistically significant, then there is reverse causality between FTA and trade, and trade is causing the FTA. Results in Table 8 appendix show that the lead variable is positive but insignificant implying the absence of reverse causation and confirming results obtained by Mukwaya (2019). Kohl (2014) recommends that if the phase in approach creates endogeneity, then the gravity model should be estimated in first differences. The issue of endogeneity can also arise due to simultaneity between the dependent and independent variables. Thus, there is a bidirectional relationship between GDP and exports or total trade and to correct for this we decided to instrument for GDP using its lagged value and then estimated an instrumental variable model using random effects. This is the same approach used by Timsina and Culas (2020) and Shahbaz and Rahman (2012). Results in Table 4, Column 7 show that the FTA dummy is still insignificant and negative. 7
We extended the analysis further and disaggregated our data into three main sectors (manufacturing, agriculture, forestry and fisheries as well as mining) using Standard Industrial Classification) and Harmonised System 2007 nomenclature. Yang and Martinez-Zarzoso (2014) suggest that disaggregated data for specific commodities are important, in terms of differences in the trade structures and integration impacts. Cassim (2001) also argues that using disaggregated trade data will help analyse the diversification of trade potential and trade patterns. This data were collected from World Bank, WITS (2022) database. Results are shown in Table 5.
Sector Level Gravity Results Using PPML.
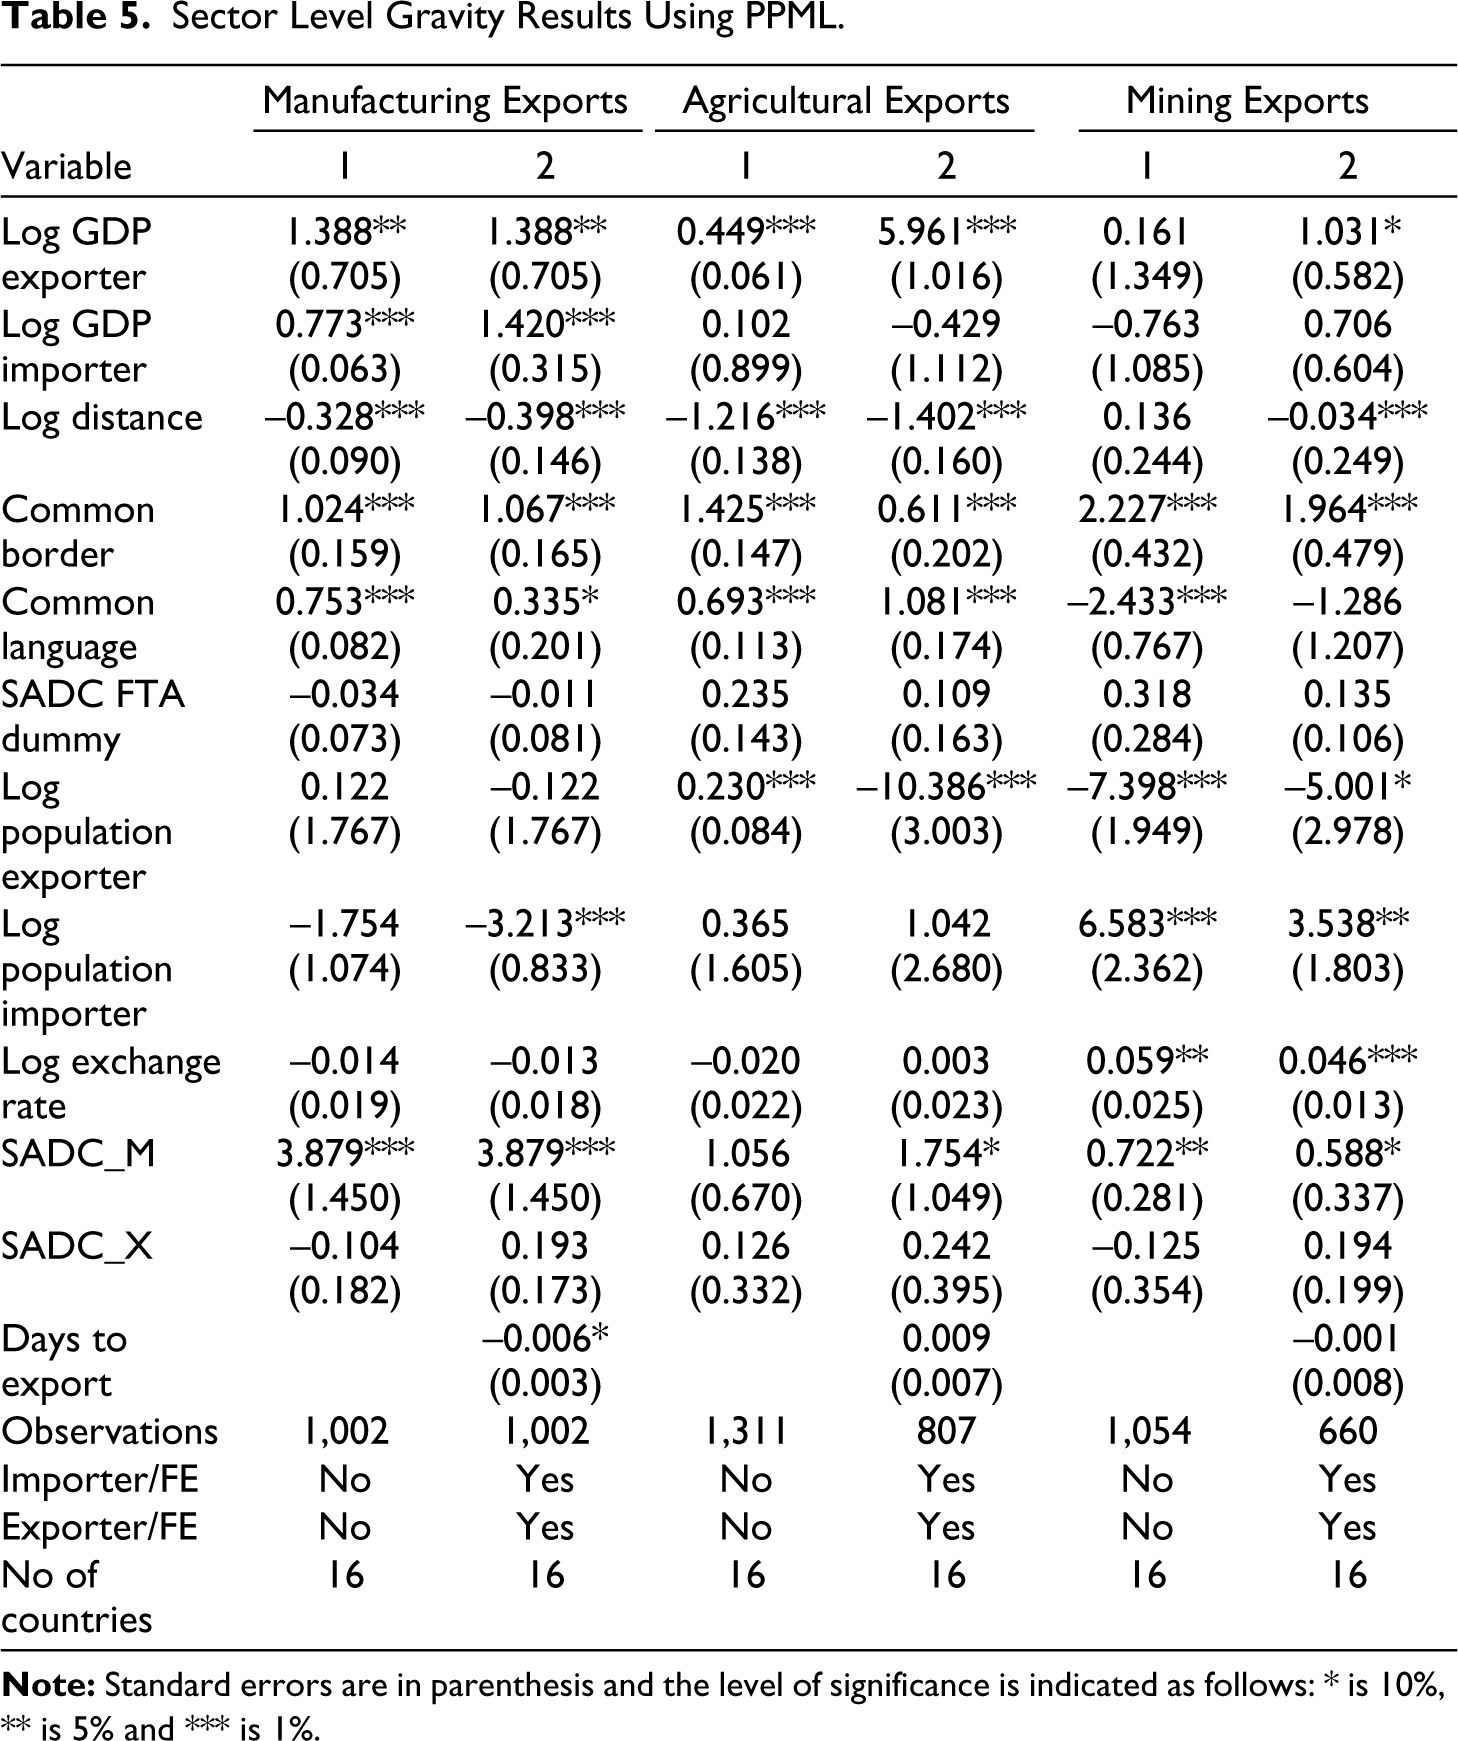
The FTA dummy has an insignificant effect in all the sectors. This is probably explained by the fact many countries in the region except South Africa have a limited manufacturing base, so reducing tariffs will not improve manufacturing exports. Having similar comparative advantages and disadvantages in the manufacturing sector (Chauvin & Gaulier, 2002) affect the ability of SADC countries to trade with each other. Poor rainfall patterns that have characterised also contribute to poor agricultural trade whilst low levels of mineral beneficiation may have little effect on mineral exports. Moreover, natural trade partners for mining and agricultural goods producers are industrialised countries and so the scope for trade within SADC is limited (Chauvin & Gaulier, 2002). These results are partly in line with what Grant and Lambert (2008) using North Atlantic FTA, EU and Mercusor data found when using agriculture and non-agricultural products. However, Mukwaya (2019) found that African RECs increased manufacturing exports, 12 years after REC ratification. Benguria (2022) when looking at whether United States exporters take advantage of FTA agreements found that FTA use is incomplete and increases based on the magnitude of duty savings, which suggests the existence of a fixed cost to taking advantage of these preferences. Thus, many of these SADC countries have a long preferential trading relationship with the EU through economic partnership agreements and even USA through AGOA and the fixed costs of changing trade partners may also play a role in the case of SADC FTA. The other factor driving these results is that the implementation of the FTA in 2012 probably comes after substantial changes in trade levels have already materialised, given the fact that the SADC Protocol on trade was passed in August 1996. Factors, other than trade policy, could now be driving the magnitude and direction of trade in the region.
In addition to using the gravity model, we also alternatively evaluated the impact of the SADC FTA using a DID estimator. This is not only to overcome the challenges of using an FTA dummy but for robustness purposes. Results are presented in Table 6. The treated countries are 13 whilst the untreated ones are also 13 including three SADC countries (Angola, DRC and Comoros). 8 We believe that the exclusion of these three SADC countries is not deliberate, and they self-selected themselves out of the FTA due to some economic factors. Other non-treated countries like Morocco, Algeria and Mauritania also do not belong to any REC with an established FTA. Instead of looking at trade flows between exporting and importing countries, we used total SADC intra-exports for each SADC member country and distance was calculated as the average distance between one country and the rest of SADC member states. In the case of common language, we used the fact that majority of countries (about 10 out of 16) in the SADC region use English as an official language. The results were estimated using various panel techniques and the main message across the models is that the DID estimate, which measures the impact of the SADC FTA, is insignificant (significant only when using fixed effects) and confirms results obtained using the gravity model. We also ran DID estimates at sector level (see Table 10 appendix) and found that the FTA dummy is generally insignificant across the sectors only positive and significant in the mining sector. The significance of the mining SADC FTA dummy could be capturing the fact that there are some countries in both South Africa and Botswana that are into mineral beneficiation and thus importing regional minerals for processing.
DID Results.
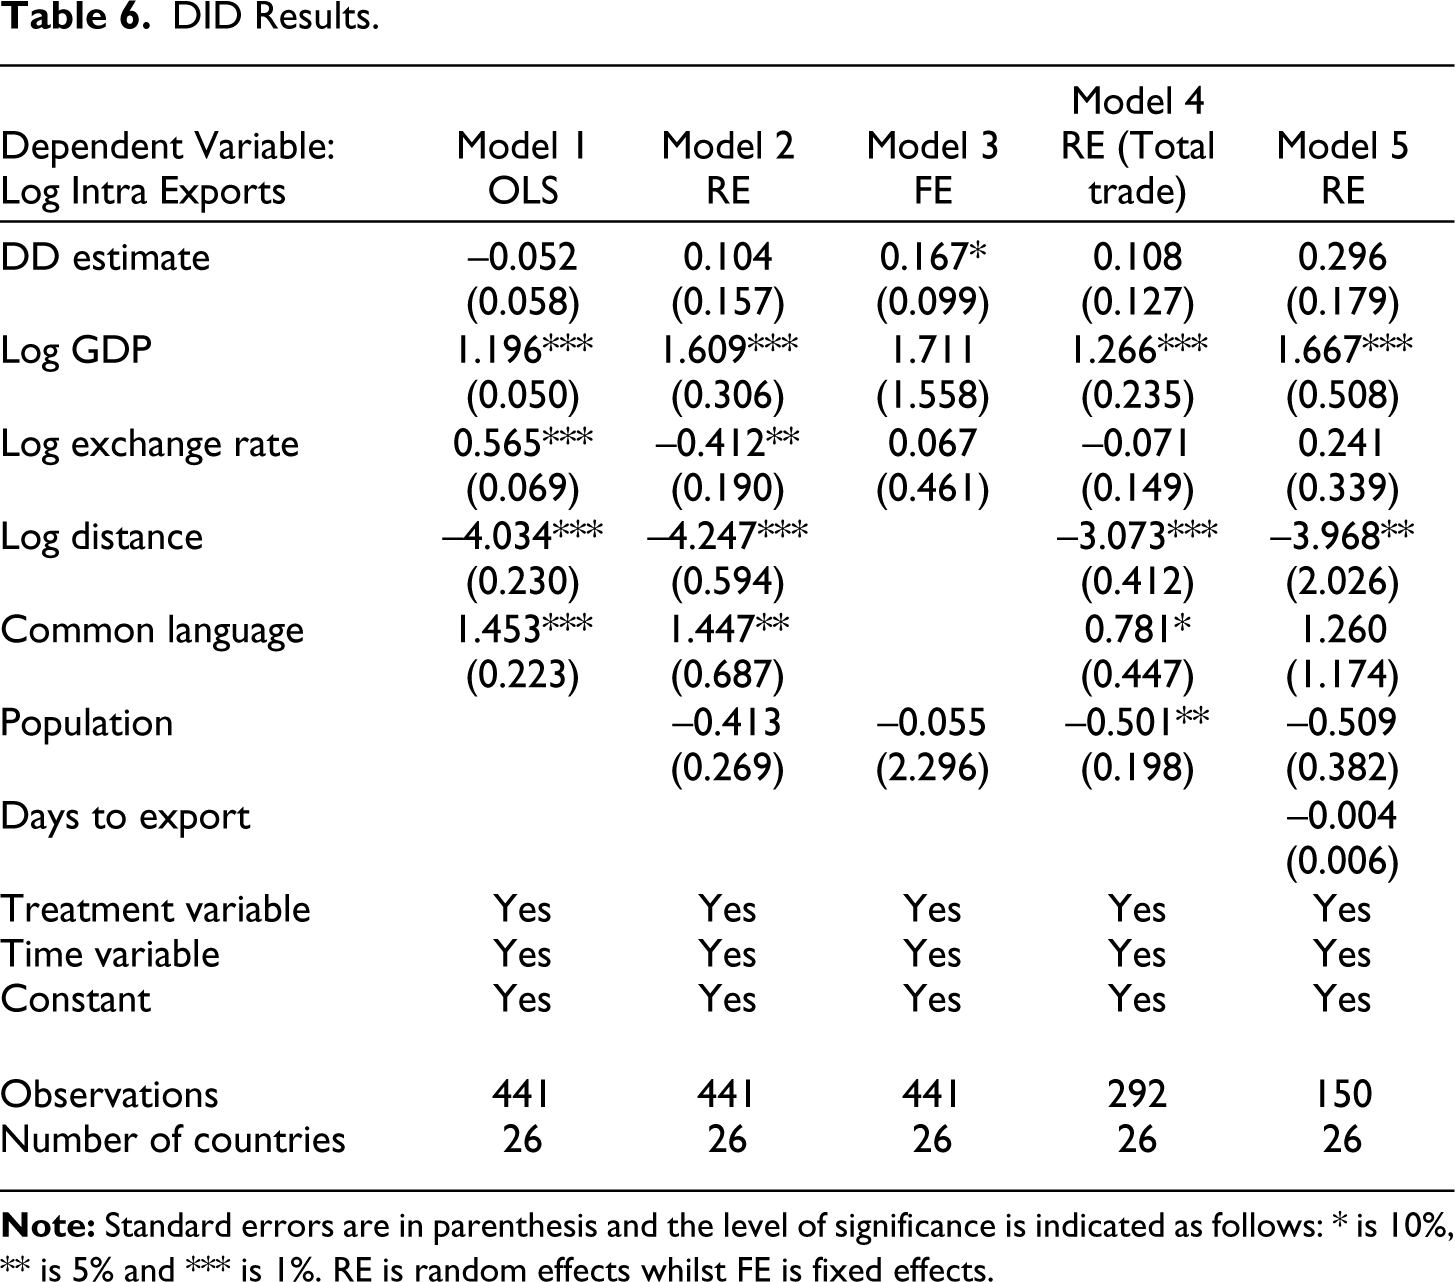
Generally, these results show that full liberalisation of tariff lines in 2012 has not improved intra trade performance in the SADC region. The other factor that could affect the effectiveness of the SADC FTA is the issue of overlapping membership. Overlapping membership creates legal uncertainty, unnecessary costs and delays in the implementation of reforms (Fall & Gasealahwe, 2017). The 16 SADC countries except Mozambique belong to more than one FTA with countries like Comoros, DRC and eSwatini belonging to three FTAs. 9 These FTAs are governed by different rules of origin, and this may affect regional intra-trade and is possibly the reason why SADC, EAC and COMESA wanted to reconcile these rules by forming the Tripartite FTA. Afesorgbor and van Bergeijk (2014) and Olayiwola et al. (2015) found that structural issues, like multi-memberships, institutional framework and high transport cost, as being among the key impediments to intra-regional trade in the ECOWAS and SADC regions.
The insignificance of the SADC FTA dummy cast doubts on the success of the AfCFTA unless if the simulated trade benefits will be driven by other regions specifically those that have never formed an FTA. There are only three such RECS in the continent AMU, CEN-SAD and IGAD. In total, 50 of the 54 African countries that signed the AfCFTA are members of the five operational FTAs and if these SADC results reflect the performance of the other four FTAs then the perceived AfCFTA benefits may not be realised. Heterogeneity in FTA performance in the continent will probably determine the AfCFTA performance.
In the case of other control variables, the significance of the GDP variables across all models suggests that income of the importing and exporting countries is important in influencing exports. Thus, GDP results suggest that bigger countries tend to trade more. The distance variable which is a proxy for trade costs shows that trade is also influenced by agglomeration effects and the lower the trade costs or distance the higher the level of trade. These results are in line with findings made by Vicard (2009), Woo Kang (2016), Cassim (2001), Osabuohien et al. (2019) as well as Francois and Manchin (2013). The population variable results (positive for exporting country and negative for importing country) could be explained by the fact that larger economies tend to be more autarkic than smaller economies. Small non-diversified economies trade more of their output than larger diversified countries due to size constraints and protective trade policies (Cassim, 2001). There are also middle-sized countries that are not as sensitive to a relationship between the population and openness and all these issues distort the effect of population variable on trade (Cassim, 2001).
Using the gravity model, the exchange rate variable is generally insignificant when using intra-exports but positive and significant at the sectoral level in the mining sector implying that depreciation improves mining exports. Woo Kang (2016), Woo Kang and Dagli (2018) whilst Njoroge (2020) found exchange rate volatility to depress exports. The inconsistency in the exchange rate results may probably be explained by the fact that not all transactions that are processed via the SADC Integrated Real time Settlement System are denominated in US dollars. More regional currencies are being introduced in the system to facilitate settlement.
Other variables like common language and common border are generally significant with expected signs across all the models and in line with findings by Osabuohien et al. (2019), Cassim (2001) and Ackah et al. (2013). We also included days to export to capture non-tariff barriers to trade and results show that the variable has a weak negative effect on exports partly confirming what Osabuohien et al. (2019) found for ECOWAS but contrary to what Ackah et al. (2013) found for the same region. It is negative and significant when using manufacturing exports partly confirming what Bedoya and Frohm (2022) found regarding the importance of border effects. They found that that reduced border effects account for the bulk of the increase in international manufacturing trade. However, this variable might be affected by the fact that some regional borders are not open 24 hours and therefore using days to export might not be a good measure of clearing times. A number of documents to complete or cost of clearing might be better measures though these indicators are only available from the World Bank Doing Business only from 2016 onwards.
In addition to the SADC FTA dummy, we introduced some variables to capture the aspects of trade creation and diversion using SADC_M and SADC_X dummies. 10 This follows the approach used by Carrère (2006) and Martínez-Zarzoso et al. (2009). We capture the effects of the SADC FTA on trade creation and diversion using the coefficients of these three SADC dummies (β4, β5 and β6) as in Equation 4. Pure trade creation, which is an increase in intraregional trade, occurs when β4 > 0 and β5 ≥ 0 and β6 ≥ 0. Pure trade diversion is an increase in intra-regional trade which is fully offset by a decrease in intraregional imports from the rest of the world or non-FTA countries. This occurs when β4 > 0 = β5 < 0. The presence of trade creation and diversion is observed if β4 > 0, and β5 ≥ 0 and β4 > 0 = β6 < 0. Simple trade creation requires β4 > 0, whilst in the case of trade diversion, β5 < 0.
When using the PPML model and exports as dependent variables in Table 4, we find the following: In the case of exports, Column 5, β4 = 0.087, β5 = 0.526 and β6 = 0.077. There is weak pure trade creation because these coefficients are all greater or equal to zero but insignificant. There is also no pure trade diversion because this condition: β4 > 0, and β5 ≥ 0 and β4 > 0 = β6 < 0 is also not met. Even at sectoral level, using Table 5 (Column 2), there are no pure effects, but elements of trade diversion and creation are present. Under agricultural exports, for example, β4 > 0, β5 ≥ 0 and β6 > 0 but two of these coefficients are not significant. However, using simple trade creation and trade diversion definitions as explained by Plummer et al. (2010) the positive and significance of the SADC FTA dummy (β4) implies trade creation whilst the negative and significance of SADC_M suggest trade diversion. Using results in Table 4 these two dummies are not significant but using results in Table 5 shows that SADC_M is significant in all the three sectors suggesting trade diversion. These results are similar to what Soloaga and Wintersb (2001) found on Latin American FTAs and European FTAs as well as what Sun and Reed (2010) found for SADC but differ from what Shujiro and Misa (2007) found. Timsina and Culas (2020), however, found that Australia FTA with China, USA and Korea as well as Japan have larger trade creation effects in the agricultural sector. Yang and Martinez-Zarzoso (2014) also reported the ASEAN–China Free Trade Agreement (ACFTA) has substantial and significant trade creation effects in the case of both agricultural and manufactured goods. Similar results were found by Singh (2021) using India–Association of Southeast Asian Nations (ASEAN) Free Trade Agreement (IAFTA). A study by Tegebu and Seid (2019) analysed the effect of African RTAs on strategic agricultural products and found that the RTAs have mixed effect on trade creation and trade diversion with SADC having no net creation or diversion effect. Studies done on African RTAs found that the COMESA, ECCAS and ECOWAS trade agreements do not have any considerable trade diversion and creation effects because of the lack of trade complementarity between member countries (Carrère, 2004; Mayda & Steinberg, 2009; Musila, 2005; Rojid, 2006). Anderson (2018) also argue that unforeseen events and trade-distorting policies can mask or overwhelm the FTA effects.
Conclusion
Evaluating the impact of SADC FTA on intra-regional exports and sectoral trade is important to check whether the complete elimination of tariffs in 2012 has yielded any significant results. This will help determine the corrective actions to be taken if there is need. This is important in the sense that the African Union recently established and launched a continent-wide FTA to boost intra Africa trade and so the success of this African Union initiative also hinges partly on the performance of the regional FTAs such as the SADC FTA. Thus, did the elimination of tariffs as part of SADC FTA in 2012 improve intra SADC trade and can this be replicated even at AfCFTA level?
Results estimated using the gravity model show that the full implementation of the SADC FTA has not significantly improved the level of intra-exports in the region. The pattern of results is replicated even when using an alternative DID estimator. The DID estimate is insignificant across most estimated models. The presence of elements of trade creation and diversion also affects the effectiveness of the FTA. The gravity and DID results somehow show that the impact of the FTA is not necessarily influenced by the methodology used. The insignificance of the FTA could be because of poor trade complementarities and even overlapping membership Sibanda Sr (2021) whilst the negative effect could be due to Bhattacharyya and Mandal (2014) argument that FTAs are beneficial for countries that have a higher priority for elastic tariff goods compared to countries preferring inelastic tariff goods. In this case, reducing the price of exports by reducing tariffs whilst maintaining export volume constant, reduces export values.
The other interesting finding is that when we lag the FTA dummy to capture the tariff phase-down approach followed in the region, we find that before attaining the maximum tariff reforms of 100% reduction, the impact of the FTA was negative. This means complete liberalisation is important to boost intra trade. The AfCFTA is being implemented in a phased-down approach with 90% liberalisation of tariff lines expected in the first five years and given our results, significant expected benefits may not be realised. The significance of GDP variable points to the need to strengthen the productive capacity of member states to boost intraregional trade.
Even though the customs clearing variable was insignificant, the positive effect implies that reducing non-tariff barriers is very important in boosting intra trade. This is supported by the fact that distance does matter in improving intra exports and so improving the quality and efficiency of road and transport infrastructure is key. The AfCFTA should focus on these measurers to enhance the benefits of the programme. The insignificance of the exchange rate variable suggests that the implementation of the Pan African Payment Systems as part of the AfCFTA and introduction of many currencies for settlement purposes will not only speed up the payment of goods, minimise dependence on the US dollar but also increase intra African exports.
Although these SADC FTA results may not be representative of what is happening in all the five regional FTAs given that SADC is made up of 16 out of the 50 African countries that belong to an FTA, they still cast doubts on the simulated stellar performance of the AfCFTA. In all the five FTAs, the trade integration index calculated by the African Union, AfDB and UNECA shows that average integration levels are below 50% in all the FTAs. So, if agglomeration effects have not yielded desired results at regional level, how will Southern African countries improve trade with North African countries in the context of the AfCFTA.
Footnotes
Declaration of Conflicting Interests
The author declared no potential conflicts of interest with respect to the research, authorship and/or publication of this article.
Funding
The author received no financial support for the research, authorship and/or publication of this article.