
Abstract
The article assesses the potential economic implications of tariff elimination and trade facilitation (TF) in the context of the African Continental Free Trade Area (AfCFTA) agreement for East Africa. Using the most recent GTAP database and computable general equilibrium model, the article provides additional evidence on the socio-economic benefits of the ongoing trade integration process. The results show that the elimination of tariffs would improve economic dynamism in most sectors of activity and household consumption. However, the elimination of tariffs alone would not be sufficient to achieve a significant level of trade integration. From a policy perspective, although a gradual implementation of tariff elimination is more beneficial for the zone, the results highlight the relevance of combining tariff elimination with complementary TF reforms. These reforms amplify the socio-economic gain from the AfCFTA.
Introduction
Trade agreements have grown phenomenally over the past three decades. They have become a remarkable integral part of the global trading system since the 1990s. For example, the number of regional trade agreements (RTAs) notified to the World Trade Organization (WTO) has increased from 22 in 1990 to over 577 in 2022 (WTO, 2022). Thus, the regional entity is becoming the scale of regulation of the world economy (Hugon, 2002). Regional economic integration is a process leading to the removal of barriers to trade in goods and services. The process can go beyond trade to consider the flow of capital and labour (common market), the establishment of a common institutional environment or the coordination of policies allowing for the convergence of economies and the anchoring of economic policies (economic union). To this end, a successful process of economic integration is one that amplifies the interdependence of countries in terms of trade in goods, services, labour, capital, etc.
From a theoretical point of view, the amplification of trade through free trade agreements is presented as a factor of economic development, although the debate is far from being settled, particularly in the case of developing countries. The effects of trade agreements were initially presented, from a neoclassical perspective, in terms of trade ‘creation’ and ‘detour’ (Viner, 1950). Beyond these essentially static and short-term effects, the literature highlights much more important dynamic effects. These include the enlargement of market size, the stimulation of competition and the creation of economies of scale (Siroën, 2004), the attraction of foreign direct investment (FDI) (Fujita et al., 1999; Krugman, 1992), the strengthening of growth and economic convergence (Grossman & Helpman, 1990, 1991, 2015; Perera-Tallo, 2003; Rivera-Batiz & Romer, 1991), etc. However, Stiglitz (2002) and Rodrik (1992, 2016) believe that the positive effects of free trade and trade integration should be put into perspective.
For these authors, economies that lack a comparative advantage in manufacturing are under competitive pressure from imports of manufactured goods for which relative international prices are falling. Therefore, trade agreements induce macroeconomic gains/losses depending on the structure of the economies.
Moreover, the effect of reducing tariff barriers in addition to trade facilitation (TF), which consists of measures to simplify and harmonize international trade procedures, reduces transaction costs and thus helps amplify the potential effects of trade agreements (Valensisi et al., 2016).
In the case of Africa’s Regional Economic Communities (RECs), these links are weak or non-existent. In the area of trade in goods and services, statistics show the inadequacy of the integration process in this part of the world. Indeed, the share of intra-African exports in total merchandise exports rose from an average of 10.74% over the period 1995–2007 to 14.94% between 2007 and 2018. In 2019, this ratio barely exceeds 16%, while it is 53.3% in developing countries in Asia, 53.7% in the Free Trade Area of the Americas and 62.7% in the European Union (EU) 28 (UNCTAD, 2022). In the specific case of East Africa, the same shortcomings are apparent. Indeed, the share of exports between East African countries, although slightly increasing, remains low: it fell from an average of 13.2% over the period 1995–2006 to 14.94% between 2007 and 2018 and will be 16.34% in 2019. Similarly, merchandise imports between East African countries have remained low. They are declining from 8.47% (1995–2006) to 6.80% (2007–2018).
In light of these shortcomings, it is clear that deep reflection on possible avenues of reform should be considered. In this regard, the establishment of a continental free trade area (African Continental Free Trade Area [AfCFTA]) is one of the major avenues for reform. This project is already effective since 1 January 2021, but no trade under AfCFTA has started though. As of 9 October 2022, 44 of the 54 signatories (81.48%) had deposited their instruments of ratification of the AfCFTA with the African Union Commission (AUC) Chair. Of the 55 African Union (AU) member states, only Eritrea has not yet joined (Tralac, 2022). The AfCFTA agreement aims to establish a preferential tariff area (PTA) between African countries with the reduction of tariffs by up to 90% (in the first 10 years) on products and to liberalize the services market. It also aims to reduce non-tariff barriers by cutting red tape and simplifying customs procedures. All of these factors will facilitate trade between member countries. In addition, in the long run, the AfCFTA agreement will promote industrial development through diversification and development of regional value chains, agricultural development and food security.
Given its objectives and the shortcomings of economic integration in Africa, it is clear that the AfCFTA agreement raises important issues and questions about the potential gains. The question is: How can tariff elimination and TF affect East African economies? Finding answers to this question is particularly important for assessing the potential effects of a major reform in the context of economic integration in Africa. The answers to this question will contribute to the empirical literature on the factors that explain the limited volume of intra-African trade. Indeed, empirical evidence attributes this low level of trade among African countries to poor TF mechanisms that increase trade costs (Avom & Mignamissi, 2018; Portugal-Perez & Wilson, 2009; Sakyi et al., 2017, 2018); the low complementarity and diversification of products traded (Mignamissi, 2018).
The few studies on the potential economic effects of the AfCFTA are largely dominated by reports from institutions such as the World Bank (World Bank, 2020), International Monetary Fund (Abrego et al., 2020) and United Nations Economic Commission for Africa (ECA, 2018). Other empirical studies focus on a single country, such as the studies on Malawi (Masiya, 2019), Ghana (Bayale et al., 2022), Togo (Wonyra & Bayale, 2022) or a group of countries, such as Central Africa (Fouda Ekobena et al., 2021). As for analyses of the impacts of the AfCFTA on the East African subregion, there are empirical studies on Kenya (Nechifor et al., 2021), Tanzania, the East African Community (EAC) (Shinyekwa et al., 2020) and the common market for Eastern and Southern Africa (COMESA) region (Wanyonyi & Chemnyongoi, 2020). However, the results of these working papers are mixed due to the simulation assumptions, methodology and choice of variables. The research proposed here, however, goes much further than these studies. First, beyond the removal of tariffs, this research takes into account the TF measures that are at the heart of the Agreement process under discussion in Africa. In addition, this research seeks to assess the impacts of the Agreement establishing the AfCFTA for the entire subregion.
The objective of this article is to empirically assess the potential economic effects in terms of trade flows, sectoral production, household consumption and employment of the AfCFTA agreement in East Africa. To do so, a dynamic computable general equilibrium (CGE) model is used using the most recent data from the Global Trade Analysis Project (GTAP10). This model has the advantage of capturing the interactions between economic agents, sectors of activity and trade policies (Bakouan et al., 2022; Fusacchia et al., 2022; Kano et al., 2020). To our knowledge, this is the first empirical and dynamic simulation of the potential economic impacts of the AfCFTA in East Africa.
The main results highlight that the AfCFTA would have a positive impact on East African trade, Households’ consumption and output of industry. In addition, TF measures would further amplify the positive effects achieved. Sectorially, the AfCFTA would impact economic sectors in the subregion differently.
Following this introduction, the remainder of the article is organized as follows. The second section provides a summary review of the literature. The third section presents the stylized facts about East African trade. The fourth section describes the data sources, simulation techniques and the model used. The fifth section presents and discusses the main results. Finally, the sixth section provides conclusions and draws some policy implications.
Literature Review: Free Trade and Economic Integration
The idea that foreign trade liberalisation promotes economic growth and welfare goes back to classical theories of international trade. Recent developments in growth theories emphasise that trade openness is an important determinant of economic activity (Grossman & Helpman, 1991, 2015; Rivera-Batiz & Romer, 1991). Thus, if multilateral trade liberalisation is not achieved, the formation of regional blocs should enhance trade between nations through the elimination of tariff and non-tariff barriers.
It is in this logic of integration through the market that Viner (1950), through the concepts of trade creation and trade detour, analyses the gains of economic integration. According to the author, trade is created when, following the removal of trade barriers in a zone, trade between member countries increases. Trade detour occurs when, as a result of the removal of tariffs between member countries, former producers outside the union are replaced by member countries that are less competitive. In this case, the allocation of resources is poor and the trade agreement is disadvantageous. Thus, for Viner, the total effect of the customs union depends on the balance of these two effects, and there is a net gain from the formation of a customs union if the trade creation effect outweighs the detour effect.
However, Viner’s analysis is static and limited to the production aspect. Moreover, it is based on the usual simplifying hypotheses: markets in pure and perfect competition, partial equilibrium analysis, constant returns to scale, the absence of agglomeration and polarization effects, etc. All these hypotheses have been called into question by developments in endogenous growth theory, through the consideration of economies of scale. All these assumptions have been challenged by developments in endogenous growth theory.
Thus, the enlargement of the size of the market, the stimulation of competition and the creation of economies of scale are long-term effects that are cited. Indeed, when national markets interconnect to form a single market, community firms try to increase their size to meet a demand that grows to the size of the region. The resulting reduction in unit production costs is the source of internal economies of scale that can be coupled with external economies of scale due to more favourable access to inputs on the regional market. Moreover, the liberalisation of trade at the regional level puts national firms in competition with each other, initially protected by monopolies and customs barriers, all of which forces national firms to perform well or risk being crowded out. Siroën (2004) points out that this liberalisation reduces the social loss related to non-competitive market structures where prices, like costs, are too high. The enlargement of the market size, the stimulation of competition and the creation of economies of scale ultimately lead to an increase in exports within the zone, a reduction in import costs and an improvement in consumer welfare.
The other potential long-term effect concerns the attraction of FDI. Indeed, based on the models of geographic and spatial economics developed by Fujita et al. (1999) and Krugman (1992), among others, it appears that regional integration creates the conditions for attracting FDI from third countries, because of the enlargement of the size of the market and the prospects for strong growth in the zone’s member economies. However, it is likely that, in the long run, there will be an unequal distribution of FDI among the various members of the zone (Krugman, 1992), or even a relocation of firms to other countries within the zone as part of the rationalization behaviour of foreign investors.
Empirically, the work on the potential effects of free trade agreements yields generally favourable, though mixed, results. In developed countries, for example, Bhattacharyya and Mandal (2014) conclude that the Association of Southeast Asian Nations (ASEAN)-India Free Trade Agreement has not had a significant impact on India. With respect to ASEAN-India trade and tariff concessions, Bhattacharyya and Mandal (2016) find ASEAN countries benefited more than India even though both India and ASEAN gained in terms of welfare in the first two years of the agreement’s implementation. In addition, Hattari et al. (2014) and Masron (2013) show that ASEAN has been an important driver of FDI promotion in Asia due to the resulting financial integration and strengthening of regional ties. In Europe, for example, the results highlighted the beneficial effects of free trade on trade in industrial products. Indeed, Okabe and Urata (2014) show that the free trade area agreement among ASEAN member countries has had positive and significant effects in terms of creating trade in industrial products. Work done on America and Europe provides evidence that corroborates the beneficial effects of trade agreements on industries. As an illustration, Thelle and Sunesen (2011) find that the complete removal of trade barriers between the EU and Mercosur results in a 0.2% increase in EU Gross Domestic Product (GDP) due to increased industrial exports.
Su and Nguyen (2022) show that trade openness significantly improves the positive effects of human capital and government spending on total factor productivity (TFP) in developing countries. Darku and Yeboah (2018) find that among developing regions that opened their economies late, sub-Saharan Africa (SSA) benefited the most from economic openness in terms of trade and FDI inflows. However, SSA countries have not been able to reap the full benefits of economic openness as have the successful high-performing Asian economies (HPAEs). These countries experienced a larger positive effect of openness on real GDP per capita growth because they were not only able to create a sufficient stock of human capital that improved their ability to absorb imported advanced technologies but also created a more stable macroeconomic environment that consolidated the positive effect of economic openness on growth.
In addition, many studies have found remarkable results highlighting the beneficial effects of TF measures on trade performance (Iwanow & Kirkpatrick, 2009; Portugal-Perez & Wilson, 2012) economic growth (Hoekman & Shepherd, 2015; Narayanan et al., 2016; Sakyi et al., 2017; Shepherd & Wilson, 2009) and social welfare (Bhattacharyya & Mandal, 2016; Dercon et al., 2009; Jouanjean et al., 2015; Sakyi et al., 2018). For example, Narayanan et al. (2016) find that the economic impact of TF among Commonwealth member countries has been enormous in terms of welfare, output growth, employment and trade in several sectors, far greater than full tariff liberalization among these countries. In addition, Portugal-Perez and Wilson (2012) show that investments in physical infrastructure and regulatory reforms to improve the business environment increase export flows from developing countries. In addition, the authors find that there is complementarity between physical and intangible infrastructure in improving export performance.
Research on the impacts of preferential liberalisation under WTO multilateralism as well as preferential trade agreements over the past few decades has yielded mixed results. In particular, Tovar (2021) points out that an increase in the external tariff on imports creates a smaller increase in tariff revenue. However, as preferential import protection is reduced, it produces a decrease in the profit margin and sales of domestic firms. Moreover, Shepherd and Wilson (2009) find that trade flows in Southeast Asia are particularly sensitive to transport infrastructure and information and communication technologies. These economic gains from TF are greater than those from comparable tariff reforms. For example, improved port facilities in the region increase intraregional trade by 7.5%. In terms of FDI reception, Ghodsi (2020) believes that excessive regulation and stringent standards discourage FDI in a given market. This reduces the production capacity of the area. Similar results have been revealed in developing countries and particularly in Africa. This is the example of Obuobi et al. (2022) who suggest that institutionalising policies to improve trade liberalisation can attract higher levels of FDI flows to African economies.
However, it is worth mentioning studies that have highlighted the important role of TF measures on African economies. Among these studies, Iwanow and Kirkpatrick (2009) argue that TF reforms help improve exports in Africa, but that other reforms, such as the quality of the regulatory environment and the quality of basic transport and communication infrastructure, are also important. Moreover, improved border policies have a greater payoff in terms of improved export performance of manufactured goods in African countries than in the rest of the world. These results corroborate those found by Sakyi et al. (2018). These authors show that TF measures among African countries are associated with improved social welfare. This implies that policy reforms should focus on improving infrastructure, institutional quality and market efficiency in Africa.
In sum, while empirical studies point to the economic benefits of removing non-tariff barriers, there are significant legitimate reasons for the extensive use of some of these measures. According to Ghodsi and Stehrer (2021), technical barriers to trade and sanitary and phytosanitary measures allow countries to impose import restrictions on low-quality products suspected of harming the health of domestic consumers, plant life or the environment.
For the specific case of the AfCFTA, there is empirical evidence that the agreement positively affects trade flows (Abrego et al., 2019; Bakouan et al., 2022; Ejones et al., 2021; Geda & Yimer, 2022; Gondwe, 2021; Oyelami, 2021; Riedel & Slany, 2019; Wonyra & Bayale, 2022) investment (Abrego et al., 2020; Mold & Mukwaya, 2016) consumer welfare (Fofack et al., 2021; Fouda Ekobena et al., 2021; Fusacchia et al., 2022). However, the literature on the COMESA free trade agreement, however, points to a welfare loss for Ethiopia as a result of the agreement (Amogne & Hagiwara, 2021).
As far as the East African region is concerned, there are no specific studies assessing the short- and medium-term impact of the AfCFTA on the region as a whole. The results of the few existing studies are mixed. Indeed, Shinyekwa et al. (2020) use the World Integrated Trade Solution-Single Market Partial Equilibrium Tool (WITS-SMART) to examine the impacts of the AfCFTA on five EAC countries. They find varying results across EAC countries in terms of trade and welfare. The authors show that the AfCFTA positively affects Uganda and Burundi while Kenya, Tanzania and Rwanda are not. In the same vein, Nechifor et al. (2021) show using a CGE model that without reducing Non-Tariff Measures (NTMs), the GDP and welfare impacts of the AfCFTA in Kenya are negligible. In the context of the COMESA-Southern African Development Community (SADC)-EAC Tripartite Free Trade Area (TFTA), Mold and Mukwaya (2016) use a CGE model and data from the GTAP to measure static effects on the 26 member countries. Their results indicate a significant increase in intra-regional trade of 29%. A schematic review of this selective literature on the expected effects of the AfCFTA and other trade agreements in Africa is summarised in Appendix 1. Overall, regardless of the methodology used, the results, while mixed, suggest that the AfCFTA agreement would lead to positive net gains in trade and consumer welfare.
In summary, the issue of trade liberalization has been widely discussed in the existing literature. However, the limitation of this literature is that it has not addressed the issue of free trade in the East African subregion. Indeed, the few studies that have assessed the impacts of the AfCFTA in the subregion have focused on the EAC, specific countries such as Kenya or TFTA. These studies do not take into account both the dynamic effects of the FTAA for the entire subregion and TF measures. Moreover, methodologically, some of these studies on East Africa use partial equilibrium models or gravity model. However, the WITS-SMART models do not take into account the impacts of policy reforms on the broader economy, as well as the cross-sectoral implications (Wonyra & Bayale, 2022). This justifies the use of a dynamic, multi-sectoral ECG model to capture the dynamic linkages and market responses to trade reforms. Our study provides empirical evidence on how tariff reduction and TF under AfCFTA affect East African economies.
Overview of East Africa’s Trade Patterns and Stylized Facts
The Eastern African subregion is made up of 13 countries. This is not the first time East Africa has attempted regional economic integration. The EAC is on track to create a monetary union by 2024 (Umulisa, 2020). Concerning the AfCFTA, as of 9 October 2022, out of the 13 countries in the subregion, 9 countries that have deposited their instruments of ratification with the depositary (Chair of the AUC). Regarding the AfCFTA, as of 9 October 2022, of the 13 countries in the subregion, only South Sudan, Sudan and Comoros have signed the AfCFTA but have not yet deposited their instruments of ratification of the agreement with the Chairperson of the AUC. Among the 55 AU countries, only Eritrea has yet to sign the AfCFTA agreement (Table 1). The Eritrean government’s refusal to join the AfCFTA is explained by its ideological and historical position that advocates subregional economic integration through the RECs rather than continental integration.
East Africa’s Intra-Trade Shares and AfCFTA Situation.
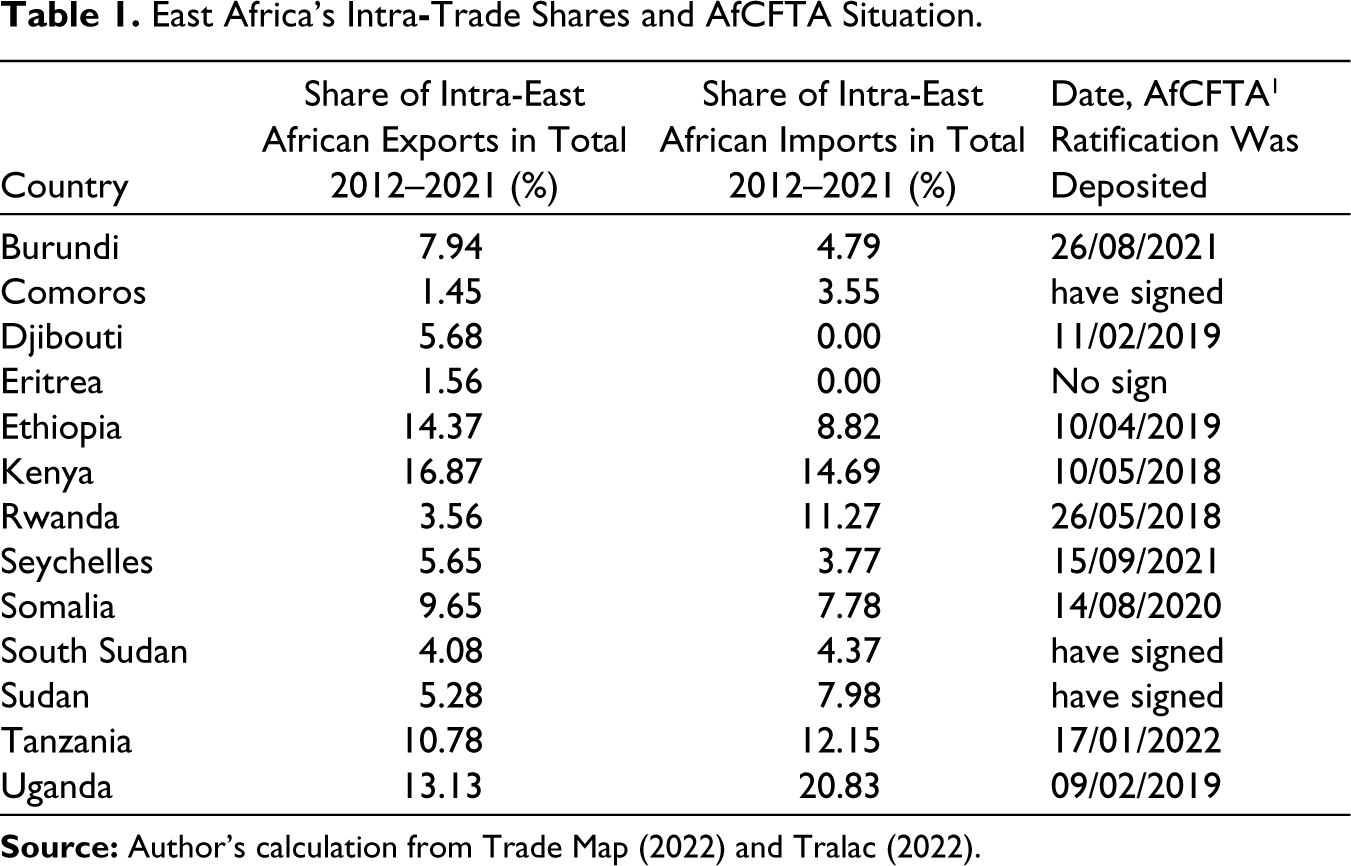
Intra-East African trade remains low. Indeed, over the 2012–2021 period, the share of merchandise exports between East African countries in total exports was high in three countries. It stood at 13% for Uganda, 16% for Kenya and 14% for Ethiopia (Table 1).
There is a low level of diversification in Eastern African economies, as in most African countries. Appendix 2 describes the Structure of main export products and destination partners of East African exports in 2019. For example, in East Africa, on average, 72.5% of exports were concentrated on five products in 2017. This concentration was high in South Sudan (99.77%), Comoros (99.3%), Eritrea (98.6%) and Somalia (90.1%). It was relatively lower for Tanzania (53.5%), Djibouti (52.6%), Kenya (44.3%) and Uganda (44.3%) (Figure 1).

The main recurrent features that emerge from the analysis of trade in Africa are: the low level of intra-community trade and the low complementarity of the products traded (Avom & Mignamissi, 2018; Mignamissi, 2018). East African countries trade very little with each other and little with the rest of Africa (Table 2). In East Africa, intra-community exports rose from 13.2% over the period 1995–2006 to an average of 14.94% between 2007 and 2018 and will reach 16.34% in 2020. Exports to the rest of the Africa represented only 46.54% on average over the period 2015–2020 against 77.47% of Middle Africa and 50.29% of Southern Africa for the same period (Appendix 5). Similarly, the same trends apply to imports; trade transactions between countries in the subregion are very low and are in fact declining. Indeed, in 2020, only 7.55% of total imported goods came from the subregion itself. However, this level fell from 8.47% between 1995 and 2006 to 6.80% over the 2007–2018 period. This decline in imports to East Africa is not surprising given that the countries of the subregion import mainly industrial products (Appendix 3), while they export very few processed goods (Appendix 2).
Intra-Group Trade as a Share of Total Trade (in %), 1995–2020.
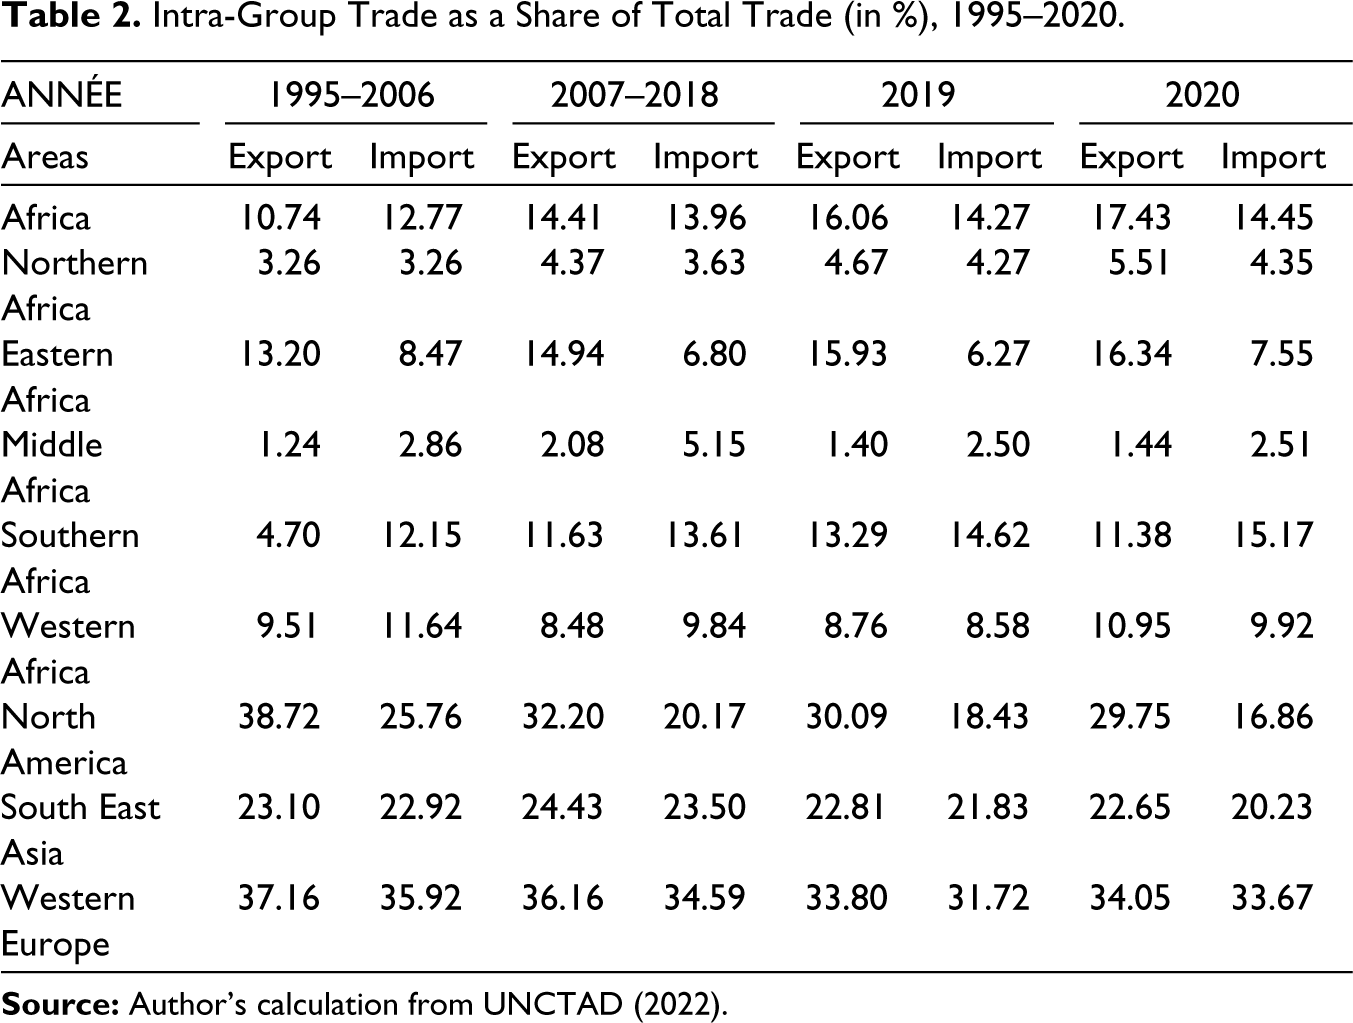
In Eastern Africa, exports of goods and services as a percentage of GDP remain low. For example, over 2010–2019, they amounted to 33.82%. (UNCTAD, 2022). Indeed, over the same period, exports of goods and services as a % of GDP were 143.79% for Djibouti, 88.77% for Seychelles, 46.87% for Mauritius, 42.52% for South Sudan and 37.69 for Zambia. The lowest levels were Kenya (16.09%), Rwanda (15.49%), Uganda (14.78%), Eritrea (12.27%), Ethiopia (10.63%), Comoros (10.57%) and Burundi (8.33%).
The economies of East Africa are characterised by a hyper-specialized productive structure largely dominated by the exploitation of a few raw materials, resulting in low export diversification. Export flows are essentially concentrated on two to five basic products characteristic of an industrial fabric that is fragile to trade liberalisation. In addition, the structure of the subregion’s trading partners illustrates a strong extraversion of foreign trade ( and 3). Indeed, Europe, Asia and the United States are the main export markets with the highest growth between 2018 and 2019 (Appendix 2). Imports, on the other hand, are more diversified and are based mainly on finished products (Appendix 3). In 2019, for example, in Ethiopia, which is the leading economic power and most populous in the subregion, five products accounted for more than 60% of the country’s total exports. In addition, more than 50% of its exports were destined to five main partners, which are as follows: China (16.6%), USA (15.6%), UA Emirates (8.06%), Saudi Arabia (6.33%) and South Korea (5.13%). On the other hand, these fastest growing major export markets between 2018 and 2019 are as follows: USA (+66.9%), South Korea (+79.1%) and China (+12.6%). The most common import partners for Ethiopia were China (16.6%), USA (15.6%), UA Emirates (8.06%), Saudi Arabia (6.33%) and South Korea (5.13%).
In addition, the trade profile of many East African countries (including Uganda [57%], Burundi [48.6%], Somalia [41.4%], Rwanda [32.9%], Ethiopia [8.23%] and South Sudan [2.7%]) is heavily dominated by a single sector, gold. This limits the growth potential of other sectors and reinforces the low complementarity of foreign trade. Moreover, the structure of the subregion’s trading partners illustrates the high degree of extraversion of the subregion’s exports. Only two East African countries had experienced a strong acceleration in their export flows to African markets between 2018 and 2019. These are Rwanda and Kenya.
Model, Data and Simulations Overview
In this section, we summarise the key features of the general equilibrium trade model from Partnership for Economic Policy (PEP-w-t), database and simulations used to estimate the potential impact of the AfCFTA and TF.
General Description Computable General Equilibrium (CGE) Model
A dynamic multi-sector, multi-regional CGE model is used to assess the economic impact of the AfCFTA and TF on the in Eastern African economies. Based on Walras’ general equilibrium theory, CGE model describes the behaviour of four parties, namely producers, households, government and foreign sector (Gopalakrishnan et al., 2021). This model is theoretically based on the PEP-w-t model by Lemelin et al. (2013). It can identify the different economic interactions in a given area and the mainshock transmission chains. The methodology presented here has already been used to assess the economic effects of trade policies (Akbulut & Eğen, 2021; Bakouan et al., 2022; Fouda Ekobena et al., 2021; Hamid & Aslam, 2017; Kano et al., 2020; Mold & Mukwaya, 2016; Yapaudjian-Thibaut et al., 2003). These authors believe that the CGE model is appropriate for simulating the impact of trade policies. It allows the direct and indirect effects of the AfCFTA to be evaluated in the medium term while allowing for both macroeconomic and sectoral effects. Additionally, this model implements the interaction between different consumption and production behaviours while ensuring broad macroeconomic equilibria. The summary empirical descriptions of the model equations are also based on the article by Bakouan et al. (2022).
Figure 2 describes the nested structure of production in the CGE model. Firms use land, labour, capital and natural resources as factors of production. They combine these factors with intermediate inputs to produce goods in each region. This output is consumed by households, governments, and private and public sectors for investment. The rest of the output is exported.
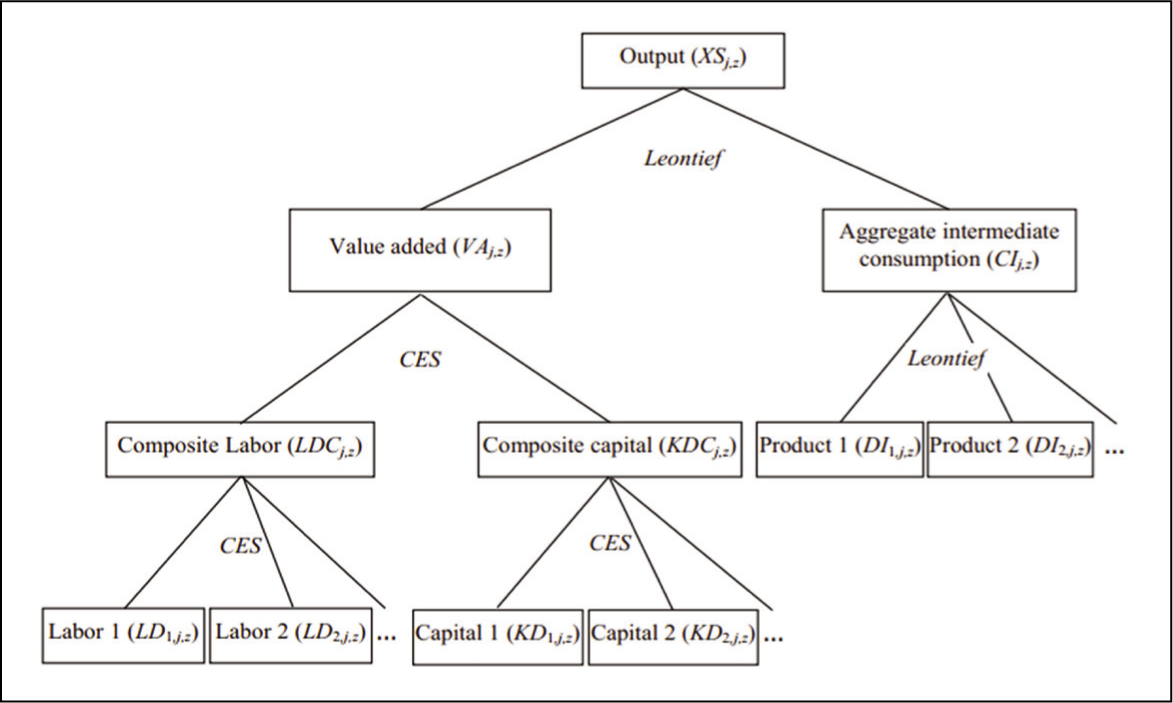
In this model, firms are assumed to operate in a perfectly competitive environment. Their objective is to maximise profits or minimise production costs according to the technological constraints of their products and the prices of goods and services and factors. The government collects taxes and makes public expenditures. The household agent receives income from labour and capital and makes private expenditures. Taxes on goods and services imports, income and production constitute the fiscal instruments. Taxes on imports of goods and services are applied to the value of sales, which already includes trade and transport margins, and customs duties. The consumptions of households, public administrations, and intermediaries, and investments constitute the domestic demand for imported or domestically produced goods. Producers allocate their products to markets to maximize profits. The behaviour of producers follows production functions of constant elasticity.
Three trade outlets contain the overall production in the economy, namely exports, domestic and international transport margins. Exports are distributed across countries or regions of destination. Under the assumption that goods are heterogeneous (the functional forms are constant elasticity of substitution [CES] production functions), producers and consumers respond to symmetric behaviour since it is assumed that imports from one region are imperfectly substitutable to imports from another region and that local products are imperfect substitutes for imported products. The incorporation of population growth, technological progress and capital accumulation gives dynamism to this model.
The AfCFTA aims to eliminate tariff barriers on trade between African countries. This removal of tariffs (equalisation of the parameter ttim to zero in Equation [1]) will have the effect of reducing the world price of trade, which would benefit private consumption and national production through increased demand for intermediate consumption and investment goods, whereas the direct effect of TF, that is, lower transaction costs associated with non-tariff barriers (the tmrg parameter in Equation [1]) will have a similar (amplifying) effect of a decrease in the price of imports and exports (Equation [2]). This could therefore result in an increase in import demand (Equation [2]), including for finale consumption, intermediate consumption goods (Equation [3]), likely have positive effects on domestic production of goods and services (Equation [4]). Lower export prices will improve the price competitiveness of the region’s exports and could ultimately lead to increased domestic production and overall economic growth. The final effect can only be measured in a general equilibrium framework, which justifies the relevance of using the multi-region CGE model. For a full description of the model, the reader is referred to Lemelin et al. (2013).
The price paid in region z for imports from region zj is the world price paid by z for imports from zj, translated into region z’s currency, plus taxes and duties on imports, margins and domestic indirect taxes:

where
PMi, zj, z price of commodity i imported from region zj by region z (including margins and all taxes and duties); PWMi, zj, z: world price of commodity i imported from region zj by region z (expressed in international currency); PWMGi: world price of margin i (expressed in international currency); ttici, z: tax rate on commodity i in region z; ttimi, zj, z: rate of taxes and duties on imports of commodity i from region zj by region z; and ttixi, zj, z: export tax rate on commodity i exported to region zj by region z.
Demand functions of imports from individual regions are derived from the first-order conditions of expenditure minimising subject to the CES aggregator function. We have the following:
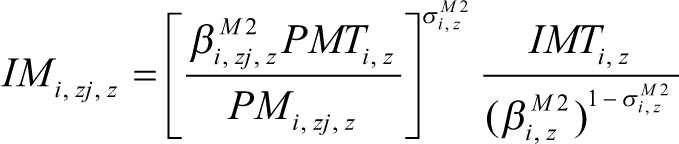
where
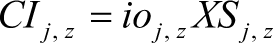
where
CIj, z: total intermediate consumption of industry j in region z; ioj, z coefficient (Leontief-intermediate consumption); and XSj, z: total output of industry j in region z.
The section on production describes how, in each region, industries combine inputs to produce total aggregate output XSj, z. Producers allocate output to market outlets to maximise sales revenue, given product prices. The total output of industry j in region z (XSj, z, t):

where
EXTi, z: supply of composite commodity i by region z to the export market; DSj, i, z, t supply of commodity i to the domestic market of region z;
Macroeconomic Equilibria, Closures and Model Dynamics
With respect to macroeconomic equilibria, in the commodity and factor markets, it is assumed that the balance between supply and demand is verified through the flexibility of the respective prices. In the baseline scenario, labour demand is assumed to be equal to labour supply.
The model brings together a system of equations that describes the economic links between several regions and sectors of activity at the global level. At the level of the model’s closure rules, the endogenous and exogenous variables are determined. The values of the exogenous variables are fixed at their initial level. This is the case for the regional GDP deflators and public savings, which are fixed. These variables will not change during the resolution of the model. The values of the endogenous variables are determined during the resolution of the model. This is the example of real public spending, which is flexible. In addition, prices and quantities are determined endogenously in the model. The exchange rate of a region chosen as reference is the European region.
The dynamics of the model are recursive. The calibration of the baseline scenario is done by running a modified version of the model that is constrained to follow (Foure et al., 2012) projections of real GDP and where TFP is endogenous. Aggregate labour supply and domestic savings rates are also fixed according to the Foure et al. (2012) projections. The solution value of TFP and other exogenous variables (including savings rates) given by the modified version of the model is the baseline scenario. These variables are then fixed exogenously at their calibrated values in the model.
Capital accumulation is endogenous in the model. Thus, the sectoral and regional capital stock is equalized to that of the previous period, minus depreciation, plus the volume of new capital investment of the previous period. The quantity demanded of each type of capital in each region is proportional to the quantity supplied. Capital is assumed to be region and sector specific. Total investment expenditure is equal to the sum of agents’ savings including households and government plus the amount of depreciation. It is assumed that labour is only mobile between production sectors in the same region. Thus, labour can move between sectors, but not from one region to another. It is therefore assumed that the wage rate is defined by region within a geographically segmented labour market.
Data and Simulations
This article uses the latest GTAP 10 database, 2014 reference, which describes global international trade patterns, production, consumption and use of intermediate goods and services. To better understand the structural effects of trade policies, the database has been grouped into 33 industry sectors for all countries 2 in the East African region.
Previous research has assessed the potential effects of trade agreements on trade flows by completely removing tariffs on intra-regional trade (Fouda Ekobena et al., 2021; Zidouemba & Jallab, 2021). Other work suggests a partial elimination of tariffs (Chauvin et al., 2017). While World Bank (2020) suggests a gradual and progressive elimination of tariff lines on trade in Africa. This research is based on the following four scenarios:
Scenario 1: Tariff elimination (100%) only and immediate on intra-African trade. Actual non-trade measures for most African countries are very high and vary from country to country. For example, Abrego et al. (2020) show that they represented 21.1% for Tanzania, 16% for Sudan, 9.5% for Seychelles, Comoros and Somalia in 2016. They would be 4.8% for Rwanda. In addition, Abrego et al. (2020) and IMF (2019) point out that technical and sanitary/phytosanitary barriers are the most prevalent in Africa. This is in addition to large infrastructure gaps and significant trade-related transaction costs. These lead to significant trade-related transaction costs and constitute barriers to intraregional trade.
Scenario 2: Tariff elimination and improve TF of 10%. This is to consider a more ambitious trade reform than tariff elimination. Moreover, as Zaki (2015) observes, TF and the removal of tariff barriers on trade must be complementary and are not substitutes for each other; although the AfCFTA also proposes to reduce NTBs, it does not target a specific level of their reduction (Abrego et al., 2019). In this context, we conducted two simulations considering 10% and 15% improvements in TF. This is a sensitivity analysis of the TF improvement.
Scenario 3: Tariff elimination and improve TF of 15%.
Scenario 4: Tariff elimination only in a staggered manner of 10% per year on imports and exports. This scenario reflects the facts of the matter due to government reluctance and public resistance to trade reforms. It has the advantage of generating relatively low adjustment costs, as shown by Saygili et al. (2018). For these authors, a gradual and homogeneous reduction in tariffs should allow factors of production to adjust and move directly towards the final equilibrium from the start of trade liberalisation.
Simulation Results and Discussion
Simulation results are presented in terms of percentage change from the baseline scenario. Macroeconomic impacts on trade are illustrated in terms of intra-African exports and trade flows (imports and exports) from East Africa. Sectoral impacts on East Africa are presented in terms of household consumption and industry output.
The Effect of Tariff Elimination and Trade Facilitation on Trade
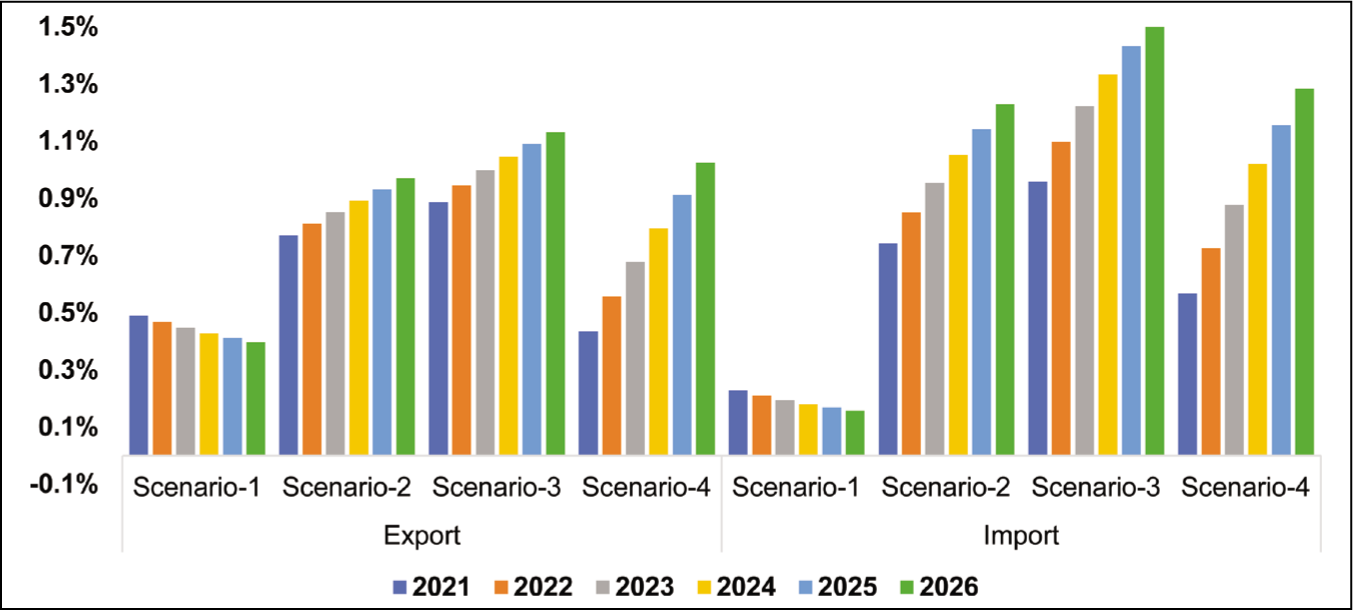
The simulation results shown in Figure 3 suggest that the trade gains from full implementation of tariff elimination could be very moderate for the East African subregion. However, a staggered or progressive liberalisation of the agreement would have greater positive effects than the total and immediate removal of tariff barriers. Moreover, the scenarios that combine tariff elimination and improving TF would further boost the volume of exports and imports in the zone. For example, exports would increase from 0.5% in 2021 to 0.4% in 2026 in the case of Scenario 1. This increase would be greater in the case of Scenario 4 (staggered). It increases from 0.44% in 2021 to 1.03% in 2026. In the case of Scenario 2, there would be an increase in export flows from 0.77% in 2021 to 0.97% in 2026. Although our results corroborate the World Bank (2020) predictions, the magnitude of the AfCFTA’s impact remains low.
Thus, our results indicate an increase in imports ranging from 0.23% to 0.16% over the period 2021–2026 in the case of Scenario 1 (total removal of tariffs) and between 0.74% and 1.23% for Scenario 4 (staggered liberalisation). At the same time, the increase in import flows is greater when tariff removal is combined with TF measures (Scenario 2 and Scenario 3). To this end, in the case of Scenario 3, imports into the subregion would increase from 0.96% in 2021 to 1.52% in 2026. The results also show that, with the exception of Scenario 1, the volume of trade would increase more over time in the subregion (Figure 3).
These results corroborate those of Abrego et al. (2019), Fofack et al. (2021) and World Bank (2020). These studies found that the implementation of the AfCFTA would lead to a significant increase in intra-African trade in the long run. However, the low level of exports from the subregion can be explained by the fact that most of its exports are destined for Europe, the United States of America and Asia.
Intra-African exports would increase significantly in most sectors following the implementation of the AfCFTA (Table 3). The magnitude of the increase in trade will be greater under Scenario 3 (combination of tariff elimination and TF measures of 15%). Moreover, the positive impacts of the AfCFTA are greater in the long run than in the short run. For example, intra-regional exports of ‘Grains’ would increase from 2.19% to 2.22% between 2021 and 2026 in the case of Scenario 1, from 8.52% to 14.04% in Scenario 2, from 11.05% to 17.24% (Scenario 3) and from 5.65% to 13.34% (Scenario 4).
Percentage Change in Intra-Régional Exports Relative to the Baseline Scenario, 2021 and 2026.
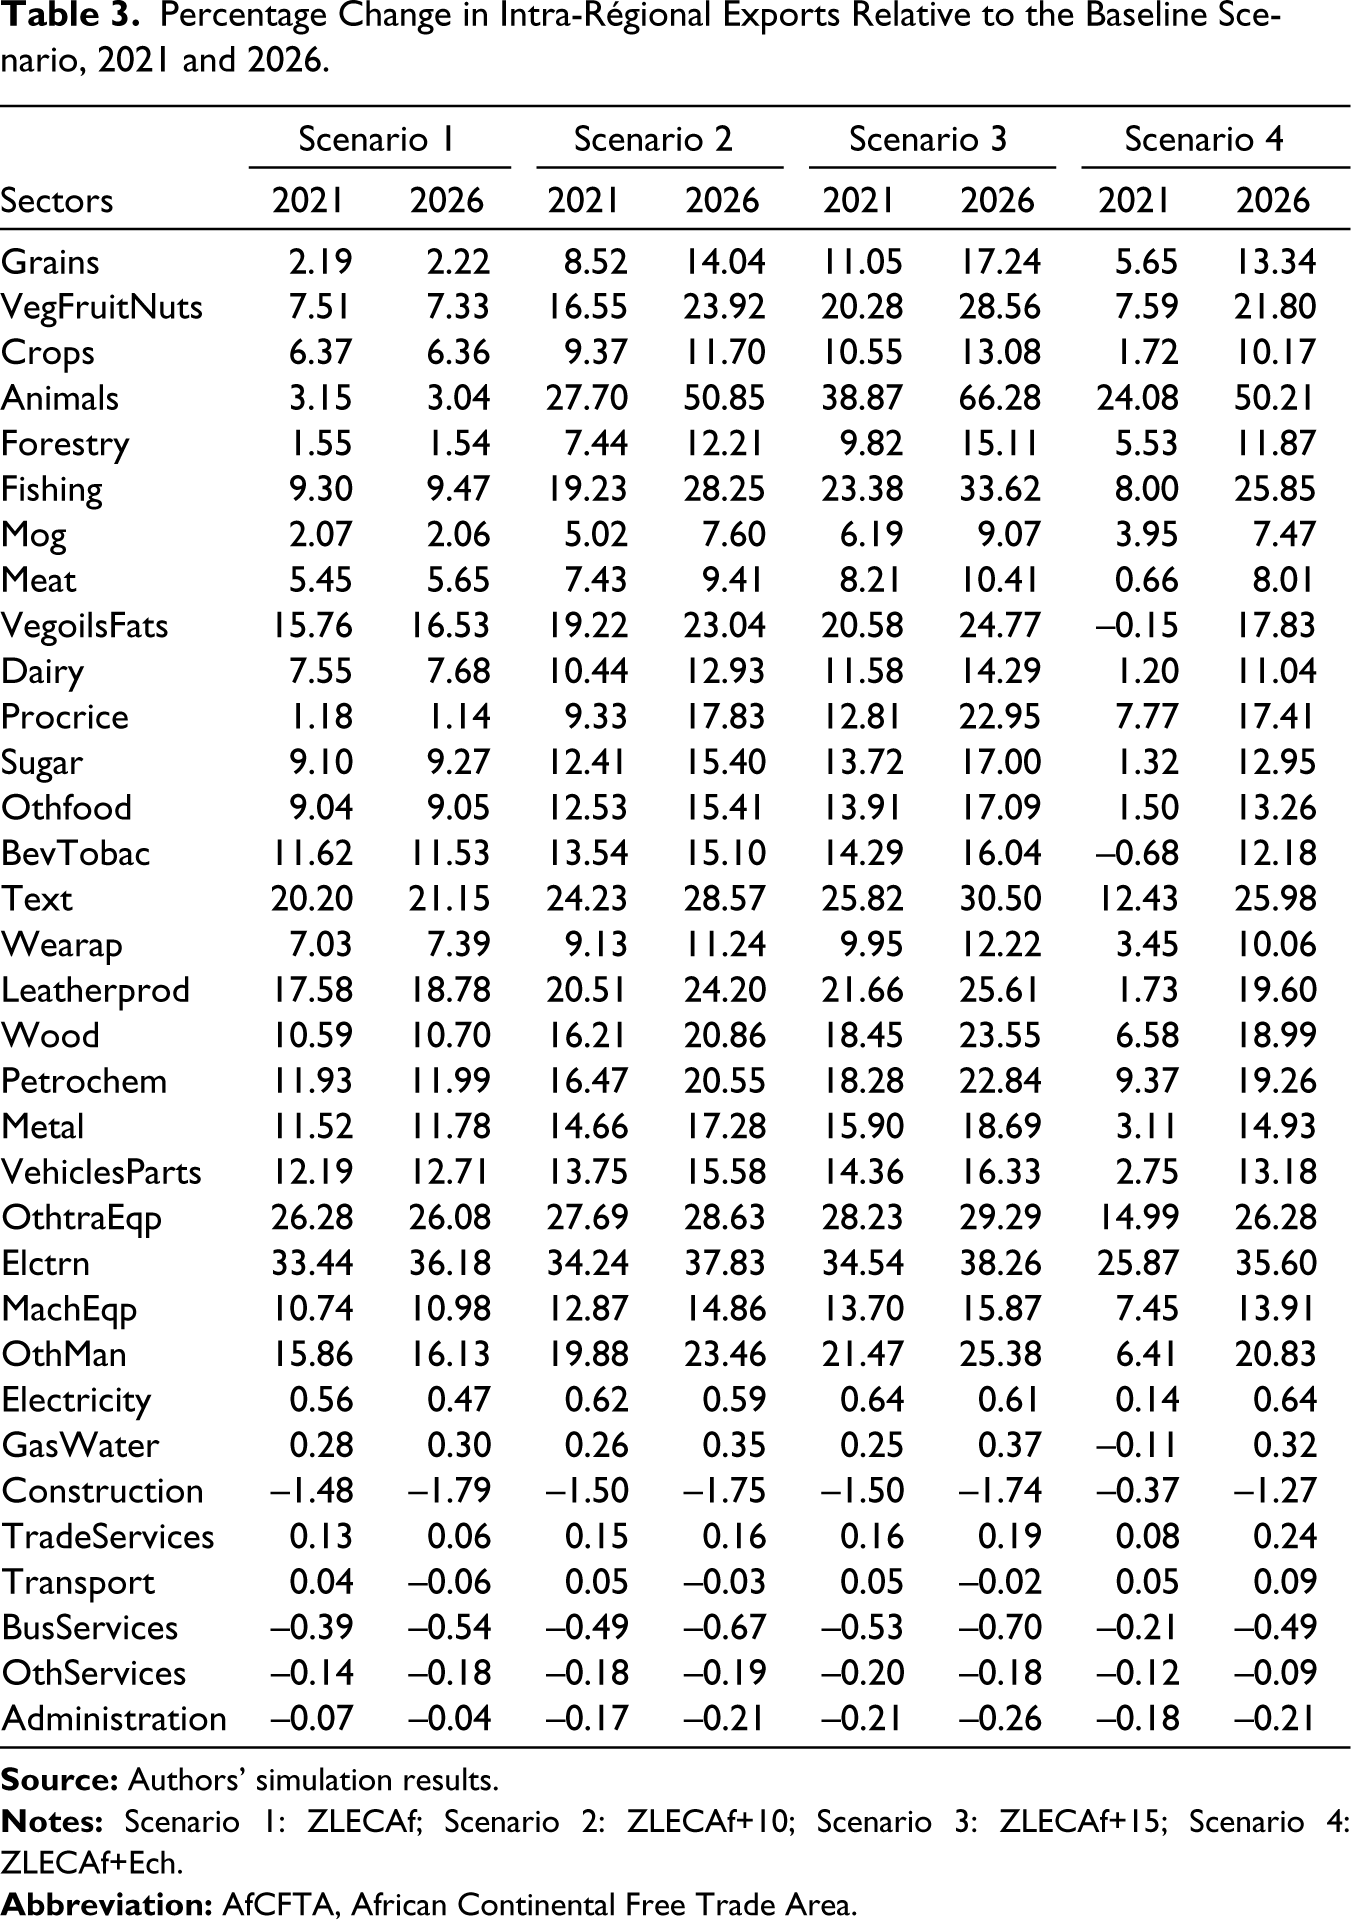
However, the overall figures mask the sectoral heterogeneity of impacts in the region. At the high end are sectors that would be positively affected, such as electronic, computer, optical products; other transport equipment; leather products; vegetable oils and fats and other manufactures. At the lower end, the service sectors (notably: transport; public administration; other business services; business services; and construction) would see their exports decrease (Table 3).
The description of the sectors is presented in Appendix 4.
The Effect of Tariff Elimination and Trade Facilitation on Household Consumption
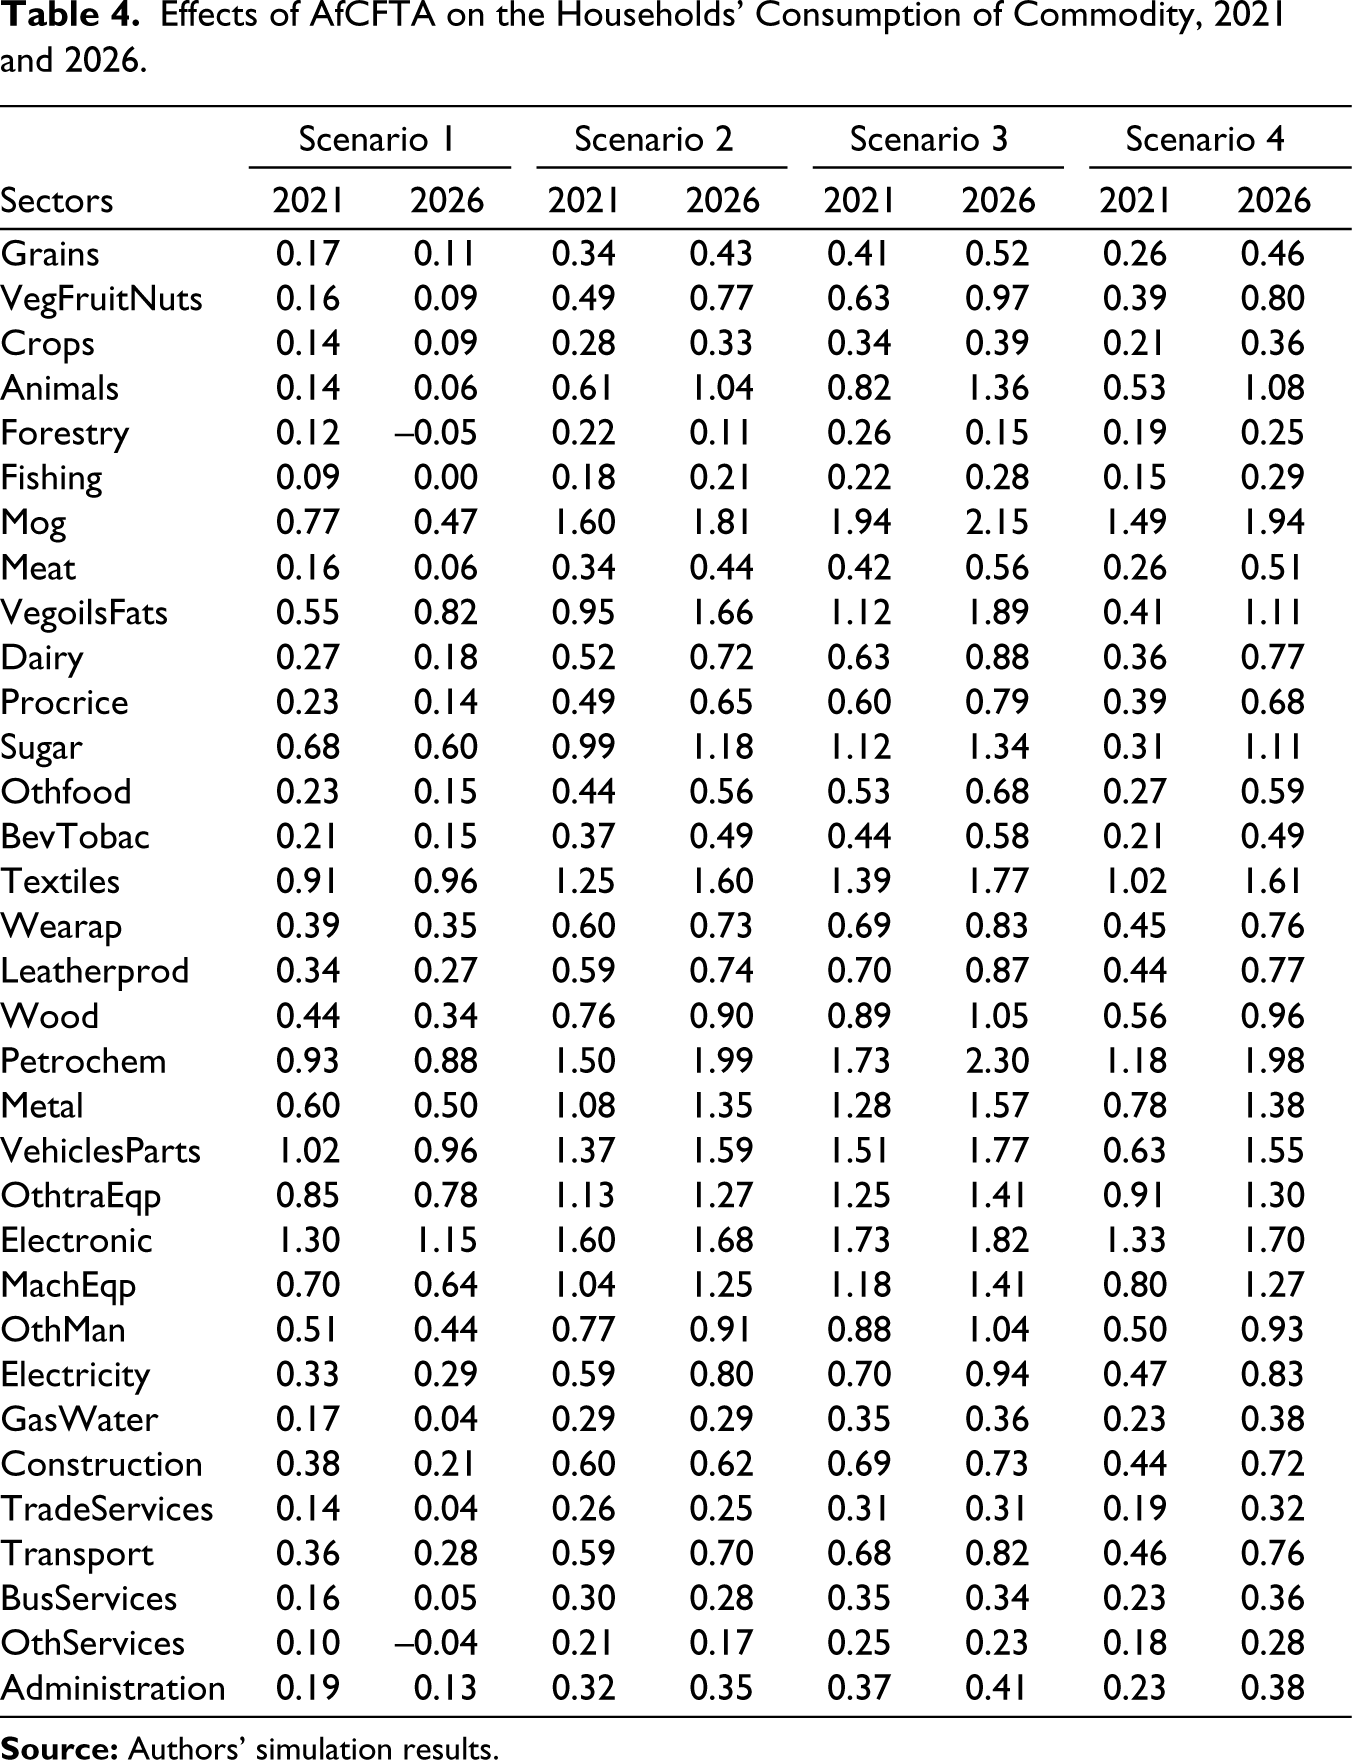
Simulation results of the removal of tariff barriers and TF measures on household consumption are presented in Table 4. These results show that the implementation of the AfCFTA would boost household consumption in all sectors of activity, regardless of the scenario considered. However, while the increase in household consumption remains moderate in the case of tariff removal, the magnitude of the impacts is larger in the case where tariff removal is combined with TF measures. For example, the increase in household consumption of products from the Electronic sector in 2026 would vary between 1.15% for Scenario 1 and 1.82% for Scenario 3. Thus, the improvement in the level of household consumption (or welfare) can be explained, on one hand, by the availability of lower-cost products and, on the other hand, by the increase in household income in the subregion.
Effects of AfCFTA on the Households’ Consumption of Commodity, 2021 and 2026.
The Effect of Tariff Elimination and Trade Facilitation on Output of Industries
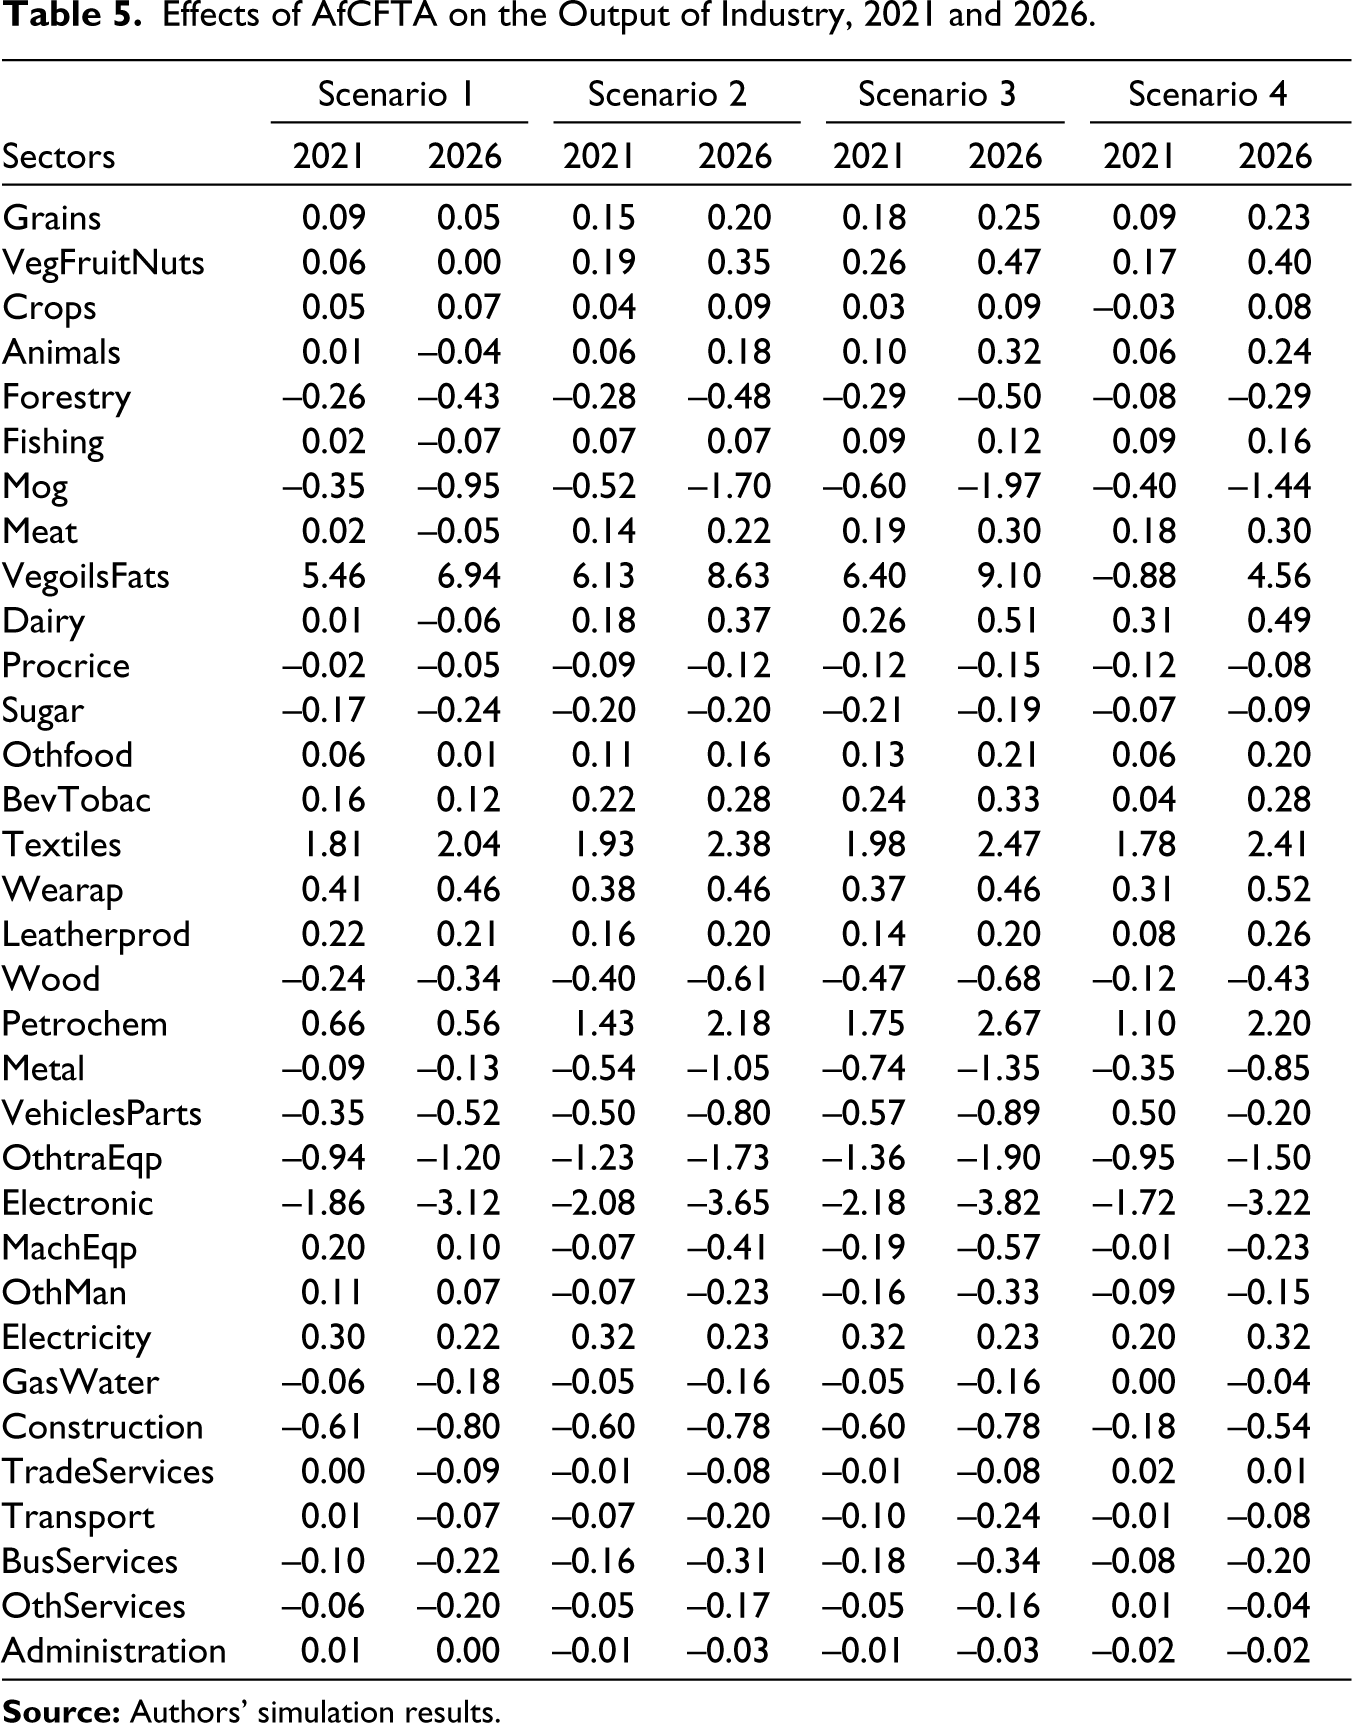
Table 5 shows the impact of trade liberalization on company output. The results show that the majority of sectors in East Africa would be positively affected. However, the impacts of the AfCFTA on business output would be unevenly distributed. While the vegetable oils and fats sector would benefit most from the AfCFTA, with output increasing by 5.46%–6.94% in 2021 and 2026, respectively, under Scenario 1 and by 6.40%–9.1% under Scenario 3, output would decline in sectors such as other transport equipment; construction; and mineral products, gas and oil.
Although some sectors are negatively affected by the implementation of the AfCFTA, the losses are small compared to the benefits. These differential impacts of the trade agreement are explained by the fact that resources are reallocated to sectors of activity with a high comparative advantage. Thus, the dynamics of economic activities migrate to sectors where there is price competitiveness as argued by Abrego et al. (2020). The lower production costs induced by the AfCFTA will benefit private consumption and domestic production through increased demand for intermediate consumption and investment goods. TF has a much larger impact in East Africa. Hence, the need to undertake policy measures to mitigate impacts in sectors that would be negatively impacted.
Effects of AfCFTA on the Output of Industry, 2021 and 2026.
Effects of Tariff Elimination and Trade Facilitation on Employment 3
Table 6 presents the effects of the AfCFTA on labour demand (skilled and unskilled) by sector of economic activity in East Africa. The results show that the AfCFTA would impact labour mobility. Indeed, the magnitude of labour demand depends on the trade barrier reduction scenario, the sector of economic activity and the skill level of the labour force.
Effects of AfCFTA on Demand Skilled and Unskilled Labour by Industry.
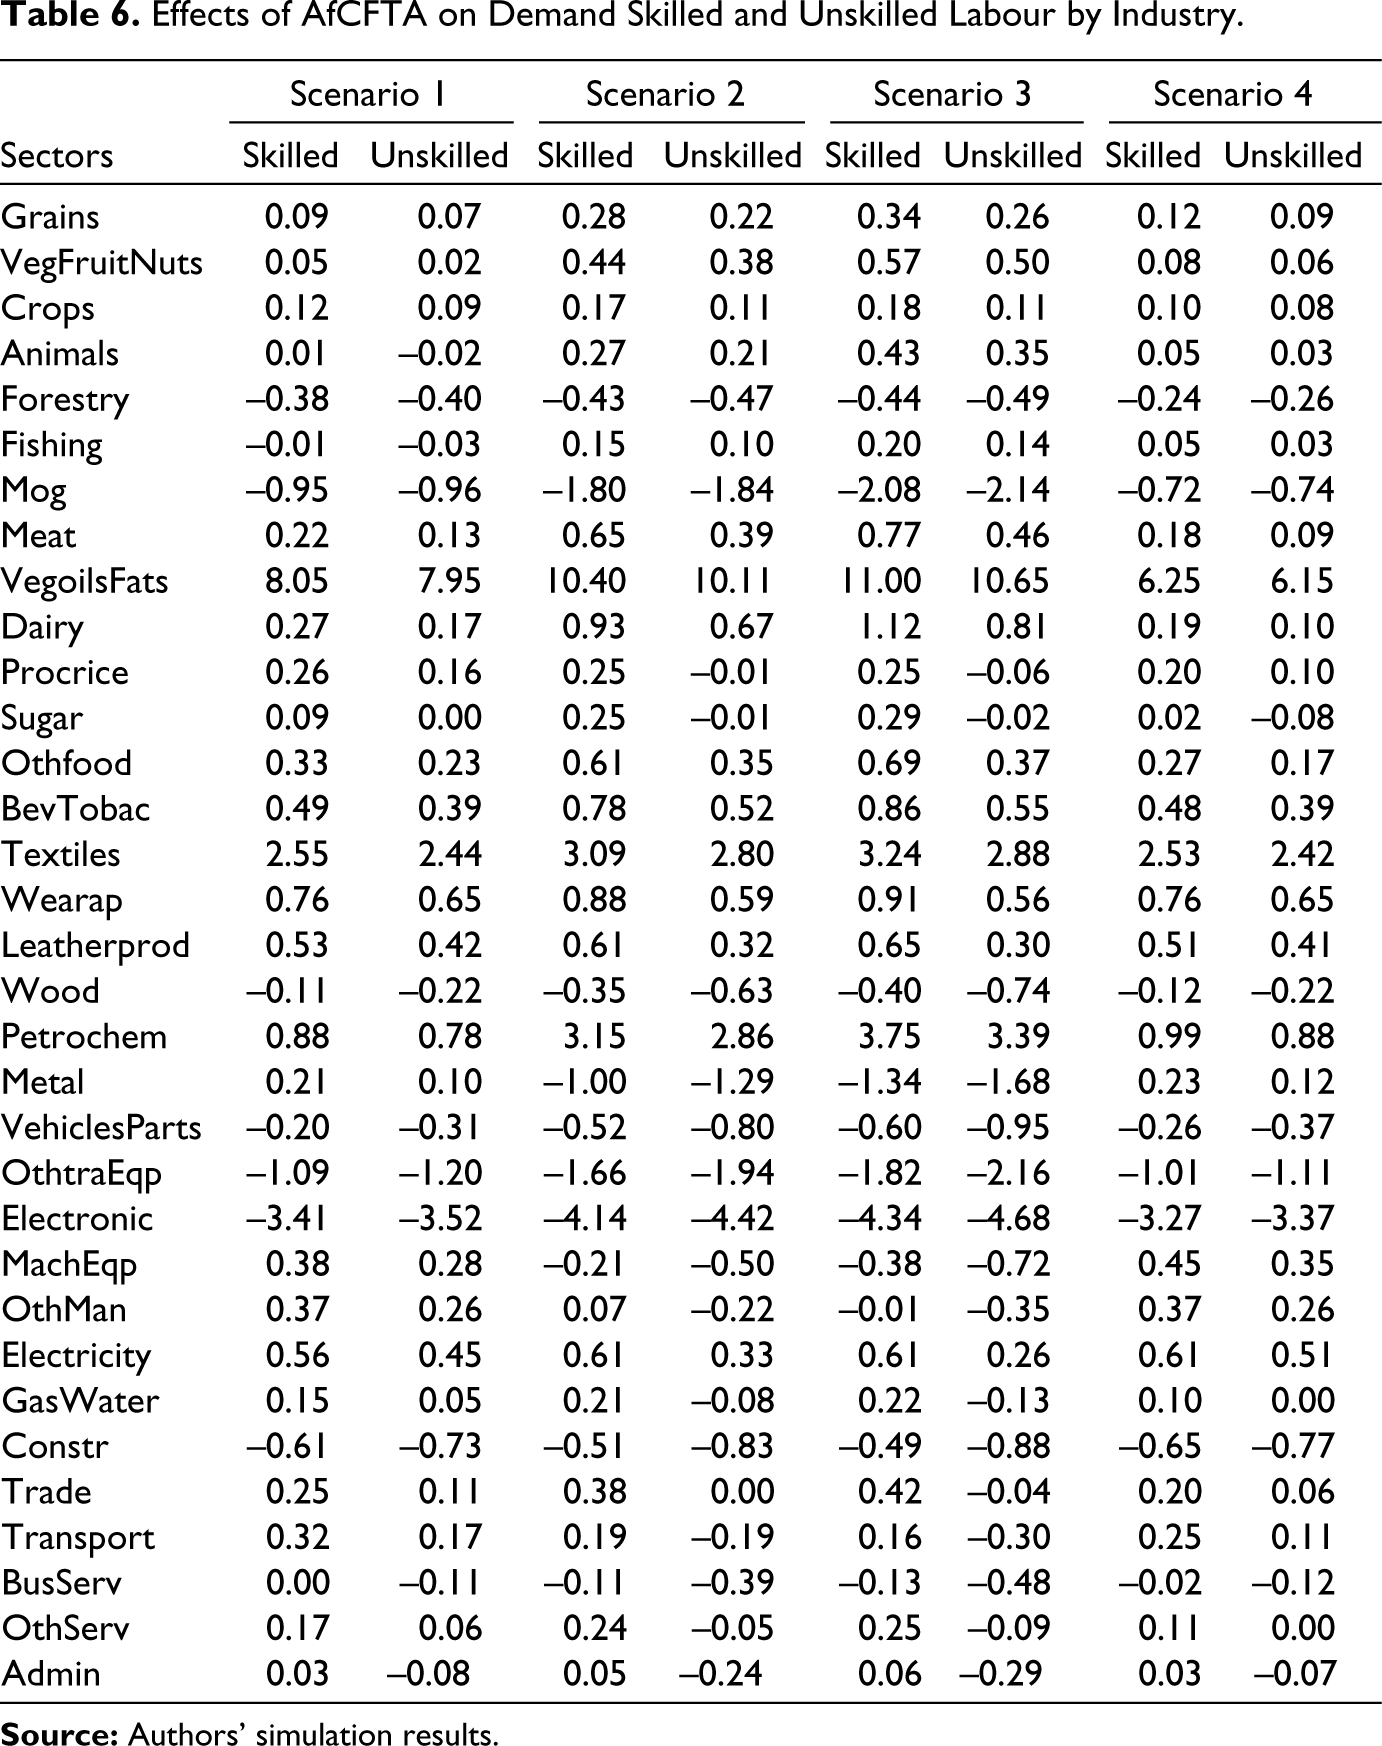
Overall, East Africa is expected to see a net increase in the labour force in most economic sectors as a result of the implementation of AfCFTA. This is due to increased production in manufacturing industries and changes in the production structure brought about by policy reforms. Indeed, while some sectors (e.g., vegetable oils and fats; textiles; petroleum and chemical products; wearing apparel; electricity and leather products) will experience the largest increases in labour demand, other sectors would experience declines (motor vehicles and parts; forestry; construction; mineral products, gas and oil; other transport equipment; electronic, computer and optical products). In addition, demand for skilled labour will grow faster than demand for unskilled labour due to sectoral reallocation of labour, sector comparative advantages and changes in labour compensation within the region.
Discussion
In sum, under all scenarios, we find that the implementation of the AfCFTA would bring socio-economic benefits to East Africa. These benefits include increased foreign trade, household consumption and production in most sectors. Overall, these results corroborate those found by Geda and Yimer (2022); Nechifor et al. (2021) and Shinyekwa et al. (2020). These results reaffirm the role of economic and regional integration as an important driver of development.
Three findings emerge from our results. First, the results show that the positive effects of removing tariff barriers are modest, but they are amplified when TF measures are combined. This result is consistent for two reasons. First, the levels of tariffs applied to trade in East Africa are relatively low, as these countries belong to RECs with free trade agreements. Most East African countries belong to the COMESA free trade area. Some countries are in the EAC, which is one of the most integrated RECs in Africa. However, intraregional traders still face higher non-tariff barriers to trade. These increase trade costs and negatively affect trade performance in Africa. This finding is consistent with the conclusions of other research mainly that comprehensive trade reforms can significantly contribute to increasing trade flows and consumer welfare (Abrego et al., 2019; Bakouan et al., 2022; Bhattacharyya & Mandal, 2016; Masiya, 2019; Sakyi et al., 2018), increased production (Fusacchia et al., 2022; Hoekman & Shepherd, 2015; Mureverwi, 2016; Narayanan et al., 2016; Sakyi et al., 2017b; World Bank, 2020) and increases employment (World Bank, 2020). On a theoretical level, these results confirm the assertion of neoliberal international trade economists. The magnitude of the AfCFTA’s impact on imports would be justified by the fact that East African countries export mainly low-value-added agricultural products to the rest of Africa, while they import more manufacturing products. In this case, the AfCFTA is likely to increase the region’s imports more than its exports. In addition, the countries of the subregion are highly dependent on external markets (extra Africa) for their exports.
Second, we find that the impacts of implementing the AfCFTA are larger in the long run. This finding corroborates that of Fouda Ekobena et al. (2021) that the potential long-term socio-economic gains from implementing the AfCFTA are higher in Central Africa. This dynamic effect may be due to the fact that firms need time to understand the agreement as Ando et al. (2022) point out. This period allows firms to adjust their business model to the trade policy. In addition, AfCFTA would lead to labour mobility in the subregion from sectors of comparative disadvantage to sectors of comparative advantage. These economic gains result from increased productivity of firms through better reallocation of resources, accumulation of capital stock and reduction of production costs. In the TFTA, Mold and Mukwaya (2016) had found that the light manufacturing and processed food sectors experienced the largest increases in employment.
The third finding is that the sectoral effects of the AfCFTA would be unevenly distributed in the subregion. This finding corroborates that of Shinyekwa et al. (2020). Moreover, our results are in line with those found by Mold and Mukwaya (2016). These authors find that under the COMESA-SADC-EAC TFTA, the sectors that benefit the most are manufacturing sectors, such as light and heavy manufacturing, and processed foods. As a result, East African countries would not benefit equally from the impacts of trade policy. This is because natural resources and agriculture dominate exports, and intraregional trade is relatively low as illustrated by Fusacchia et al. (2022). As shown above, the East African countries that would gain most from the implementation of the AfCFTA are those that specialize in the export of products, such as electronic, computer, optical products; other transport equipment; leather products; leatherprod; vegetable oils and fats; other manufactures; etc. In this regard, a cross-check of the trade profile of East African countries (Appendix 2) and our results (Table 3) reveals that the majority of countries would benefit from an increase in intra-African exports under the implementation of the AfCFTA, as the majority of East African countries are exporters in these sectors. This is therefore an opportunity for countries in the subregion to transform abundant commodities into finished products in order to benefit more from the agreement. In contrast to the services sector, the implementation of AfCFTA would contribute to the improvement of industrial performance in East Africa.
In terms of output, the results show that the output of the services sector would be negatively affected. However, according to UNCTAD (2022) statistics, the services sector accounts for a significant share of GDP in countries, such as Djibouti (86.32%), Seychelles (82.61%); Kenya (59.85%); in contrast to countries like Somalia (32.46%), Ethiopia (41.28%), Tanzania (42.81%), Burundi (44.15%), South Sudan (44.69%) or Uganda (45.42%), etc. This shows that if appropriate measures are not taken in economies heavily dominated by services, Ceteris paribus, these countries could suffer losses, at least in the short term since services in these countries are generally not tradable. However, countries like Tanzania and Ethiopia, where manufacturing is more important, would benefit more from the continental market.
Our results suggest that Scenario 4 (staged trade liberalisation) would be beneficial in mitigating the costs of the agreement in many economic sectors. Indeed, a gradual reduction of tariff barriers over 10 years will allow firms to adapt to the context. In any case, policymakers in East Africa need to take measures to protect vulnerable sectors. This may include specifically excluding certain vulnerable sectors from tariff line liberalisation for a given period. In addition, they should implement efficient border systems that reduce border clearing times. These measures would also reduce formal trade. Results show strong growth in exports and production of manufactured goods. This calls for a reorganisation of production structures in favour of structural transformation of commodities to enhance trade complementarity through the expression of cross-demands in the context of the AfCFTA. These results underscore the need to improve the competitiveness of the subregion’s economies and target potential sectors for industrialization.
Conclusion and Policy Implications
Regional integration is at the heart of African leaders’ stated priorities. This political will of African political leaders for continent-wide trade integration has materialised with the launch of the AfCFTA. The objective of this article was to assess, based on four scenarios, the potential economic effects of tariff elimination and TF in East Africa. The theoretical consensus among neoliberal economists that the economic gains of trade liberalization outweigh its costs was empirically demonstrated in this article.
Following simulations using a CGE model, we are able to draw several lessons on the impact of trade policies for East Africa. Indeed, imports and exports in the subregion would be positively affected due to lower production costs and optimal allocation of production factors. In addition, TF reforms would further amplify the positive effect of the elimination of the tariff. The magnitude of the positive impacts of TF measures is even greater when consolidated in the case of Scenario 3 (which combines Tariff elimination and improve TF of 15%). In addition, the long-term trade benefits would be greater. However, although the sectoral effects, in terms of household consumption and business output, remain positive overall (albeit at a moderate level), they differ across sectors because of their own characteristics.
In sum, although the elimination tariff would improve economic dynamism in most sectors and the welfare of people in East Africa, the elimination tariff alone would not be sufficient to achieve an ambitious level of trade integration. Therefore, there is a need to put trade liberalisation at the forefront to further consolidate the ongoing regional economic integration process. In addition to the elimination of import tariffs as provided for in the agreement, additional non-tariff measures to reduce trade costs should be considered: (i) reduce the duration of customs procedures, since in Africa, the export time is 29.3 days (compared to 10.2 days for advanced economies) and the import time is 36.4 days, compared to 9.3 days for advanced economies; (ii) reducing the important gaps in trade and productive infrastructure (port handling, developing integrative infrastructure projects, energy and communication interconnecting East African countries with each other and with the rest of Africa); (iii) supporting sectors with high export potential (vegetable oils and fats; textiles, petroleum and chemical products; wearing apparel; leather products; etc.). Other measures (such as promoting innovation, attracting investment) should be implemented to stimulate production, trade and product sophistication. This includes the promotion of industrialization and subregional and African value chains.
It should be kept in mind that the subregional analysis in this article masks economic disparities at the country level. In addition, we simulate less optimistic liberalization scenarios in this article, since we do not include a complete elimination of non-tariff barriers. As a result, our results are attempts to quantify the potential economic impacts of trade reform under our simulation assumptions. In addition, the difficulty of taking into account informal cross-border trade, which is nonetheless not negligible in Africa (Fouda Ekobena et al., 2021), may underestimate the impacts of the agreement. Nonetheless, our results are consistent with previous assessments of the economic impacts of the AfCFTA, which point to benefits for African countries from the implementation of the agreement.
Supplemental Material
Supplemental material for this article is available online.
Footnotes
Declaration of Conflicting Interests
The authors declared no potential conflicts of interest with respect to the research, authorship and/or publication of this article.
Funding
The authors received no financial support for the research, authorship and/or publication of this article.
Notes
References
Supplementary Material
Please find the following supplemental material available below.
For Open Access articles published under a Creative Commons License, all supplemental material carries the same license as the article it is associated with.
For non-Open Access articles published, all supplemental material carries a non-exclusive license, and permission requests for re-use of supplemental material or any part of supplemental material shall be sent directly to the copyright owner as specified in the copyright notice associated with the article.