
Abstract
Multivariate assessment profiles contain two conceptually distinct sources of variation: overall level and profile shape. Existing approaches recover some aspects of this structure, but none jointly establishes the replicability of latent pattern dimensions and provides a principled, population-referenced summary of person profile differentiation independent of overall level. We introduce the Aggregated Latent Profile Index (ALPI), a variance-weighted Euclidean distance that quantifies the degree to which an individual’s profile departs from a flat population reference within a bootstrap-validated latent profile space. ALPI is derived from the Aggregated Latent Profile Space (ALPS), a framework that combines parallel analysis with bootstrap stability diagnostics – principal angles between subspaces and Tucker’s congruence coefficients – to identify replicable latent pattern dimensions, then assembles the retained dimensions into a K-dimensional latent space through singular value decomposition, into which individuals and variables are jointly projected. In a simulation benchmark, ALPS recovered the known four-factor population structure as three replicable ipsatized pattern dimensions, confirming that the pipeline performs as intended when the true structure is known. In an application to normative WAIS–IV data (n = 900), ALPS identified a stable three-dimensional pattern space, and ALPI distinguished individuals with identical Full-Scale IQ – ranging from the 7th to the 85th percentile – on the basis of their ipsatized subtest configurations. ALPI provides assessment researchers and clinicians with a single, measurement-principled index of person profile differentiation that is grounded in replicable latent structure and independent of overall score level.
Introduction
Multivariate assessment data – such as cognitive subtest scores, behavioral ratings, and symptom scales – contain two analytically distinct sources of variation: overall level, reflecting a person’s average standing across variables, and configurational shape, reflecting the relative pattern of elevations and depressions across variables. Profile analysis is primarily concerned with the latter. In psychological and educational measurement, however, profile shape remains difficult to summarize in a way that is psychometrically principled, substantively interpretable, and demonstrably stable across samples.
Existing approaches address parts of this problem but not its full measurement implications. Principal component analysis (PCA; Jolliffe & Cadima, 2016) and factor analysis (FA; Brown, 2015) recover dimensions of shared variation, but they do not separate level from shape, do not formally evaluate the replicability of recovered pattern dimensions across samples, and do not yield scalar indices of individual profile differentiation. Latent profile analysis (LPA; Nylund et al., 2007) partitions individuals into discrete latent classes based on profile similarity, but its categorical representation does not provide a continuous profile space, dimension-specific person coordinates, or a quantitative summary of the degree of pattern differentiation within and across individuals. Multivariate regression (Rencher & Christensen, 2012) treats profiles as predictors or outcomes rather than as measurement objects in their own right and therefore does not recover latent pattern dimensions or quantify profile extremeness independently of overall level.
The Biplot Paradigm and Its Limits
Gabriel’s (1971) biplot introduced a useful geometric representation of multivariate profiles by jointly displaying individuals and variables in a low-dimensional space derived from principal components. Because distances, angles, and cosines can be interpreted directly, biplots offer an intuitively appealing framework for profile interpretation. From a measurement perspective, however, their usefulness is limited by their dependence on two-dimensional display. When profile structure spans more than two substantively meaningful dimensions – as is common in psychological and educational assessment – the biplot framework does not provide a principled way to integrate higher-order dimensions into a unified measurement space, nor does it provide an aggregated person-oriented summary across those validated dimensions.
Factor-Analytic Profile Analysis and Its Scope
The basic factor-analytic profile analysis (FAPA) paradigm was introduced by Kim (2013, 2024) as a framework for identifying latent pattern dimensions underlying multivariate profiles. The original formulation (Kim, 2013) used maximum-likelihood FA to extract core pattern components from ipsatized profiles (i.e., profiles row-centered by subtracting each person’s mean score across variables, thereby removing overall level and retaining only configurational shape; see equation (1)), with parallel analysis (PA) determining the number of statistically meaningful dimensions. Subsequent development (Kim, 2024) broadened this framework by incorporating PCA and singular value decomposition (SVD), while retaining ipsatization as the device for separating level from shape and PA as the criterion for dimensionality. In this sense, FAPA established an important psychometric foundation for profile measurement by modeling systematic shape variation after the removal of overall level effects. An open-source implementation is available in the FAPA R package (Kim, 2026b).
However, existing FAPA applications leave two important measurement problems unresolved. First, PA provides an upper bound on dimensionality relative to sampling noise, but it does not establish whether the resulting latent pattern dimensions are replicable across samples. For person-oriented interpretation, such replicability is essential. Second, FAPA has not yet provided a unified latent space in which individuals can be projected and compared across multiple validated dimensions, nor has it introduced a scalar index summarizing the overall degree of person profile differentiation relative to a common reference geometry. These limitations motivate the present study.
Person-Oriented and Predictive Alternatives
LPA and multivariate regression remain widely used with multivariate profile data, but they address inferential goals that differ from those of measurement-oriented profile analysis. LPA emphasizes classification into latent subgroups rather than continuous representation of individual differences in profile shape. Although useful for identifying qualitatively distinct subpopulations, it does not provide a continuous coordinate system for representing persons, dimension-specific indices of alignment with latent profile dimensions, or a scalar measure of overall profile differentiation. Multivariate regression, in turn, is designed for prediction or association rather than structural representation of profiles. It does not treat multivariate profiles as measurement objects, does not identify latent dimensions of shape, and does not quantify person profile pattern extremeness independently of overall level. Neither approach is designed to support continuous person-oriented measurement within a validated latent profile space.
The Aggregated Latent Profile Index and Its Enabling Framework
To address this gap, we introduce the Aggregated Latent Profile Index (ALPI), a variance-weighted Euclidean distance that quantifies the degree of person profile differentiation relative to a fixed, population-referenced geometry and independently of overall score level. ALPI is derived from the Aggregated Latent Profile Space (ALPS), a framework that provides the validated latent basis ALPI requires. ALPS proceeds in three stages. First, PA is combined with bootstrap-based subspace stability diagnostics – principal angles between subspaces and Tucker’s congruence coefficients – to identify latent pattern dimensions that are both statistically supported and reproducible across samples. Second, the retained dimensions are assembled into a K-dimensional latent profile space via SVD, within which individuals and variables are jointly represented through orthogonal projection. Third, each individual’s K-dimensional coordinate vector is aggregated into the scalar ALPI. Although ALPI emerges as the final stage of the ALPS pipeline, it is conceptually distinct from the space itself: ALPS is the validated latent basis, and ALPI is the scalar measurement index derived from that basis. We therefore treat them as related but separable contributions – ALPS as the enabling framework and ALPI as the person profile differentiation index it makes possible. The technical distinction is formalized in Step 3 of the method. Together, ALPS and ALPI yield a unified framework for multivariate profile measurement that is statistically defensible, geometrically interpretable, and explicitly person-oriented.
To evaluate whether ALPI performs as intended when the latent structure is known, we first examine its behavior in a controlled simulation setting. We then apply ALPS and ALPI to normative WAIS–IV data to assess whether the validated latent profile space supports interpretable person profile differentiation among individuals with identical Full-Scale IQ.
Contributions of the Present Paper
The present study makes four contributions. First, it introduces ALPI as a new person-oriented measurement index that quantifies the degree of profile differentiation within a bootstrap-validated latent profile space, independent of an overall score level. Second, it introduces ALPS as the enabling framework for ALPI, providing a formal procedure for evaluating dimensional replicability through bootstrap principal angles and Tucker’s congruence coefficients and assembling retained dimensions into a validated latent space that supports both dimension-specific person coordinates and ALPI computation. Third, it evaluates the recovery of known latent profile structure in a controlled simulation benchmark. Fourth, it provides a fully reproducible open-source implementation and an empirical demonstration using normative WAIS–IV data.
Method
Overview of Study Design
The present study included two components designed to introduce and evaluate ALPI as a person profile differentiation index. First, a simulation study evaluated whether the pipeline that produces ALPI could recover replicable latent profile dimensions under controlled conditions where the population structure was known. Second, an empirical application to the WAIS–IV normative dataset examined whether ALPI yields interpretable measurement of person profile differentiation in real assessment data. In both components, ALPS serves as the validated latent basis from which ALPI is derived.
Simulation Study Design
Before computing ALPI from the WAIS–IV normative data, we conducted a simulation study to evaluate whether the proposed pipeline could recover known latent profile structure under controlled conditions. A dataset with n = 900 cases and p = 18 variables was generated from a multivariate normal population whose marginal distributions approximated WAIS–IV scaled-score distributions (M = 10, SD = 3). The population correlation matrix was specified to reflect the published four-factor WAIS–IV structure (Wechsler, 2008), with within-factor correlations of .55 and between-factor correlations of .30, corresponding to Perceptual Reasoning, Processing Speed, Verbal Comprehension, and Working Memory.
The simulated data were analyzed using the same pipeline applied to the empirical data. Profiles were ipsatized by row-centering, a PA was conducted using 2,000 permutations with retention based on the 95th-percentile null eigenvalue, and bootstrap stability was evaluated using 2,000 resamples. In each resample, principal components were re-estimated, aligned to the full-sample solution by orthogonal Procrustes rotation, and evaluated using principal angles between subspaces and Tucker’s congruence coefficients, with retention criteria defined in Step 1 below. This simulation provided a proof-of-concept benchmark for whether the ALPI pipeline recovers replicable latent profile dimensions suitable for person-oriented measurement when the population structure is known.
Empirical Data Structure and Notation
The empirical application used the WAIS–IV normative dataset (ages 16–70; n = 900; Wechsler, 2008), restricted to the 18 primary subtests spanning perceptual reasoning, processing speed, verbal comprehension, working memory, and related domains. FSIQ is a composite score derived from a weighted combination of subtest scaled scores and expressed on a standard score metric (
Descriptive Statistics of Subtests and Full Scale IQ (FSIQ)
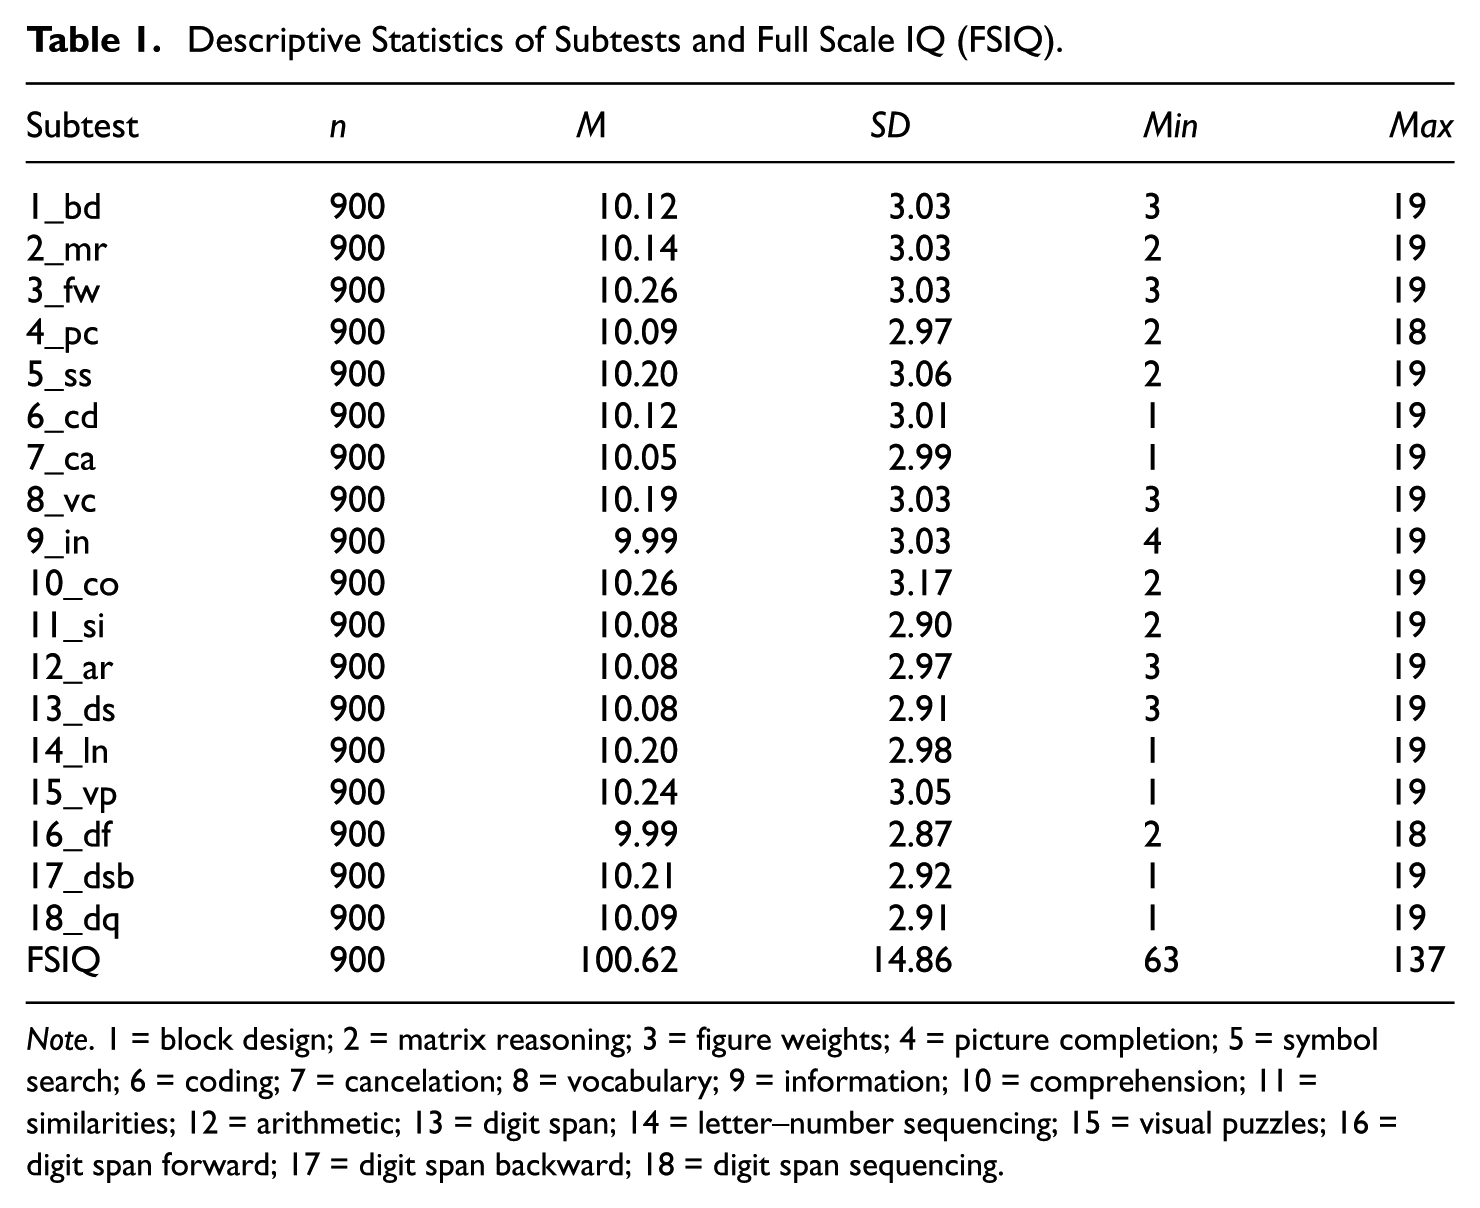
Note. 1 = block design; 2 = matrix reasoning; 3 = figure weights; 4 = picture completion; 5 = symbol search; 6 = coding; 7 = cancelation; 8 = vocabulary; 9 = information; 10 = comprehension; 11 = similarities; 12 = arithmetic; 13 = digit span; 14 = letter–number sequencing; 15 = visual puzzles; 16 = digit span forward; 17 = digit span backward; 18 = digit span sequencing.
ALPI is derived from ipsatized profiles that separate the overall level from the configurational shape. Following conventions of the FAPA paradigm (Kim, 2013, 2024), this separation is achieved through ipsatization:

where
Step 1: Establishing the Replicable Dimensional Basis for ALPI
ALPI requires latent dimensions that are both statistically supported and demonstrably reproducible across samples. Computing ALPI from dimensions that are not cross-sample replicable would conflate genuine profile differentiation with sampling idiosyncrasy. The following validation procedure establishes which dimensions meet this requirement by combining dimensionality assessment with explicit bootstrap stability screening.
Parallel Analysis
Let

where

where
Principal Angles Between Subspaces
To evaluate subspace stability, the

is compared with its bootstrap counterpart
quantify concordance between subspaces, with smaller angles indicating more stable recovery of the latent profile space across resamples and larger angles indicating weaker replicability (Björck & Golub, 1973; Davis & Kahan, 1970).
Tucker’s Congruence Coefficients
Component-level stability is evaluated using Tucker’s congruence coefficient between the full-sample loading vector
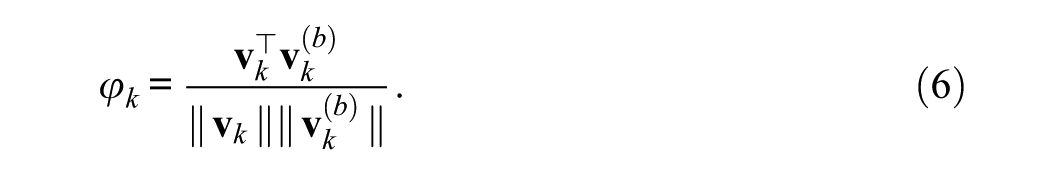
Following Lorenzo-Seva and ten Berge (2006), values of
Final Dimensionality
A dimension is retained for ALPI computation if it simultaneously exceeds sampling noise under PA and meets both bootstrap stability criteria:

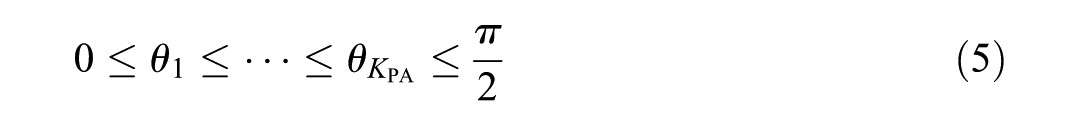
Consistent with this dual-criterion logic, the lower tail of the
Step 2: Constructing the Latent Profile Space (ALPS) Required for ALPI
ALPI is a distance measure within a validated latent space. That space – the ALPS – is constructed from the SVD in equation (2). Retaining the K validated components gives the loading matrix

In measurement terms, ALPS represents the validated latent basis for profile shape variation after the overall level has been removed – the space within which ALPI is subsequently defined and computed.
Domain Coordinates
Each subtest

where
Individual Projection
For individual

This projection places each individual within the validated latent profile space. The resulting coordinate vector
The ALPS-reconstructed profile for individual
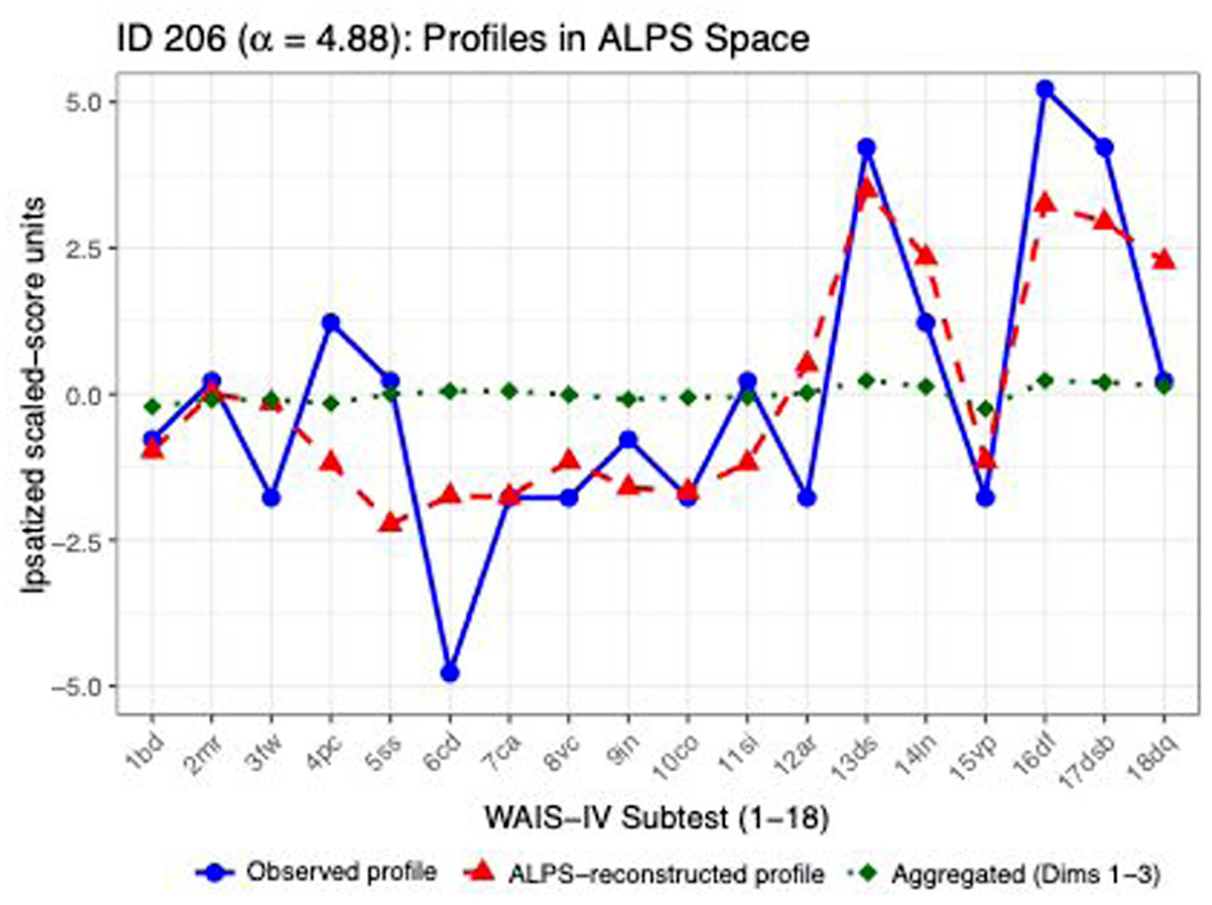
ALPS-reconstructed and observed profiles for individual 206 (high ALPI).
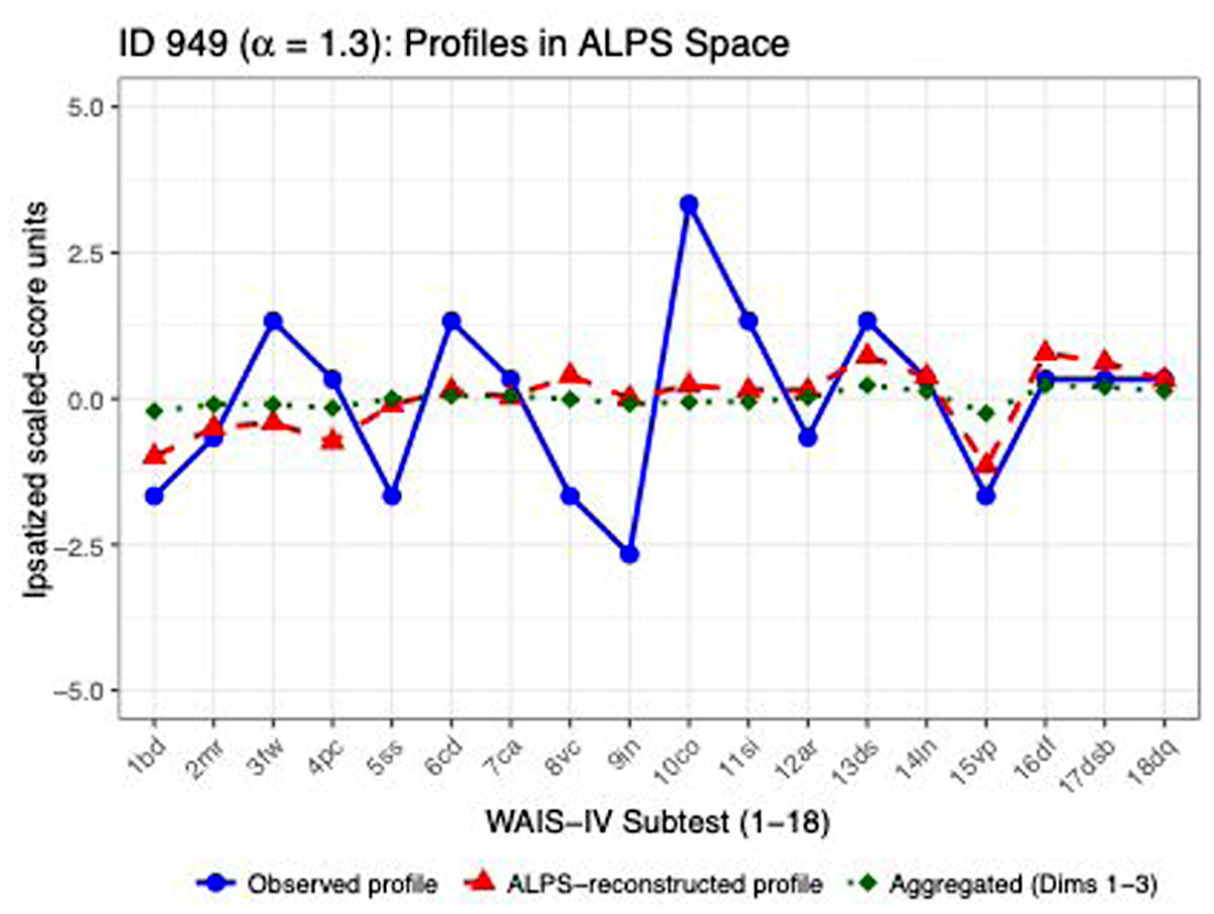
ALPS-reconstructed and observed profiles for individual 949 (low ALPI).
Population-Referenced Aggregated Latent Profile
The population-referenced aggregated latent profile is defined as:
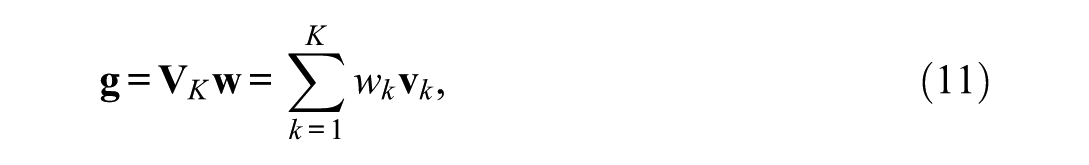
where
Step 3: Computing ALPI
ALPI (
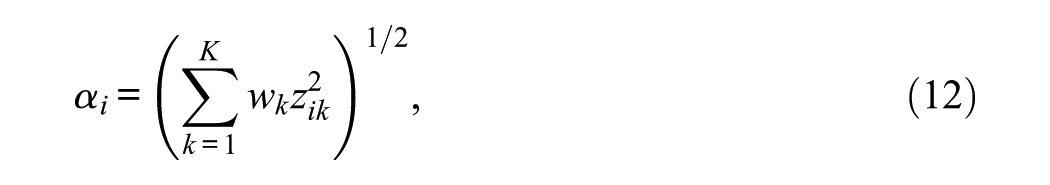
where
Variance-Based Weights
Let

such that
Standardized Index
Because
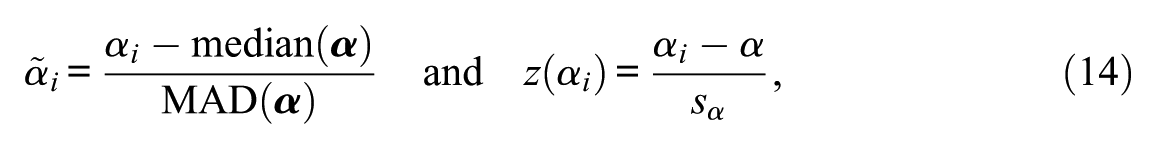
where
Reproducibility
ALPI as introduced here is implemented as the continuous pipeline (calsi_workflow()) of the broader open-source alsi R package (Kim, 2026a), which extends the ALPI framework to binary and ordinal data through Multiple Correspondence Analysis (MCA) and Homogeneity Analysis by Means of Alternating Least Squares (HOMALS) pipelines, respectively. The package is available on CRAN, and development materials are maintained on GitHub. The calsi_workflow() function provides an integrated pipeline encompassing ipsatization, PA, bootstrap dual-criterion stability screening, SVD-based latent space construction, individual projection, and ALPI computation. Annotated R scripts reproducing all analyses reported here are provided in the Supplemental Material.
Results
Simulation Study
Prior to the empirical application, we evaluated whether the pipeline that produces ALPI recovers a known latent structure – specifically, whether it identifies replicable latent dimensions suitable for computing a valid person profile differentiation index. A dataset of
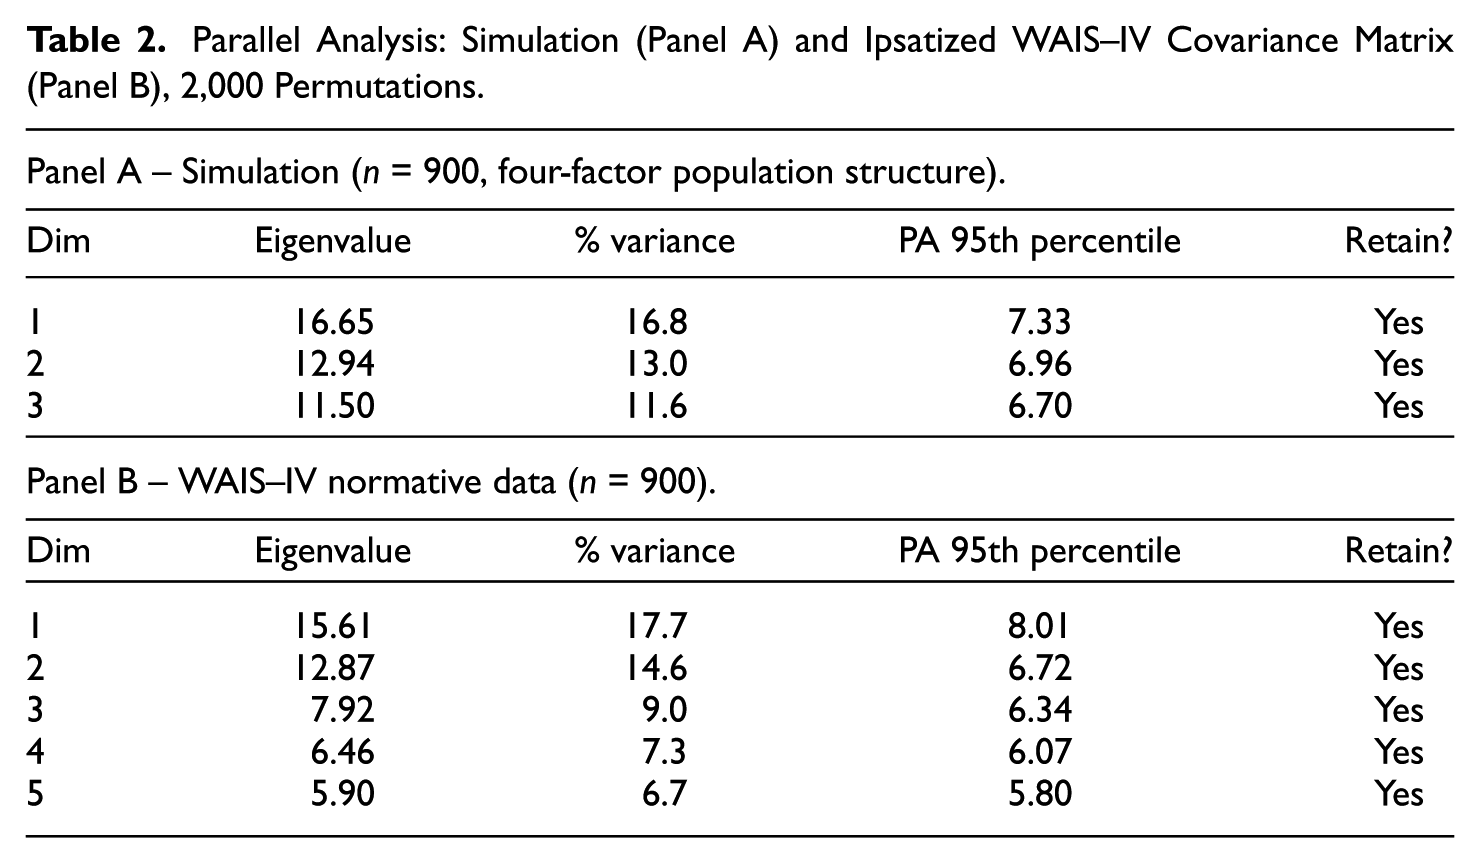
Parallel Analysis: Simulation (Panel A) and Ipsatized WAIS–IV Covariance Matrix (Panel B), 2,000 Permutations.
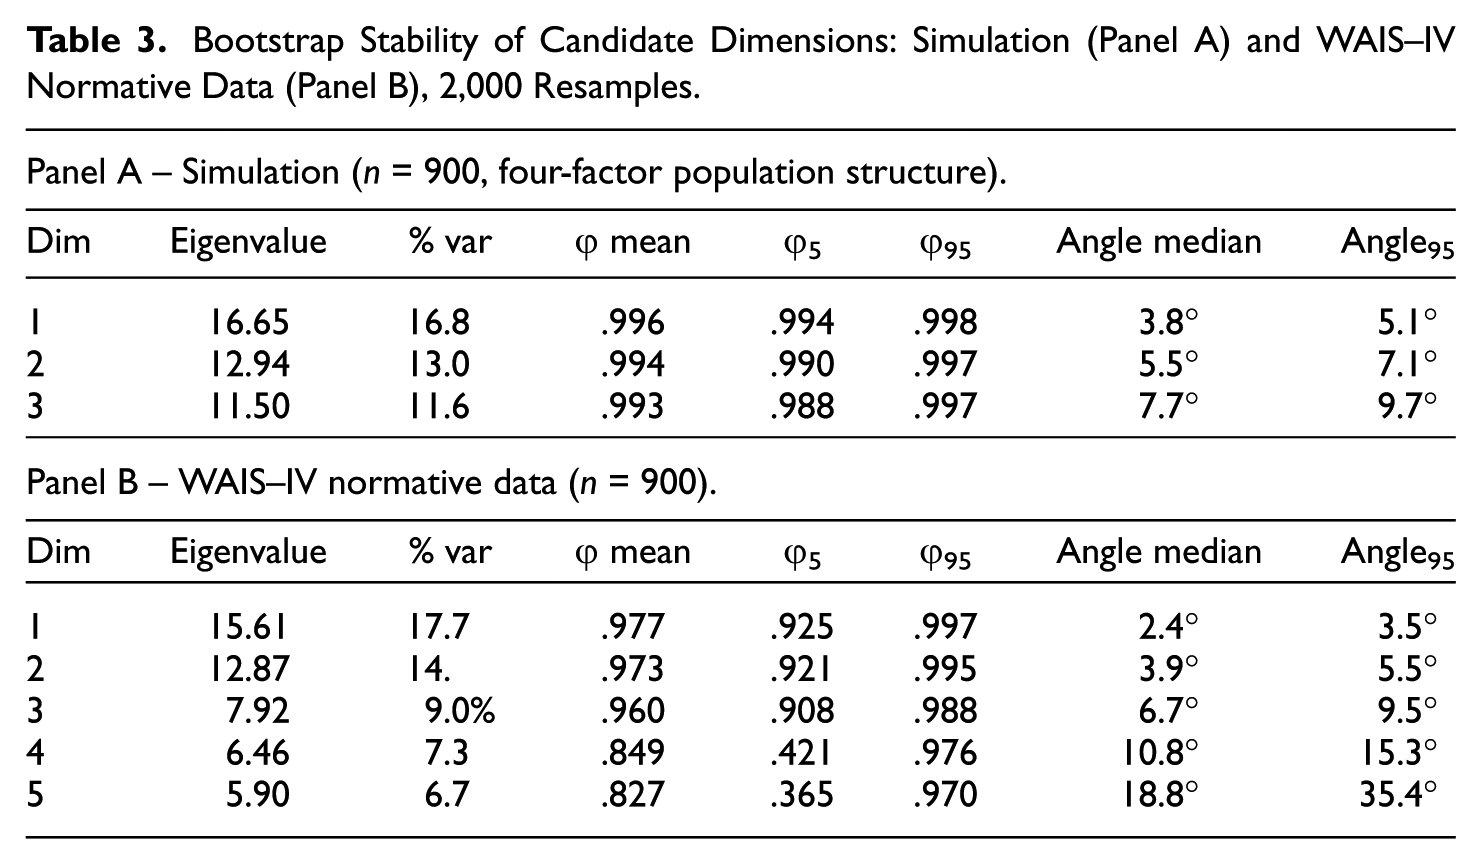
Bootstrap Stability of Candidate Dimensions: Simulation (Panel A) and WAIS–IV Normative Data (Panel B), 2,000 Resamples.
Empirical Application: Ipsatized WAIS–IV Profiles
Parallel Analysis
The simulation study provided a benchmark showing that ipsatization removes the general-level dimension and yields three replicable pattern dimensions from the four-factor population structure (Table 2, Panel A). PA of the ipsatized WAIS–IV data identified an upper bound of five candidate components, with each of the first five observed eigenvalues exceeding the corresponding 95th-percentile null reference value (Table 2, Panel B). These results indicate that the empirical data contain more candidate structure than is expected by chance alone, although additional stability filtering is required to determine which dimensions are reproducible.
Replicability of Candidate Dimensions
To determine which PA-supported dimensions were reproducible, 2,000 bootstrap resamples were generated, principal components were recomputed in each resample, the resulting loading matrices were Procrustes-aligned to the full-sample solution, and stability was evaluated using principal angles between subspaces and Tucker’s congruence coefficients (Table 3).
Two features of Table 3 deserve emphasis. First, the simulation panel contains only three dimensions because PA itself returned
ALPI-Based Profile Measurement of WAIS–IV Data
Interpretation of Retained ALPS Dimensions
Inspection of subtest coordinates within the three-dimensional ALPS space yielded clear and interpretable latent pattern axes. ALPS-1 contrasted Processing Speed subtests (Coding, Symbol Search) and Working Memory measures (Digit Span) with Verbal Comprehension subtests (Vocabulary, Information, Similarities), broadly opposing the Processing Speed Index (PSI) and Working Memory Index (WMI) factors of the published WAIS–IV structure (Wechsler, 2008) against the Verbal Comprehension Index (VCI) factor. ALPS-2 opposed Perceptual Reasoning subtests (Block Design, Visual Puzzles, Picture Completion) – the core PRI factor – to sequencing-based Working Memory tasks (Digit Span Backward, Digit Span Sequencing), reflecting a contrast between visuospatial reasoning and sequential processing demands. ALPS-3 contrasted Fluid Reasoning subtests (Matrix Reasoning, Figure Weights) with Verbal Knowledge measures (Comprehension, Information), capturing a distinction within the broad reasoning domain between fluid problem-solving and crystallized verbal knowledge. These three dimensions therefore correspond closely to the established four-factor WAIS–IV structure, with ipsatization collapsing the general factor and the bootstrap stability filter further consolidating the five PA-supported dimensions into three cross-sample-replicable pattern axes. From a measurement perspective, this alignment confirms that ALPS recovers substantively meaningful and interpretable cognitive profile dimensions rather than statistical artifacts.
Individual Projection, Coordinates, and Profile Differentiation
Individual coordinates in ALPS were obtained by projection onto
ALPS Coordinates (
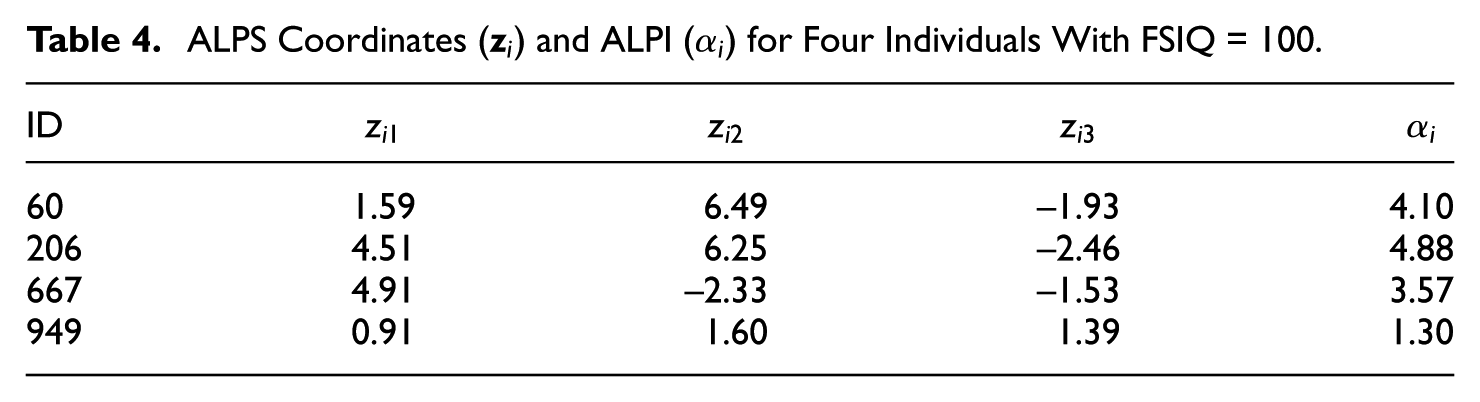
Each individual’s coordinate vector,
Individual 60 exhibited a dominant displacement along ALPS-2 (
Individual 206 showed large positive coordinates on ALPS-1 (
Individual 667 was characterized by strong positive alignment on ALPS-1 (
Individual 949 displayed uniformly small coordinates across all three dimensions (
Standardized ALPI Interpretation
Although the four illustrative individuals shared identical Full-Scale IQ scores, their locations in ALPS space and corresponding degrees of profile differentiation differed substantially. Table 5 reports raw, standardized, and robustly scaled ALPI values, together with percentile ranks based on the empirical distribution of
FSIQ, Raw, Standardized, and Robust ALPI Values and Percentile Ranks for Four Illustrative Individuals.
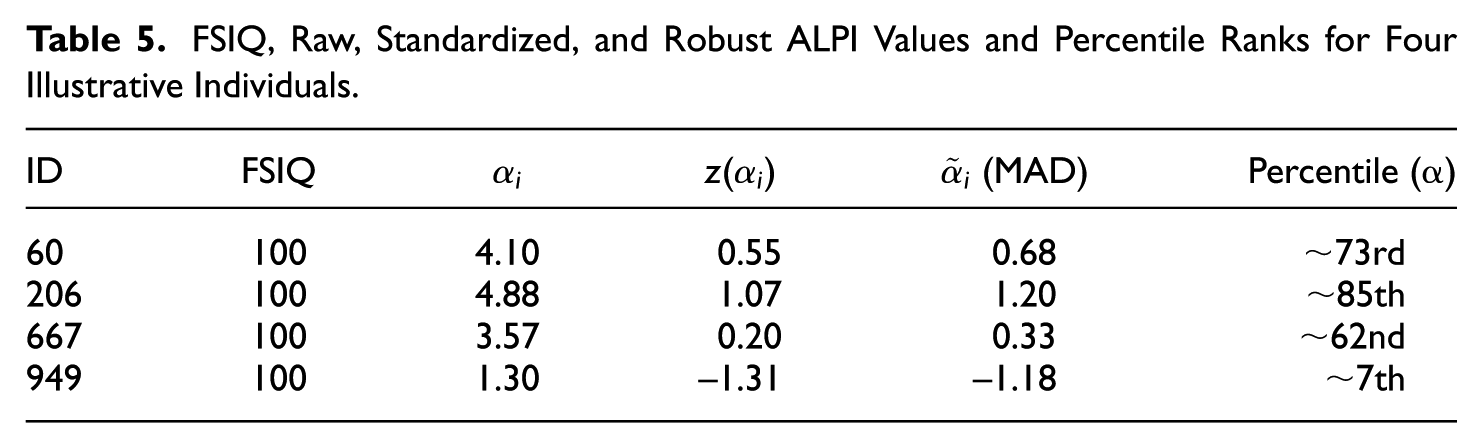
Individual 206 (
Profile Reconstruction, Aggregated Geometry, and the Utility of ALPI
Figures 1 and 2 display three complementary representations for Individuals 206 (high ALPI) and 949 (low ALPI): the observed ipsatized profile, the ALPS-reconstructed profile, and the population-referenced aggregated latent profile. These three representations serve different interpretive functions. The observed ipsatized profile preserves the person’s full pattern of relative strengths and weaknesses after the removal of the overall level. The ALPS-reconstructed profile represents that person’s best low-dimensional approximation within the validated latent profile space, that is, the portion of the observed pattern that is captured by replicable latent dimensions. The population-referenced aggregated latent profile is a fixed reference pattern estimated once from the full sample and displayed identically for all individuals. It does not represent any one person’s profile; rather, it summarizes the dominant weighted direction of shared profile variation in the population-defined ALPS space.
This distinction is important for practical assessment. Observed profiles can always be inspected directly, but raw inspection alone does not distinguish between pattern features that reflect stable, population-referenced latent structure and features that reflect residual or idiosyncratic variation. The ALPS-reconstructed profile addresses this problem by isolating the component of an individual’s profile that lies within the validated latent space. In this sense, it functions as a measurement-oriented summary of the person’s systematic profile differentiation, whereas discrepancies between the reconstructed and observed profiles indicate residual pattern variation not captured by the retained ALPS dimensions. ALPI then quantifies the overall magnitude of that validated differentiation in a single scalar index.
For Individual 206 (Figure 1), the observed ipsatized profile shows marked differentiation across subtests, and the ALPS-reconstructed profile preserves a substantial portion of that structure. This agreement indicates that the person’s observed profile is not merely irregular at the raw-score level but is meaningfully aligned with the validated latent dimensions defining ALPS. The large value of
For Individual 949 (Figure 2), the observed and reconstructed profiles both remain close to the flat population-referenced geometry, consistent with uniformly small ALPS coordinates and a low ALPI value. Here, the practical interpretation is different from that of Individual 206. The low
Taken together, Figures 1 and 2 clarify the utility of ALPI for assessment-oriented interpretation. The coordinate vector
Discussion
The present study introduced ALPI as a person profile differentiation index derived from ALPS, a framework in which latent profile dimensions are explicitly validated for cross-sample replicability before being used to represent and summarize individual profiles. In the empirical application, the WAIS–IV normative data supported a stable three-dimensional latent profile space – reproduced across 2,000 bootstrap resamples – that distinguished individuals with identical Full-Scale IQ on the basis of their ipsatized subtest configurations. ALPI values ranged from the 7th to the 85th percentile among individuals sharing the same overall ability level, demonstrating that overall score level conceals substantial and measurable differences in profile organization.
Reconstructed Profiles, Measurement Error, and the Interpretive Advantage of ALPI
A fundamental interpretive advantage of ALPI lies in the basis on which it is computed: unlike indices derived from observed profiles, ALPI is grounded exclusively in ALPS-reconstructed profiles – filtered representations that separate reliable latent structure from measurement noise. Observed ipsatized profiles capture a person’s full pattern of relative strengths and weaknesses, but they do so with contamination from random fluctuation and measurement error. Because observed profiles are not filtered through any replicability criterion, visually salient features may reflect sampling variability or instrument imprecision rather than stable individual characteristics. ALPS-reconstructed profiles address this problem directly. They represent each individual’s profile as projected onto dimensions that have been retained only after surviving both statistical and cross-sample replicability tests – first passing PA against sampling noise, then confirming stable recovery across 2,000 bootstrap resamples via principal angles and Tucker’s congruence coefficients. In this sense, ALPS-reconstructed profiles isolate the portion of observed profile variation that reflects a reliable, population-referenced latent structure. For assessment interpretation, this distinction matters: a reconstructed profile offers a more defensible basis for clinical judgment than a raw observed profile because it separates systematic profile differentiation from measurement noise.
The Aggregated Profile as a Clinical Reference Anchor
The population-referenced aggregated latent profile plays a specific and important role within this framework. It is estimated once from the full normative sample as the variance-weighted dominant direction of shared profile variation across the retained ALPS dimensions. In the present data, this profile was approximately flat, indicating that the normative population does not exhibit strong systematic differentiation in any particular direction after level effects are removed. This flatness is precisely what makes the aggregated profile useful as a clinical reference anchor: it represents the population baseline of profile patterning against which individual deviations are evaluated. An individual’s ALPS-reconstructed profile can then be read relative to this fixed reference – not relative to any arbitrary group mean or norm-referenced standard – so that elevations and depressions in specific subtest domains carry interpretive meaning grounded in the validated latent structure of the full normative sample. Because ALPI is defined as a variance-weighted Euclidean distance from the origin of this validated space, it directly quantifies how far each individual’s reconstructed profile departs from this population-referenced anchor – making the aggregated profile not merely a descriptive reference but the geometric foundation on which ALPI rests.
ALPI as a Clinical Screening Tool and the Two-Step Interpretive Workflow
For applied psychologists and clinicians, ALPI supports a natural two-step interpretive workflow. In the first step, ALPI (
In the second step, the clinician inspects the ALPS-reconstructed profile directly – as illustrated in Figures 1 and 2– to identify which specific subtest domains are elevated, depressed, or unchanged relative to the aggregated reference profile. This domain-level inspection identifies the directional content and clinical meaning of the differentiation that αi has already quantified in aggregate. Together, the two steps provide complementary information:
Limitations
Several limitations warrant consideration. The empirical demonstration rests on a single normative dataset, and the coherence of the retained ALPS dimensions is specific to the WAIS–IV. The operating characteristics of ALPI – including its sampling behavior and sensitivity to the number of retained dimensions under varying sample sizes and signal-to-noise conditions – have not yet been comprehensively characterized. The retention thresholds (
Future Directions
More comprehensive simulation studies characterizing the sampling distribution and operating characteristics of ALPI across varying dimensionality, sample size, and profile structures represent the most important next step for establishing ALPI as a general profile-measurement index. Longitudinal extensions – tracking ALPS-reconstructed profile changes over time within a fixed latent space – and multigroup extensions – aligning ALPS spaces across clinical or demographic groups to evaluate measurement equity – are especially promising directions. The open-source alsi package, which implements the ALPS workflow for continuous, binary, and ordinal data, provides a computational foundation for these developments.
Conclusion
ALPI provides assessment researchers and clinicians with a principled, population-referenced index of person profile differentiation that is grounded in replicable latent structure and independent of overall score level. It is computed from ALPS-reconstructed profiles – representations that filter observed profile variation through cross-sample validated latent dimensions, separating systematic profile differentiation from measurement noise. The population-referenced aggregated latent profile provides the geometric anchor against which ALPI quantifies individual departure, and direct inspection of the reconstructed profile then identifies which specific subtest domains drive that departure. Together, ALPI and the ALPS framework convert multivariate profile interpretation from descriptive inspection of observed scores into measurement-principled, clinically actionable person-oriented assessment – wherever multivariate profiles are collected and where the goal is defensible, replicable individual interpretation.
Supplemental Material
sj-docx-1-epm-10.1177_00131644261451487 – Supplemental material for The Aggregated Latent Profile Index: Measuring Person Profile Differentiation Within a Bootstrap-Validated Latent Profile Space
Supplemental material, sj-docx-1-epm-10.1177_00131644261451487 for The Aggregated Latent Profile Index: Measuring Person Profile Differentiation Within a Bootstrap-Validated Latent Profile Space by Se-Kang Kim in Educational and Psychological Measurement
Footnotes
Ethical Considerations
This study analyzed archival, de-identified human data. Ethical approval was not required.
Consent to Participate
Informed consent to participate was not required because this study analyzed archival, de-identified data.
Consent for Publication
Not applicable.
Funding
The author received no financial support for the research, authorship, and/or publication of this article.
Declaration of Conflicting Interests
The author declared no potential conflicts of interest with respect to the research, authorship, and/or publication of this article.
Data Availability Statements
Supplemental Material
Supplemental material for this article is available online.
References
Supplementary Material
Please find the following supplemental material available below.
For Open Access articles published under a Creative Commons License, all supplemental material carries the same license as the article it is associated with.
For non-Open Access articles published, all supplemental material carries a non-exclusive license, and permission requests for re-use of supplemental material or any part of supplemental material shall be sent directly to the copyright owner as specified in the copyright notice associated with the article.