
Abstract
Conventional cross-country scoring reliability in international large-scale assessments often depends on double scoring, which typically involves relatively small samples of multilingual responses. To extend the reach of reliability estimation, this study introduces the Linguistic-integrated Reliability Audit (LiRA), a novel method that measures scoring reliability using an entire dataset in a large-scale, multilingual context. LiRA automatically generates a second score for each response by analyzing its semantic alignment within a neighborhood of similar responses, then applies a weighted majority voting to determine a consensus score. Results demonstrate that LiRA provides a more comprehensive and systematic estimation of scoring reliability at the item, country, and language levels, while preserving the fundamental concepts of traditional reliability.
Keywords
Introduction
Constructed-response (CR) items are considered more aligned with capturing students’ comprehension, reasoning, and higher-order skills than selected response formats such as multiple-choice (MC) items. Consequently, a substantial portion of the large-scale educational assessments, such as the Progress in International Reading Literacy Study (PIRLS), the Programme for International Student Assessment (PISA), the Trends in International Mathematics and Science Study (TIMSS), and the National Assessment of Educational Progress (NAEP), include CR items. Scoring responses to CR items, whether by human scorers or automated systems, can be resource-intensive and vulnerable to inconsistency, particularly when interpretation is required. Scoring reliability, which refers to the consistency and accuracy of scoring student responses, is a fundamental aspect of obtaining high-quality data. Ensuring that the different scorers assign the same score to the same response is essential to maintaining the validity of the assessment results (Shin et al., 2019).
Concerns about the reliability of human scoring in educational contexts have a long history. Early work demonstrated inconsistencies in teachers’ essay scoring, highlighting the subjective nature of grading in the absence of standardized criteria (Starch & Elliott, 1912, 1913a, 1913b). Subsequent studies confirmed that extraneous factors such as grammar, handwriting, or even the perceived neatness of an essay can significantly influence scorers’ evaluations (Huck & Bounds, 1972; Scannell & Marshall, 1966). These findings motivated the development of scoring rubrics and structured scoring frameworks to impose objectivity and alignment across scorers.
Empirical research has demonstrated that structured scoring protocols, especially those incorporating task-specific rubrics, example scripts, and scorer calibration exercises, substantially improve inter-rater agreement (Cooper et al., 1977; Jonsson & Svingby, 2007). However, residual variability in scoring remains a persistent concern. Braun’s (1988) calibration studies revealed that by employing partially balanced incomplete block (PBIB) designs, the experiment isolates systematic sources of variation, such as reader severity and day-to-day drift, without requiring redundant readings of the same essays. The study argued that even trained raters exhibit systematic differences in scoring severity and that statistical adjustments to account for such differences can enhance reliability more cost-effectively than double-scoring procedures.
Building on these insights, Stemler (2004) proposed a comprehensive framework for inter-rater reliability, distinguishing among three key perspectives: consensus estimates, defined as exact agreement between raters; consistency estimates, assessed through correlational alignment; and measurement estimates, which encompass more complex modeling approaches such as generalizability theory (Cronbach, 1946; Shavelson & Webb, 1981). Each perspective offers distinct methodological tools, underscoring that scoring reliability is not a singular construct but rather a multidimensional concept. Furthermore, no single safeguard, such as double scoring, is sufficient to fully control for rater effects. Instead, robust quality assurance requires a multistep approach that incorporates scorer selection, training, calibration exercises, ongoing statistical monitoring, and procedural controls (Graham et al., 2012).
These challenges of maintaining scoring consistency, ensuring fairness across diverse student populations, and managing the resource demands of human scoring are especially pronounced in international large-scale assessments (ILSAs). In multilingual assessment contexts, human raters must be trained across a variety of languages and cultural frameworks to ensure that scoring is valid and comparable across countries and cycles (Mazzeo & von Davier, 2008, 2014). Traditionally, ILSAs have addressed these challenges by implementing rigorous scoring procedures: centralized rubric (scoring guide) development, international and national scoring training, within-country and cross-country scoring calibration, and ongoing quality monitoring using double scoring and inter-rater reliability statistics. These protocols are resource-intensive, but they have proven effective in producing high levels of scoring reliability in operational practice.
A prime example of this approach is found in PIRLS, where CR items comprise approximately half of the total score points. Given the consistency of human judgment in scoring these items, PIRLS has developed a comprehensive, multilayered scoring and quality assurance system. This includes coordinated international and national scorer training, the use of software-supported scoring platforms, and systematic reliability studies conducted at national, cross-national, and across cycles, all aimed at ensuring consistent application of scoring criteria across countries and over time.
Scoring of CR items in PIRLS is guided by detailed scoring guides developed by the TIMSS & PIRLS International Study Center. These guides provide precise criteria and annotated examples for each score category, allowing scorers to apply the guides consistently across diverse response types. Since the transition to the computer-based assessment in PIRLS 2021, all scoring activities have been conducted online through IEA’s CodingExpert Software, which integrates reliability tracking and scoring standardization functions (Johansone, 2024).
The scoring process begins with international training sessions where National Research Coordinators or their appointed representatives are trained directly by the International Study Center. During these sessions, participants practice scoring standardized responses, engage in group discussions to resolve discrepancies, and align their interpretations with the scoring guide. These trained coordinators then return to their countries and lead national-level training using both international materials and additional examples derived from their own country’s student responses. This layered approach is necessary as scoring within countries is carried out in the different languages of the test used in each participating country. However, this approach assumes that the international scoring training conducted in English can be turned into localized training in dozens of other languages without loss of fidelity.
PIRLS evaluates scoring reliability through three complementary approaches: within-country, trend, and cross-country scoring reliability (CCSR). Within-country reliability is assessed by having each participating country independently double-score a random sample of approximately 200 responses per CR item. The agreement between the two scores serves as a measure of scorer consistency. Trend reliability examines scoring consistency over time by having scorers in the current cycle re-score responses from the previous administration. CCSR, while more limited in scope, assesses scoring consistency across countries by selecting a scorer in each of the participating countries who is proficient in English to independently score a common set of 200 responses drawn from English-speaking countries. Unlike within-country and trend reliability procedures that are integrated in the operational scoring workflow, CCSR studies are conducted as a separate exercise following the completion of main scoring activities (Johansone, 2024).
While CCSR provides an important index of international scoring consistency, its validity is limited due to the need to use English-only responses and is constrained by several structural and logistical challenges. Most notably, language restrictions limit the selection of responses to English, excluding a large portion of the PIRLS population and leading to an incomplete representation of global scoring comparability. Moreover, scorers from participating countries must be proficient in English, which further restricts the scorer selection process and may result in a less representative pool of raters. Sample constraints also limit the generalizability of findings, as CCSR is based on a fixed subset of responses (usually 200 per item) for a limited number of items, which may not capture the full diversity of item types, response patterns, or student populations. In addition, the approach lacks scalability, as double scoring and international coordination are resource-intensive and become increasingly burdensome as digital platforms and participating countries expand. Finally, the method constitutes a static evaluation, offering only a snapshot of agreement without the capacity for continuous, response-level diagnostics or adaptive quality control. These limitations underscore the need to rethink the scoring reliability framework that preserves the foundational role of human judgment while extending the scope, granularity, and inclusivity of reliability estimation.
Recent studies further highlight both the strengths and limitations of current practices. For instance, Shin et al. (2019) reported near-perfect correlations between human and automated scores in the PISA 2015 science assessment, suggesting that well-designed scoring guides and monitoring protocols can effectively control for rater variance in many settings. However, the same study uncovered residual severity biases in a subset of low-performing countries, reinforcing the importance of empirical, data-driven mechanisms for ongoing quality checks. Similarly, Ercikan and Lyons-Thomas (2013) argue that scoring comparability in multilingual assessments cannot rely on training and scoring guides alone; it must be supported by empirical validation across linguistic and cultural contexts. These findings collectively emphasize that while existing scoring procedures have demonstrated strong reliability, they remain logistically challenging and labor-intensive, financially demanding, and inherently limited by their reliance on subsample-based double scoring.
Despite being considered the gold standard for estimating inter-rater reliability, double scoring introduces practical trade-offs. Scoring each response twice by independent human raters, especially in large-scale, multilingual assessments, requires significant investment in human labor, training, and monitoring infrastructure. Moreover, since double scoring is typically limited to a small number of responses per item, it raises important concerns about the representativeness of reliability estimates, particularly for rare, ambiguous, or culturally nuanced responses. These persistent constraints motivate the need for more scalable, inclusive, and adaptive frameworks for scoring reliability. To address these limitations, we propose a novel semantic similarity-based approach that maintains the foundational role of human scoring but redefines how scoring reliability is assessed. Rather than relying exclusively on duplicated scores, our approach leverages the semantic relationships between responses to infer the expected consistency in human scoring.
Although this study focuses on evaluating the reliability of human scoring, the proposed semantic similarity framework is equally applicable to assessing the internal consistency of automated scoring systems. In such a context, one could evaluate whether an artificial intelligence (AI) model assigns the same score to semantically similar responses; this would be an indicator of model stability and fairness. This adaptation would allow for checking the coherence of machine-scoring outputs without requiring ground truth labels for every response. While we do not pursue this direction in this paper, the underlying architecture is designed to support such extensions as well.
Background
Double Scoring for Scoring Reliability
Double scoring by independent raters is a foundational practice in educational measurement to reduce rater bias and improve score consistency (Williamson et al., 2012). This method creates a system of checks and validation for reliable scoring. Yet, implementing double scoring is resource-intensive, demanding significant investments in time, effort, and costs for recruiting, training, and continuously monitoring multiple raters (Gwet, 2014; Wiggins, 1990). These logistical hurdles are amplified in ILSAs, where large response volumes, coupled with diverse languages and cultural contexts, increase operational complexity. Despite these considerable investments, prior studies indicate that double scoring often yields only modest reliability gains, and rater effects and inconsistencies can persist (Ofqual, 2014; Song & Lee, 2022).
To address the resource intensity of full double scoring, partial double scoring has emerged as an alternative, where only a random subset of responses is evaluated by a second rater (Miao & Cao, 2019). While this reduces costs and time, it may allow scoring errors or inconsistencies to remain undetected in the responses that are not double-scored. This is especially problematic in high-stakes assessments, where accurate student classification is critical (Finkelman et al., 2009). A more refined strategy, targeted double scoring (TDS), attempts to maximize scoring reliability by focusing on those second evaluations on responses near critical score boundaries, such as pass/fail cut scores (Finkelman et al., 2009; Sinharay et al., 2023). However, the effectiveness of TDS hinges on the accurate identification of these critical score boundaries; misidentification can reduce its benefits. Furthermore, recent research suggests that TDS might not consistently outperform simpler partial double scoring in terms of overall psychometric improvements (Xu & Wind, 2025). Given these well-documented limitations of double scoring, our novel approach focuses on estimating the reliability of initial human scoring, rather than depending on a second, additional human score.
Semantic Text Similarity
Semantic text similarity (STS) is a crucial natural language processing (NLP) technique that measures the degree of shared meaning between two texts. Driven by AI advancements, STS has become vital for numerous tasks, such as text summarization, classification, question-answering, machine translation, and information retrieval (Chandrasekaran & Mago, 2021; Han et al., 2021; Harispe et al., 2022). In education, STS is applied to analyze the classroom discourse, assess adherence to educational intervention protocols, and evaluate alignment between different content standards (Anglin et al., 2021; Boyle & Crossley, 2024; Butterfuss & Doran, 2025; Khan et al., 2021). Recently, Ayaan and Ng (2025) showed that STS improves the accuracy of automated scoring for open-ended responses by aligning student responses and teacher-defined reference responses.
Early methods for STS primarily relied on surface-level lexical overlaps, such as Bag of Words (BoW) and Term Frequency-Inverse Document Frequency (TF-IDF). These techniques convert text into numeric vectors to calculate similarity (Singh et al., 2024). BoW simply counts word frequency, while TF-IDF assigns weights to words based on their importance within a document relative to their frequency across a larger collection of texts. However, a major limitation of these methods is their inability to capture nuanced meaning, as they ignore context and relationships between words (Chandrasekaran & Mago, 2021; Dai et al., 2024). For example, sentences like “She bought a new car” and “She purchased a new automobile” would receive low similarity scores despite their semantic equivalence, because they use different words.
Recent advances in STS have overcome these limitations by leveraging transformer-based models, like Bidirectional Encoder Representations from Transformers (BERT), which generate contextualized embeddings for more accurate similarity assessments. Sentence-BERT (SBERT) is fine-tuned to produce meaningful sentence embeddings, accelerating STS and clustering tasks without sacrificing accuracy (Prashanth, 2025; Reimers & Gurevych, 2019). MPNet further enhances embedding quality by mapping text to a 768-dimensional vector space; models like all-mpnet-base-v2 show strong performance on various semantic tasks (Galli et al., 2024; Sonavane et al., 2024; Song et al., 2020). Among these cutting-edge models, MiniLM (e.g., all-MiniLM-L6-v2) stands out as a compact solution for processing large volumes of text (Wang et al., 2020). Sajja et al. (2025) highlight its effectiveness in educational applications due to its competitive performance, lightweight design, and low-latency inference. Given this optimal balance of performance and efficiency, we adopted all-MiniLM-L6-v2 for our STS analysis.
Voting Strategies
Ensemble learning is a powerful machine learning technique that combines the predictions from multiple models or classifiers to boost overall performance and reduce errors inherent in single-model predictions (Dong et al., 2020; Rokaya & Alsufiani, 2024). This approach leverages the collective strengths of different models, with research showing that ensemble methods outperform individual models in terms of accuracy and robustness (Rojarath et al., 2016). Ensemble learning is typically categorized as either hard voting or soft voting (Kumari et al., 2021).
Hard voting, or majority voting, is a straightforward ensemble technique where each model casts a vote for a specific label. The label with the most votes becomes the final prediction (Breiman, 1996; Freund & Schapire, 1997; Qamar et al., 2016; Zhu, 2015). While transparent and simple to implement, hard voting has limitations. It assumes all models are equally reliable, which can allow less accurate models to disproportionately skew the results. There is also a risk that a simple majority of less accurate models could, by chance, override predictions from better-performing models (Shahzad & Lavesson, 2013). In education, hard voting mirrors traditional adjudication processes, where a third rater is brought in to resolve discrepancies among human and/or machine scores (McCaffrey et al., 2022; Williamson et al., 2012). However, if these raters possess varying levels of expertise, treating their scores equally can compromise the reliability of the final score, echoing the limitation seen in hard voting.
Soft voting, in contrast, aggregates predicted probabilities from multiple models. It then selects the label with the highest average probability as the final prediction (Delgado, 2022; Mohammed & Kora, 2023). Weighted soft voting, also referred to as weighted majority voting, advances this approach by assigning weights to each model’s contribution according to its accuracy or confidence level. The final label is determined by the highest sum of these weighted probabilities (Sherazi et al., 2021). This approach is often preferred because it prioritizes stronger, more reliable models, typically resulting in improved predictive performance (Li & Luo, 2020). While our approach shares structural similarities with ensemble voting, particularly weighted soft voting, it does not involve multiple models.
In an education context, weighted soft voting has practical applications. Rupp et al. (2019) illustrated its utility in the Graduate Record Examinations (GRE) analytical writing section, where a final score is a weighted average that weighs human scores when differences between human and machine scores are minimal. Sofjan et al. (2023) also identified a strong correlation between weighted peer scores and instructor evaluations, suggesting the potential of weighted peer ratings to enhance reliability in collaborative settings. Furthermore, Malik and Jothimani (2024) proposed the innovative Feature X model, which leverages a confidence-weighted fusion voting classifier (CWFVC) employing weighted soft voting to improve student performance prediction. This study utilized weighted soft voting, termed “weighted majority voting,” to determine final scores for student responses based on their semantic neighbors.
Method
Dataset
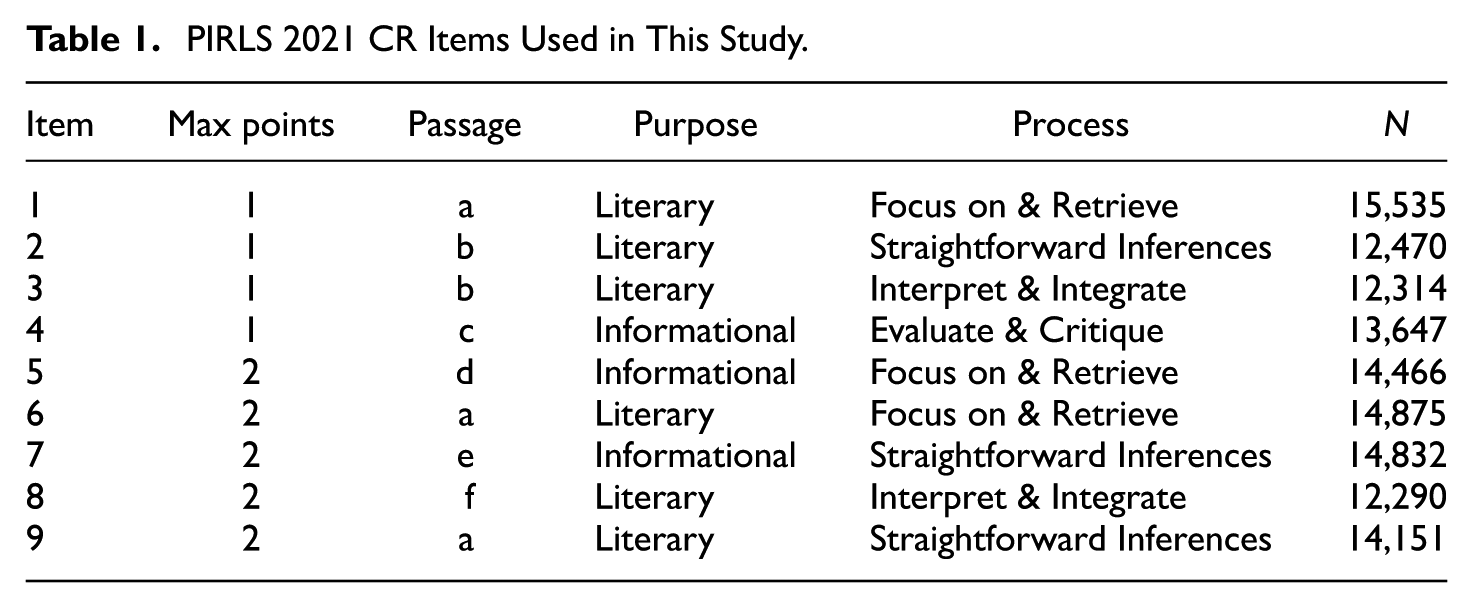
PIRLS assesses fourth-grade reading comprehension, tracking reading achievement across more than 50 countries for over two decades. Its framework centers on two main purposes of reading: for literary experience and to acquire and use information. In reading for literary experience, students engage with narrative fiction to explore events, feelings, and language. Reading to acquire and use information focuses on students’ experiences with informational texts, including scientific, historical, or social materials in authentic contexts. The assessment aligns each item with one of four cognitive processes: focus on and retrieve, make straightforward inferences, interpret and integrate, and evaluate and critique (von Davier & Kennedy, 2024). In 2021, PIRLS introduced a digital format (digitalPIRLS), enhancing student engagement through more interactive assessments (Mullis & Martin, 2019). This study analyzed nine CR items from the digitalPIRLS 2021, using multilingual responses from all 27 participating countries. Details of the CR items analyzed are provided in Table 1.
PIRLS 2021 CR Items Used in This Study.
Multilingual Response Translation
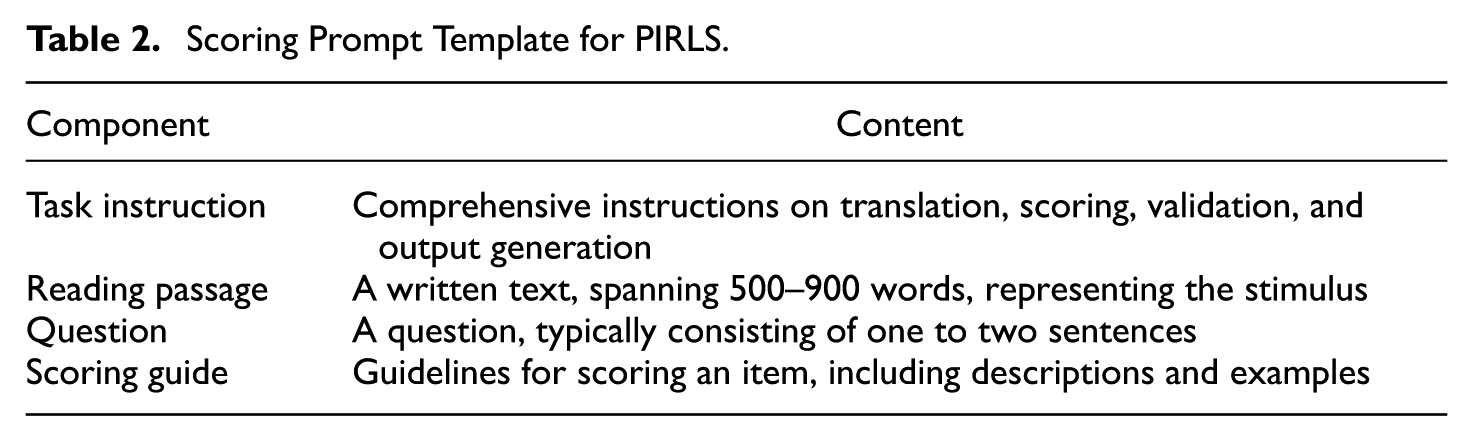
We employed a standardized scoring prompt template with GPT-4.1 to translate non-English responses into English and to correct spelling and grammatical errors in English responses. As detailed in Table 2, the prompt template comprised four essential components (Jung et al., 2025). This Zero-Shot Chain-of-Thought (Zero-Shot CoT) approach is generalizable (Kojima et al., 2022), ensuring flexible application across various assessment items for context-appropriate translations. In addition, when GPT-4.1 translated a term in some instances but left it untranslated in others, we replaced those untranslated instances with the translated version.
Scoring Prompt Template for PIRLS.
Response Flagging
Following translation, responses underwent a two-stage quality control process to identify and flag untranslated and filter out semantically meaningless responses.
Untranslated Response Flagging
Untranslated responses were identified and flagged “missing” based on two criteria, applied only to responses longer than eight characters: (a) the response was explicitly marked as “untranslatable” by GPT-4.1 during translation, or (b) the responses contained less than 75% English vocabulary. To quantify the percentage of English vocabulary, linguistic preprocessing (e.g., lower-casing, tokenization, and lemmatization) was performed using spaCy’s en_core_web_lg model in Python (3.13.4). To prevent proper nouns (e.g., “America”) from being misclassified as non-English, we used named entity recognition (NER) to ensure they were counted as valid English vocabulary.
Meaningless Response Flagging
After excluding missing responses, we flagged “meaningless” entries. These were defined as responses that were exceptionally brief and/or semantically incoherent relative to the rest of the dataset. Although these responses were automatically assigned a score of 0, they were retained in the dataset for subsequent analysis. To identify them, a composite meaningfulness score (Mi) was calculated for each response i. A response was flagged as “meaningless” if its Mi fell below a threshold of 0.30 and its Top3-CoSim (the average cosine similarity of the top three most similar responses) was less than 0.70. Cosine similarity (CoSim) measures the similarity between two vectors, ranging from 0 to 1, where a higher value indicates greater similarity (Han et al., 2012). The number of similar responses (k), a key hyperparameter, was determined as 3 following a grid search.
The composite score (Mi) combines two key metrics: median-scaled translation length (Li) and coherence score (Ci). For median-scaled length, we scaled the character length of each translated response (li) using a min-median method to minimize the effect of extremely long outliers:

The coherence score (Ci) was determined by averaging the semantic similarity between a given response and all other responses in the dataset, providing a global measure of how closely a response aligns with the overall response set. The average was used to assess semantic relatedness to the other responses, revealing that a very low coherence score indicates that a response is not only dissimilar but also out of context with the rest of the dataset:

where N represents the total number of valid responses, and sim(Ei, Ej) indicates the CoSim between the embeddings of response i and j. We generated these response embeddings using the sentence transformer model (all-MiniLM-L6-v2) in Python.
Finally, Mi was calculated as a weighted sum of these two metrics, prioritizing semantic content by weighing coherence more heavily:

Linguistic-Integrated Reliability Audit (LiRA)
We implemented LiRA to ensure consistent scoring for semantically similar responses (neighbors). Our framework estimates the reliability of the initial human score by evaluating its semantic alignment with a neighborhood of similar, human-scored responses. For each response, the three most semantically similar neighbors are retrieved. A weighted majority vote, an ensemble learning technique, is then applied to their score to assess the agreement level with the original score. This method retains the conceptual core of traditional reliability assessment: determining the degree to which a score reflects a consensus judgment. However, it shifts from scorer redundancy to semantic redundancy, leveraging similarity in meaning rather than duplication in labor. It also enables reliability to be assessed at scale, for every response, rather than for a small double-scored sample.
Similarity-Based Weighted Majority Voting
First, we generated response embeddings using the all-MiniLM-L6-v2 model in Python and calculated CoSim for all embedding pairs. For each response i, we identified the three nearest neighbors based on the highest CoSim values. We then determined the majority score s*∈{0, 1, 2} using a weighted summation, where s was the score that maximized the sum of CoSim from response i to its top three neighbors sharing the same score:

where Sis is the set of the top three neighbors to response i that were assigned a human score of s. We assigned the majority score s* only if its proportion of the total weighted score exceeded a threshold of 0.60. Otherwise, the response was flagged as “inconsistent,” indicating that human scores among similar responses were too varied to assign a single majority score. This condition is defined as:

The two key hyperparameters, the number of nearest neighbors (k) and the weight threshold (WT), were determined through a systematic grid search. This explored 28 unique combinations for k∈ {1, 2, 3, 4, 5, 10, 15} and WT∈ {0.60, 0.65, 0.70, 0.75} (Jung et al., 2025).
LiRA Application to a Mock Item
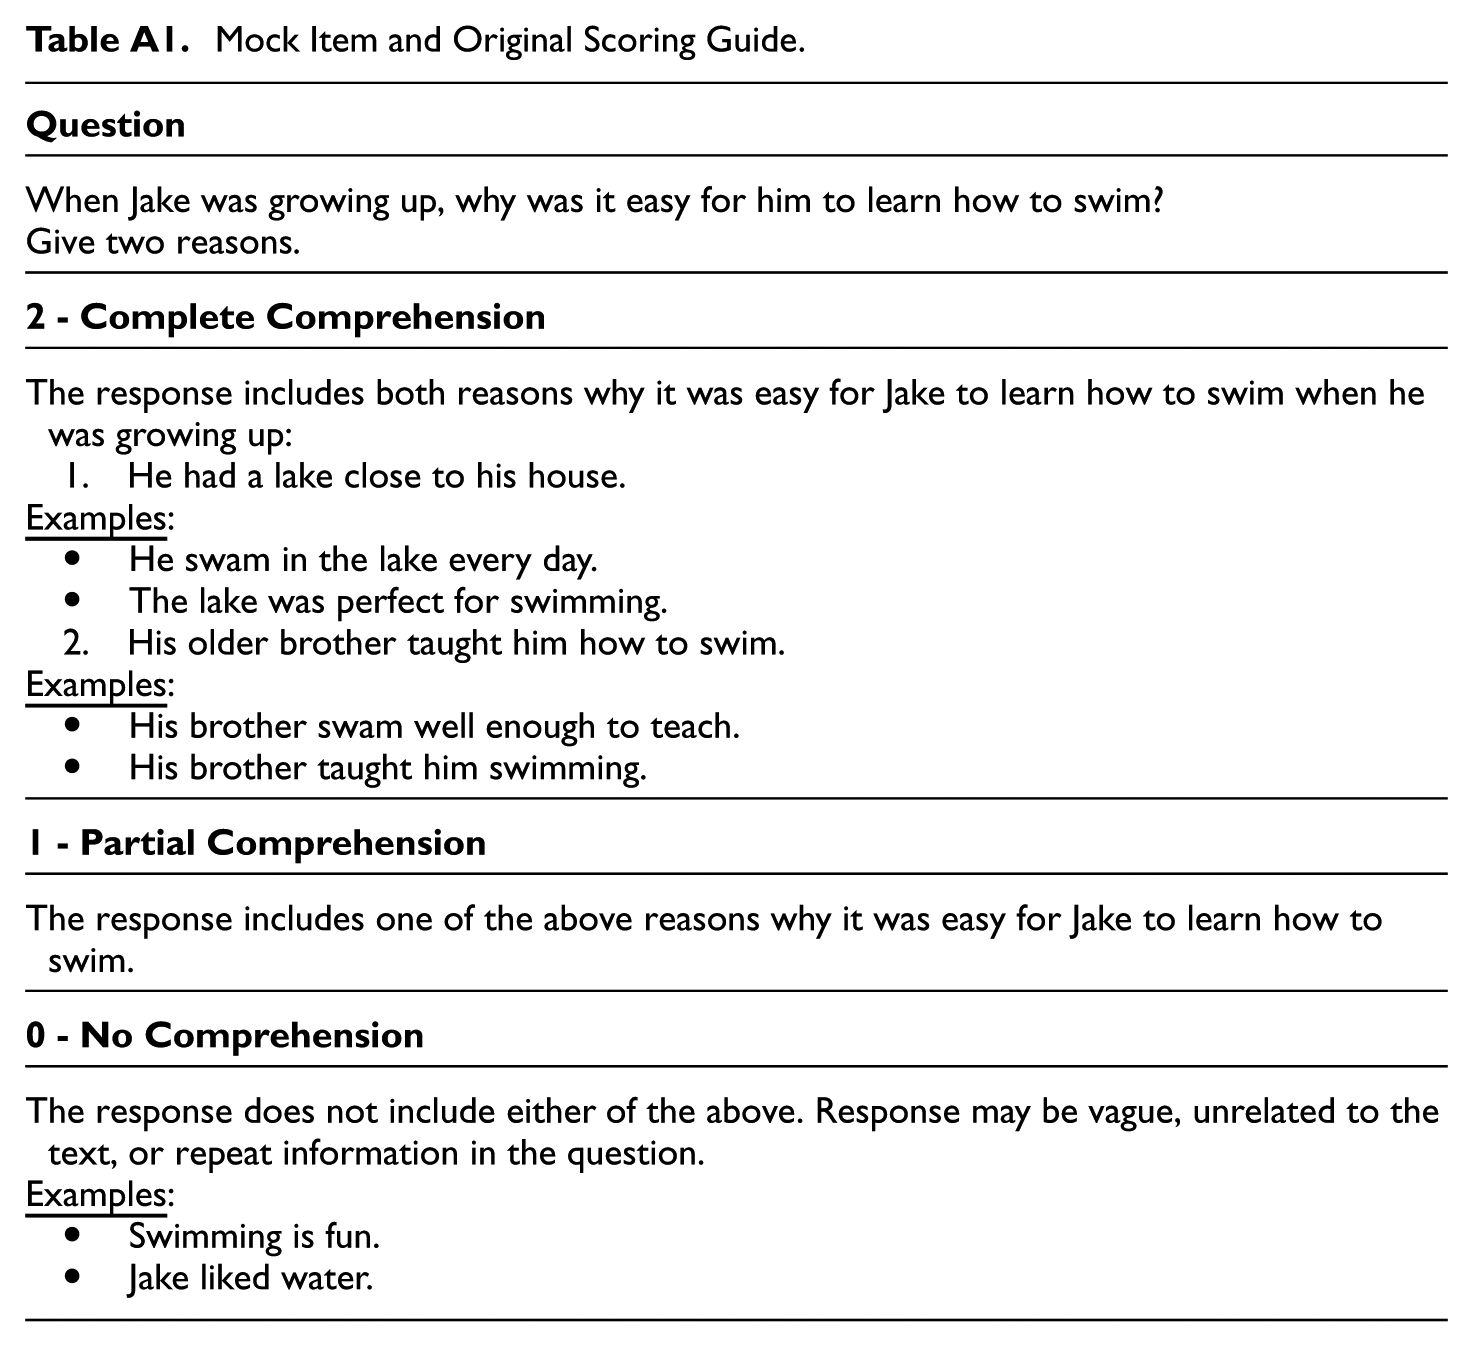
To illustrate our LiRA approach, we consider a Turkish response from a mock item (see Appendix A): “Gölde her gün yüzmeye gitti. Suyun içinde oynamak çok eğlenceliydi,” which translates to “He went swimming in the lake daily. Playing in the water was very enjoyable.” The top three neighbors for this translated response are presented in Table 3.
Cosine Similarity for Mock Item Responses.
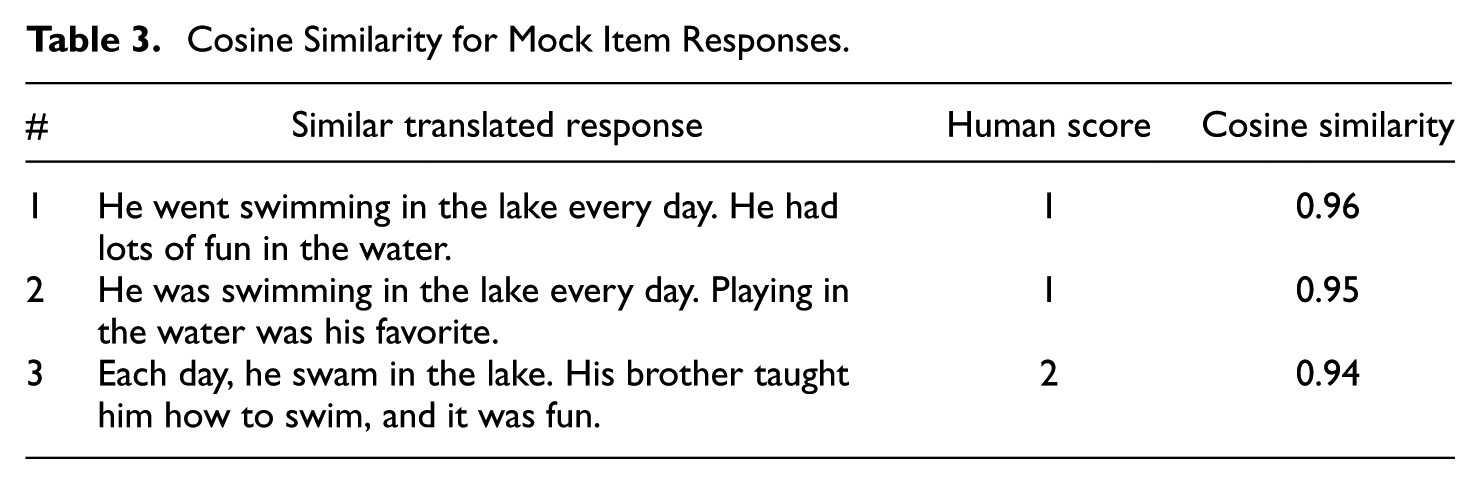
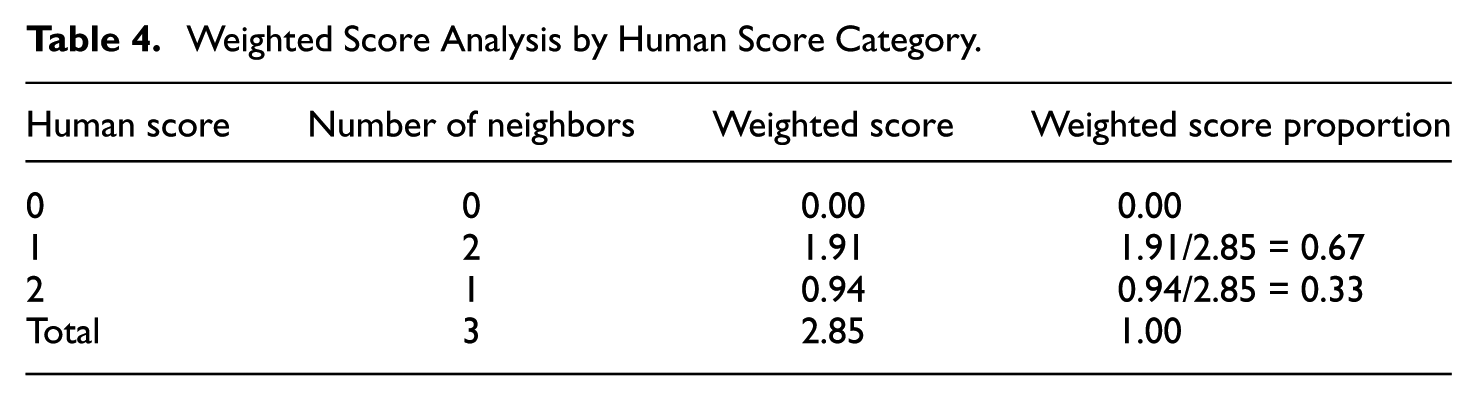
We then calculated weighted scores for each score category (see Table 4). In this example, two similar responses (Responses 1 and 2 in Table 3) received a human score of 1, and one (Response 3 in Table 3) received a human score of 2. This resulted in weighted scores (sum of CoSim per score category) of 0.96 + 0.95 = 1.91 for human score 1 and 0.94 for human score 2. Since the weighted score proportion for human score 1 was 0.67, which exceeded our threshold of 0.60, we assigned a majority score of 1 to this response.
Weighted Score Analysis by Human Score Category.
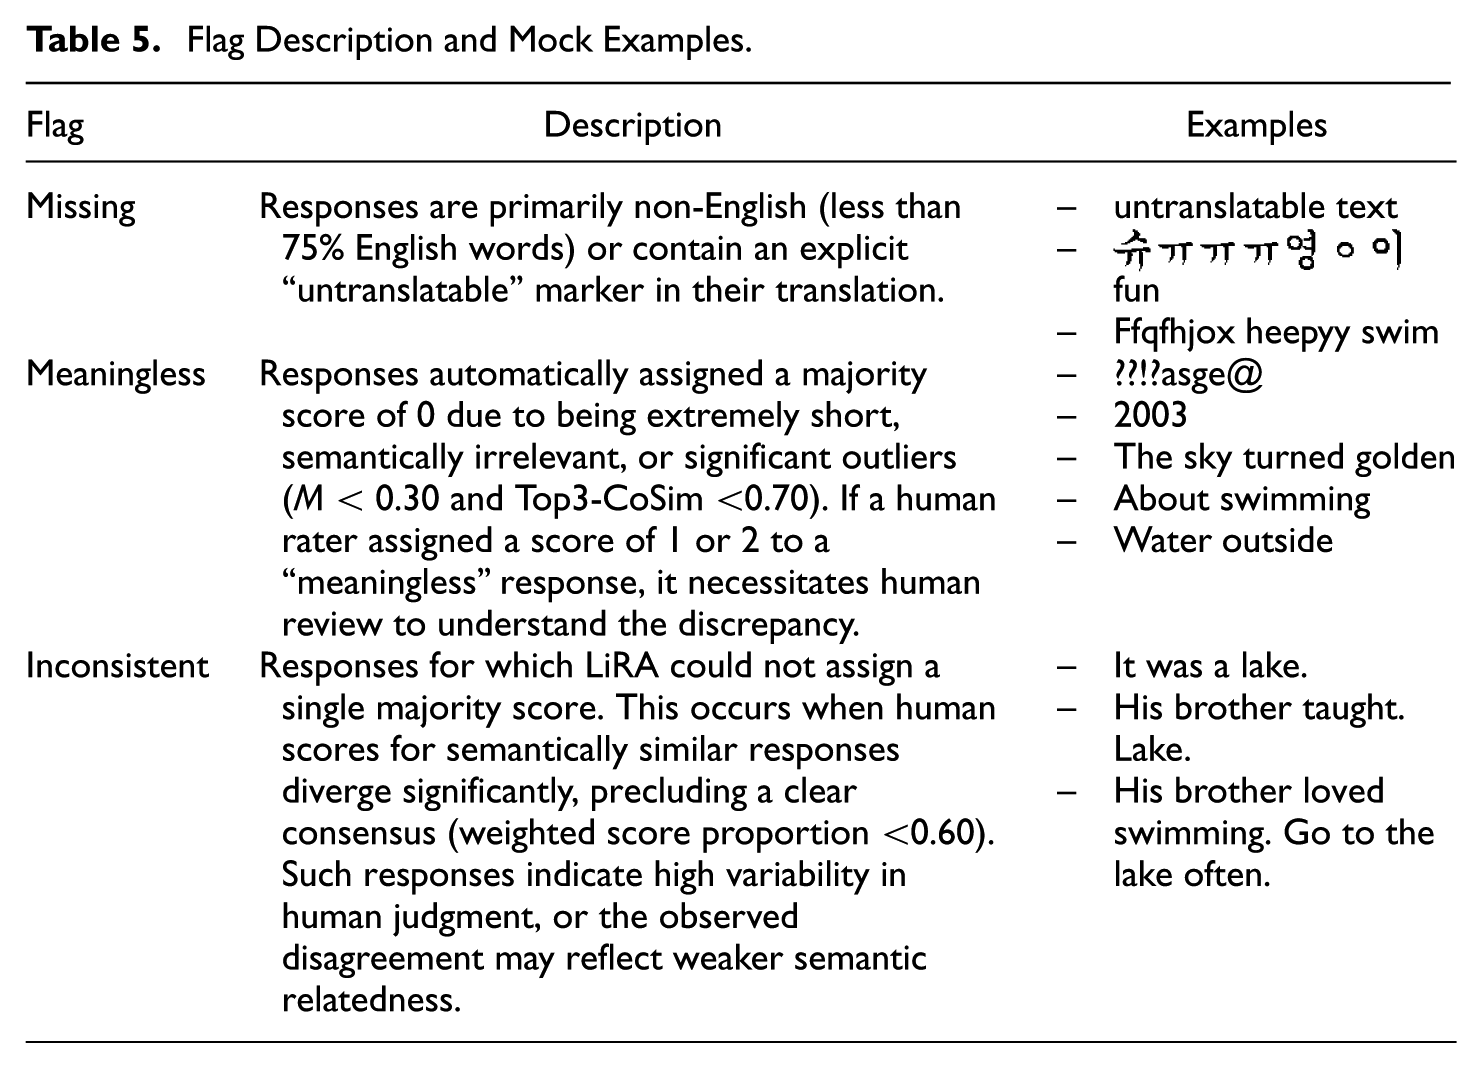
In addition, Table 5 details the flags used in LiRA, including their descriptions and illustrative examples. These response-level diagnostics are highly beneficial for human experts investigating inconsistency sources with concrete responses.
Flag Description and Mock Examples.
Evaluation Metrics
We evaluated our LiRA approach across three aspects: (a) comparability with traditional CCSR values, (b) distribution of majority scores and flags, and (c) Top3-CoSim statistics.
We first assessed LiRA’s comparability with traditional CCSR by calculating weighted exact agreement (EA) between initial human scores and LiRA’s majority scores. Weighted EA assigns greater importance to matches (where human and majority scores align) with higher CoSim, calculated as the ratio of summed average CoSim for matching responses to all valid responses. This analysis focused on valid responses only, excluding those flagged as “missing.” We computed weighted EA both across countries and by country to identify scoring patterns deviating from overall trends.
Next, we examined the distribution of LiRA’s majority scores (0, 1, and 2) and proportions of “missing” and “inconsistent” flagged responses. We also calculated the percentage of responses flagged as “meaningless” within the human score 0 category to evaluate our meaningless detection algorithm’s accuracy.
Finally, we examined CoSim statistics to assess how effectively our STS measurement captured similar neighbors. Our key metric was Top3-CoSim (the average cosine similarity of the top three most similar responses) for each response. To summarize these values, we considered their central tendency (mean and median Top3-CoSim across responses), their between-response variability (the overall spread of Top3-CoSim across responses), and within-response consistency (the average dispersion of CoSim within each response, showing how tightly its nearest neighbors cluster).
Results
Comparability With Traditional CCSR
Table 6 illustrates the robust performance of LiRA and its close alignment with traditional CCSR metrics. For the five items where CCSR values were available (Items 1, 3, 4, 6, and 9), LiRA’s weighted EA closely matched the corresponding CCSR values. This alignment is particularly noteworthy given that LiRA utilized the entire dataset (typically n = 12,000–15,000 per item) for more comprehensive estimates. In contrast, CCSR relied on a much smaller sample size (n = 200 per item). In addition, for Item 2, LiRA even achieved approximately 5% higher agreement with initial human scoring than CCSR. This suggests that LiRA produced second scores more consistent with initial human scoring. Crucially, both methods identified a significant scoring issue with Item 9, which exhibited remarkably low reliability, with 76.8% for CCSR and 75.6% for weighted EA. LiRA further demonstrated its scalability by providing high-weighted EAs for items where CCSR values were unavailable (Items 5, 7, and 8), ranging from 86.2% to 95.8%.
Comparison of Traditional CCSR and LiRA Weighted Exact Agreement (%).
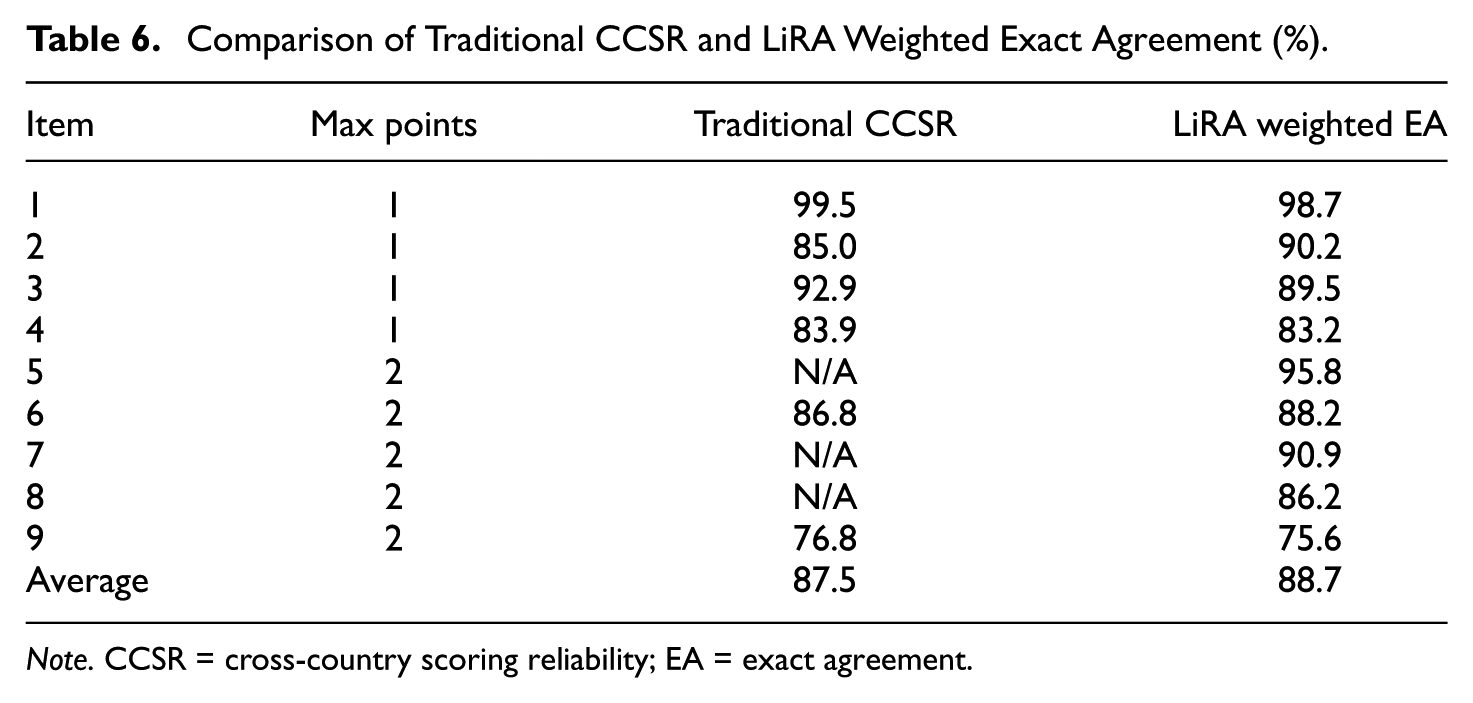
Note. CCSR = cross-country scoring reliability; EA = exact agreement.
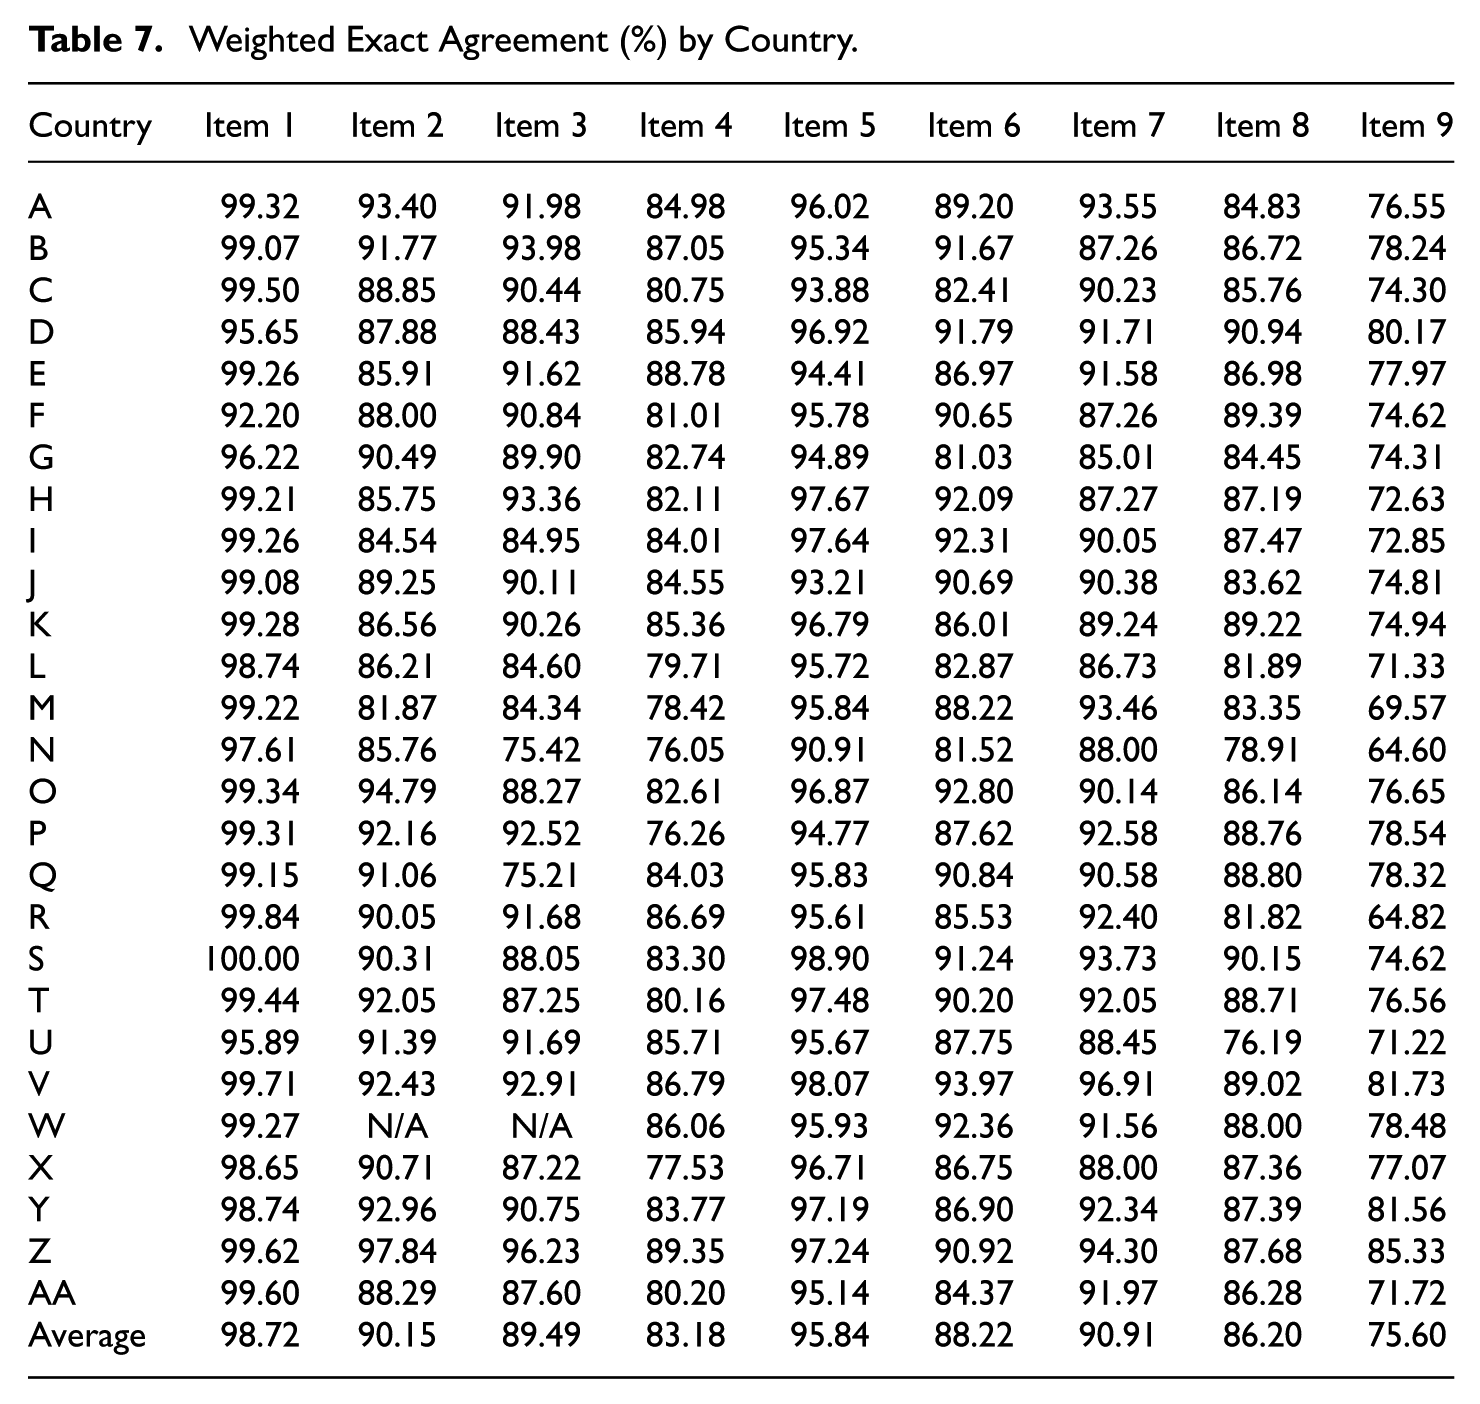
Table 7 presents the weighted EA achieved by LiRA across 27 countries for all nine CR items. This country-level breakdown enables a more detailed assessment of scoring reliability at both the item and country levels. The median weighted EA exceeded 85% for most items, indicating high scoring reliability across countries. However, notable variations in reliability emerged across both items and countries. Item 4, which requires the highest-order cognitive processes (i.e., evaluate and critique), exhibited notable cross-country variability in weighted EA, ranging from 76.1% to 89.4%. Even more pronounced challenges were observed with Item 9, consistent with its problematic CCSR of 76.8% and average weighted EA of 75.6%. Item 9 showed the highest cross-country variability (64.6%–85.3%), with more than half of the countries (14 out of 27) reporting weighted EAs below 75%. These results indicate persistent difficulties in achieving adequate scoring reliability for this specific item. Despite these item-specific disparities, a subset of countries (e.g., Countries V and Z) consistently demonstrated high reliability across most items.
Weighted Exact Agreement (%) by Country.
Distribution of Majority Scores and Flags
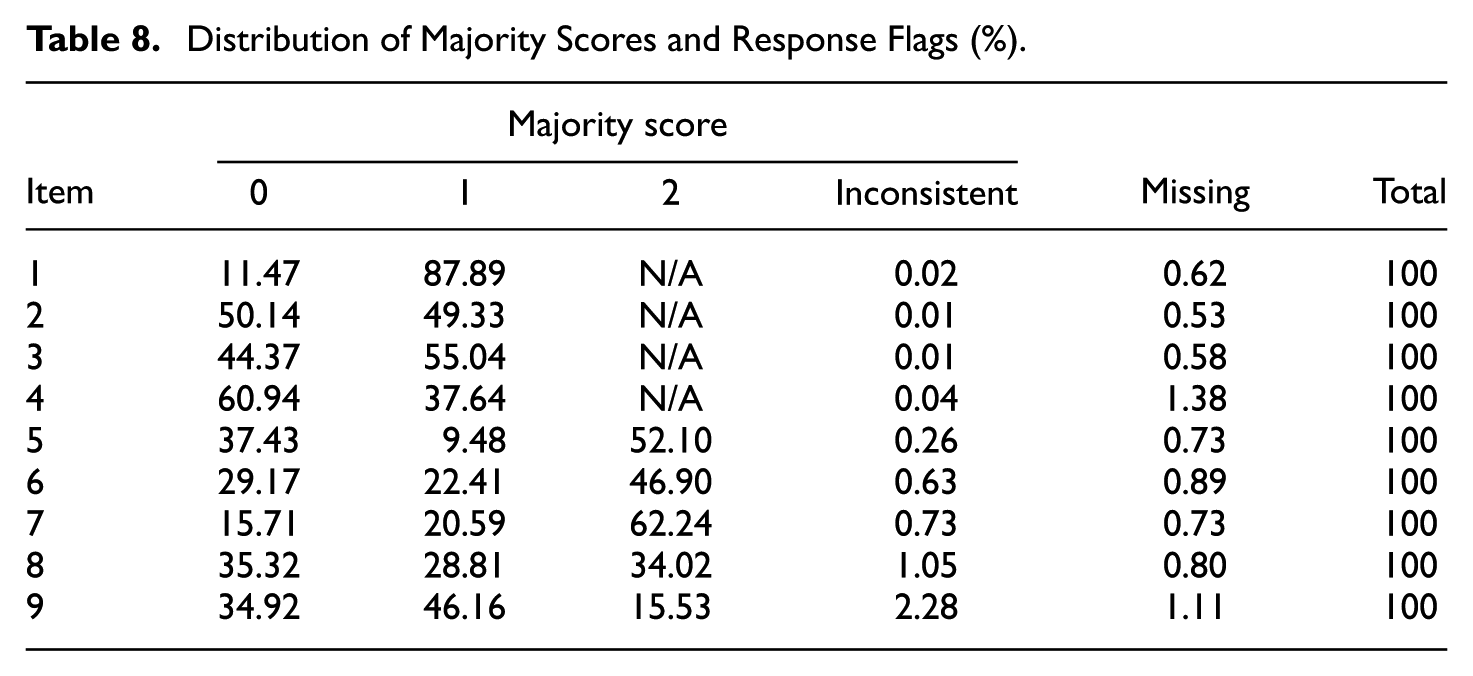
Table 8 details the distribution of majority scores (0, 1, and 2) and response flags (“inconsistent” and “missing”). LiRA successfully assigned the majority of scores to over 98% of all responses across items. Both “inconsistent” (0.01%–2.28%) and “missing” (0.53%–1.38%) flags were rare. Also, Items 4 and 9, which had lower CCSR and weighted EA, showed the highest flag rates: 1.38% “missing” for Item 4 and 2.28% “inconsistent” for Item 9. These elevated flag rates align with their challenging scoring nature. Overall, the results show that LiRA effectively scored most responses, identifying potential response-level issues for expert review.
Distribution of Majority Scores and Response Flags (%).
Moreover, the meaningless detection algorithm was found to be effective (see Figure 1), as nearly all flagged responses received a human score of 0. This indicates its strong capability to detect extremely brief, irrelevant, or off-topic responses. Interestingly, 93 meaningless responses for Item 4 (0.68% of 13,647 total) received a human score of 1; this finding is further examined in the Discussion section. Item 9 was the only item that had one meaningless response with a human score of 2.
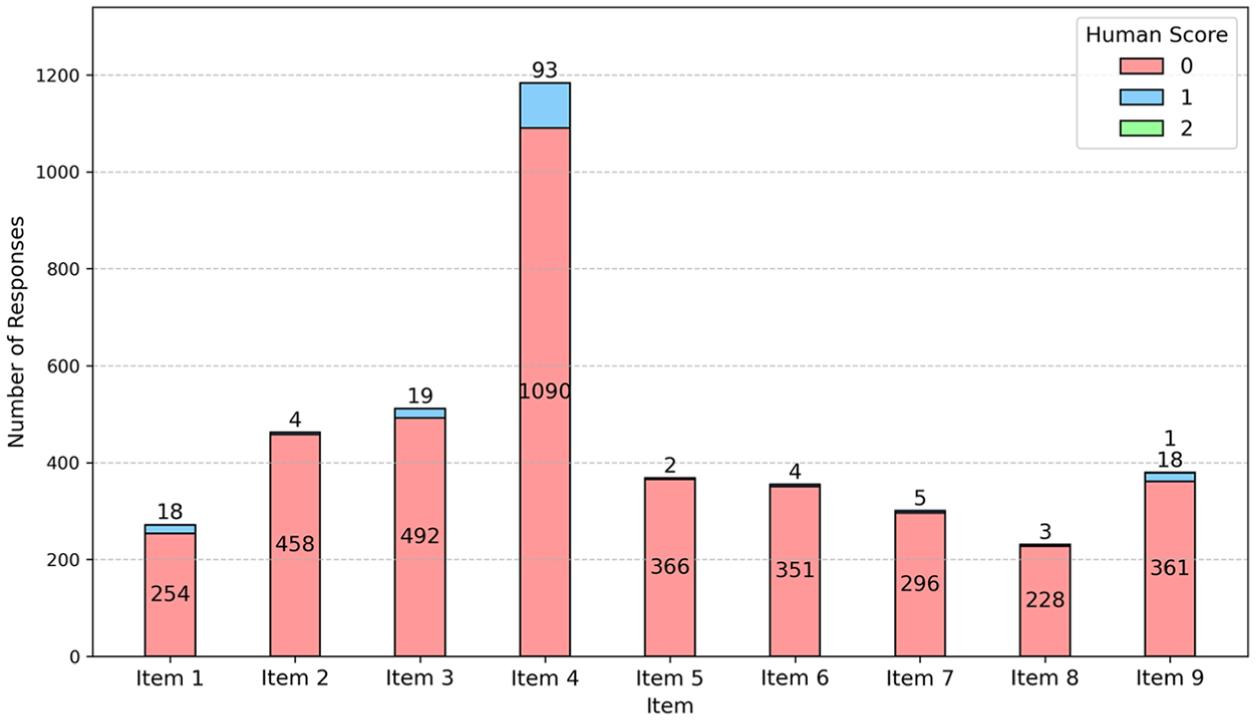
Human Score Distribution of Meaningless Responses.
Figure 2 illustrates the high accuracy of our missing response detection algorithm. The majority of responses flagged as “missing” corresponded to a human score of 0, validating the algorithm’s performance. We observed only a minimal deviation in Item 1; 17 responses flagged as missing (0.11% of 15,535) received a human score of 1, indicating a slight divergence between algorithmic detection and human assessment. This discrepancy is addressed in the Discussion section.
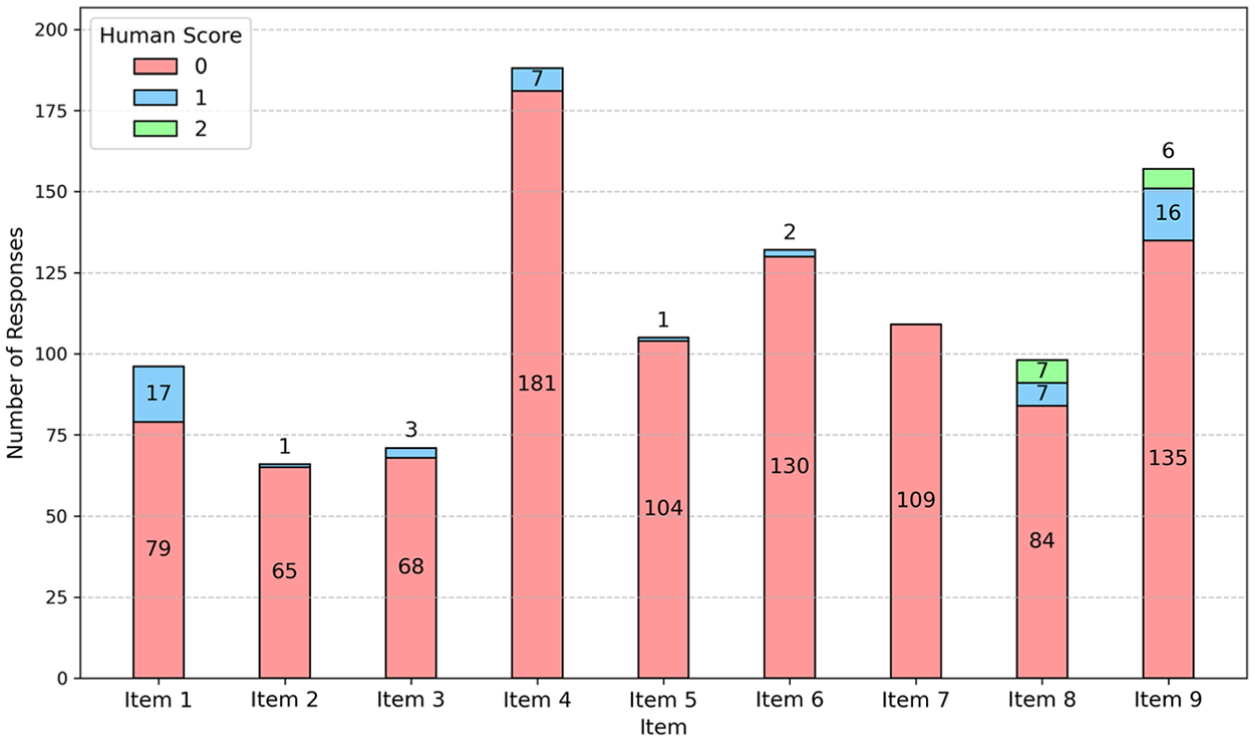
Human Score Distribution of Untranslated (Missing) Responses.
Semantic Text Similarity Statistics
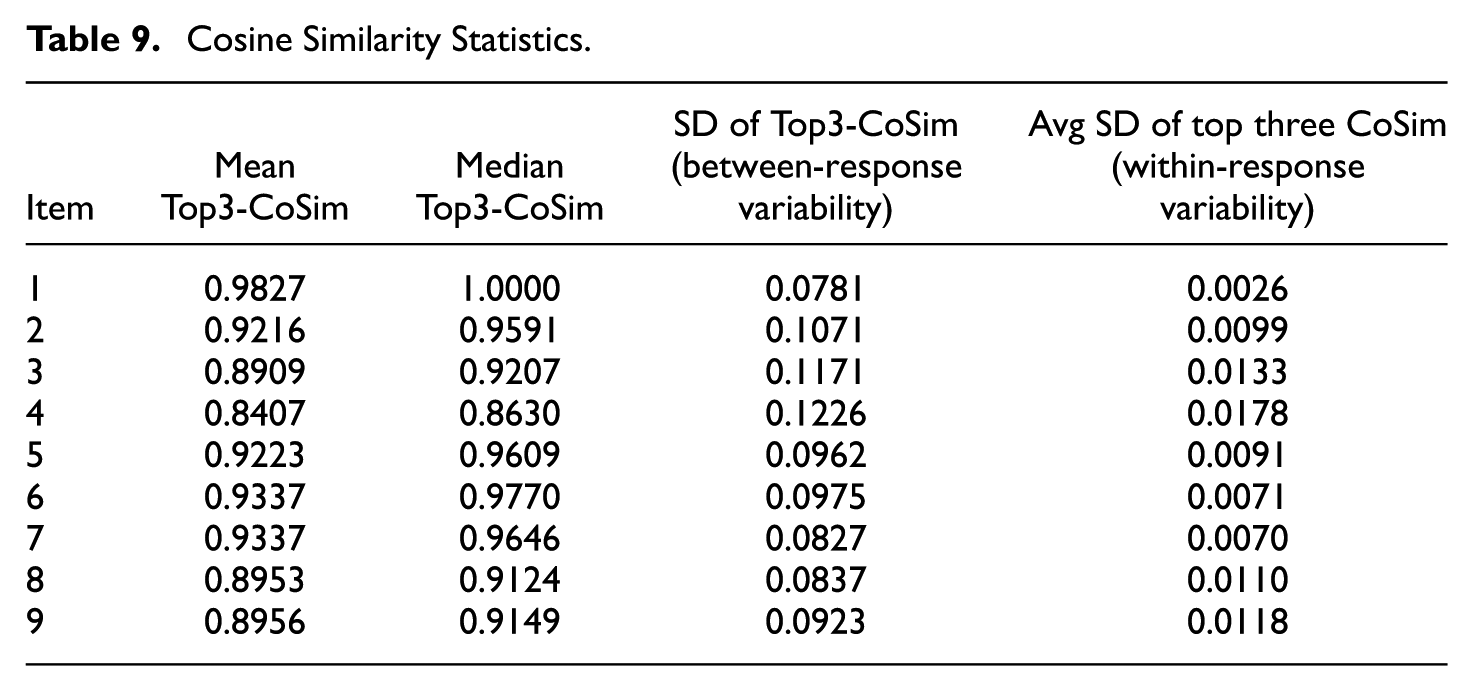
Table 9 presents STS statistics for the Top3-CoSim per response. LiRA consistently identified coherent neighbors across all responses, exhibiting minimal semantic variability (see Appendix B for plots): mean and median Top3-CoSim values were high (typically above 0.90), with very low standard deviations (SDs). The low average SD of the top three CoSim values within responses further demonstrates that these three neighbors for each response tend to form tight semantic clusters. Item 4, however, displayed relatively lower mean (0.8407) and median (0.8630) CoSim values, coupled with the highest SD of 0.1226. This pattern reflects greater semantic diversity among Item 4 responses, consistent with its recognized scoring complexities in other metrics.
Cosine Similarity Statistics.
Discussion
Interpretation of LiRA’s Performance
This study demonstrates that LiRA provides an effective and innovative solution for measuring scoring reliability in large-scale, multilingual contexts. Unlike conventional CCSR, which depends on double-scoring small and unrepresentative samples, LiRA uses only initial human scores and applies similarity-based weighted majority voting. This approach addresses long-standing methodological concerns with double scoring reported in previous studies (e.g., Song & Lee, 2022; Wiggins, 1990) and marks a significant advance in reliability assessment. Moreover, by embedding reliability estimation within a semantic retrieval framework, LiRA supports additional use cases such as uncertainty flagging and anomaly detection, and allows for human-in-the-loop reevaluation.
The innovation of LiRA lies in its ability to automatically generate consistent “second scores” while preserving the fundamental concept of traditional reliability. It identifies semantic neighborhoods among responses from initial human scoring and subsequently applies weighted majority voting. This mechanism evaluates similarity on a continuous scale (CoSim, ranging from 0 to 1), assigning greater weight to highly similar neighbors. Consequently, LiRA can ascertain the most suitable score by considering semantic differences with enhanced granularity, a feature critical for scoring written responses. Moreover, LiRA draws on the entire dataset of initial scores for reliability estimation, providing a comprehensive analysis that overcomes the logistic limitations of subset-based CCSR approaches. This holistic approach not only yields reliability estimates comparable to, or even surpassing, established CCSR metrics but also enables more thorough and systematic evaluations of human scoring practices across all CR items and countries.
Despite LiRA’s impressive performance, the results also revealed item-specific challenges. For example, Item 4 proved particularly difficult to score, as evidenced by its lower CCSR (83.9%) and average weighted EA (83.2%). This difficulty appears closely related to its design as an “evaluate and critique” item. According to Mullis and Martin (2019), such items require students to make justified judgments about text content, structure, and language. Prior studies (Cook & Myers, 2004; Güler, 2014; Polat, 2020) have found that reliably assessing higher cognitive skills like evaluative reasoning or critical thinking is inherently challenging. This difficulty partly arises from the complex semantic judgments human raters engage in, which can lead to bias and variability in interpreting and scoring diverse possible responses.
Specifically, Item 4’s scoring guide accepted two distinct key ideas in correct answers and allowed a wide range of expressions for these concepts. Scoring was further complicated by subtle nuances that distinguished correct from seemingly similar, but incorrect, responses. For example, phrases like “they have to hunt alone,”“be self-reliant and strong,” and “need to be more independent and find food” were awarded credit. In contrast, similar responses such as “they need to live their own life” or “have to manage alone” did not earn credit, due to nuanced distinctions. This highly nuanced scoring, along with syntactic and lexical diversity among correct responses, contributed to notable scoring inconsistencies across countries (weighted EA ranging from 76.1% to 89.4%) and resulted in the lowest mean Top3-CoSim (0.8407). Item 4’s scoring challenges were also reflected in its flagging rates: 93 meaningless responses received a human score of 1. Review of these cases showed they were often borderline responses subject to rater interpretation, or correct responses expressed with different wording from the remaining dataset. This suggests that the meaningless detection threshold warrants further examination and potential adjustment, possibly lowering it below 0.30. Future work should involve a grid search incorporating more “evaluate and critique” type items to enhance generalizability to such item categories, and consider different thresholds based on item cognitive processes. Furthermore, while the key hyperparameters (k and WT) were optimized using the large-scale PILRS dataset, fully deploying LiRA requires a grid search to validate their transferability to diverse data contexts, such as smaller or domain-specific datasets.
Item 9 emerged as the most challenging to score, as indicated by its low CCSR (76.8%) and the lowest average weighted EA of 75.6%. This item required students to infer two characteristics from an informational text, with the scoring guide permitting eight possible answers. This broad scope rendered Item 9 highly open-ended, as each characteristic could be expressed in various forms, from brief phrases to detailed inferences described in long sentences. High open-endedness is known to adversely affect scoring reliability (McCaffrey et al., 2022; Wolfe et al., 2016; Zhai et al., 2021), a pattern reflected in Item 9’s substantial cross-country variability (weighted EA ranging from 64.6% to 85.3%) and the highest inconsistency flag rate (2.28%). In addition, research has shown that greater variation in text features such as length, lexical diversity, and syntactic variety further increases scoring variability due to their impact on rater judgments (Palermo, 2022; Wolfe et al., 2016). The cognitive demand of Item 9, which required “straightforward inferences,” also heightened these challenges. Inference-based items that allow a wide range of valid concepts elevate cognitive demands on human raters, introducing greater interpretive variability and reducing scoring reliability (Leacock et al., 2013).
Interestingly, Item 1 showed that 17 responses (0.11% of 15,535 total) flagged as “missing” received a human score of 1, suggesting the presence of scorable content. These flagged responses contained significant misspellings or various spelling errors, often from less-resourced languages. Consistent with prior research (Robinson et al., 2023; Yan et al., 2024), translation and spelling issues from large language models (LLMs) were commonly observed in medium- to low-resource languages. These findings indicate the need for human review of flagged responses with human scores of 1 or 2. However, given their extreme rarity (0.11% of the dataset), this is expected to impose minimal operational burden on human-in-the-loop processes. Encouragingly, recent studies indicate that LLMs and transformer-based approaches can significantly improve translation and spelling correction in less-resourced languages, potentially reducing such errors in future LLM applications (Luitel et al., 2024; Turhan, 2025; Zhong et al., 2024).
Limitations and Future Research
This study has several limitations. First, all findings are based on translated responses that were generated and validated using GPT-4.1. Although LiRA’s flagging algorithms for “meaningless” and “missing” responses were generally effective, certain anomalies were observed, particularly with less-resourced languages with a variety of spelling errors. While such cases were infrequent, they underscore LiRA’s reliance on the translation quality of GPT models. Future work could explore an ensemble learning approach that utilizes multiple state-of-the-art LLMs (e.g., GPT 5 series, Claude 4.5, or Gemini models) to select the most suitable translation, particularly for less-resourced languages. In addition, we can consider the use of modern multilingual encoders, including gemini-embedding-001, Qwen3-Embedding-8B, or Language-agnostic BERT (LaBSE) (Boizard et al., 2025; Feng et al., 2020; Nielsen et al., 2024), which can directly encode responses in multiple languages, potentially eliminating the need for English translation.
Second, while this study provided a qualitative overview of item-specific challenges, future research should adopt more systematic approaches to investigating these issues. For example, automated clustering of semantically similar responses could uncover patterns within or across countries/languages for specific items. Recent studies have shown that LLMs can facilitate high-quality, interpretable clusters while reducing computational complexity and manual effort (Huang & He, 2024; Miller & Alexander, 2025). Identifying such response patterns could help human content experts better understand sources of scoring deviations and address scoring inconsistencies more effectively.
Finally, this study computed STS using CoSim, a standard and widely adopted approach. For future work, we suggest exploring modern deep learning based methods, such as BERTScore (Zhang et al., 2019), SimCSE (Gao et al., 2021), or Word and sentence Structure Mover’s Distance (WSMD) (Yamagiwa et al., 2022). These advanced techniques move beyond simple vector angles by considering contextual embeddings and token-level interactions, enabling the capture of deeper semantic nuances. Integrating one of these methods could thus enhance LiRA’s performance in evaluating semantic alignment with neighbors.
Conclusion
This study highlights LiRA as a robust, scalable, and resource-efficient solution for measuring scoring reliability in ILSAs like PIRLS. Employing similarity-based weighted majority voting, LiRA addresses traditional CCSR’s practical and methodological shortcomings, all while maintaining the essential role of initial human scoring. With its integrated flagging algorithms, LiRA provides detailed diagnostics at the response, item, and country/language levels. These features position LiRA as a valuable tool for reliability assessment in ILSAs, delivering granular insights into national scoring processes and aiding data quality and reporting enhancement.
Footnotes
Appendix
Mock Item and Original Scoring Guide.
|
|
| When Jake was growing up, why was it easy for him to learn how to swim? Give two reasons. |
|
|
| The response includes both reasons why it was easy for Jake to learn how to swim when he was growing up: 1. He had a lake close to his house. • He swam in the lake every day. • The lake was perfect for swimming. 2. His older brother taught him how to swim. • His brother swam well enough to teach. • His brother taught him swimming. |
|
|
| The response includes one of the above reasons why it was easy for Jake to learn how to swim. |
|
|
| The response does not include either of the above. Response may be vague, unrelated to the text, or repeat information in the question. • Swimming is fun. • Jake liked water. |
Authors’ Note
This research adheres to the General Data Protection Regulation (GDPR) and uses data from the Progress in International Reading Literacy Study (PIRLS). The original data were collected under the governance of the International Association for the Evaluation of Educational Achievement (IEA) and the TIMSS & PIRLS International Study Center. Parental or guardian permission was obtained for student participation, and strict procedures for confidentiality and data protection were implemented. The resulting datasets were anonymized and made accessible exclusively for research purposes.
Declaration of Conflicting Interests
The authors declared no potential conflicts of interest with respect to the research, authorship, and/or publication of this article.
Funding
The authors received no financial support for the research, authorship, and/or publication of this article.