
Abstract
An important task in clinical neuropsychology is to evaluate whether scores obtained on a test battery, such as the Wechsler Adult Intelligence Scale Fourth Edition (WAIS-IV), can be considered “credible” or “valid” for a particular patient. Such evaluations are typically made based on responses to performance validity tests (PVTs). As a complement to PVTs, we propose that WAIS-IV profiles also be evaluated using a residual-based M-distance (
Introduction
Approximately 500,000 neuropsychological examinations are administered each year in the United States (Bilder & Reise, 2019), with the Wechsler Adult Intelligence Scale Fourth Edition (WAIS-IV; Wechsler, 2008a) being one of the most widely used (Camara et al., 2000; Rabin et al., 2005) and well-validated (e.g., Bowdenet al., 2011; Climie & Rostad, 2011; Nelson et al., 2013) tests to examine both general and specific cognitive abilities in adults.
In recognition of the multiple biases that can potentially vitiate the interpretation of a WAIS-IV (e.g., response bias, malingering, inattention, lack of effort), a central task for a clinical neuropsychologist is to judge, for a particular patient, whether a protocol provides a credible, interpretable, or otherwise “valid” measure of the assumed underlying cognitive abilities. By far, the dominant approach to making such judgments relies on performance validity tests (PVTs; Lippa, 2017; Rickards et al., 2018). Thus, prior to introducing our model-based person fit approach to evaluating the interpretability of WAIS-IV profiles, we first review PVTs and several other indicators of response aberrancy.
PVTs and the Evaluation of WAIS-IV Protocols
Sweet et al. (2021) noted, “In order to provide bases for diagnoses and interpretations, the current consensus is that all clinical and forensic evaluations must proactively address the degree to which results of neuropsychological and psychological testing are valid” (p. 1053). Heilbronner et al. (2009) define an invalid test as those that “(1) are not fully explained by brain dysfunction, (2) are not reasonably attributable to variables that may in some instances moderate (e.g., education, age) or may in some instances confound (e.g., fatigue, psychological conditions) performances on ability tests, and (3) are significantly worse than, or at least different in degree or pattern from, performance known to reflect genuine brain-based disturbances in neuropsychological abilities” (p. 1100).
Accordingly, over the last 30 years, considerable research has been dedicated to the development and evaluation of PVTs (Larrabee, 2012; Leonhard, 2023; Lippa, 2017; Sweet et al., 2021). Although PVTs were used historically for the detection of malingering (Leonhard & Leonhard, 2024), response bias, or poor effort (Jasinski et al., 2011), recent formulations describe PVTs as providing methods to judge whether the entire neuropsychological examination is credible, trustworthy, or, as most commonly stated, a valid reflection of cognitive abilities (Greher & Wodushek, 2017).
The two major classes of PVTs are stand-alone (tests developed to assess validity without an intention to measure abilities on other neuropsychological constructs), and embedded (tests designed to test Neuropsychology abilities, but then usually cross-validated with respect to other PVTs to identify scores so low that these are not credible). An example of a stand-alone PVT is The Test of Memory Malingering (TOMM; Tombaugh & Tombaugh, 1996), where each item is presented in forced-choice format, and the respondent is asked to identify which of two stimuli was previously presented. Responses are compared to chance level (50%) or norms for various clinical conditions (Martin et al., 2020). An example of an embedded PVT is the Reliable Digit Span (RDS), which is based on responses to the WAIS-IV Digit Span (DS) subtest (Jasinski et al., 2011). The RDS is the longest number of digits forward in which both trials of that length were correct, and the longest number of digits backward in which both trials of that length were correct. RDS scores less than 6 or 7 are common cutoff values for determining validity (Zenisek et al., 2016). The key idea for either the TOMM or RDS is that poor performance may not simply reflect cognitive deficits, but rather other behaviors or conditions that invalidate the test score or protocol.
Discrepancy Analysis and the Mahalanobis Distance on the WAIS-IV
PVTs were originally designed to detect test performance so uncommonly poor that it calls into question the validity of the neuropsychological evaluation and the subsequent validity of clinical conclusions. PVTs serve as broad indicators and are not directly linked to the psychometric model that underpins and supports the interpretation of specific cognitive measures. As a complement to PVTs, to identify unusual and potentially uninterpretable profiles on the WAIS-IV, we propose the application of a model-based person fit statistic called the residual distance for an individual (
To understand the logic of a model-based person fit approach to identifying aberrant WAIS-IV profiles and how it differs from other traditional methods, we need to establish some context. First, the WAIS-IV contains 10 core subtests that assess specific cognitive abilities (see Figure 1). The 10 core subtests are typically aggregated into four “index scores” reflecting Verbal Comprehension (VC: Similarities [SI], Vocabulary [VO], Information [IN]), Perceptual Reasoning (PR: Block Design [BD], Matrix Reasoning [MR], Visual Puzzles [VP]), Working Memory (WM: DS, Arithmetic [AR]), and Processing Speed (PS: Symbol Search [SS], Coding [CD]). Subtests measuring the same index construct (factor) are highly correlated, and the four index scores tend to be moderately correlated, which suggests the presence of a general cognitive factor.
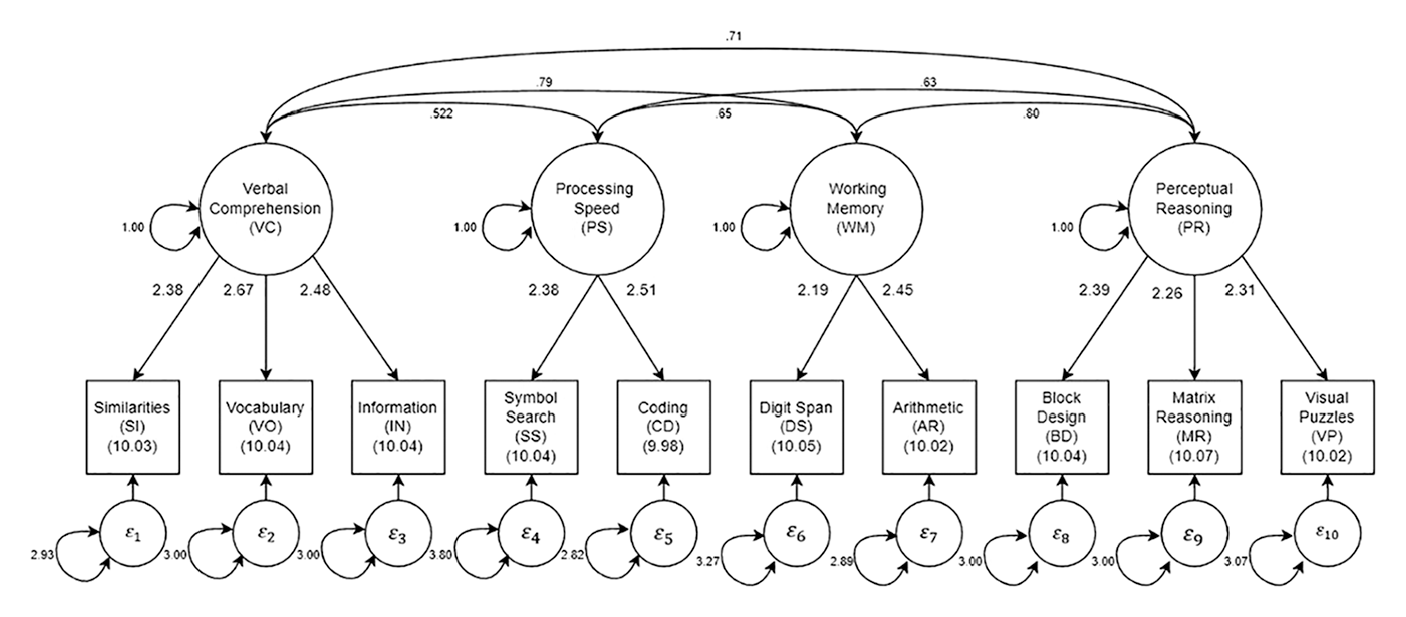
Parameter estimates for the four correlated factor solution in the standardization sample.
It is important to note that the suggested order of test administration (BD, SI, DS, MR, VO, AR, SS, VP, IN, and CD) places potential time gaps between the subtests in a factor during which attentional or other state fluctuations could reasonably be expected to occur. For example, the gap may be 10 to 15 min between Similarities and Vocabulary, and then another 15 to 20 min before Information. Similarly, the gap between AR and DS can also be quite long. Importantly, it is not always the case that the practitioner administers tests in the recommended order, and it is sometimes the case that the practitioner may insert other tests into the sequence.
Second, given this well-accepted structure, it is reasonable to assume that a patient responding according to the model of cognitive abilities underlying the WAIS-IV should have subscale scores within each index dimension that are relatively consistent, and, to a lesser extent, subscale scores that are consistent across cognitive factors. When subtest or index scores display large discrepancies, this may reflect a unique configuration of cognitive abilities or may reflect a faulty, possibly uninterpretable protocol. In the original form of the WAIS (Wechsler–Bellevue), it was suggested that differences in scores of more than two are considered significant and may suggest an aberrant response profile (Wechsler, 1941).
There is a long history of examining such subscale or index score discrepancies on WAIS instruments (e.g., Glass et al., 2010; Silverstein, 1982). For example, a clinician can evaluate the statistical significance of differences between the WAIS-IV Index Scores, pairs of individual subtest scores, a single subtest score, and the average of subtest scores, and inter-subtest scatter, which is defined as the difference between the highest and lowest subtest scaled scores. 1
Such discrepancy score analyses yield numerous, often unreliable comparisons (Glass et al., 2010) and are mainly used for profile analyses and diagnosis—the analyses of cognitive strengths and weaknesses—rather than as a direct index of a patient’s WAIS-IV profile interpretability or validity. However, as Huba (1985) pointed out, in the spirit of “less is more,” it is easy to develop a single overall index of how “unusual or unique” (p. 322) the pattern of scores is across multiple variables. Such an index may be of more value in identifying potentially uninterpretable profiles. Specifically, a Mahalanobis distance (MD; see Appendix) can be calculated as:
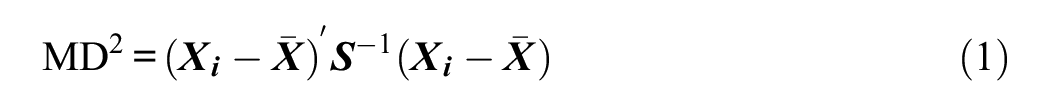
where
Drawing on Huba’s work, Crawford et al. (2012) used an MD index to estimate the atypicality of a profile based on the four WAIS-IV index scores. More relevant to the present investigation, Crawford and Allan (1994) and Burgess (1991) developed MD measures for the 10 WAIS-IV subtests, rather than the 4 index scores. Relatedly, Elfadaly et al. (2016) provided technical treatment and an updated estimator of the MD. Regardless of estimation method, the purpose remains the same, namely, to identify a profile of subtest scores that is unusual given an assumed profile of normative and valid responding.
Given this background, we note that the
By contrast, in a model-based person fit approach, an individual’s response pattern is compared to an expected response pattern based on estimated factor scores that are derived from a well-fitting structural equation model (SEM). In model-based person fit using
Model-Based Person Fit: Developing a Comparison Model for the WAIS-IV
Model-based person fit statistics such as
The estimated comparison model for this study is an SEM with 4 correlated factors for the 10 WAIS-IV subtests based on standardization sample data (N = 2,200; Wechsler, 2008a). Descriptive statistics for this sample are provided in the WAIS-IV manual. The four factors and their respective indicators, as well as the estimated parameters, are shown in Table 1 and Figure 1. Previously, we reported on extensive confirmatory factor analyses of the WAIS-IV as well as several other neuropsychological measures (Bilder et al., 2023). In those analyses, both standardization and clinical samples were evaluated, and a second-order factor model (general cognitive function and four primary factors) was judged to have the best statistical fit to the WAIS-IV. Nevertheless, we now consider only a model with four correlated factors, which is a less constrained version of the second-order model.
Results of Confirmatory Factor Analysis of 10 Core Subtests of the WAIS-IV in the Standardization Sample.
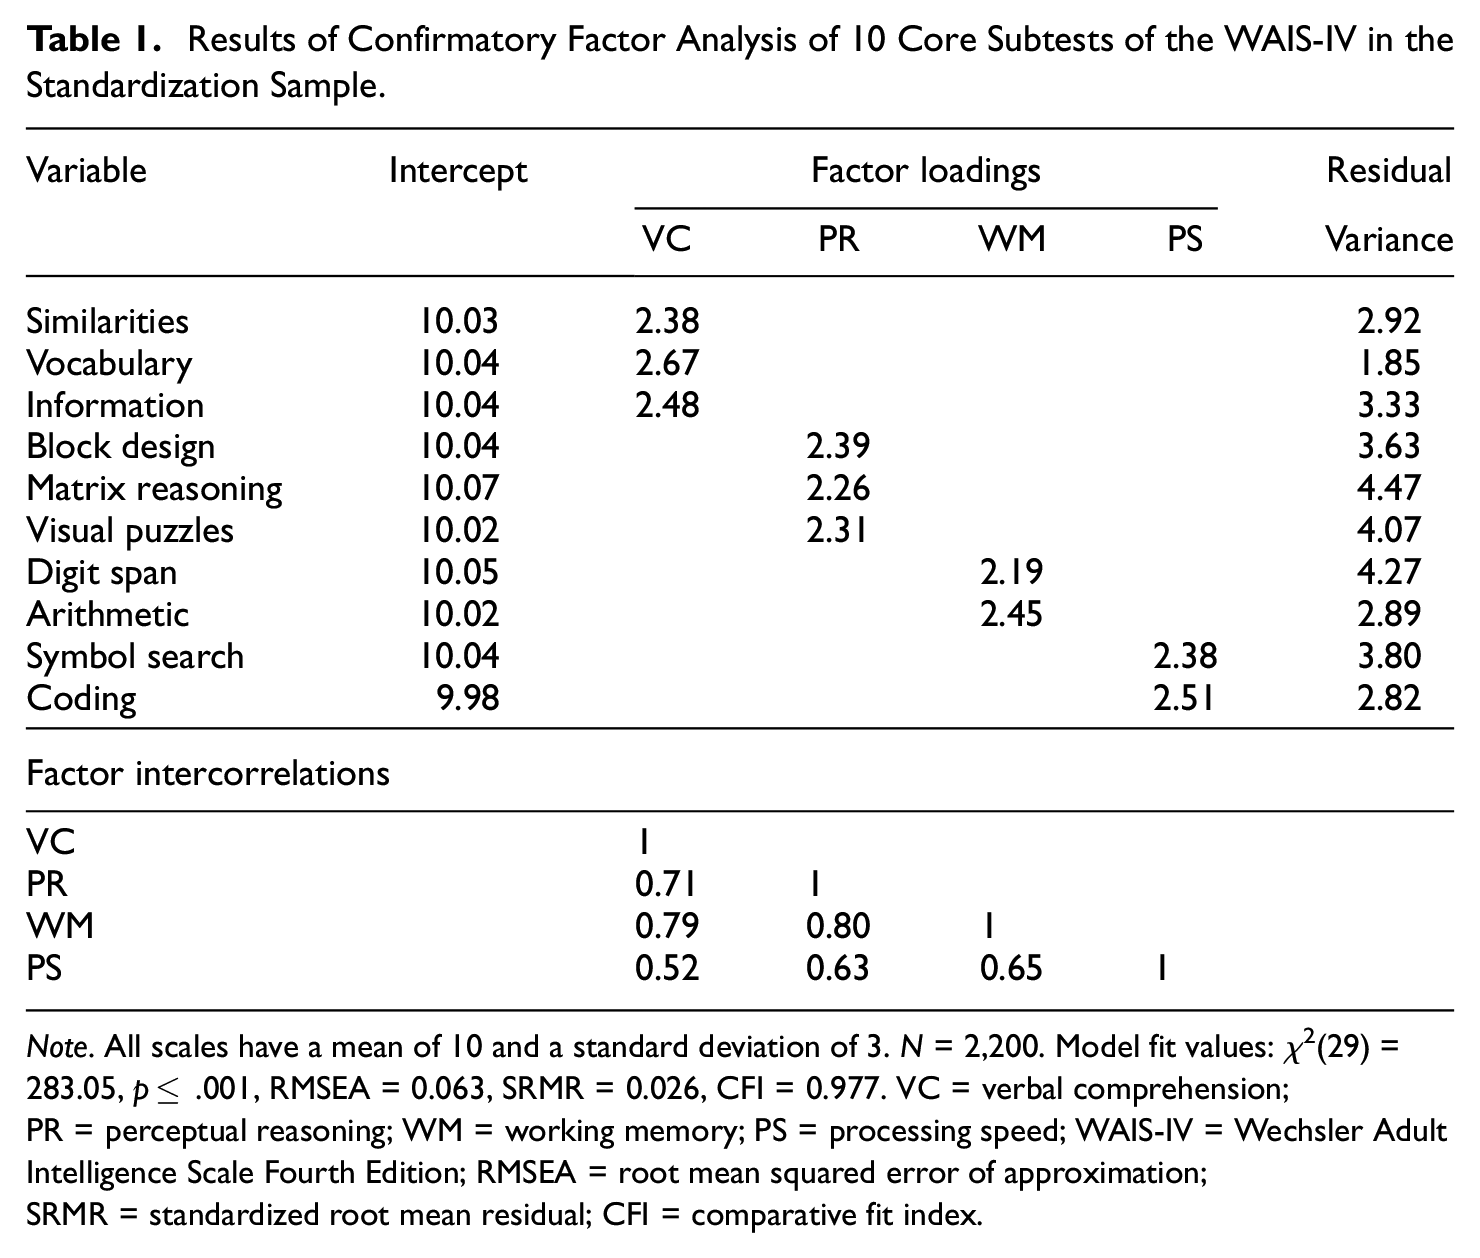
Note. All scales have a mean of 10 and a standard deviation of 3. N = 2,200. Model fit values: χ2(29) = 283.05, p≤ .001, RMSEA = 0.063, SRMR = 0.026, CFI = 0.977. VC = verbal comprehension; PR = perceptual reasoning; WM = working memory; PS = processing speed; WAIS-IV = Wechsler Adult Intelligence Scale Fourth Edition; RMSEA = root mean squared error of approximation; SRMR = standardized root mean residual; CFI = comparative fit index.
Estimating the correlated factor model serves two goals. First, the person fit software (see details below) we use cannot presently handle complex higher-order models such as a second-order or bifactor model. Second, statistical fit indices for the four correlated factor model were acceptable and very close to those for the slightly better fitting second-order model. Specifically, using the lavaan package (Rosseel, 2012) in R version 4.4.3 (R Core Team, 2020) and full information maximum likelihood estimation, the fit for the standardization sample was satisfactory with χ2(29) = 283.05, p≤ .001, root mean squared error of approximation (RMSEA = 0.063), standardized root mean residual (SRMR = 0.026), comparative fit index (CFI = 0.977), and Tucker-Lewis index (TLI = 0.965) all falling within conventions of adequate fit. Note that for the standardization sample, all subtest means were roughly 10 with standard deviations equal to 3. In turn, those means are treated as factor intercepts in the modeling of person fit (described below).
Model-Based Person Fit: Calculating the Index
Once a comparison model has been established, it is possible to evaluate the consistency of an individual’s response profile with the SEM used to interpret test scores (e.g., Yuan et al., 2004). Although person fit statistics have been well researched in item response theory (IRT) modeling contexts (Meijer, 2003; Meijer & Sijtsma, 2001), they have only recently been proposed for factor analytic models (Bollen & Arminger, 1991; Ferrando, 2009, 2010; Mansolf & Reise, 2018; Reise et al., 2016). To our knowledge, these factor-analytic-based person fit indices have not been applied to identify atypical response patterns for any well-known neuropsychological test. As such, the present application represents a novel exploration of the use of model-based person fit on the WAIS-IV subtests.
Most relevant to the present investigation are factor analytic person fit indices developed by Yuan et al. (2004), Yuan and Zhong (2008, 2013), and Yuan and Hayashi (2010). The objective of model-based person fit is to quantify the distance between the expected response pattern based on the comparison model parameters and the factor score estimates, and a given observed response pattern. To do so, the Bartlett factor score must be calculated to assess each
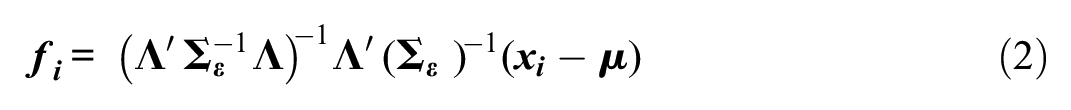
where fi is the
Residuals from this model, which quantify the distance between the model and response pattern conditional on factor score estimates, are defined as:
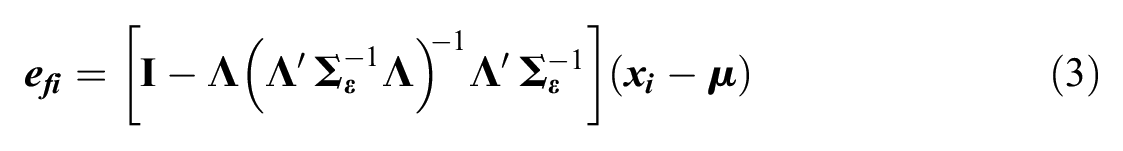
where
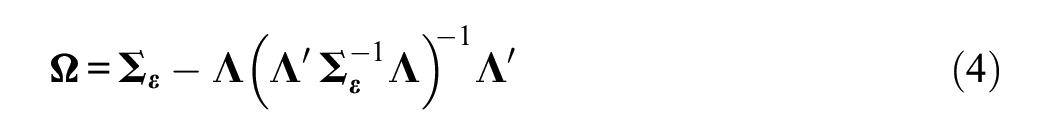
as given by Bollen and Arminger (1991). However,
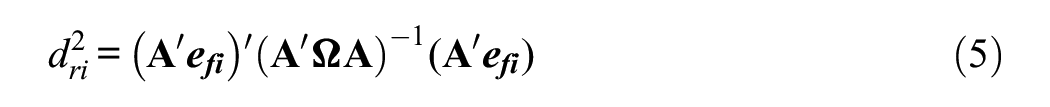
which measures how much of an outlier a given case is from the factor model.
2
Assuming multivariate normality, under the null hypothesis of good model fit,

would fit the data (
where
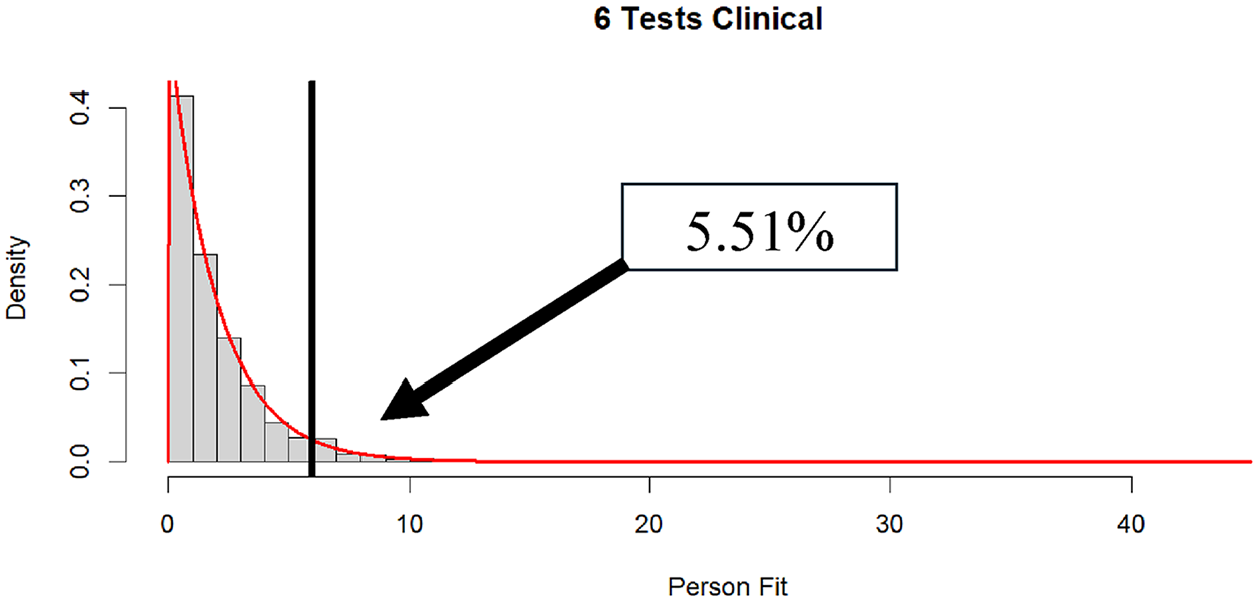
In the top panel of Figure 2, we display the distribution of
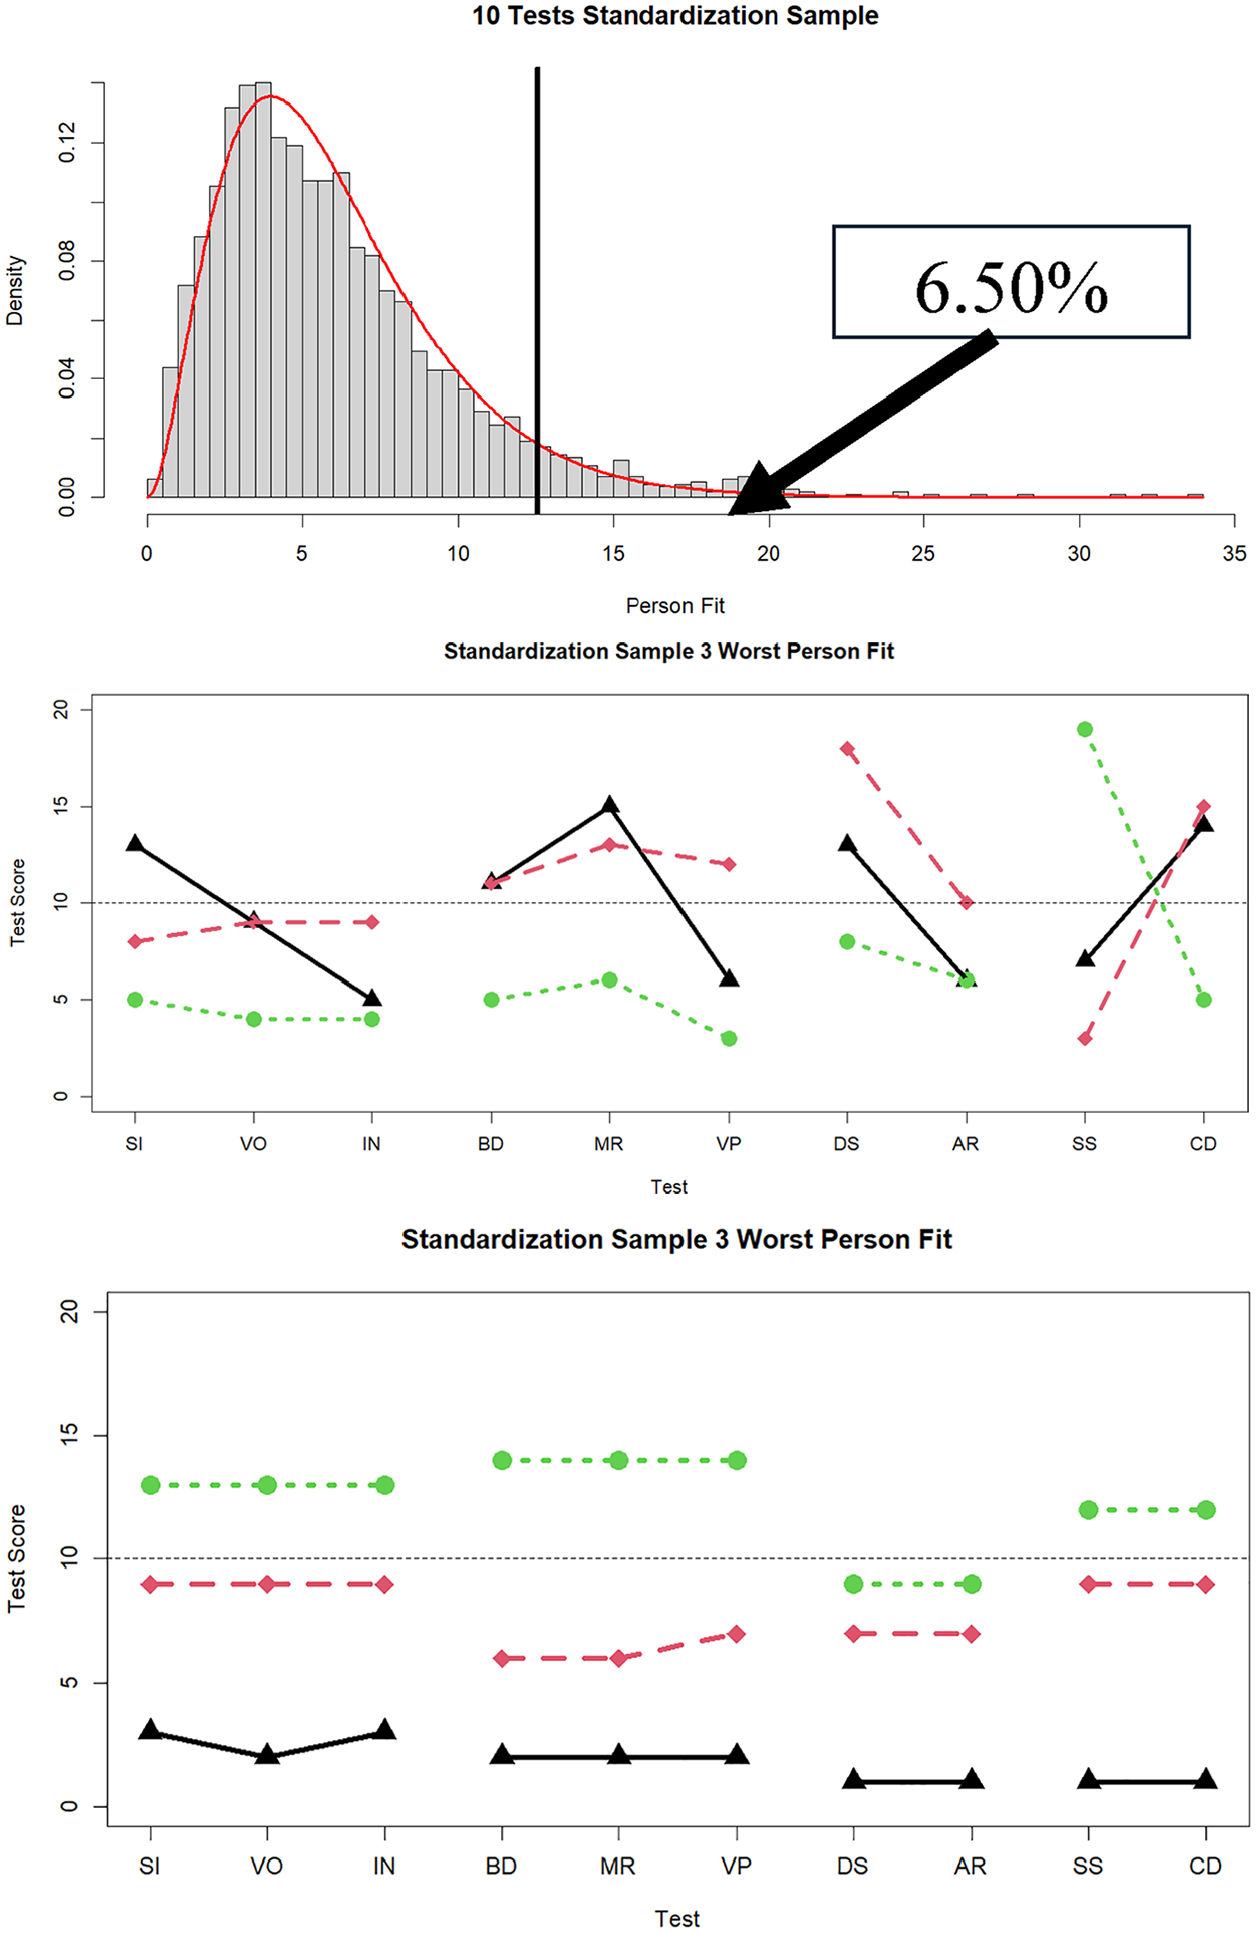
Distribution of
Present Research
As noted, person fit statistics based on factor analytic models are relatively new and have seen little application to clinical data. With this in mind, we conducted two studies. In the first, based on the comparison SEM estimated on the WAIS-IV standardization sample (Table 1 and Figure 1), we conducted a Monte Carlo simulation. The two main objectives of this simulation were (a) to determine whether
There is good reason to be skeptical of the proposed sampling distribution for
In the second study, we applied the person fit statistic in a large sample of clinical cases. This second study is more for exploratory and demonstration purposes and illustrates different types of patterns of poor person fit, rather than hypothesis testing per se. Nevertheless, empirically, we tracked both the distribution of
Methods and Results
Study 1: Monte Carlo Simulation
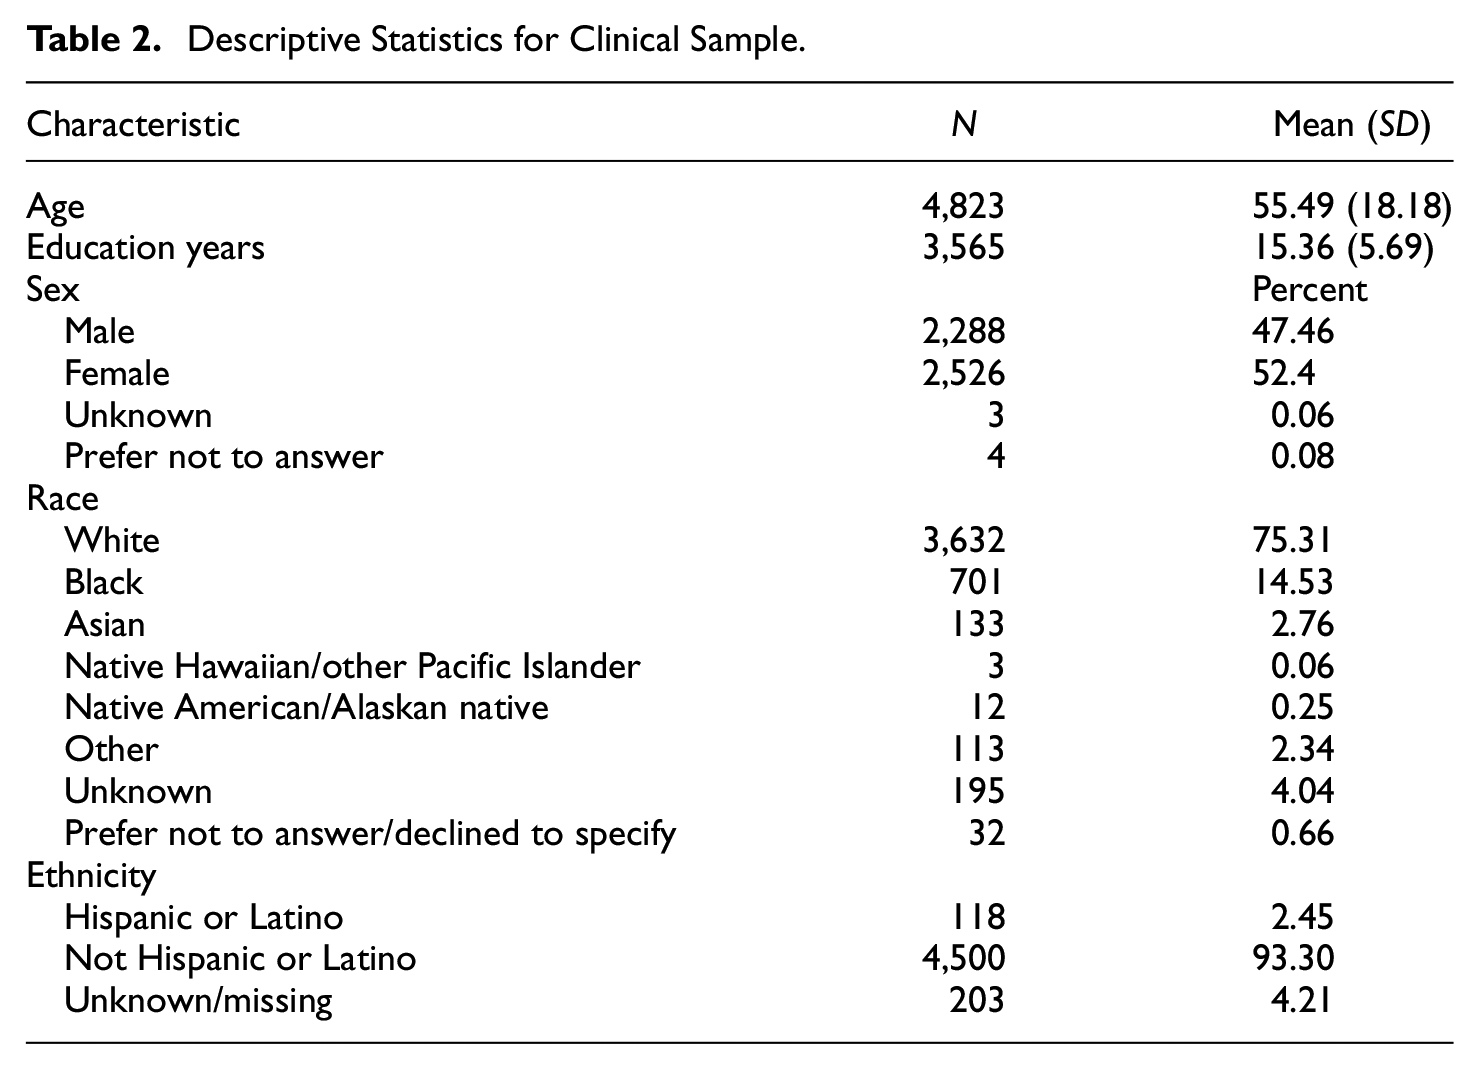
To obtain a realistic view of WAIS-IV administration in practice, our first step was to examine the pattern of missing data among the individuals who were enrolled in the National Neuropsychology Network (https://www.nnn.ucla.edu/) project and were administered at least one subtest of the WAIS-IV (N = 4,823). Patient demographic characteristics are shown in Table 2. We note that, when a patient does not receive all 10 WAIS-IV subtests, the missing tests are typically not missing at random but rather due to test protocol variations across participating sites. Consequently, some subtests are almost always administered and others much less so. The subtests that are administered are decided by the clinician based on what they believe necessary for the neuropsychological evaluation.
Descriptive Statistics for Clinical Sample.
The SEM shown in Table 1 and Figure 1 was used as the basis for a Monte Carlo simulation. In the design of the simulation, cases where the number of WAIS-IV subtests administered was five or less (about 33% of the clinical sample) were not considered because person fit could not be computed when there were four or fewer tests, and person fit could not reliably be computed when only five tests were administered.
Next, using the clinical data, the sample was separated into subgroups based on the number of tests administered, ranging from 6 to 10. One hundred thousand cases based on the model in Figure 1 and Table 1 were simulated for each subtest condition. Then, for each condition and each simulated subject, a missing data pattern from the relevant clinical data set was randomly sampled and assigned to a simulated case. Thus, the simulated data matched, probabilistically, the missing data patterns at each number of tests administered level (i.e., 6–10 subtests).
For each level of the number of subtests administered, the expectation was that the person fit statistic should be distributed as
Distribution of
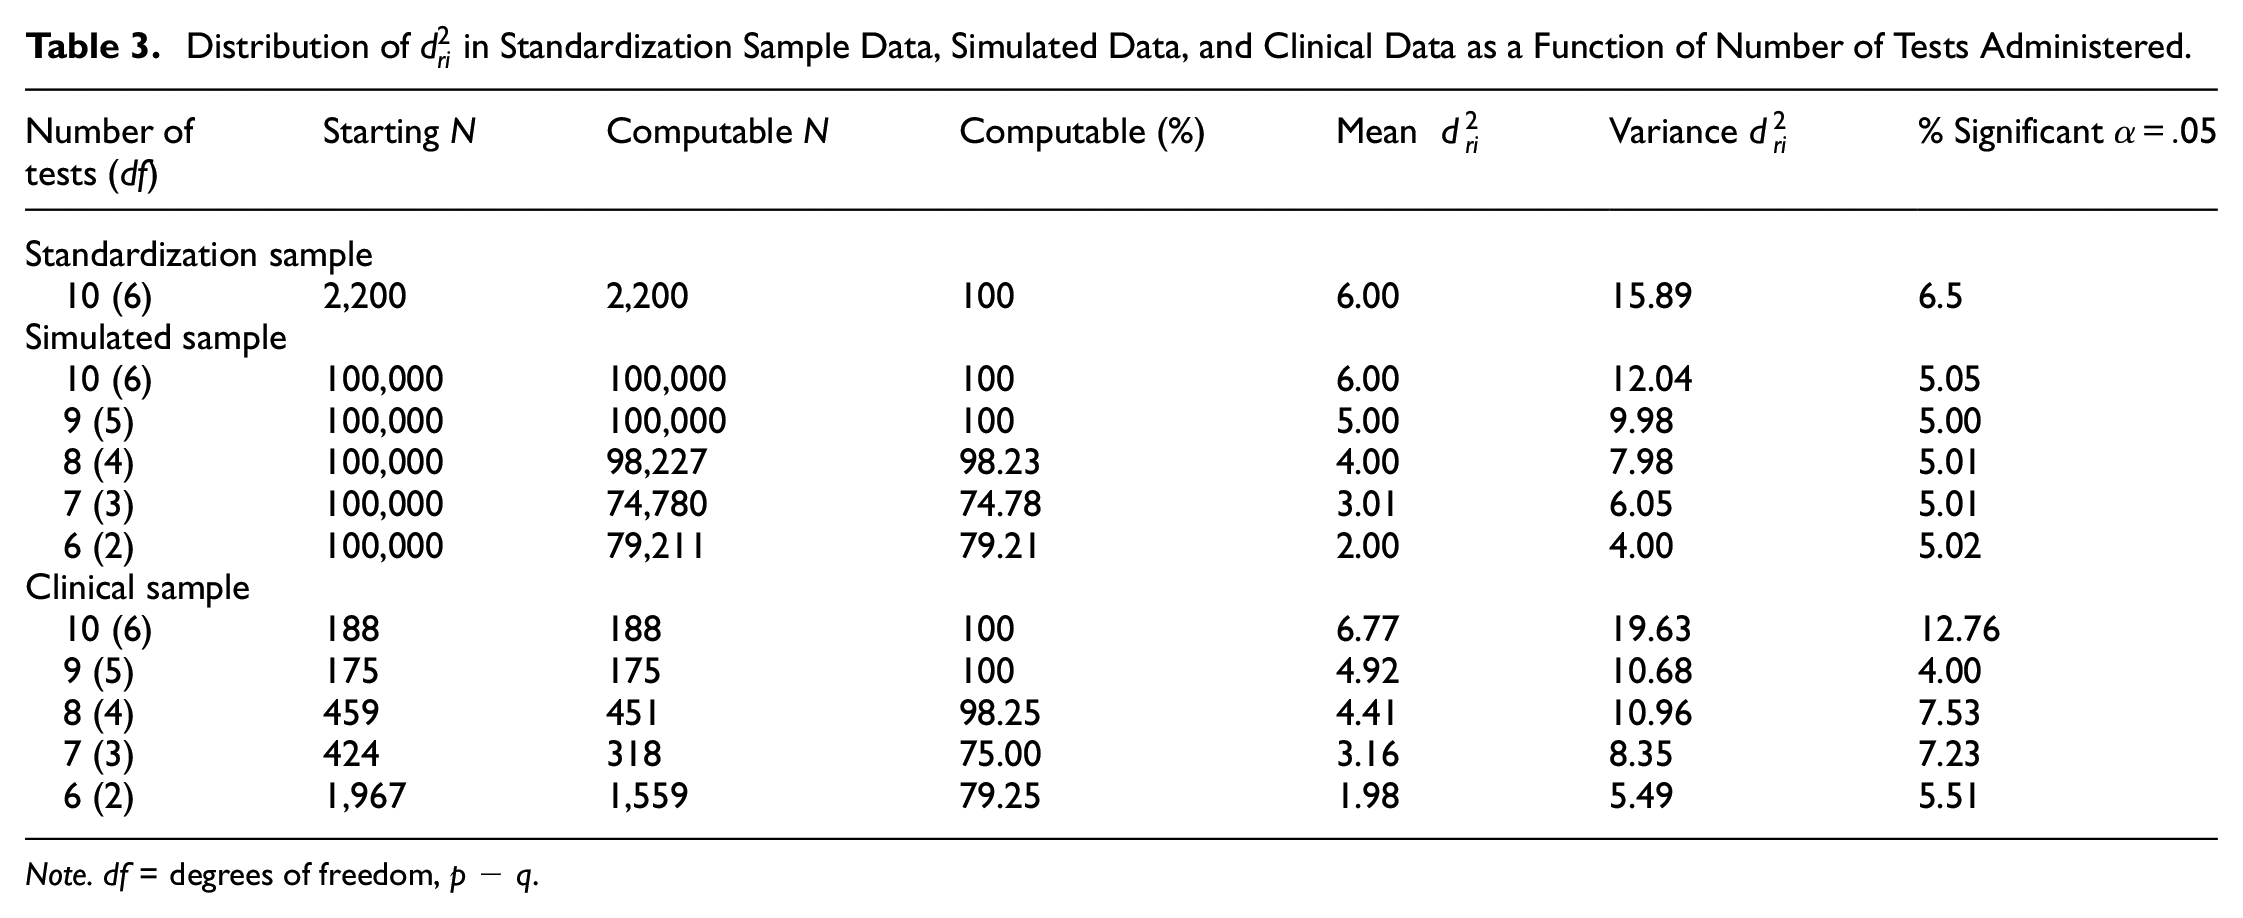
Note. df = degrees of freedom, p − q.
Study 2: Person Fit in a Clinical Sample
Having established a statistical comparison model for valid responding, we now turn to the estimation of person fit within a clinical sample, as described above. The calculation of person fit in the clinical sample followed the same procedure as described earlier using lavaan. The key difference is that the clinical sample did not contribute to the model; instead, the model has all parameters fixed to those estimated in the comparison sample, allowing person fit to be interpreted within the desired metric of model-response pattern discrepancy.
The results for individuals receiving between 6 and 10 subtests are shown in the bottom panel of Table 3. Anyone who received fewer than six WAIS-IV subtests was excluded from the analyses. The results show that a relatively large number of participants were administered six WAIS-IV subtests, with relatively few participants being administered 9 or 10 subtests. Going from 6 to 10 tests administered, the percentages of
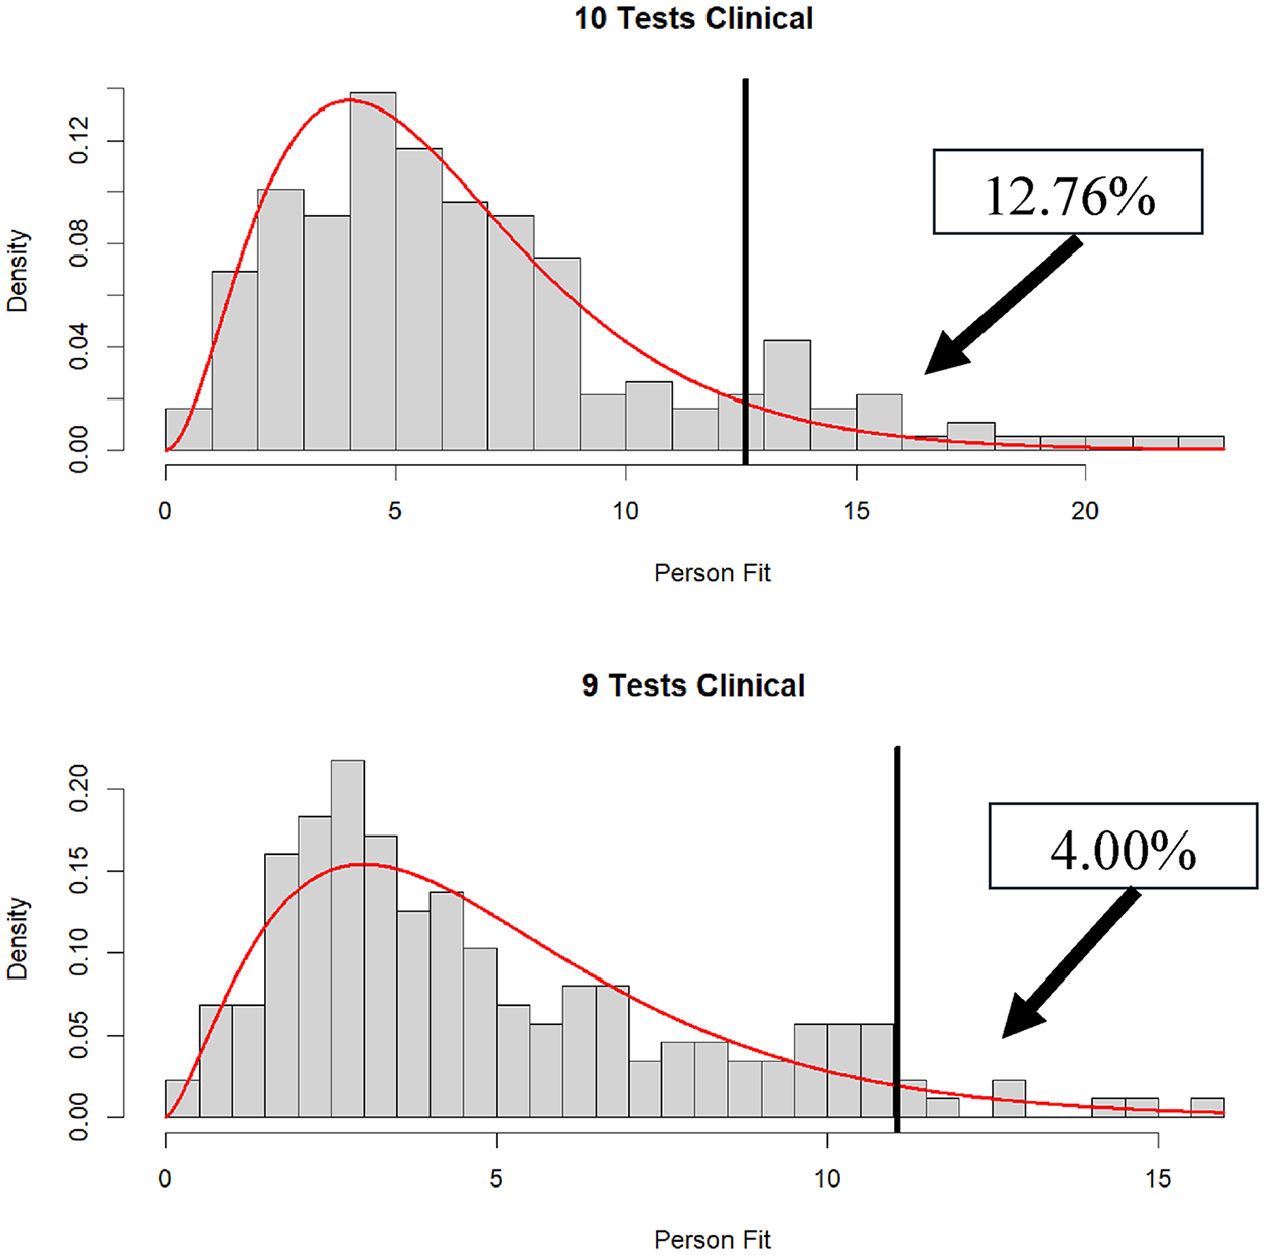
Distribution of
Distribution of
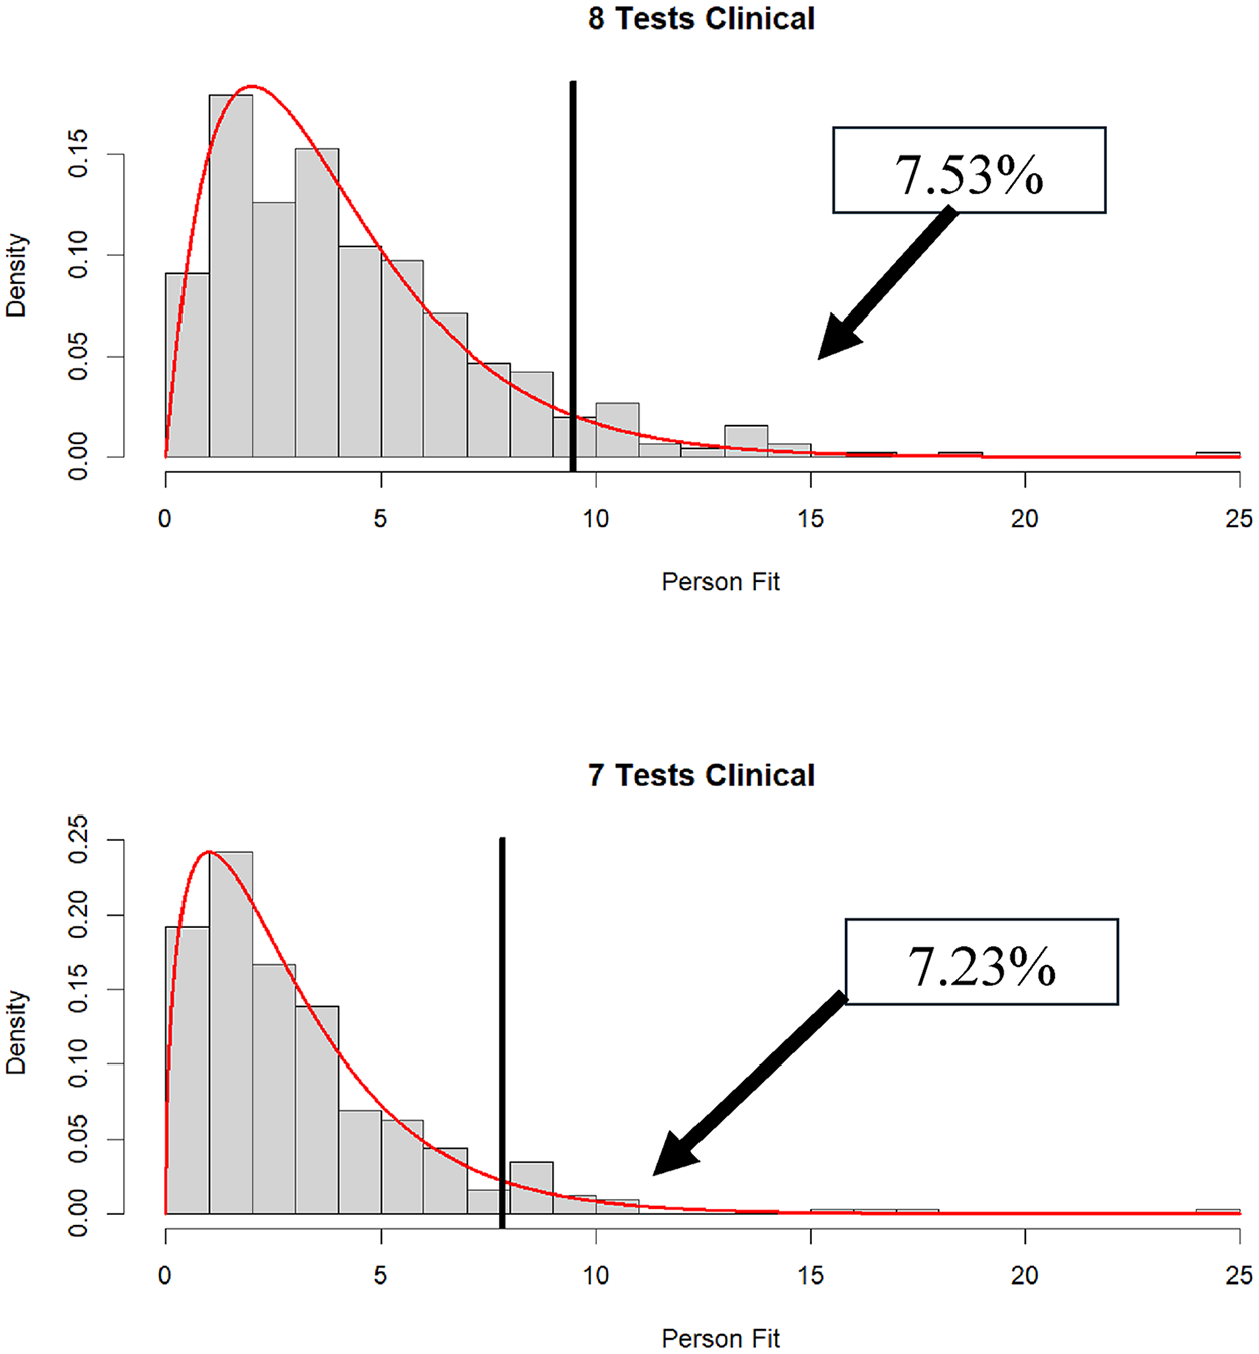
Distribution of
Finally, for illustrative purposes and to parallel Figure 2 (standardization sample), in Figure 6 we display profiles for the three best-fitting and worst-fitting individuals from the clinical sample, within the 10-subtest condition. For these individuals with large
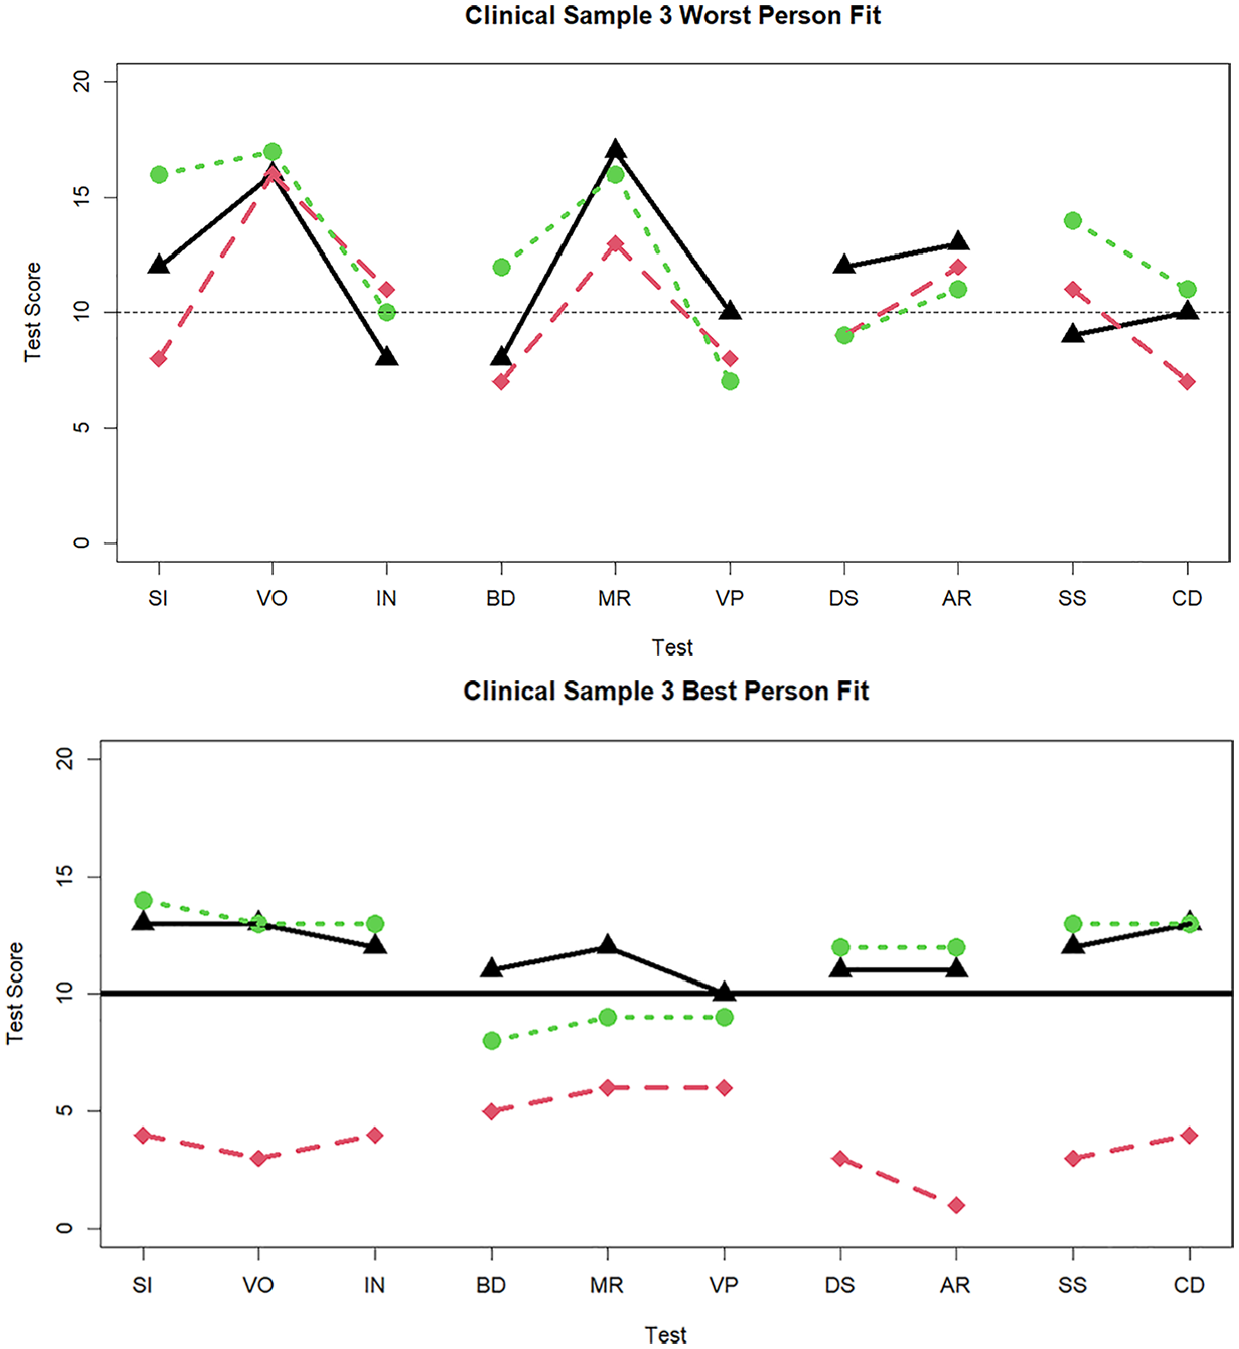
Three cases with the worst and best person fit in the clinical sample data when 10 tests are administered.
Figures 7 and 8 display the three worst-fitting profiles in the clinical sample for the nine (
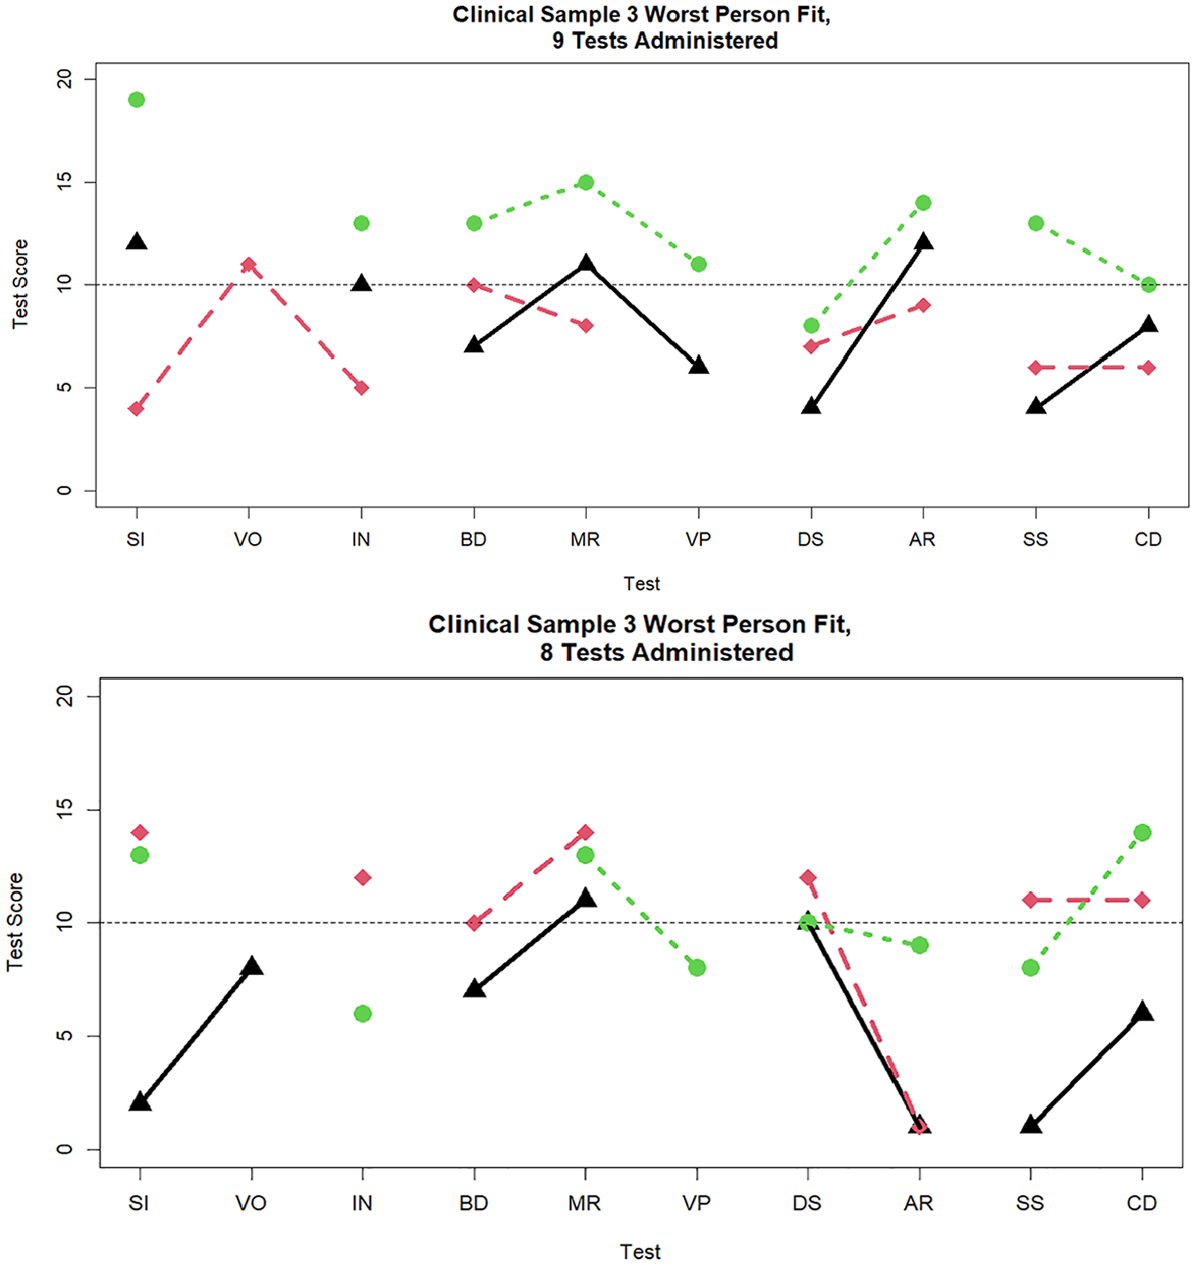
Three cases with the worst person fit in the clinical sample data when nine and eight tests are administered.
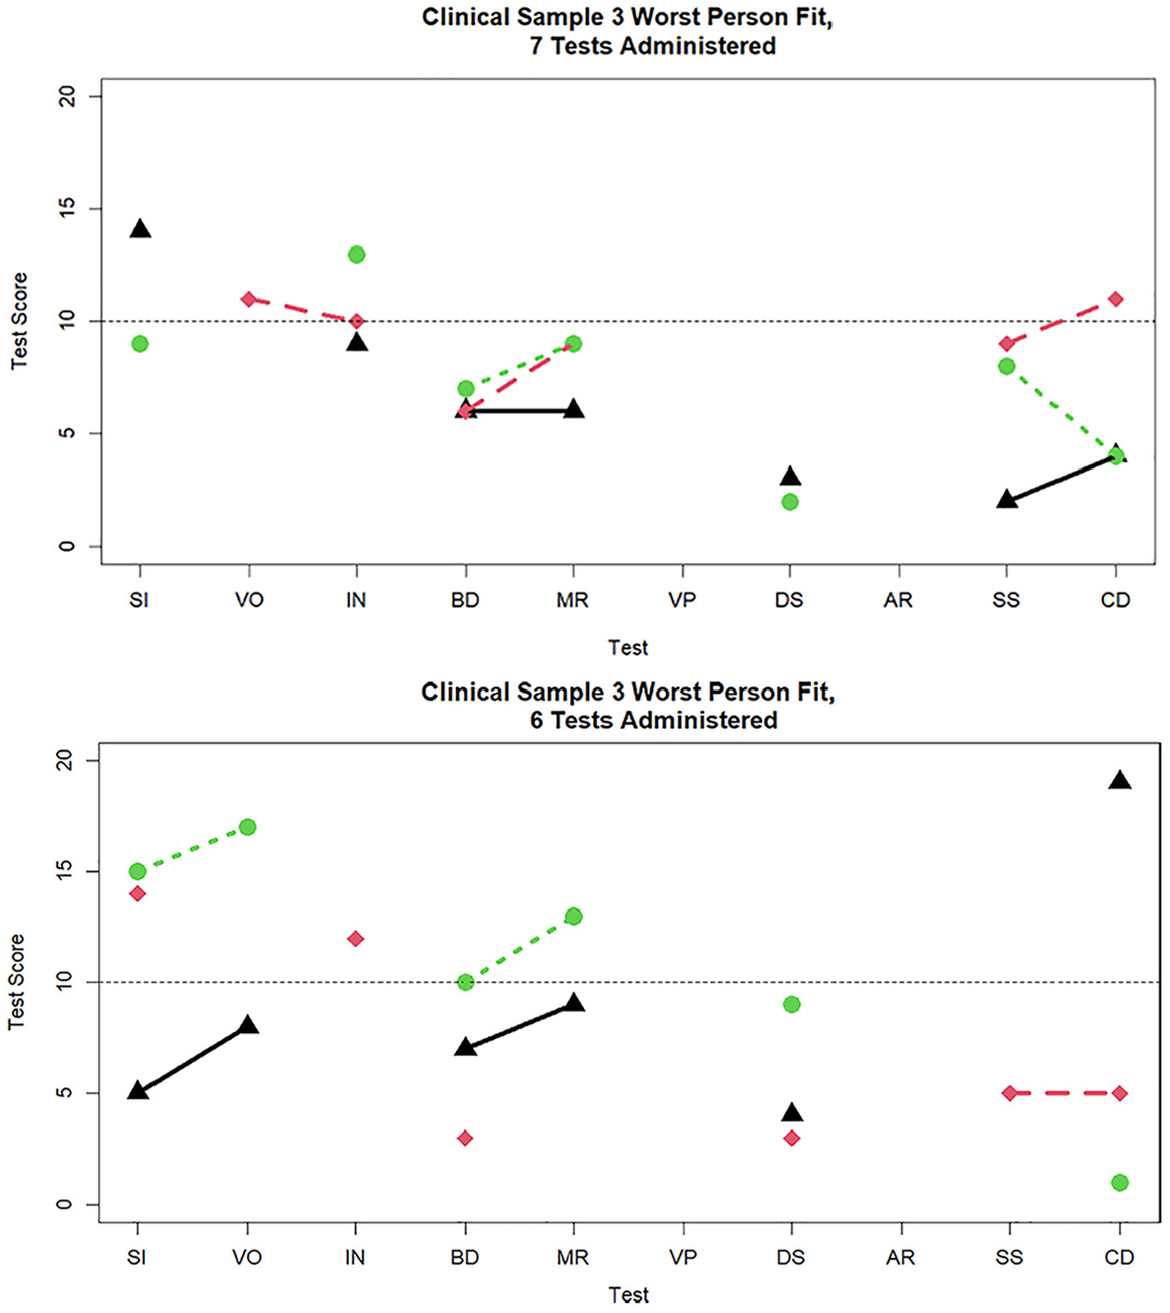
Three cases with the worst person fit in the clinical sample data when seven and six tests are administered.
Subscale Scores for the Five Worst Fitting Individuals Within Each Number of Tests Administered Conditions.
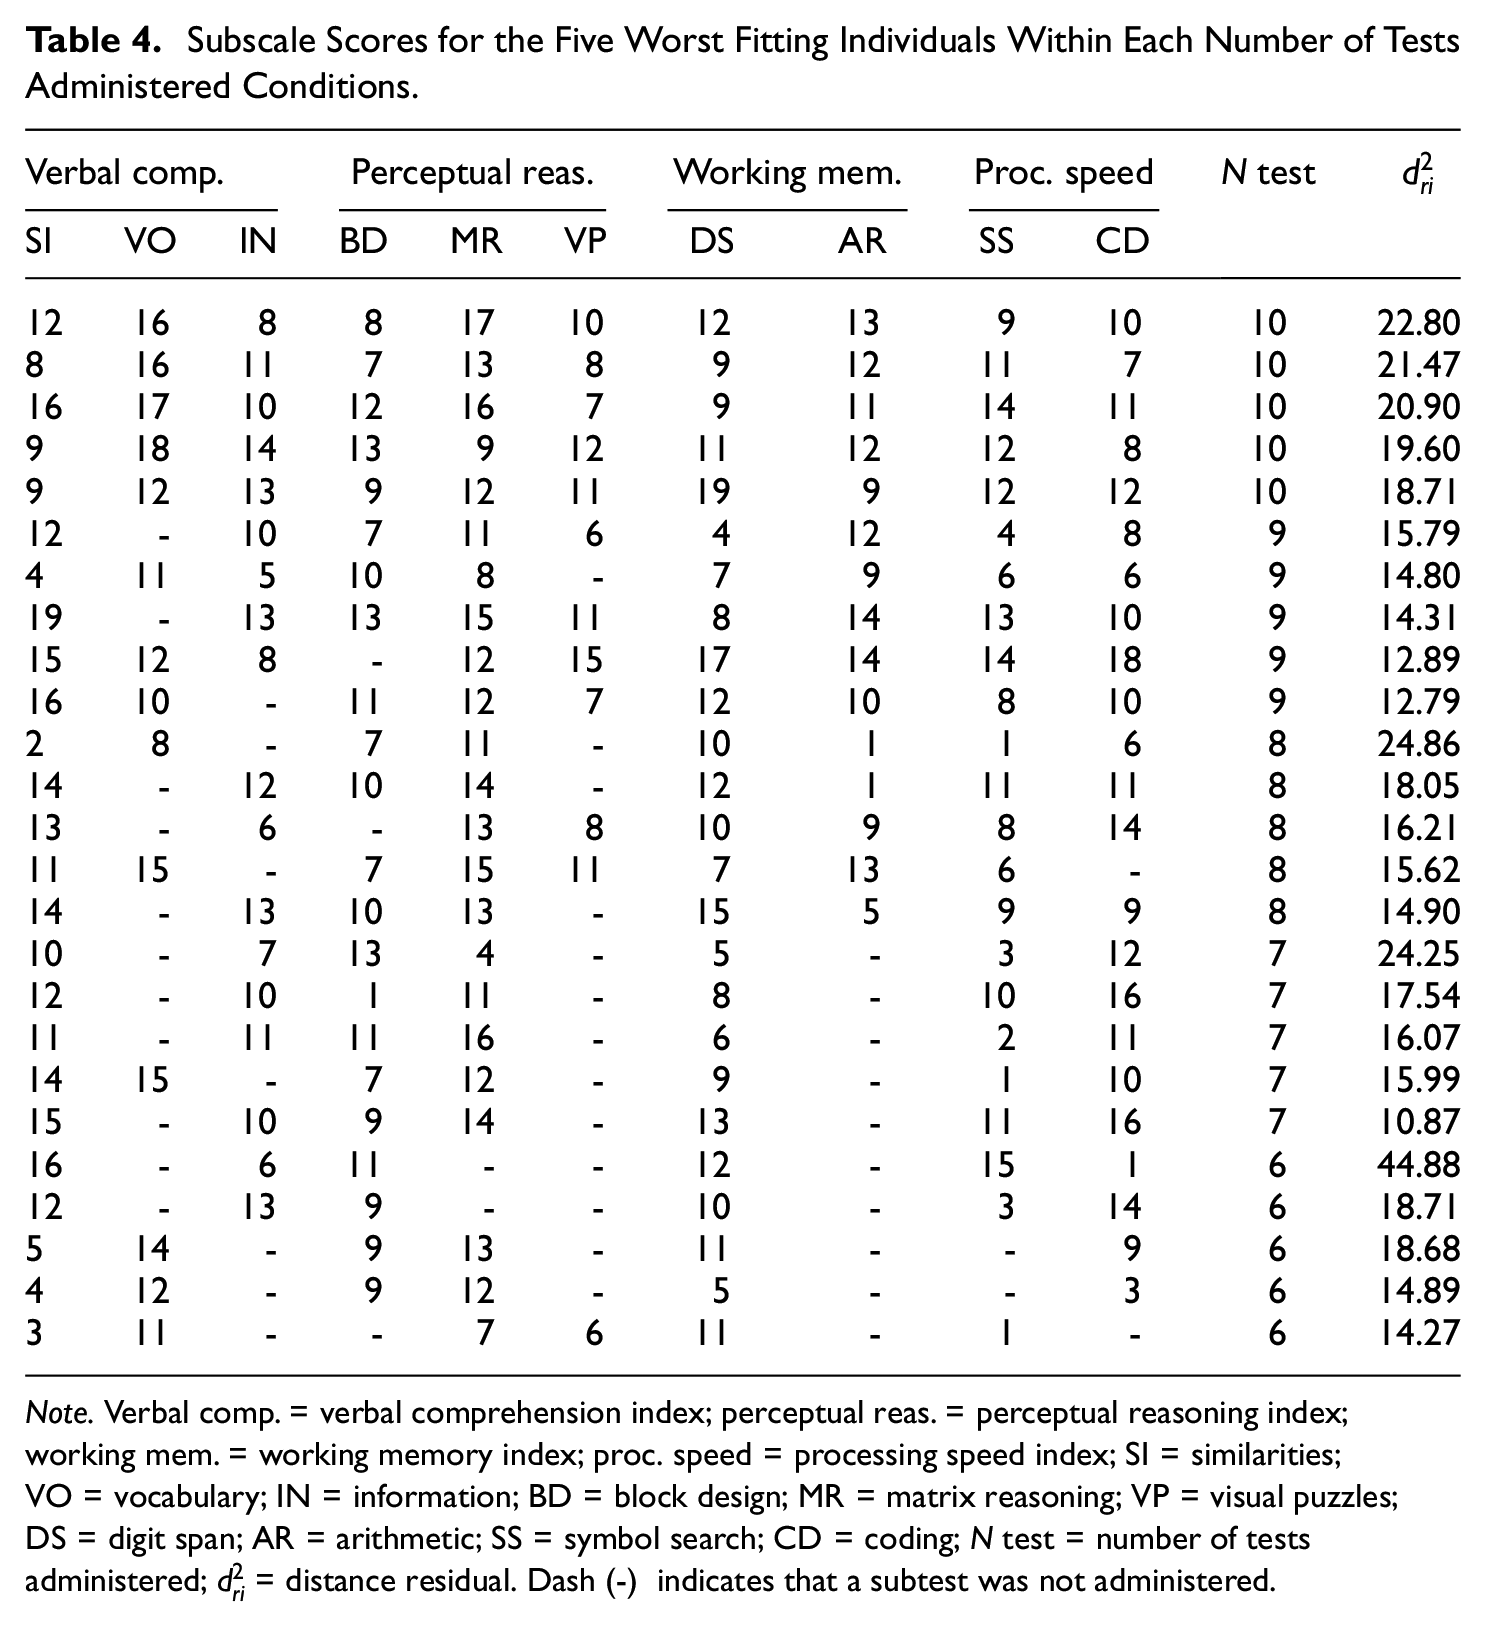
Note. Verbal comp. = verbal comprehension index; perceptual reas. = perceptual reasoning index; working mem. = working memory index; proc. speed = processing speed index; SI = similarities; VO = vocabulary; IN = information; BD = block design; MR = matrix reasoning; VP = visual puzzles; DS = digit span; AR = arithmetic; SS = symbol search; CD = coding; N test = number of tests administered;
Discussion
The WAIS-IV is a core component of many neuropsychological batteries. As individual profiles are used to formulate diagnosis and treatment decisions, it is essential to evaluate whether any individual WAIS-IV profile is interpretable as a valid reflection of cognitive abilities. In the present research, we briefly reviewed the roles of PVTs, discrepancy indices, and the MDs in judging the interpretability of a WAIS-IV assessment. As an alternative to these indices, we promoted a model-based person fit statistic,
We then used a Monte Carlo simulation to evaluate whether the hypothesized
In our application to clinical data, we found that poor person fit was much more pronounced than expected in individuals with data for all 10 subtests. This could mean that these individuals are fundamentally different in some way from those in a non-clinical sample or that the power to detect misfit is maximized under this condition. By contrast, the proportion of poor persons fit when fewer than 10 subtests were administered did not depart as much from the expected value. This could be due to having fewer ways to be aberrant when fewer tests are administered. In the following, we further consider the interpretation of model-based person fit indices such as
Interpreting Model-Based Person Fit Indices
Profile variability indices such as the MD (Crawford & Allan, 1994) represent the probability that an individual’s profile is a random sample from a population with a known mean vector and covariance matrix. Large values are associated with unlikely response patterns, due to either extremity or variability in subtests. By contrast, indices such as
Understanding the proper statistical meaning of
In terms of SEM person fit indices, earlier it was noted that
On the other hand, the finding of a significant level of person misfit is not an end, but an opportunity for investigation. Poor person fit may be due to any number of issues. One set of issues concerns what might be considered essentially artifactual bases associated with the person being evaluated (Schretlen et al., 2008). Just as with many PVTs, persons being tested may perform much worse than expected on particular subtests for many reasons. The aforementioned TOMM was developed as a measure of malingering; TOMM items tend to be so easy that one plausible interpretation of a low score is that the person being assessed malingered (i.e., attempted to underperform) or was not motivated to perform well. Alternatively, the basis for a large discrepancy between scores on subtests that are expected to yield similar scores could be due to inattention or fatigue. 3 Fatigue may be a reasonable assumption, particularly in a clinical sample, especially if the testing time is lengthy. If an individual’s mind wanders during the testing session, a simple lack of attention to the task might have occurred. Examiner factors such as mishandling the stopwatch, iPad, personal biases about the examinee, and administration and scoring errors, and administration errors should also be taken into account as potential sources of poor person fit.
A second set of issues related to poor person fit concerns conjectures regarding substantive bases for poor fit. Substantive interpretation of poor person fit is not a novel proposal. It may be the case that individuals who provide a poor fit to an established model may provide information on personality, behavior, or other elements not captured by the model. Person fit measures not only provide a more comprehensive analysis of model-data discrepancies but also allow users to flag anomalous response profiles, which necessitate closer examination (Yuan & Hayashi, 2010).
Consistent with this substantively meaningful view, using IRT methods, many studies have attempted to understand the substantive sources of poor person fit (Meijer, 2003; Meijer et al., 2016). Conijn et al. (2015) reported that person misfit was related to the degree of overall psychopathology, particularly with psychotic and somatoform disorders. Moreover, Wanders et al. (2018) conducted interviews to explore the underlying cause of misfit for individuals responding to an inventory of depression symptomology. They found that, for 19 of 20 patients, poor person fit could be attributed to complex comorbidities, somatic complaints (e.g., endorsing severe symptoms but not mild symptoms, which, in turn, makes them seem higher in depression, when in fact, they only have somatic complaints), and neurological abnormalities.
In terms of the WAIS-IV, when neuropsychological performance does not align with a well-established statistical model, poor person fit may reflect clinical conditions rather than a lack of effort or engagement, or administrator error. As described in Loring and Goldstein (2019), large score discrepancies and, therefore, misfit may be related to patient pathology, such that specific patterns of misfit may be due to cognitive dysfunction. Indeed, in our informal review of the neuropsychological records of individuals who had poor fit, it appears that some misfit reflects clinically meaningful score differences that fit well with demonstrated neuropathology, while others appear to reflect inconsistent performance, more likely associated with variable effort or task engagement.
Limitations
One limitation of
Finally, it is important to keep in mind that in the WAIS-IV, two of the factors have only three indicators, and the remaining two factors have only two indicators. Despite the relatively high loadings, factor score estimates have relatively large standard errors, and if one or two tests are missing, the factor score estimate can be wildly biased with a much larger standard error. Moreover, if all indicators of a factor are missing, the factor score cannot be estimated. Although these concerns did not appear to negatively impact the functioning of
Summary
We proposed a novel application of factor-analytic-based person fit indices to the evaluation of WAIS-IV protocols. It appears that the hypothesized sampling distribution for the person fit statistic holds reasonably well when the number of tests administered is at least six. We view model-based person fit indices as a complement to traditional PVTs, which are more aligned with identifying malingering and other forms of faultiness than aberrant patterns of subscale scores. Model-based person fit can also be viewed, much like the MD statistics, as a way of summarizing the numerous possible discrepancies between scale scores. The major caveat is that
Footnotes
Appendix
Declaration of Conflicting Interests
The author(s) declared no potential conflicts of interest with respect to the research, authorship, and/or publication of this article.
Funding
The author(s) disclosed receipt of the following financial support for the research, authorship, and/or publication of this article: This work was supported by the National Institute of Mental Health [R01MH118514].