
Abstract
A plethora of techniques exist to determine the number of factors to retain in exploratory factor analysis. A recent and promising technique is the Next Eigenvalue Sufficiency Test (NEST), but has not been systematically compared with well-established stopping rules. The present study proposes a simulation with synthetic factor structures to compare NEST, parallel analysis, sequential
Determining the correct number of factors remains a long-standing challenge in exploratory factor analysis. Factor analysis is used to reduce the dimensionality of data sets and, when no specific factorial structure is known a priori, deciding how many latent factors to extract is a decisive question. Underextraction results in substantial bias on factor loadings, whereas overextraction can lead to factor splitting.
There has been a wide variety of techniques, called stopping rules, developed over the years to determine the correct number of factors. A recent and promising technique which has already shown excellent performances in previous studies is the Next Eigenvalue Sufficiency Test (NEST; Achim, 2017) which has been shown to be robust to cross-loadings (Brandenburg & Papenberg, 2024), to have a low false-positive rate (Achim, 2017, 2021) to be accurate in circumplex models (Brandenburg & Papenberg, 2024), to be strongly theoretically aligned with factor analysis conceptualization (Brandenburg & Papenberg, 2024), and, being a nonparametric approach, to be more flexible and broadly applicable across different types of data sets (Achim, 2021). In the work by Achim (2017), NEST was already shown to be better at identifying the number of dimensions than other stopping rules, such as parallel analysis (PA; Horn, 1965), revised PA (Green et al., 2012, 2015), minimum average partial correlation (Velicer, 1976), and comparison data (Ruscio & Roche, 2012) over a limited set of scenarios. It was also shown to have a clear advantage over exploratory graph analysis in the work by Brandenburg and Papenberg (2024).
Despite this promising start, the advantages of NEST in deciphering the number of dimensions have remained relatively undiscussed. Among four recent extensive comparisons (Auerswald & Moshagen, 2019; Finch, 2023; Lim & Jahng, 2019; Neishabouri & Desmarais, 2024), none included NEST as a potential contender. Therefore, it is unclear how well NEST performs compared with a wide range of stopping rules in extensive simulation studies. Given the very few comparisons of NEST to other methods, the purpose of the current study is to compare NEST performance against the recommended stopping rules (Auerswald & Moshagen, 2019; Finch, 2023; Lim & Jahng, 2019; Neishabouri & Desmarais, 2024), which are PA (Horn, 1965), sequential
Method
This simulation was carried out in
Methods to Decide the Number of Retained Factors
Parallel Analysis
PA (Horn, 1965) compares the empirical eigenvalues to the average eigenvalues derived from a random multivariate normal distribution with uncorrelated variables (the identity matrix). The random samples are designed to have the same number of observations and variables as the actual data set. The criterion for extracting factors in PA is that their eigenvalues must exceed the average eigenvalue of the random samples.
Although, some studies (for instance, Glorfeld, 1995) argued for the 95th percentile of sample eigenvalues instead of traditional PA (average, or 50th percentile), Auerswald and Moshagen (2019) and Lim and Jahng (2019) found that the traditional PA performed better than 95th PA. Meanwhile, Finch (2023) and Neishabouri and Desmarais (2024) only used and recommended traditional PA. Thus, only the mean variant of the PA method will be used herein.
The Next Eigenvalue Sufficiency Test
Like PA, NEST uses a synthetic correlation matrix and resamples over a large amount (over a thousand) of data sets with the same number of subjects as the target data set. The main difference is that NEST sequentially uses synthetic correlation matrices containing
Contrary to PA which only uses the identity matrix for all eigenvalues (a well-known issue with PA, Turner, 1998), NEST updates the synthetic correlation matrix at every step. At

where

From the loadings,

When
There are numerous ways to estimate the loadings
Once the synthetic correlation matrix is updated, there is again a resampling over a large number of data sets from which the
Sequential
Model Test
Common factor models are often evaluated using the likelihood ratio test statistic (Lawley, 1940) with ML estimation. This test assesses whether the model’s implied covariance matrix is equal to the population covariance matrix. The test statistic follows an asymptotic
To determine the appropriate number of factors in the model, the likelihood ratio test can be sequentially applied, starting with a zero-factor model. If the
Hull Method
The HULL (Lorenzo-Seva et al., 2011) is an approach inspired by the Hull heuristic. This method, akin to nongraphical versions of Cattell’s scree plot, seeks to identify an elbow as evidence for the appropriate number of common factors. The HULL utilizes goodness-of-fit indices in relation to the model degrees of freedom instead of relying on eigenvalues. It is based on the goodness-of-fit index (better fit equals better models) and the viability of the model (more complex models with lower fit index are unviable). The elbow is determined as the point where, concerning the change in the model’s degrees of freedom, there is a substantial increase in model fit compared with a lower number of factors, while the model fit is only marginally lower compared with a higher number of factors. This criterion is established by considering all viable fit values in relation to both their preceding and subsequent fit values.
Empirical Kaiser Criterion
The EKC (Braeken & van Assen, 2017) is an approach that incorporates random sample variations of the eigenvalues in the Kaiser–Guttman criterion. On a population level, both criteria are equivalent. On the sample level, the criterion is based on the distribution of eigenvalues of an identity matrix, which asymptotically follows a Marchenko–Pastur distribution as

for the first and then corrected for the next ones

The first empirical eigenvalues above the criteria are retained. Like the Kaiser–Guttman criterion, the value of one is the minimum to consider a factor as meaningful.
Simulations
Simulations were similar to previous studies (Auerswald & Moshagen, 2019; Caron, 2019; Finch, 2023; Lim & Jahng, 2019; Peres-Neto et al., 2005) using synthetic factorial structures. To compare the methods, we incorporated a wide range of data conditions that are challenging, but realistic in psychological and biological research. Data were generated using random multivariate normal distributions from factorial structures based on 24 variables with the number of factors (
Results
The results section is divided into three parts: easy (one and two factors), intermediate (three and four factors), and hard cases (six to eight factors). All figures are structured similarly. The
Easy Cases
Figure 1 illustrates easy conditions and shows that PA, NEST, and EKC had the best performances, having close to 100% correct identification. This result was obtained regardless of sample sizes, loadings, correlations between factors, and the number of factors. SMT and HULL were not the most accurate methods, both having correct identification close to 80%, ranging between 70% and 90% depending on the conditions. Figure 2 shows that SMT had a tendency to overestimate, whereas HULL had a tendency to underestimate the number of factors in the
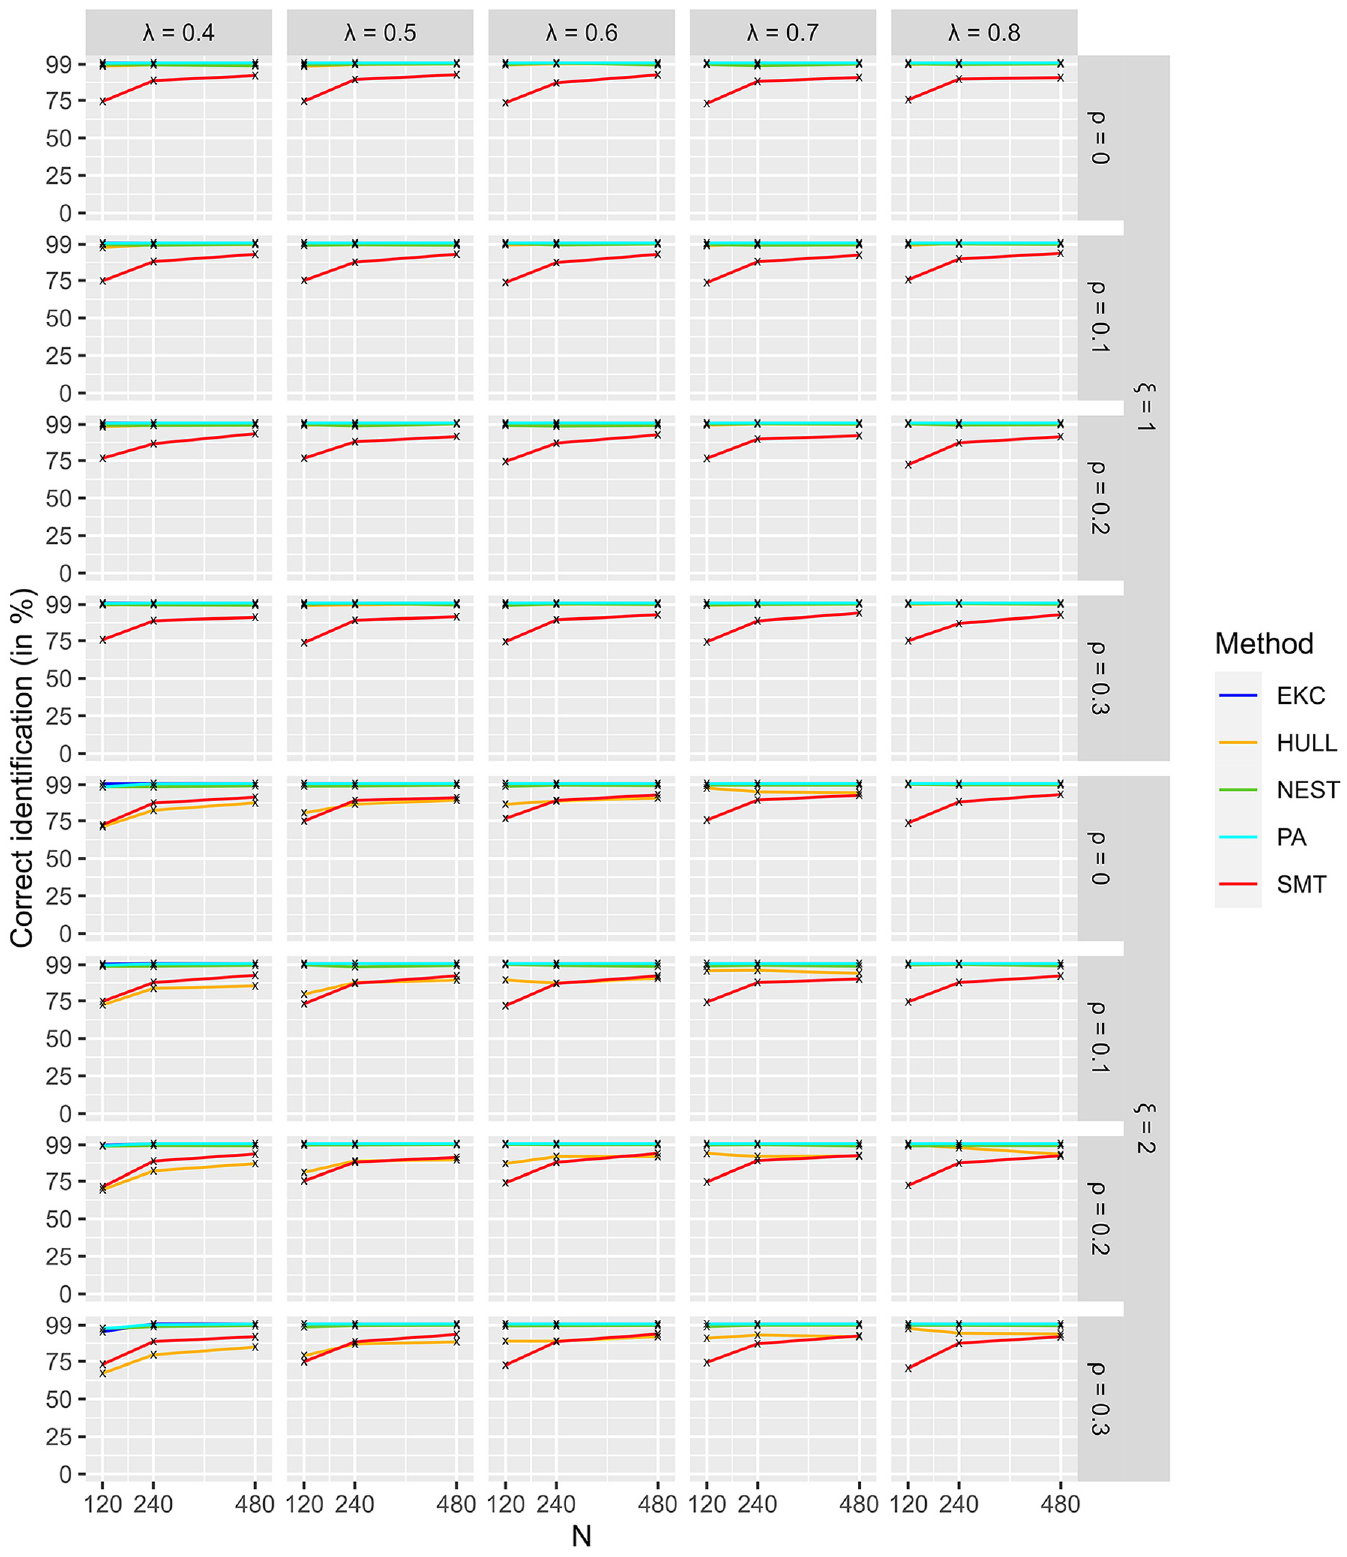
Identification of Dimensionality for Conditions With 1 and 2 Factors (Easy).
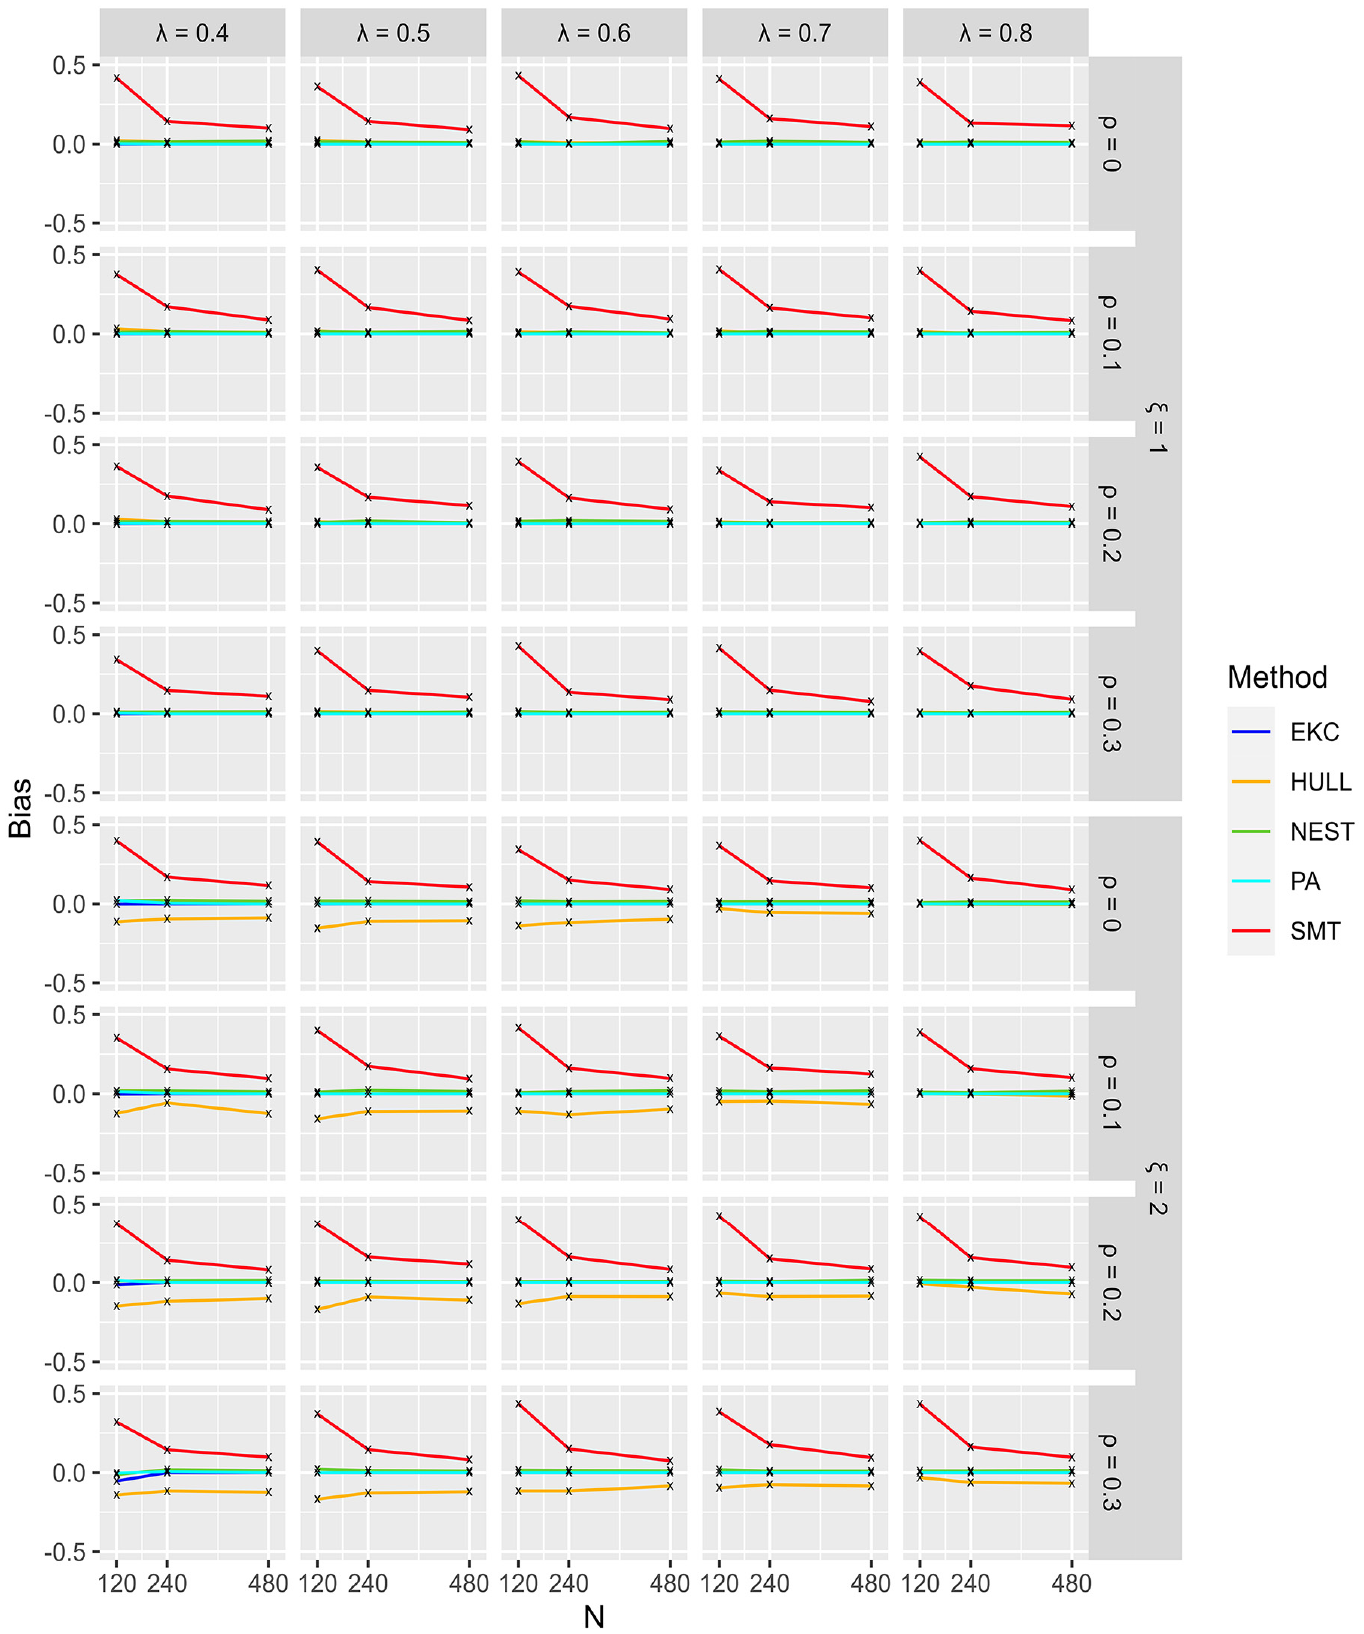
Bias for Conditions With 1 and 2 Factors (Easy).
Intermediate Cases
Figure 3 shows that PA and NEST had the best overall performances in the intermediate condition. The worst performances were in the harder conditions pictured in Figure 3, that is,
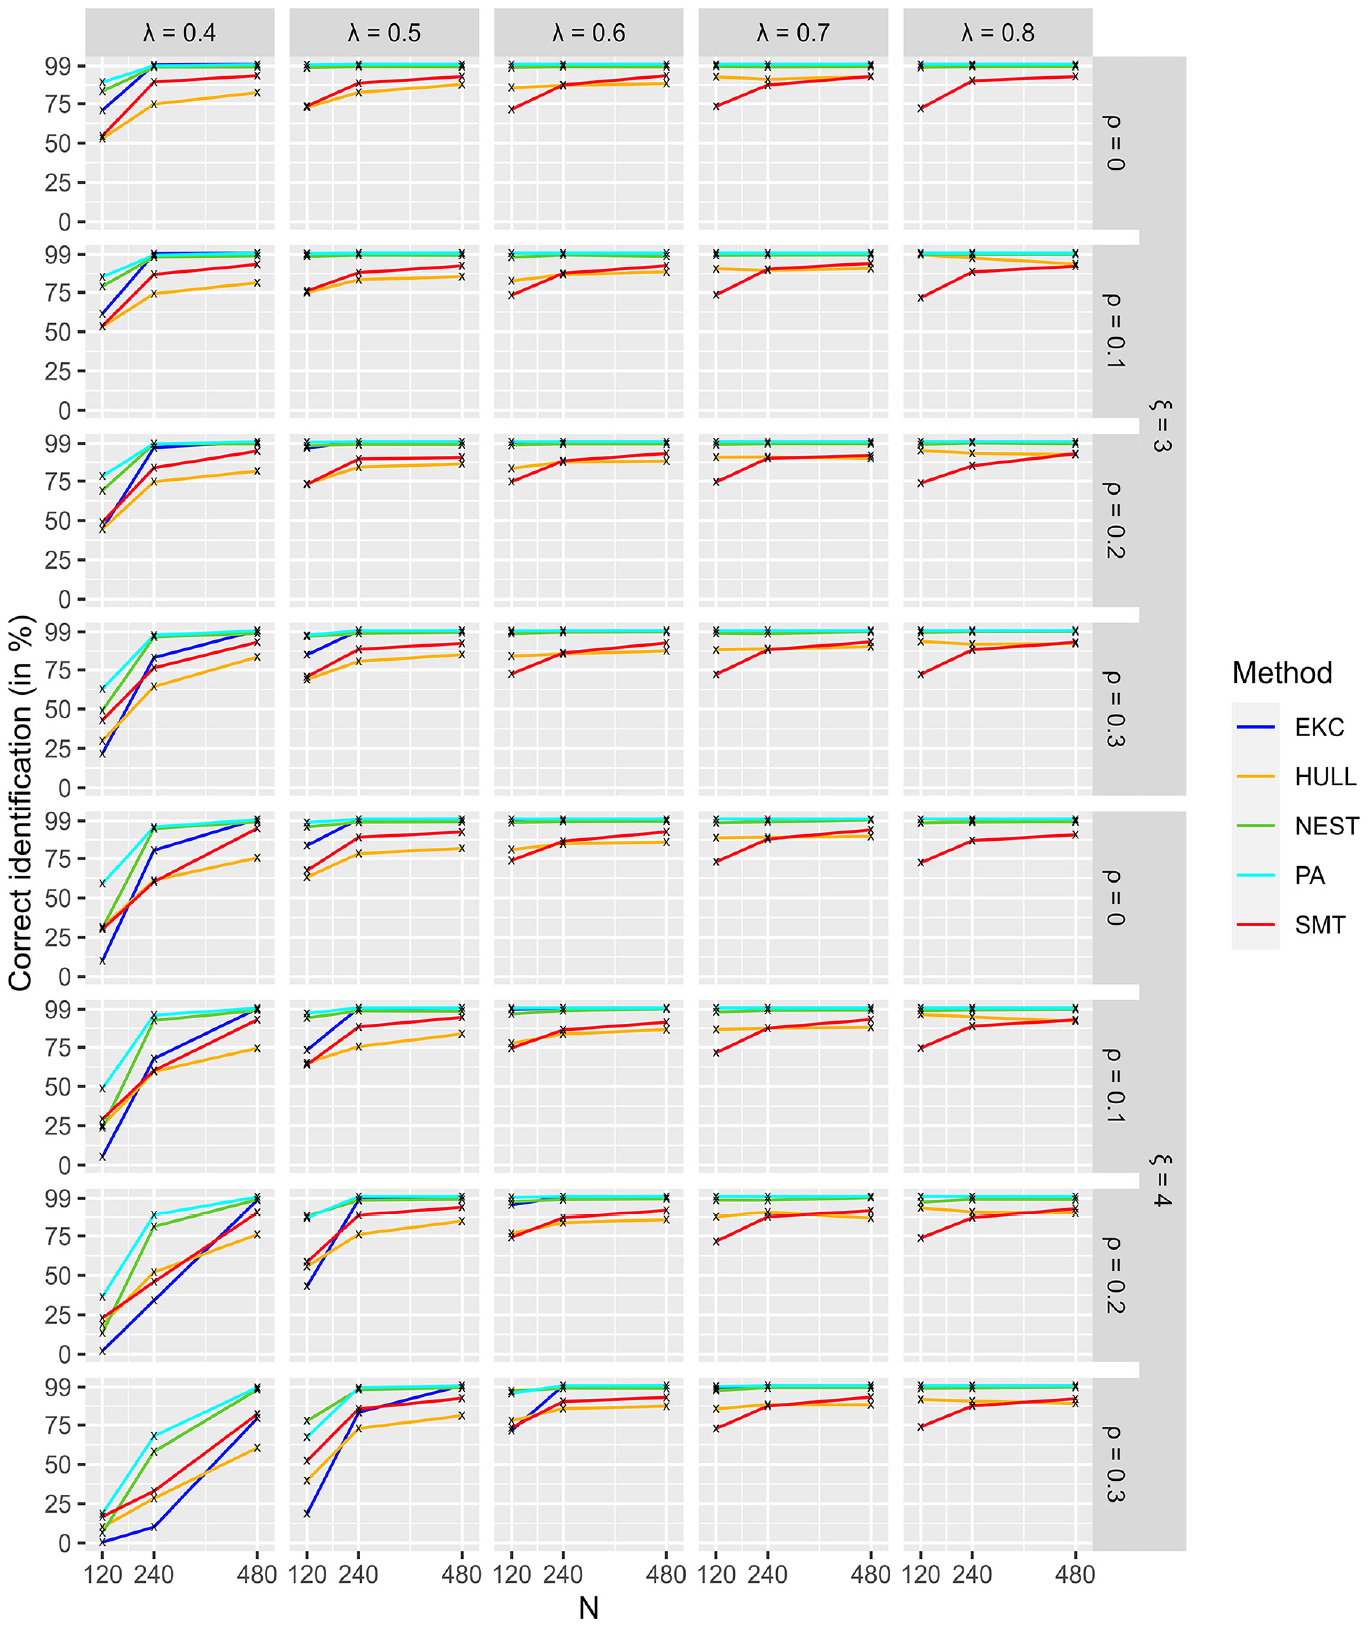
Identification of Dimensionality for Conditions With 3 and 4 Factors (Intermediate).
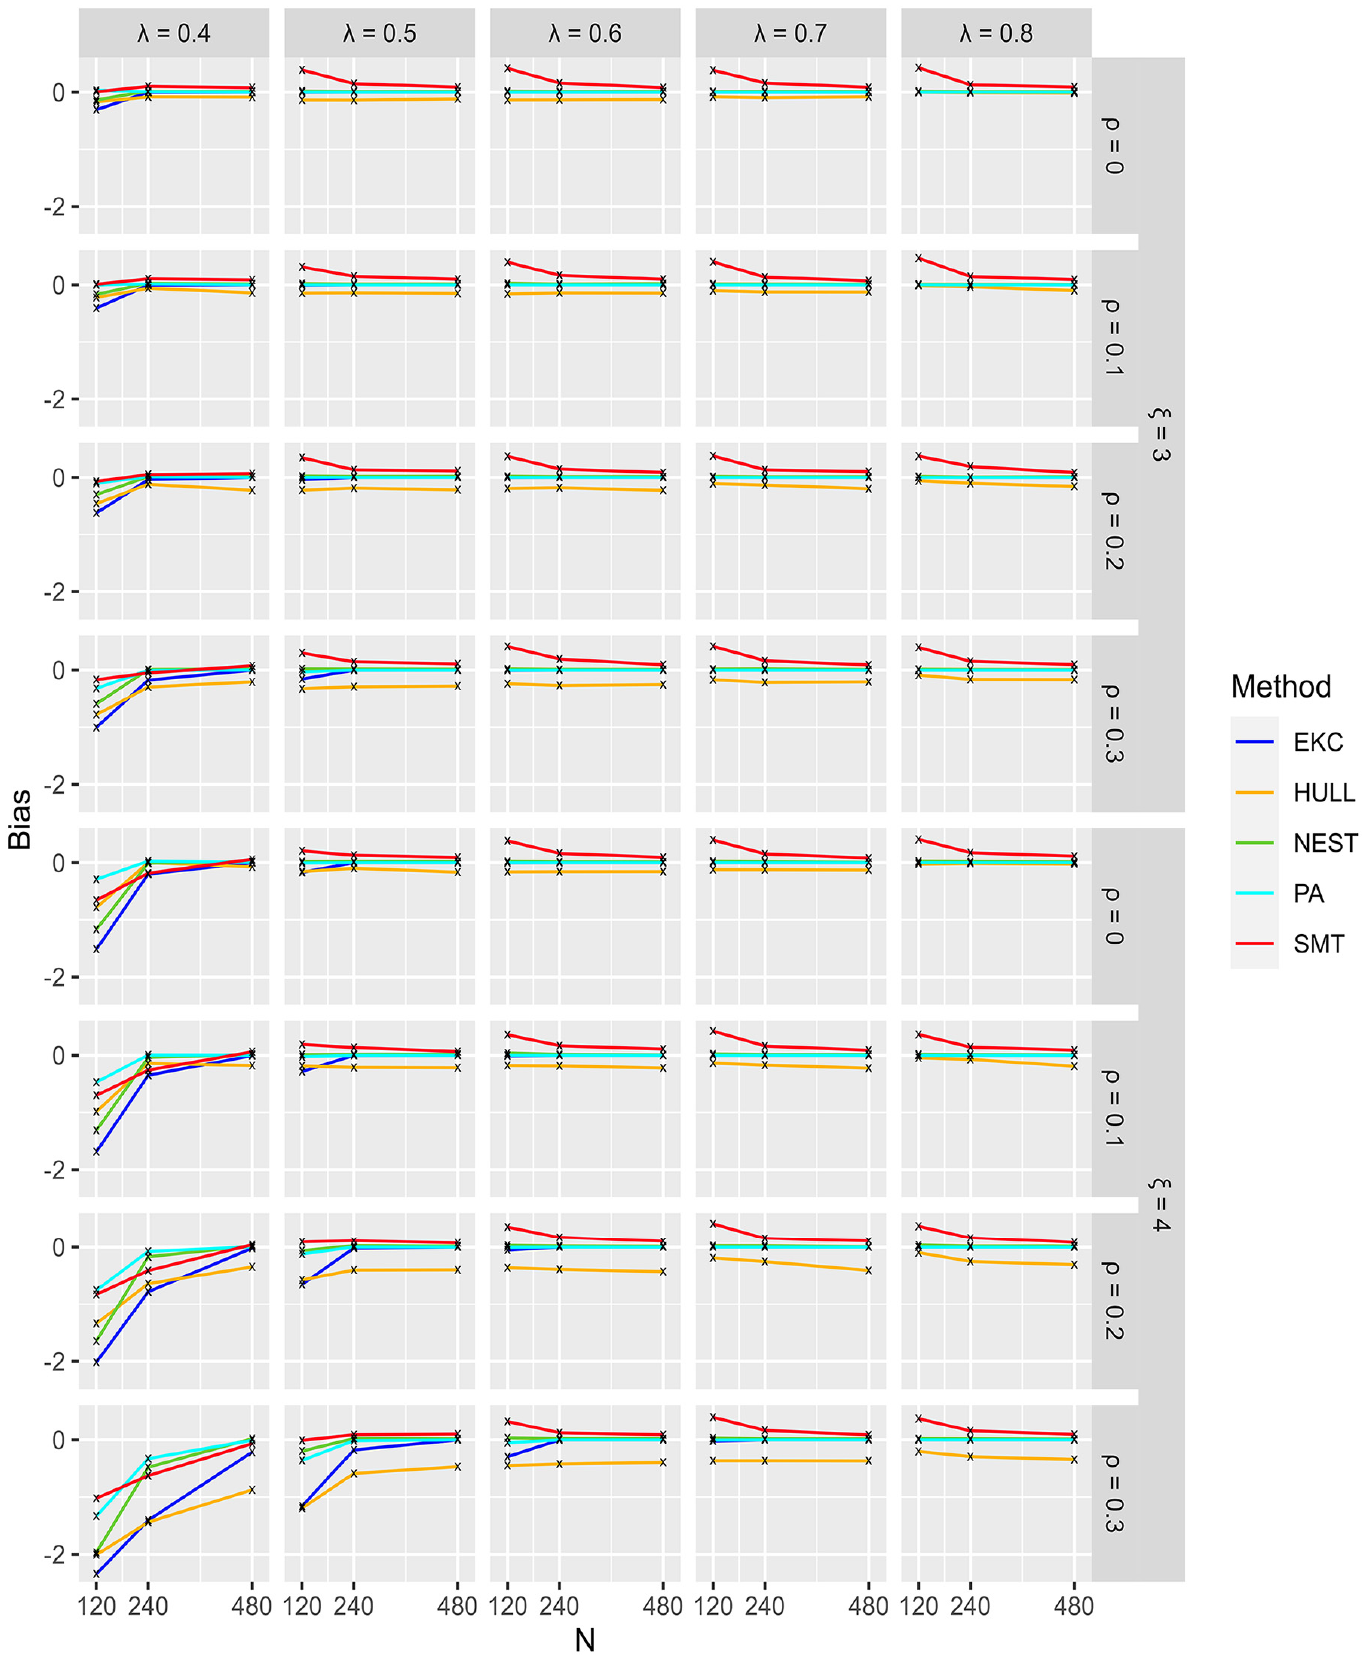
Bias for Conditions With 3 and 4 Factors (Intermediate).
Hard Cases
Figure 5 presents the hardest conditions when the number of factors is
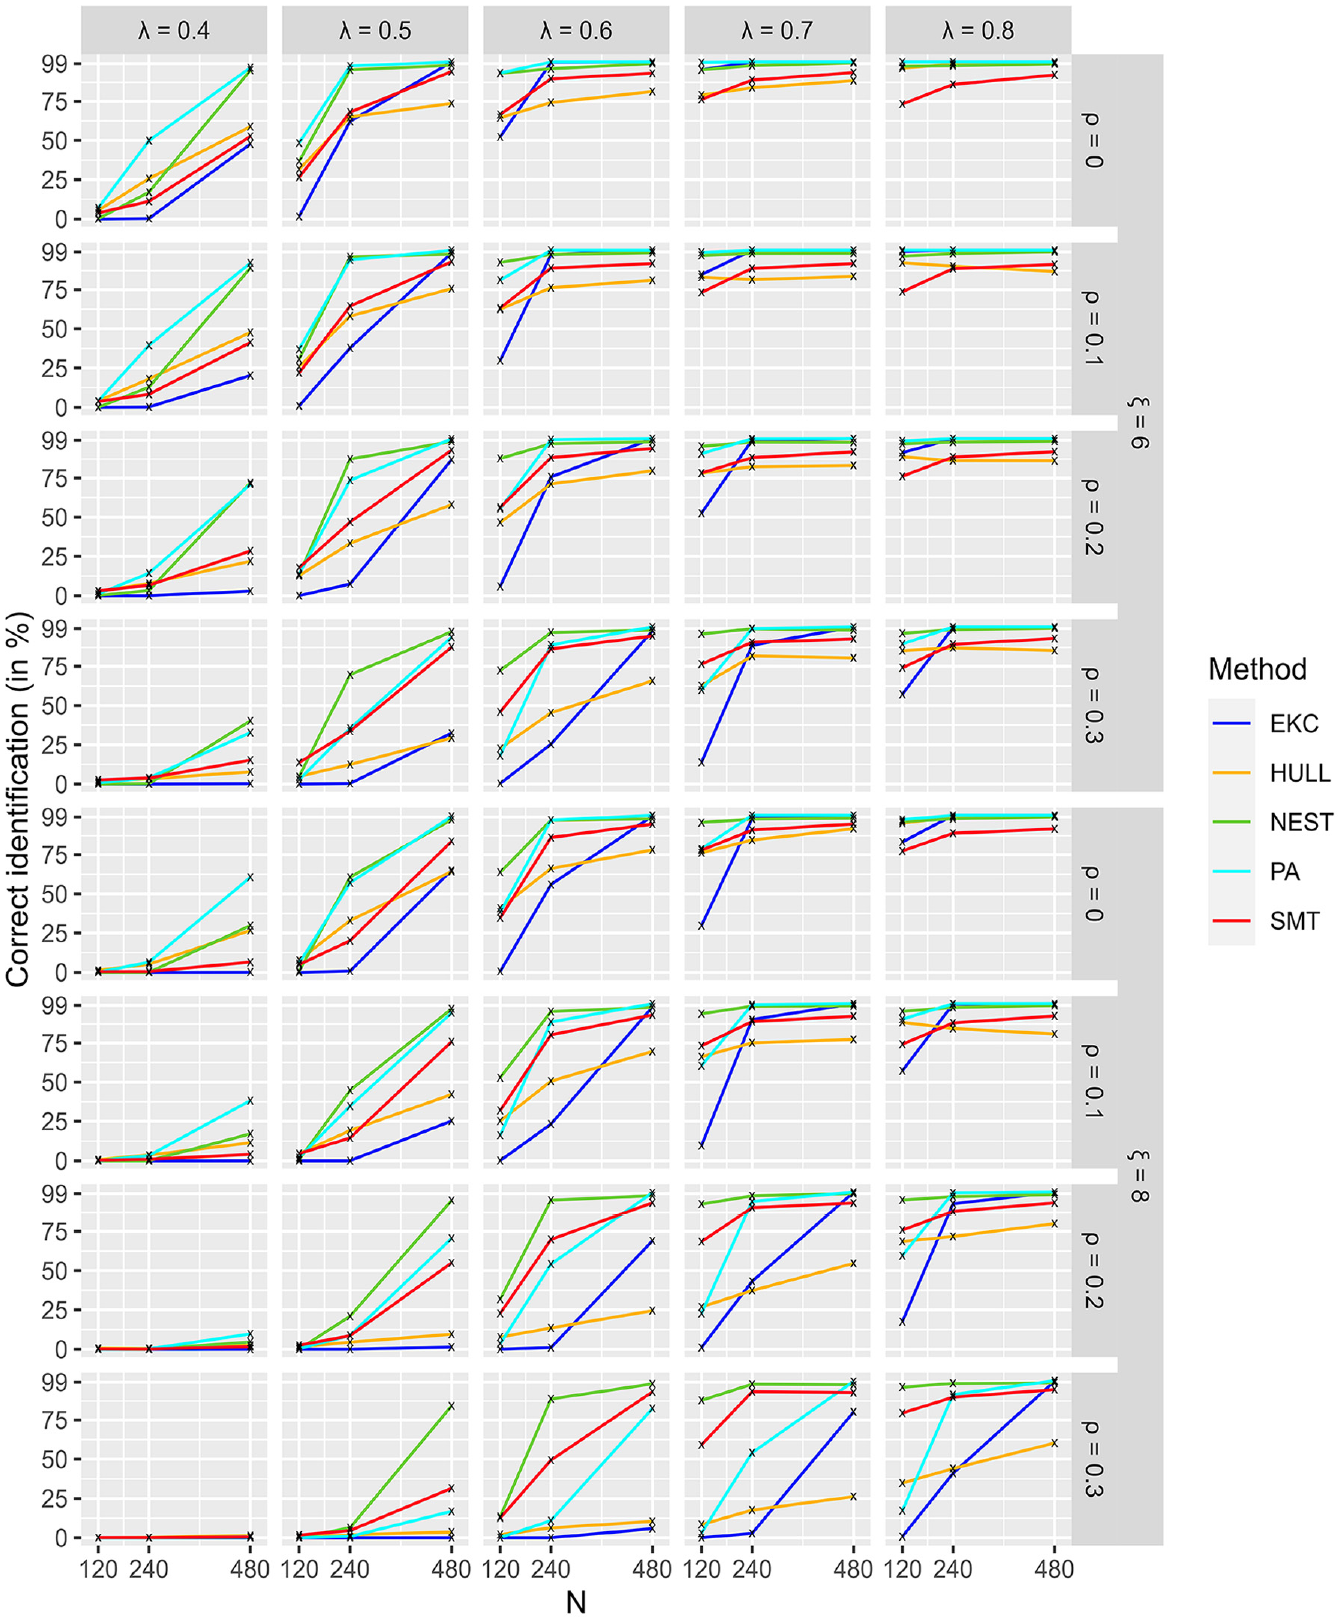
Identification of Dimensionality for Conditions With 6 and 8 Factors (Hard).
Figure 6 shows that all methods had a tendency to underestimate, as expected. Given the already-known fact that SMT overestimated, see Figures 2 and 4, it is not surprising that the stopping rules are less biased than the others.
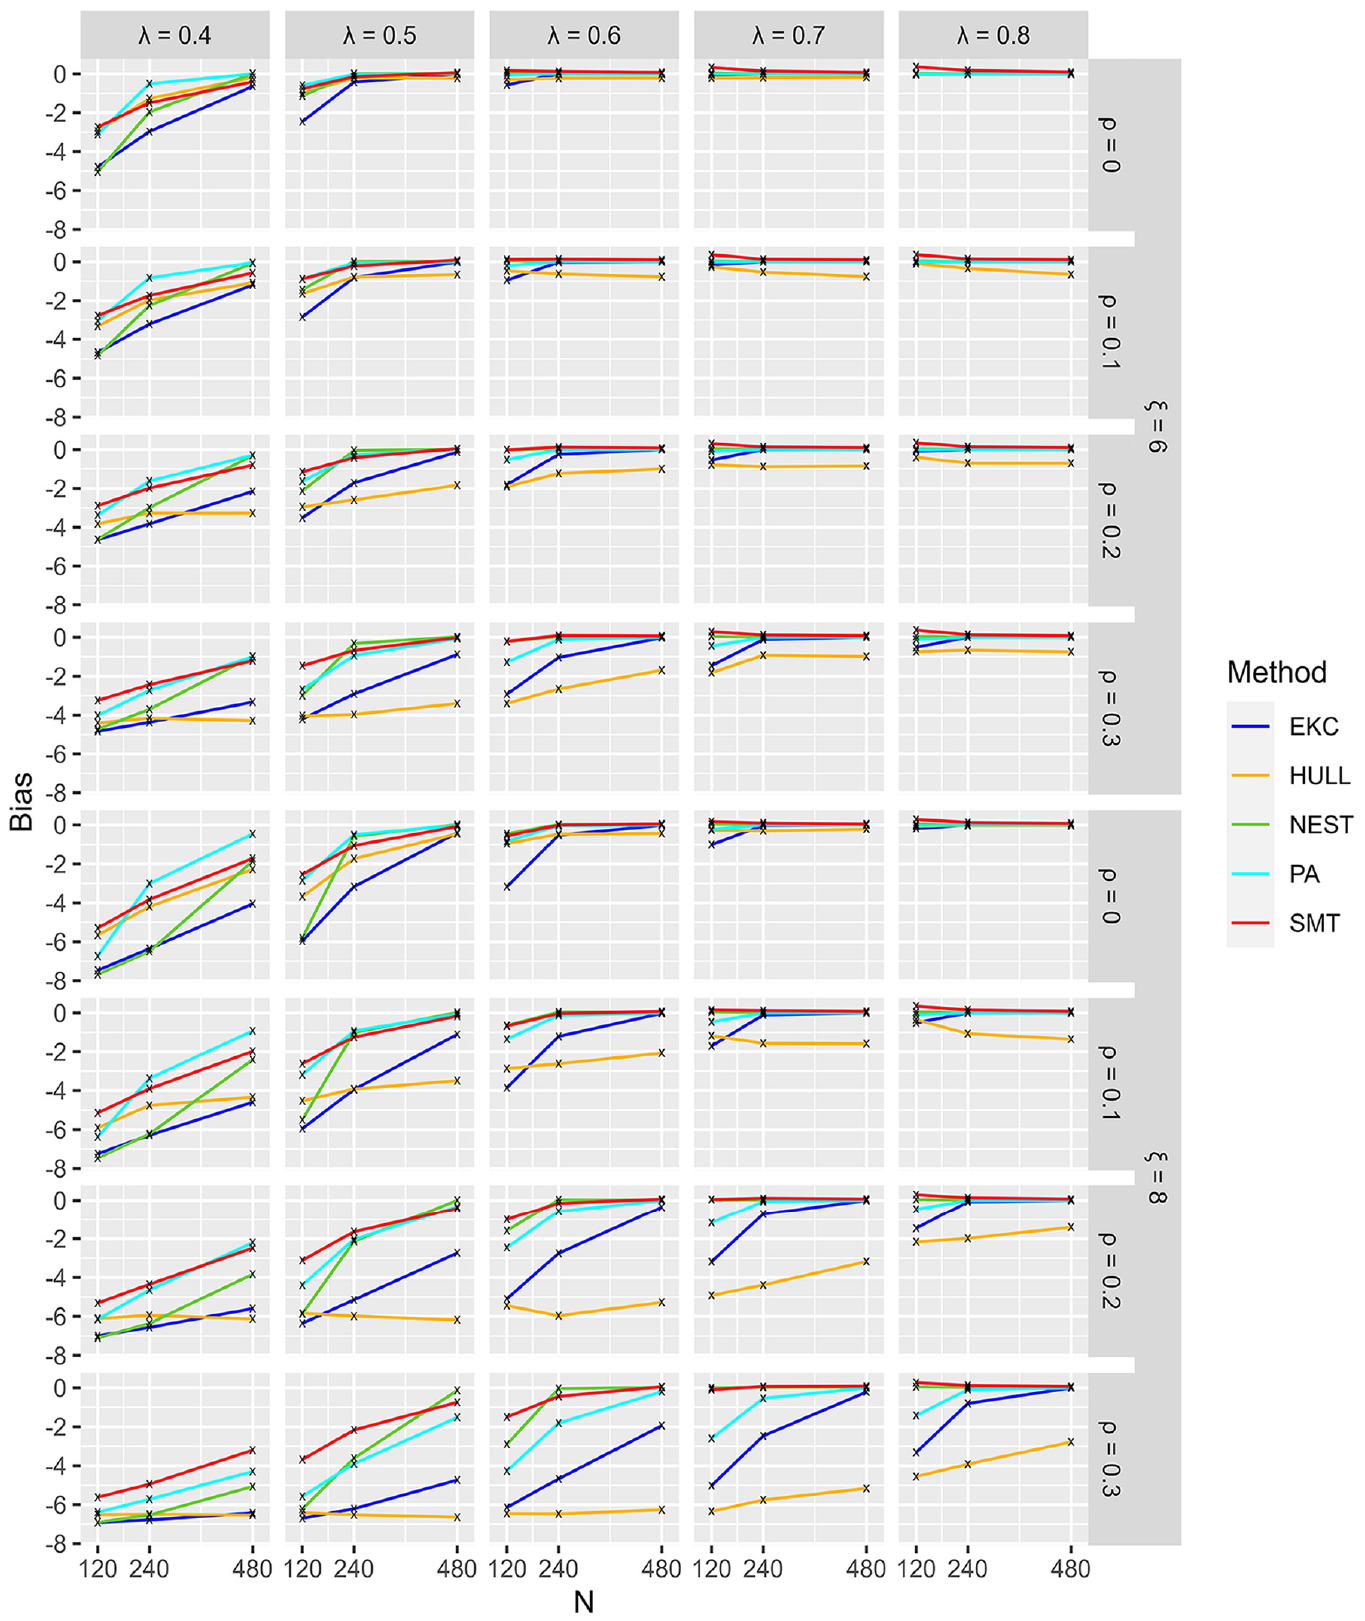
Bias for Conditions With 6 and 8 Factors (Hard).
Discussion
The purpose of the current study was to present the stopping rules NEST and compare its performance against four recommended stopping rules. Overall, NEST showed the best performance, especially in difficult conditions. NEST was good at identifying small but meaningful factors (very small eigenvalues). It was followed by PA who sometimes outperformed NEST, partially due to PA being more liberal by using the average sampled eigenvalues, whereas NEST used the more conservative 95th percentile. This, however, was only beneficial in the
The current study extends previous work by investigating recommended stopping rules, ensuring that EFA methodologies are up-to-date with the latest techniques. By focusing on the performance of stopping rules under difficult conditions, which have been less frequently addressed (Caron, 2019), the study demonstrates the robustness of NEST in challenging scenarios, encouraging its broader adoption in EFA. Comparing NEST with recommended stopping rules ensures that simulations results can be analyzed, disentangled, and synthesized effectively. There are always new methods to investigate and compare, such as the Comparison Data Forest (Goretzko & Ruscio, 2024; combining machine learning techniques with comparison data method), methods based on minimizing out-of-sample prediction error across EFA models (Haslbeck & van Bork, 2024), and signal cancelation factor analysis (Achim, 2024), which recovers each factor with at least two unique indicators by canceling their common factor signal. Future studies should be carried out to investigate the state of the art in determining the number of factors in factor analysis.
Limits
The current simulations have some limits. First, factor structures had uniform loadings across factors. That means that eigenvalues of each factor were the same in the population correlation matrix. Similarly, the correlations between factors were the same for all factors, which was captured by the first eigenvalues at the population level. These limits seem warranted to avoid an overcrowded design that would be harder to interpret, but it would be an interesting step further for comparing stopping rules. Another limit is that the data generation technique used multivariate Gaussian variables only. A future study could investigate the effect of asymmetrical distribution and, if necessary, implement corrections to increase performance of the stopping rules.
Another conceptual limit regarding NEST, but all techniques based on eigenvalues, such as PA and EKC also, is that the
Conclusion
The purpose of the current study was to compare the performance of NEST against four recommended stopping rules (PA, HULL, EKC, and SMT). Overall, NEST showed the best performance, especially in challenging conditions where it had to detect small but meaningful factors. PA followed closely, sometimes outperforming NEST, mainly due to being more liberal. While most techniques performed well in easy scenarios, NEST particularly stood out in difficult ones. Some limitations of NEST were addressed. Future studies should investigate and compare stopping rules with more realistic and varied factor structures, such as non-Gaussian variables, ordinal variables, different importance of factors, and various correlation patterns between factors.
Supplemental Material
sj-pdf-1-epm-10.1177_00131644241308528 – Supplemental material for A Comparison of the Next Eigenvalue Sufficiency Test to Other Stopping Rules for the Number of Factors in Factor Analysis
Supplemental material, sj-pdf-1-epm-10.1177_00131644241308528 for A Comparison of the Next Eigenvalue Sufficiency Test to Other Stopping Rules for the Number of Factors in Factor Analysis by Pier-Olivier Caron in Educational and Psychological Measurement
Footnotes
Acknowledgements
The author would like to thank André Achim for his helpful comments on an earlier draft of this paper.
Declaration of Conflicting Interests
The author declared no potential conflicts of interest with respect to the research, authorship, and/or publication of this article.
Funding
The author received no financial support for the research, authorship, and/or publication of this article.
Consent for Publication
The author agrees that the work is ready for publication.
Supplemental Material
Supplemental material for this article is available online.
References
Supplementary Material
Please find the following supplemental material available below.
For Open Access articles published under a Creative Commons License, all supplemental material carries the same license as the article it is associated with.
For non-Open Access articles published, all supplemental material carries a non-exclusive license, and permission requests for re-use of supplemental material or any part of supplemental material shall be sent directly to the copyright owner as specified in the copyright notice associated with the article.