
Abstract
In psychological research, respondents are usually asked to answer questions with a single response value. A useful alternative are interval response formats like the dual-range slider (DRS) where respondents provide an interval with a lower and an upper bound for each item. Interval responses may be used to measure psychological constructs such as variability in the domain of personality (e.g., self-ratings), uncertainty in estimation tasks (e.g., forecasting), and ambiguity in judgments (e.g., concerning the pragmatic use of verbal quantifiers). However, it is unclear whether respondents are sensitive to the requirements of a particular task and whether interval widths actually measure the constructs of interest. To test the discriminant validity of interval widths, we conducted a study in which respondents answered 92 items belonging to seven different tasks from the domains of personality, estimation, and judgment. We investigated the dimensional structure of interval widths by fitting exploratory and confirmatory factor models while using an appropriate multivariate logit function to transform the bounded interval responses. The estimated factorial structure closely followed the theoretically assumed structure of the tasks, which varied in their degree of similarity. We did not find a strong overarching general factor, which speaks against a response style influencing interval widths across all tasks and domains. Overall, this indicates that respondents are sensitive to the requirements of different tasks and domains when using interval response formats.
Keywords
Introduction
In psychological research, respondents usually provide one response value for each question, predominantly through categorical (e.g., Likert-type-type scales; Likert, 1932) or continuous response formats (e.g., visual analogue scales; Hayes & Patterson, 1921). Often it might be useful to give respondents the opportunity to provide a range of response values through an interval response format, such as the dual-range slider (DRS) shown in Figure 1. Respondents set a lower and an upper bound on a continuous, bounded scale to indicate a whole range of response values. Each interval response can be conceptualized in terms of its location and width on the response scale.

Dual-Range Slider (DRS) Response Format.
Interval Measurement: Substantive Domains and Psychological Constructs
Interval responses can be used in various substantive domains to measure psychological constructs that, based on the underlying theory, require more than just one response value. The construct of interest may be operationalized via specific questions or tasks that use the DRS as a response format. For example, a domain in which interval measurement might be useful is research on Personality. In personality questionnaires, respondents can indicate to which degree trait-related behaviors and cognition differ across certain periods and contexts by setting a lower and an upper bound of agreement to a particular item (Kloft et al., 2024). In the Personality domain, the psychological construct of interest underlying interval widths thus concerns the variability of traits.
Another domain where interval responses are already widely used is the Estimation of quantities that are known or can in principle be known. Applications of interval responses in this domain include forecasting of future events or risks via interval forecasts, sometimes also termed probability intervals (Soll & Klayman, 2004; Speirs-Bridge et al., 2010), or of other target values in judgment and decision-making (Cubitt et al., 2015). In these applications, interval responses can also be used in conjunction with the wisdom of the crowd to obtain optimal judgments or forecasts via the weighted aggregation of intervals (Ellerby & Wagner, 2022; Grushka-Cockayne & Jose, 2020). In the Estimation domain, the psychological construct that is the target of measurement is the subjective uncertainty or confidence indicated by the interval width.
Interval widths may also reflect interindividual differences in expertise if individuals are able to judge the accuracy of their own estimates. When the target quantity is known, the calibration of uncertainty judgments can be evaluated by comparing the respondents’ estimates to the true values or outcomes of the event. Specifically, calibration is defined as the proportion of response intervals containing the true value compared to a particular confidence level specified in the task instructions. For instance, if a respondent is required to give interval responses at a confidence level of 90%, but only 73% of their intervals contain the true value, they are overconfident (i.e., their response intervals are too narrow). However, if 98% of response intervals contain the true value, that respondent is underconfident (i.e., their intervals are too wide).
A third domain where interval measurement can be of interest is Judgment. This domain is similar to Estimation in that we are interested in the expertise of respondents. However, for the target items to be judged, there are no clear-cut, true values attainable. This is typically the case for stimuli that have different meanings for different respondents. For instance, individuals are likely to think of different probabilities when being confronted with verbal quantifiers such as “seldom,”“often,” or “likely” (Budescu & Wallsten, 1985; Harris et al., 2017; Karelitz & Budescu, 2004). Each particular quantifier can be thought of as a probability interval with which the occurrence of an event can be described. A corresponding question could be: “He seldom smokes at parties. What is the probability of him smoking at tonight’s party?” Importantly, there exists no objectively correct, precise meaning in terms of probability because the adjective “seldom” may have different meanings for different individuals, groups, or contexts. Therefore, the target construct to be measured by interval widths in this domain is the ambiguity of judgments.
The psychological constructs of variability in personality, uncertainty in estimation, and ambiguity in judgments differ distinctly. However, it is not clear whether respondents are sensitive to these distinctions in their use of the interval response format (Kloft et al., 2024). This leads to the question of whether interval responses are valid for measuring distinct psychological constructs, especially with respect to the width of intervals. This article thus aims to investigate the factorial structure of interval response widths across multiple task domains that are qualitatively different.
Factorial Structure of Interval Widths
To draw valid inferences about the target constructs of variability, uncertainty, and ambiguity, it is necessary to test whether the psychometric properties of interval responses are of sufficient quality (American Educational Research Association, 2011). This concerns two aspects: interval locations and interval widths. Ellerby et al. (2022) found that respondents were able to adequately indicate the variability of objective and subjective stimuli with an interval response format. Regarding convergent validity with visual analogue scales, interval locations of the DRS have been shown to be suitable for measuring the central tendency of the traits Extraversion and Conscientiousness (Kloft et al., 2023, 2024). In addition, Kloft et al. (2024) found good test–retest reliability for factor scores of both interval locations and interval widths collected via the DRS format.
However, high test–retest reliability of interval responses might stem from unwanted sources like response styles. Respondents might not adhere to the specific task instructions or show sensitivity to different task requirements. Instead, they might respond in a certain, preferred way across all items and domains (e.g., by setting the interval to a certain width for all items). Preliminary evidence for response styles emerged in a study by Kloft et al. (2024), where the factor scores for the interval width were highly correlated between Extraversion and Conscientiousness
In this article, we focus on continuous, bounded scales like the DRS. Another threat to validity may be the way respondents interpret this response format in a particular task. For example, respondents might not be able to retrieve the information required to judge the variability of trait-related behaviors and cognition from memory (Ellison et al., 2020; Leertouwer et al., 2022). As a consequence, subjective uncertainty may influence responses to trait questions that are rather intended to measure variability. These threats to validity suggest that further tests of the discriminant validity of the DRS response format are required. The core question is whether the width of response intervals is suitable for measuring different psychological constructs such as variability, uncertainty, and ambiguity. A necessary condition for doing so is discriminant validity.
This study tests whether interval widths represent more than just a response style for a preferred interval width. The consequence of such a response style would be that some respondents generally answer with narrow intervals (e.g., 5% of the response scale) and others with wide intervals (e.g., 50% of the response scale) across substantively different tasks, irrespective of the specific task’s content. We test this by administering 92 items from the domains of Personality, Estimation, and Judgment in the DRS response format. We focus on these three domains since they are unrelated in terms of the underlying constructs of interest (i.e., variability, uncertainty, and ambiguity). Hence, it is plausible to assume that the latent constructs to be measured by the interval width are independent of each other. Consequently, respondents’ sensitivity to the requirements of different tasks should be reflected by factors underlying the observed interval widths. In contrast, a general response style would result in a single latent dimension or in a high correlation of factors.
We focus only on the width of response intervals because the location of intervals cannot meaningfully be compared across different domains (e.g., in Personality, locations correspond to the central tendency of a trait, whereas in Estimation, they depend on the true value of the quantity to be estimated). We investigate the factorial dimensionality of interval widths via exploratory and confirmatory factor analyses. First, exploratory factor analysis (EFA) is used to determine the number of factors and investigate the pattern of factor loadings. Ideally, the number of factors and the pattern of loadings should correspond to the substantive domains and the specific tasks. Convergent validity is indicated by high correlations of interval widths within each domain, and thus, by high loadings on domain- or task-specific factors. For example, some respondents may generally be confident in their election forecasts, resulting in narrow intervals in all corresponding items, whereas others may be less confident, resulting in wide intervals. Discriminant validity is indicated by low cross-loadings of interval widths on factors that belong to substantively different domains or tasks. This prediction rests on the assumption that respondents’ variability, uncertainty, and ambiguity are unrelated. For instance, a respondent’s trait variability is expected to be unrelated to their subjective uncertainty in the forecasting of election outcomes or in estimating the frequency of presented dots (see section “Measures and Tasks”).
Second, we want to investigate preference response styles, that is, whether response intervals are influenced by a general preference for a particular interval width. For this purpose, we use confirmatory factor analysis (CFA), more specifically, a bifactor model. We specify the factorial structure derived from the task structure and the structure found in the EFA as domain-specific factors and add a general factor across all items of all tasks and domains. Loadings on this general factor indicate a general preference of respondents for a particular width of response intervals for DRS items across all domains.
For all factor analyses, we first apply a suitable logit transformation as a link function (see section “Logit Transformation of Continuous, Bounded Interval Responses”) to deal with the statistical challenges posed by continuous, bounded interval responses (Smithson & Broomell, 2024). In conclusion, this article investigates the factorial structure of interval response widths across different tasks and psychological domains.
Method
To investigate the dimensional structure of interval widths across different psychological domains, we conducted an online study featuring multiple applications of interval responses. For this purpose, we selected tasks from domains that are highly different from each other so that we can assume independence of the underlying constructs to be measured.
Procedure
For the Personality domain, where interval widths should reflect trait variability, we let respondents rate their Extraversion and Conscientiousness. There is no substantive reason to expect a correlation of the respective interval widths with those of other tasks in other domains such as election forecasting. We administered four tasks for the Estimation domain in which interval widths should reflect subjective uncertainty. First, respondents had to estimate the percentage of purple compared to green dots on a panel. Second, respondents had to forecast the percentage of votes political parties would claim if there was an upcoming election. Third, respondents had to estimate the percentage of deaths due to a certain illness or condition (e.g., cardiovascular disease) in a particular year, and fourth, the percentage of missed days at work due to a certain reason for incapability to work (e.g., mental health issues). Overall, the Estimation domain included both highly distinct tasks (color-dot estimation and election forecasting) as well as similar tasks (estimating the proportions for death causes or reasons for incapability to work). This enables us to investigate the degree of independence of interval widths between different tasks within a domain. Finally, for the Judgment domain, where intervals are used to measure ambiguity, respondents had to judge verbal quantifiers (e.g., “seldom” or “often”).
We presented the items in separate blocks for each task. The order of blocks was randomized except for the Personality domain. The first block always presented the Extraversion and Conscientiousness scales because the items involved self-ratings, which afforded instructions different from the remaining tasks. In each block, the items for the specific task were presented in randomized order. We always presented only one item per page, which had to be answered to proceed to the next page.
We used slightly different versions of the slider response scale to meet the specific requirements of each task. Details on the task-specific slider response scales are provided in section “Measures and Tasks.” Importantly, the numeric values of the lower and upper boundary of response intervals were shown to respondents only when required for the particular task (e.g., when forecasting the percentages of votes for parties in election outcomes).
Instructions also differed between blocks to suit the requirements of each task. For the Personality block, respondents had to indicate how well an adjective described their personality overall by moving the interval closer to the left or right limit of the response scale. Furthermore, they were asked to provide a wider interval if they perceived their behaviors and cognition to be more variable across different situations in the past 12 months, and more narrow if they perceived themselves to be more similar over different situations. In the tasks involving the estimation of percentages (i.e., election forecasting, color-dot estimation, and estimation of death causes and reasons for incapability to work), respondents were instructed to provide a lower and an upper bound of an interval containing the true value with 90% confidence. For the judgment task concerning verbal quantifiers, we asked respondents to give a lower and an upper bound of the probability (e.g., of the occurrence of an event described in such a way) that a word could represent in its pragmatic use.
Sample
Data collection of our online study proceeded in the winter semester of 2022/23 at the University of Marburg. The study was performed in line with the guidelines of the German Psychological Society (DGPs). The Department of Psychology at the University of Marburg grants an exemption from ethics approval for online studies such as ours, where there is no deception of participants and no sensitive topics or materials are presented to participants. Informed consent for participation in the study and publication of the anonymized data in an open-access repository was obtained from all participants.
The original sample consisted of 253 respondents, predominantly psychology students. We excluded nine respondents who indicated not to have participated seriously. Furthermore, we excluded eight respondents with high mean scores (smaller or greater than
Measures and Tasks
The list of all items can be found at the Open Science Framework (OSF) repository (https://osf.io/67vyj/).
Extraversion
The Extraversion scale contained 15 person-descriptive adjectives from the 360-PDA and 525-PDA inventories of the International Personality Item Pool (IPIP; Goldberg, 1999) translated to German by Kloft et al. (2024). We selected adjectives that performed well in a previous study in terms of discrimination parameters and also showed a good spread over the parameter range in terms of item locations (i.e., difficulties). When using the logit-transformed interval midpoints as Extraversion scores, McDonald’s
Respondents had to indicate how well the respective adjective applied to them on a scale from 1 = not at all (slider fully to the left) to 99 = fully and completely (slider fully to the right). The lower and the upper slider had to be at least one point apart. The continuous response scale showed no numerical values but tick marks for the center and the first and fourth quarters.
Conscientiousness
The Conscientiousness scale contained 15 person-descriptive adjectives from the 360-PDA and 525-PDA inventories of the IPIP (Goldberg, 1999) translated to German by Kloft et al. (2024). The selection process was the same as for the Extraversion scale. Using the interval midpoints as Conscientiousness scores, McDonald’s
Color-Dot Estimation
Respondents had to estimate the percentage of purple vs. green dots shown in a quadratic panel like the ones displayed in Figure 2. We presented 20 panels on separate pages. The relative frequencies of purple dots ranged from 5% to 95% and were randomly drawn from a uniform distribution. Respondents had to rate the percentage of purple dots on a response scale from 0% to 100% where both sliders had to be at least 1% apart. The numerical values of the lower and upper bound were displayed above the corresponding sliders.
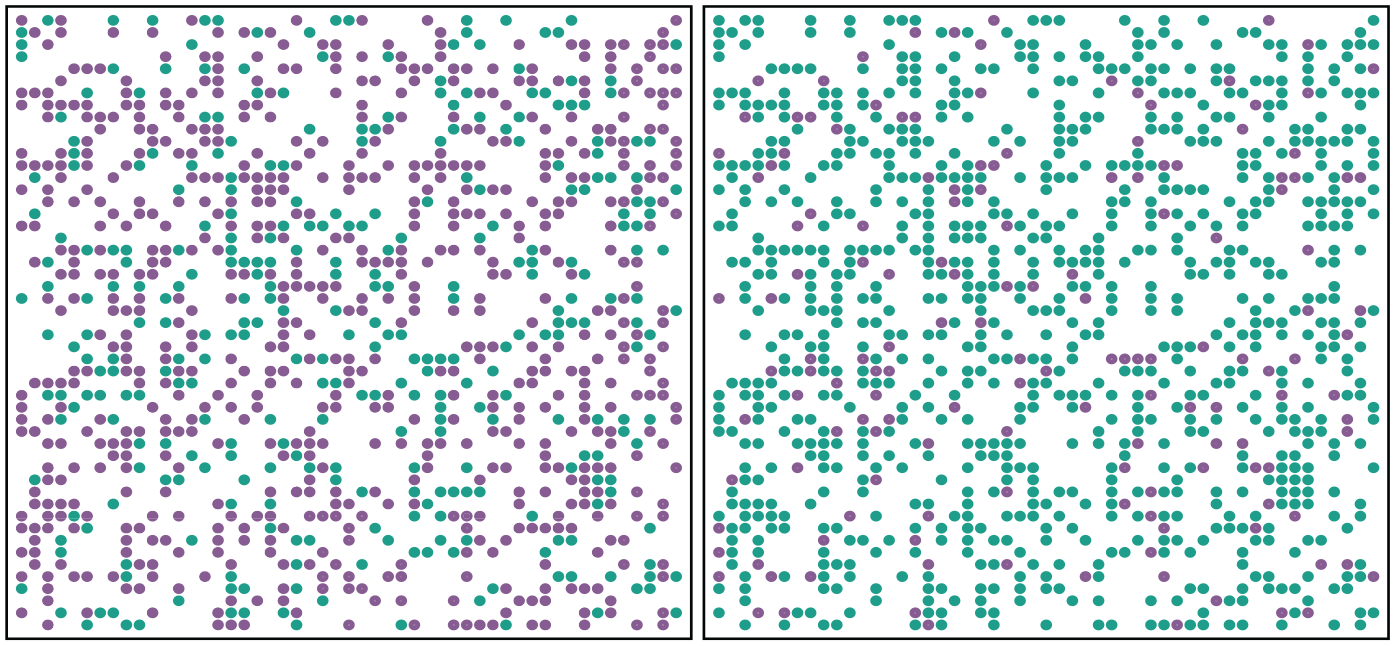
Stimulus Examples: Color-Dot Estimation Task.
Election Forecasting
Respondents had to forecast the outcomes of a hypothetical election of the German federal government if it were to take place on the following Sunday. We focused on the six parties represented in the parliament at the time of data collection plus the category “all other parties.” Respondents were asked to provide a lower and an upper bound for the percentage of votes that they estimated a party to receive. The (true) percentages in the previous federal election in 2021 ranged from 3.4% (all other parties) to 25.7% (Christian Democratic Union / Christian Social Union). Therefore, the response scale ranged from 0.1% to 49.9%, where the lower and upper slider had to be at least 0.1% apart. The numerical values were displayed above the two sliders so that respondents were aware of the reduced range of the response scale.
Death Causes
Respondents had to estimate the percentage of all deaths that could be attributed to one of the nine most prevalent death causes in the year 2020 (Statistisches Bundesamt Deutschland, 2024). Since the true percentages ranged from 3.6% (diseases of the nervous system) to 34.3% (diseases of the vascular system), the response scale ranged from 0.1% to 49.9% where both sliders had to be at least 0.1% apart. Again, numerical values were displayed above the corresponding sliders.
Reasons for Incapability to Work
Respondents had to estimate the percentage of absent days from work that could be attributed to one of the 10 most prevalent reasons for incapability to work in the year 2022 (Schumann et al., 2022). The true percentages ranged from 4.1% (diseases of the vascular system) to 23.2% (diseases of the musculoskeletal system). The response scale was the same as that used for estimating the percentages of death causes.
Verbal Quantifiers
We asked respondents to judge verbal quantifiers such as “seldom” or “often” in terms of probability. We also included the verbal quantifiers “never,”“always,” and “50-50 chance” as control items for which both sliders should be set to the extreme left, the extreme right, or the center of the response scale, respectively. Since we asked respondents for probabilities, we had them answer on a scale from 0% to 100% where both sliders could be set to the same value, and the numerical values were displayed above the corresponding sliders.
Logit Transformation of Continuous, Bounded Interval Responses
The statistical analysis of continuous, bounded interval responses (e.g., collected via the DRS response format) presents challenges that are inherent to the response format. First, on bounded response scales, the response value(s), that is, the two sliders, are constrained by the scale limits, which usually results in skewed response distributions (Verkuilen & Smithson, 2012). Second, in interval response formats, the two response values are mutually constrained by each other because the lower interval bound must be below the upper interval bound. These interdependencies between the user-specified interval bounds and the predetermined response-scale limits result in a complex relation between interval location and width. If a respondent places the location of the response interval (defined by the midpoint) closer to one of the scale limits, at some point, they are forced to reduce the width of the interval (defined by the difference between the upper and the lower bound). In the raw response data, this will be reflected by a negative correlation between the interval width and the absolute deviance of the interval location from the center of the response scale (i.e., a nonlinear relationship; Kloft et al., 2023).
To deal with these challenges posed by continuous, bounded interval responses, Smithson and Broomell (2024) proposed to treat response intervals as compositional data. Essentially, each interval is transformed with an appropriate logit transformation, which acts as a link function analogous to logistic regression or other generalized linear models. Smithson and Broomell (2024) proposed two transformations: (a) an isometric log-ratio transformation and (b) a transformation using a “stick-breaking” procedure. The method for fitting a factor analysis is then as follows: We first transform the observed interval responses to the compositional data format (see Equation 1). Subsequently, we apply one of the two logit transformations (see Equation 2) before fitting the factor analytic model. In the following, we describe this procedure in more mathematical detail.
Each response interval partitions the response scale into three components through the lower bound X
L
(left slider) and the upper bound X
U
(right slider). Assuming that the raw responses are scaled to the unit interval,

Essentially, Y1 is the segment between the lower scale limit and the left slider, Y2 is the segment that resembles the width of the response interval, and Y3 is the segment between the right slider and the upper scale limit. In the following, we assume that none of the components is zero, that is, 0 < XL < XU < 1. If this is not the case, it is necessary to first rescale the untransformed responses (see Appendix), which we did for all the interval responses in our study.
We then transform the interval responses from the compositional format to a bivariate, unbounded space via the isometric log-ratio transformation:
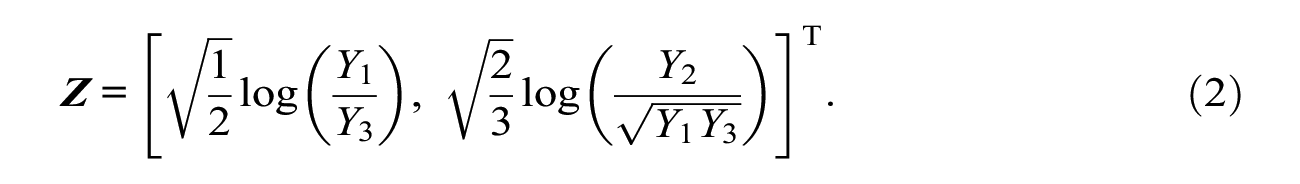
We choose this transformation because it compensates for the fact that interval locations closer to one of the response-scale limits will yield smaller interval widths. This is done by considering the log-ratio between Y2 (interval width) and the geometric mean of Y1 and Y3 (the components left and right to the interval, determining the location). Essentially, this mechanism yields higher transformed widths for small values of either Y1 or Y3, that is, locations toward one of the response-scale limits. Besides relying on the isometric log-ratio transformation, we also reran our analyses using the stick-breaking transformation and the untransformed interval widths. These additional analyses corroborated the superiority of the isometric log-ratio transformation (see section “Robustness Checks”).
The left panel of Figure 3 shows that the untransformed raw values of all interval responses in our study fall into a triangle. This is due to the inherent dependency between the location and width of intervals. In contrast, the transformed logit values (right panel) can more closely be approximated by a normal distribution.
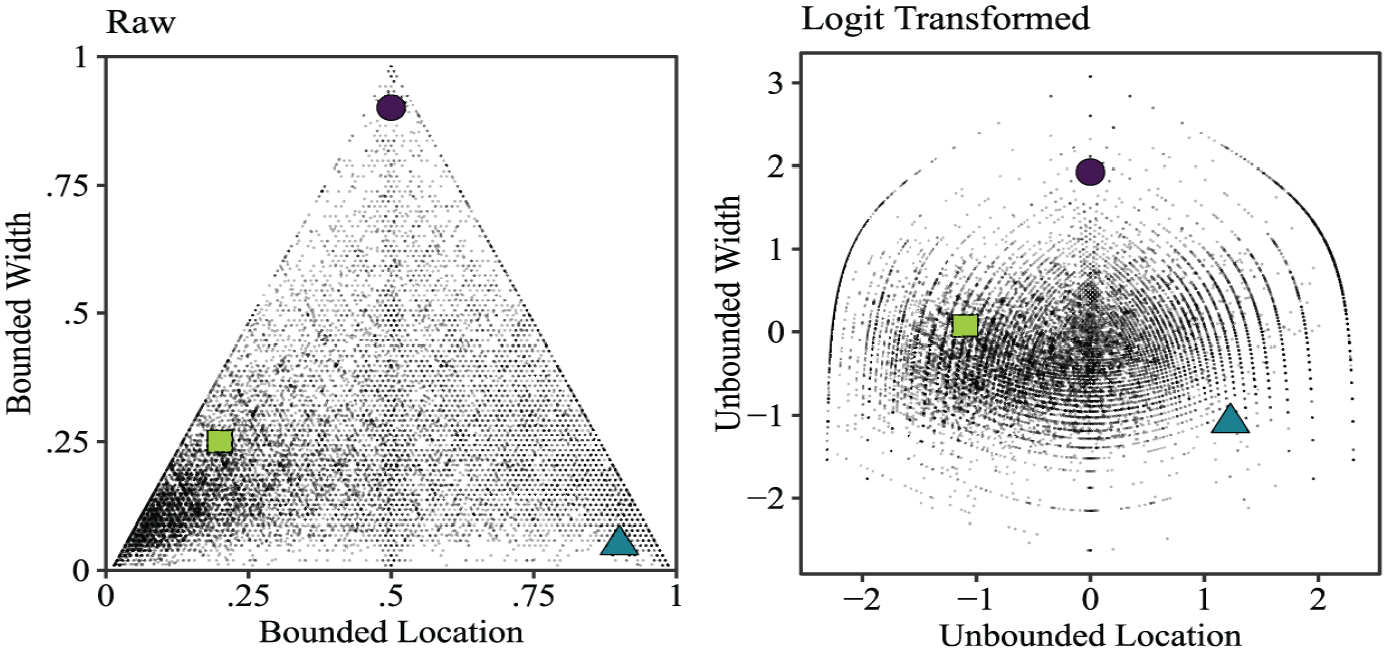
Empirical Distribution of Interval Responses.
In conclusion, applying the logit transformation to interval responses offers several benefits. First, it accounts for the complexity of the data structure in terms of the interdependence of the interval bounds. Second, the transformed data approximately follow a normal distribution in the two-dimensional unbounded space, making them more appropriate for follow-up analyses with EFA and CFA. Finally, the two dimensions can readily be interpreted as “location” and “width” which is important for measuring psychological constructs (i.e., variability, uncertainty, and ambiguity).
Results
Descriptive Analyses
Figure 4 illustrates the empirical distribution of interval responses. Each panel shows all DRS response intervals for one exemplary item as point-wise cumulative frequencies (the plots for all items can be found at https://osf.io/67vyj/). To obtain these plots, the ranges of values contained in all response intervals are accumulated across participants and plotted as absolute frequencies (adapted from the interval agreement approach by Wagner et al., 2015). For instance, if the accumulated frequency for a particular response value x = 20% is y = 90, this means that 90 respondents provided a response interval that included the value 20% for the particular item. The accumulated frequencies are mostly unimodal but can also be multimodel (see Figure 4B).
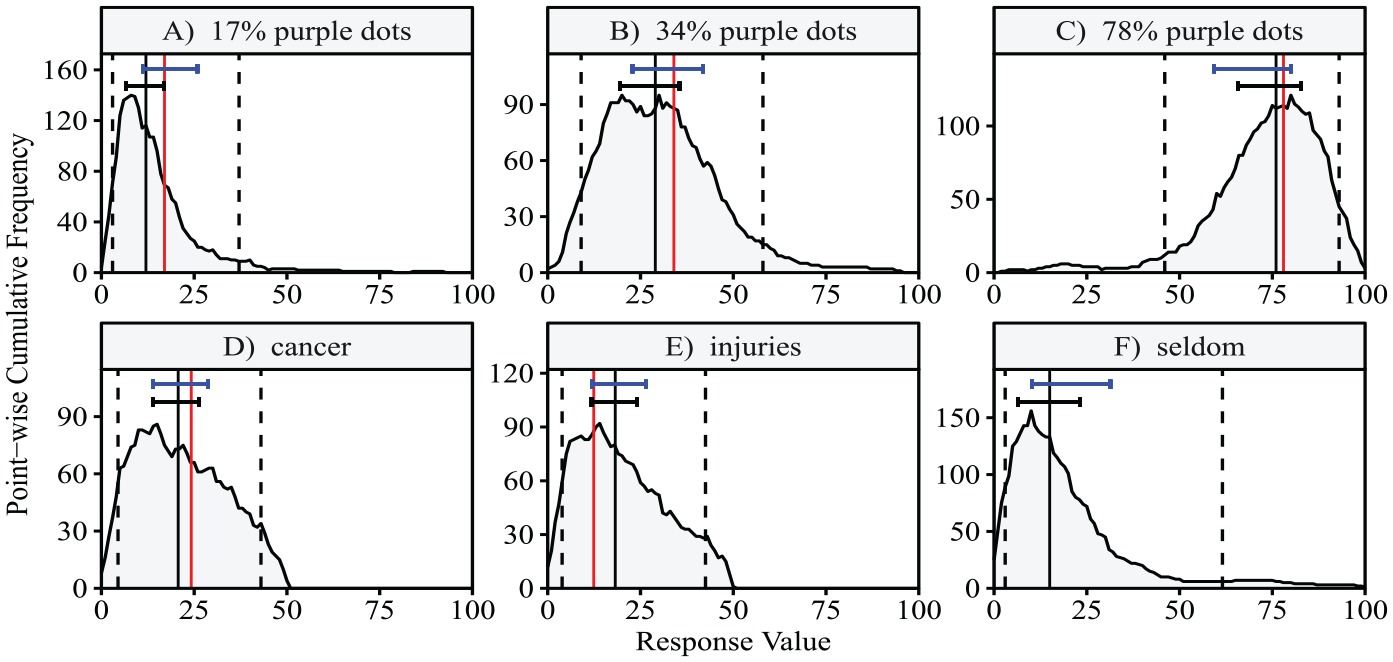
Point-Wise Cumulative Frequency Plots of Interval Responses.
Each panel also shows the median (solid black vertical line), the 5% and 95% quantiles of the respective density (dashed black vertical lines), and the true value where applicable (solid red vertical line). For the color-dot task items, comparing the medians to the true values indicates a tendency for underestimation. Because of the heterogeneity in interval responses, the 5% and 95% quantiles are not particularly informative. As a remedy, we also plotted typical intervals above each density, derived from the mean location and the mean width of all interval responses. The top interval in blue is based on the logit-transformed response intervals while the lower interval in black is based on the untransformed response intervals. The typical intervals based on the untransformed responses are generally closer to the mode of the density than the ones based on the logit-transformed responses. Moreover, the intervals based on the logit-transformed responses are a bit wider, covering the inwardly skewed tails of the empirical distributions. This indicates that they are influenced to a larger degree by the responses on the opposite side of the response scale (see, for example, Figure 4C).
The calibration of interval responses with respect to the true values can be evaluated in the case of estimation tasks. Calibration is defined by the percentage of intervals containing the true value. The mean calibration across all respondents and all items of a respective task was 40.99% for the color-dot estimation task, 40.81% for the estimation of percentages of death causes, and 39.89% for the estimation of percentages of reasons for incapability to work. On average, respondents were not well calibrated in relation to the 90% target confidence required by the instructions. Assessing calibration at the individual level, computed across all items of all estimation tasks, shows a large heterogeneity between respondents. The calibration of respondents was 38.75% on average with 2.5% and 97.5% quantiles of 10.00% and 75.71%, respectively. This corroborates the previous finding that respondents tend to be overconfident (Speirs-Bridge et al., 2010). They provide too narrow intervals that miss the true value more frequently than the instructed target rate.
Exploratory Factor Analysis
All analyses are based on the logit-transformed interval widths and were performed in the computing environment R (R Core Team, 2023). To determine the number of factors to retain, we first ran a parallel analysis using the R package psych (Revelle, 2024). The results provided evidence for six factors. To facilitate the comparison between exploratory and confirmatory factor models, we fitted all models using the R package lavaan (Rosseel, 2012). To cope with missing values, we used full information maximum likelihood estimation, which incorporates all available response intervals. The six-factor EFA model with geomin rotation had an adequate fit as indicated by a root mean square error of approximation (RMSEA) of .054 (95% CI = [.051, .056]) and a standardized root mean square residual (SRMR) of .039.
Figure 5 shows the factor loadings of all items for the six factors. Each column contains the loadings on one of the factors, named according to the predominant task. Each row of panels contains the loadings for all items of one task (also indicated by color) across the six factors.
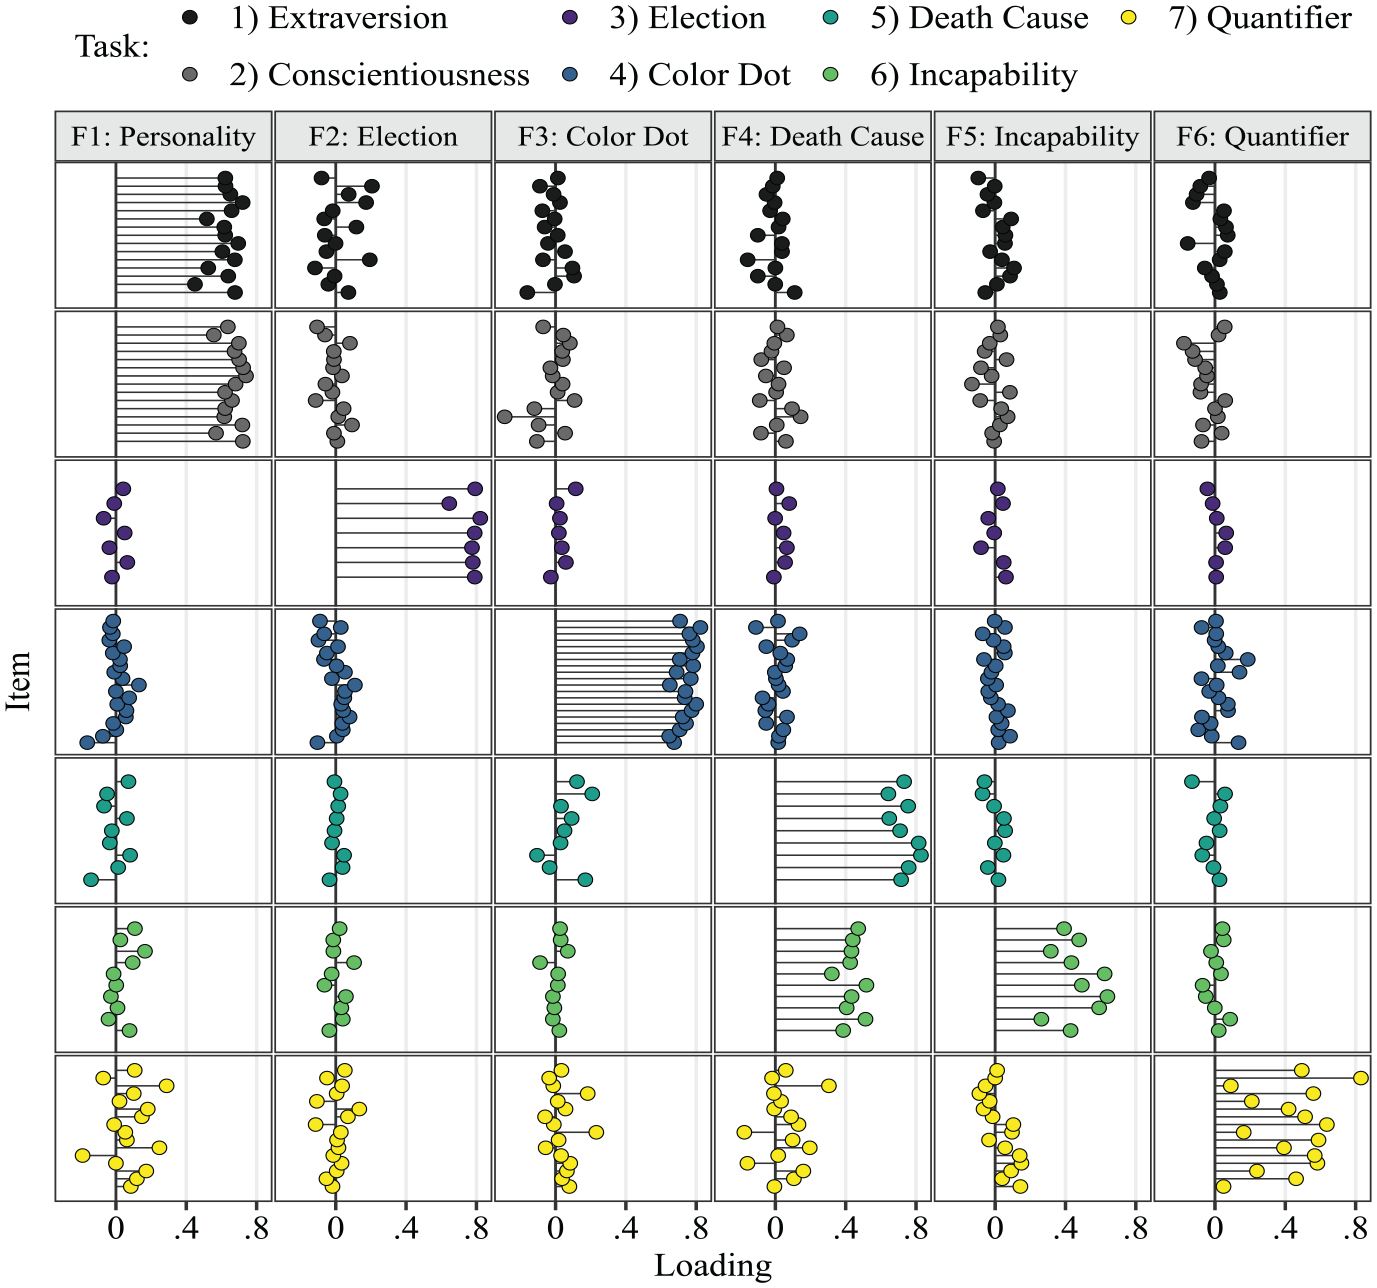
Exploratory Factor Analysis: Factor Loadings.
The results show that the interval widths of all Extraversion and Conscientiousness items share a common factor Personality. All remaining tasks are linked to a separate, proprietary factor. Overall, the loading patterns roughly follow a simple structure as indicated by mostly small cross-loadings on other task factors. The structure of loading patterns suggests that respondents were indeed sensitive to different task instructions. However, for the personality items, respondents did not discriminate between Extraversion and Conscientiousness in terms of trait variability in the corresponding behaviors and cognition. This aligns with previous results providing evidence against the discriminant validity of interval widths regarding Extraversion and Conscientiousness (Kloft et al., 2024). The replication of these results is noteworthy because the analysis by Kloft et al. (2024) was based on a more complex item response theory (IRT) model.
Our theoretical premise for the study was that the different tasks should tap into distinct sources of variance. Consequentially, we wanted to test the task-specific factor structure with even stricter assumptions than in an EFA. We therefore fitted a six-factor CFA model assuming a simple structure with null loadings on task-unrelated factors. More specifically, items were assigned to the six correlated factors depending on the task, with Extraversion and Conscientiousness combined into a common factor. The confirmatory model also had an adequate fit as indicated by an RMSEA of .053 (95% CI = [.050, .055]) and an SRMR of .063. Since we analyzed the same data twice, this is not meant as a confirmation that the found factor structure holds in the population. However, we view this as evidence that the assumption of a simple structure is valid in our sample.
Table 1 shows the factor correlations of both the EFA and the CFA. The correlations in the CFA were mostly higher due to the enforced simple structure. Factors with high cross-loadings in the EFA were more strongly correlated in the CFA (e.g., estimation of percentages of death causes and of reasons for incapability to work).
Correlations Between (Specific) Factors of the Three Factor Models.
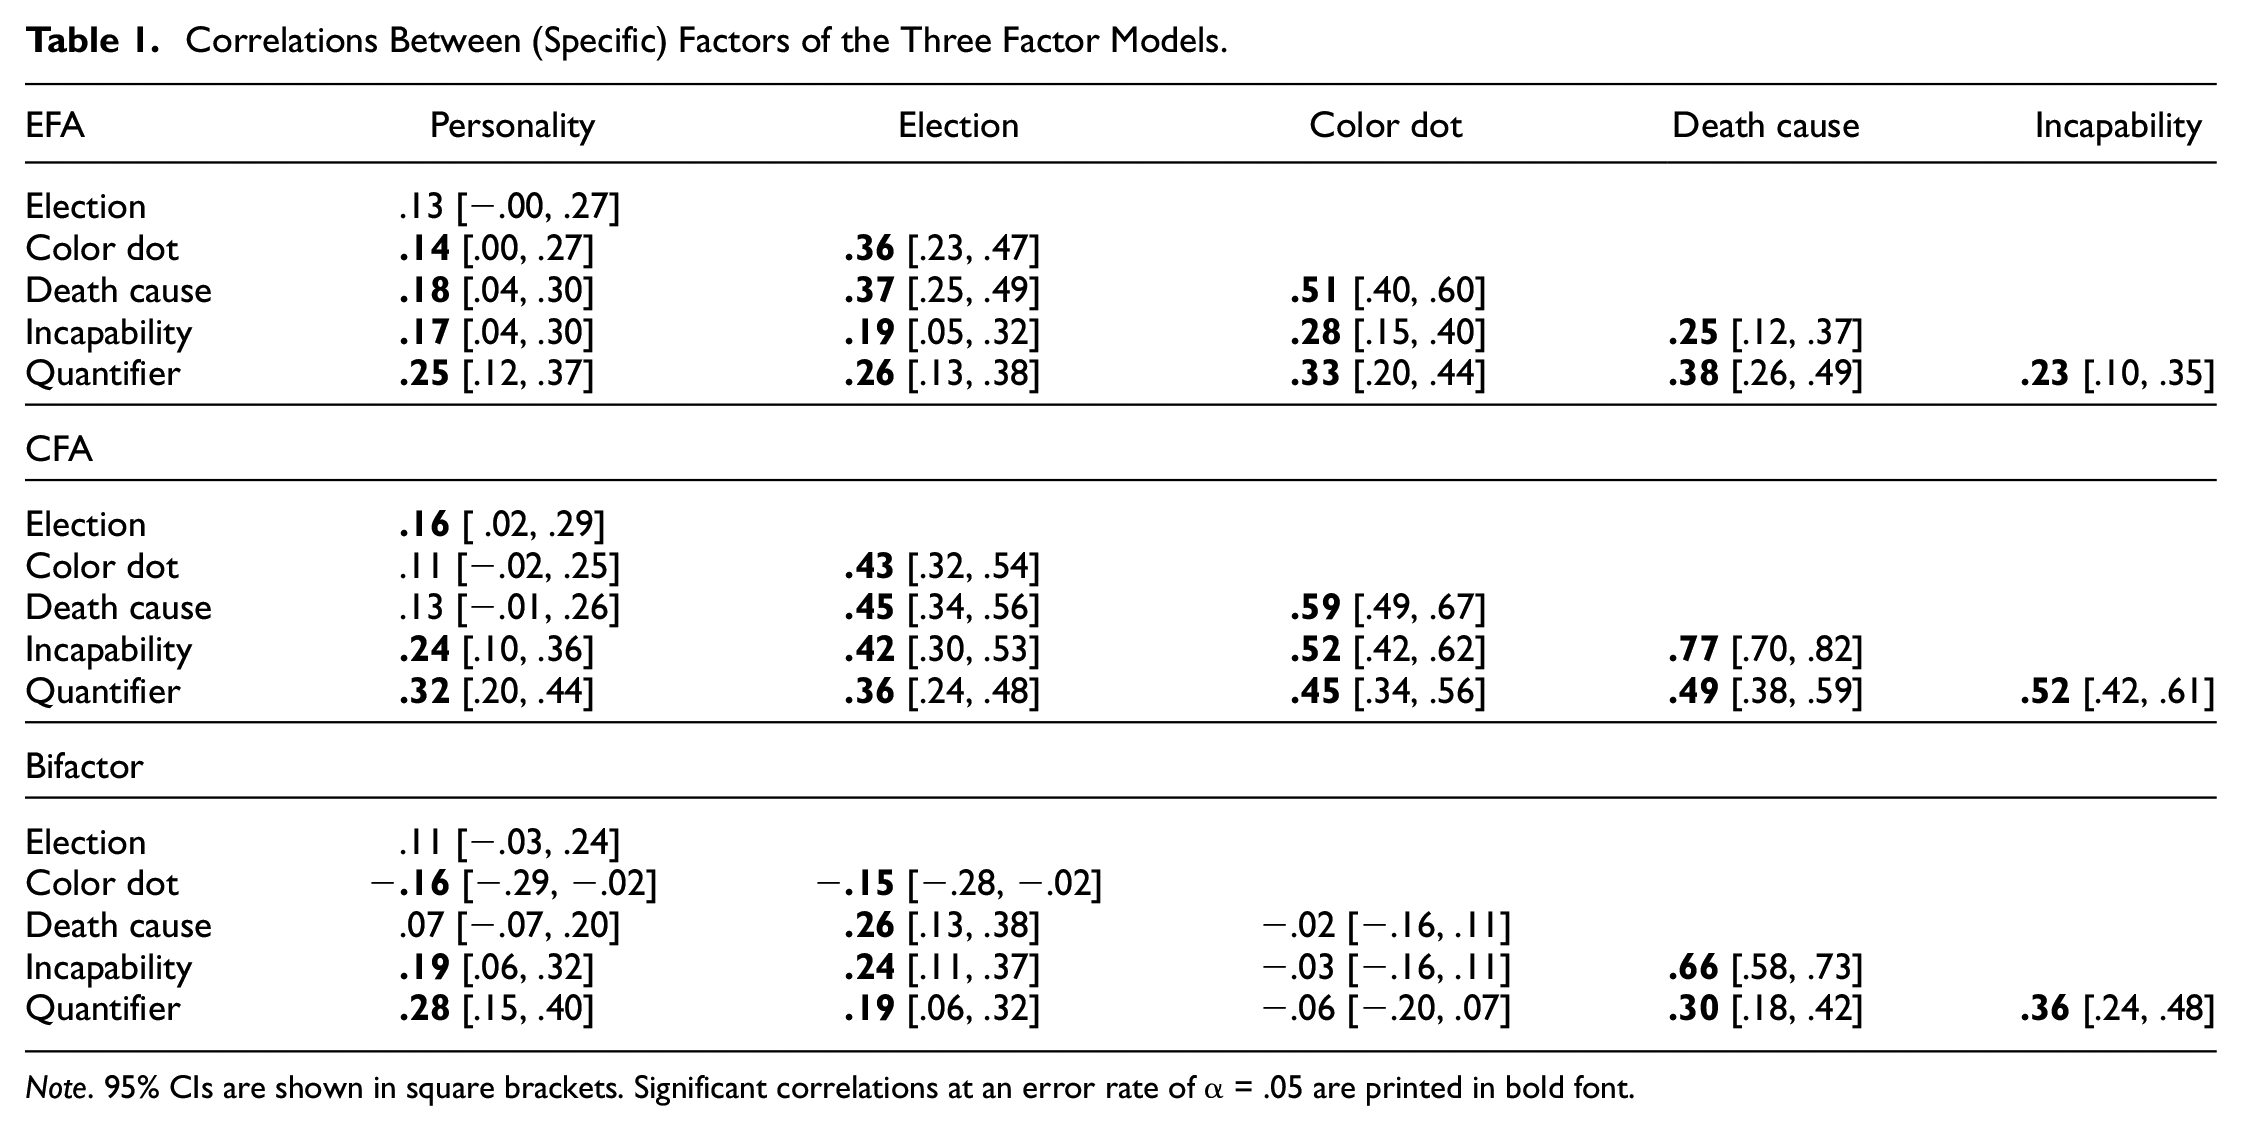
Note. 95% CIs are shown in square brackets. Significant correlations at an error rate of α = .05 are printed in bold font.
In conclusion, both EFA and CFA showed that six unique, correlated factors specific to the respective tasks can be assumed. In the next section, we further test the dimensional structure of interval widths with respect to a common factor resembling a preference response style.
Confirmatory Factor Analysis: Bifactor Model
We used a bifactor model to investigate the uniqueness of the tasks and domains with respect to the DRS width. In this model, the six factors representing the task structure corroborated in the EFA and CFA (with Extraversion and Conscientiousness as a common Personality factor) were specified as specific factors. Similar to the six-factor CFA model, items were assigned to factors according to their task membership, with all cross-loadings fixed to zero. For each of the six specific factors, the item with the highest loading in the EFA was defined as the reference indicator, except for the color-dot task where we chose the item with the second-highest loading. The bifactor model assumes that all items also load on a general factor. The rationale for this modeling choice is that there might be a common factor underlying all interval widths across all tasks and domains, which would provide evidence for a response style governing the response process. The item with the highest loading in a one-factor solution (i.e., the color-dot task with 60% purple dots) served as a reference indicator for the general factor.
The tasks in our study are structurally different from each other and therefore cannot be thought of as randomly sampled from a population of tasks. Hence, the standard bifactor model is not the appropriate model for our scenario (Eid et al., 2017). Following Eid et al. (2017), we added the following modifications to the model: First, it is not reasonable that the specific factors are uncorrelated as assumed by the standard bifactor model (Holzinger & Swineford, 1937). After accounting for the general factor, similar tasks may still share variance in DRS width (e.g., because of similar levels of respondents’ uncertainty regarding the percentages of death causes and reasons for incapability to work). Therefore, we included the correlations between specific factors as free parameters.
Second, since the tasks are structurally different and do not represent a random sample from a pool of interchangeable tasks, the general factor is not well-defined (Eid et al., 2017). As a solution, we selected one task as a reference task. All loadings on the general factor can then be interpreted relative to this reference. This can be done by selecting one item from the reference task as a reference indicator for the general factor and fixing its loading on the corresponding specific factor to zero. The remaining loadings of the reference task items on the specific factor account for item heterogeneity within the reference task. This is the Bifactor-(S.I−1) model described in Eid et al. (2017), Here, the formula (S.I–1) refers to the total number of indicators, given S specific factors with I indicators each, minus one indicator for the reference factor. As mentioned above, the reference indicator for the general factor was one of the items of the color-dot task (60% purple dots), which renders this task the reference task. Substantively, the color-dot task also provides the most adequate reference because it is a perceptual task in which uncertainty is not confounded with knowledge. The meaning of the general factor is therefore a general uncertainty or response preference for a particular interval width with reference to the estimation of percentages of purple dots. Loadings on the items of other tasks indicate to which extent general uncertainty can explain variance in interval widths. The specific factors are task-related residual factors after accounting for this general factor.
The Bifactor-(S.I−1) model had an adequate fit to the data as indicated by an RMSEA of .052 (95% CI = [.049, .054]) and an SRMR of .057. Figure 6 shows the estimated factor loadings. The items of the color-dot task, the reference task, had the overall highest loadings on the general factor (fourth row, left column), ranging from .64 to .83. The loadings of items from other tasks can be interpreted relative to the reference task. The first two rows (Extraversion, Conscientiousness) in the left column (general factor) show that the interval widths for the personality scales were barely influenced by the general factor, as indicated by small loadings ranging from −.06 to .19. In contrast, medium-sized loadings around .40 on the general factor emerged for all tasks concerning the estimation of percentages for which there are true values (i.e., election forecasting, death causes, and reasons for incapability to work). Finally, the verbal quantifier items (last row) had mostly small loadings on the general factor, ranging from .06 to .37.
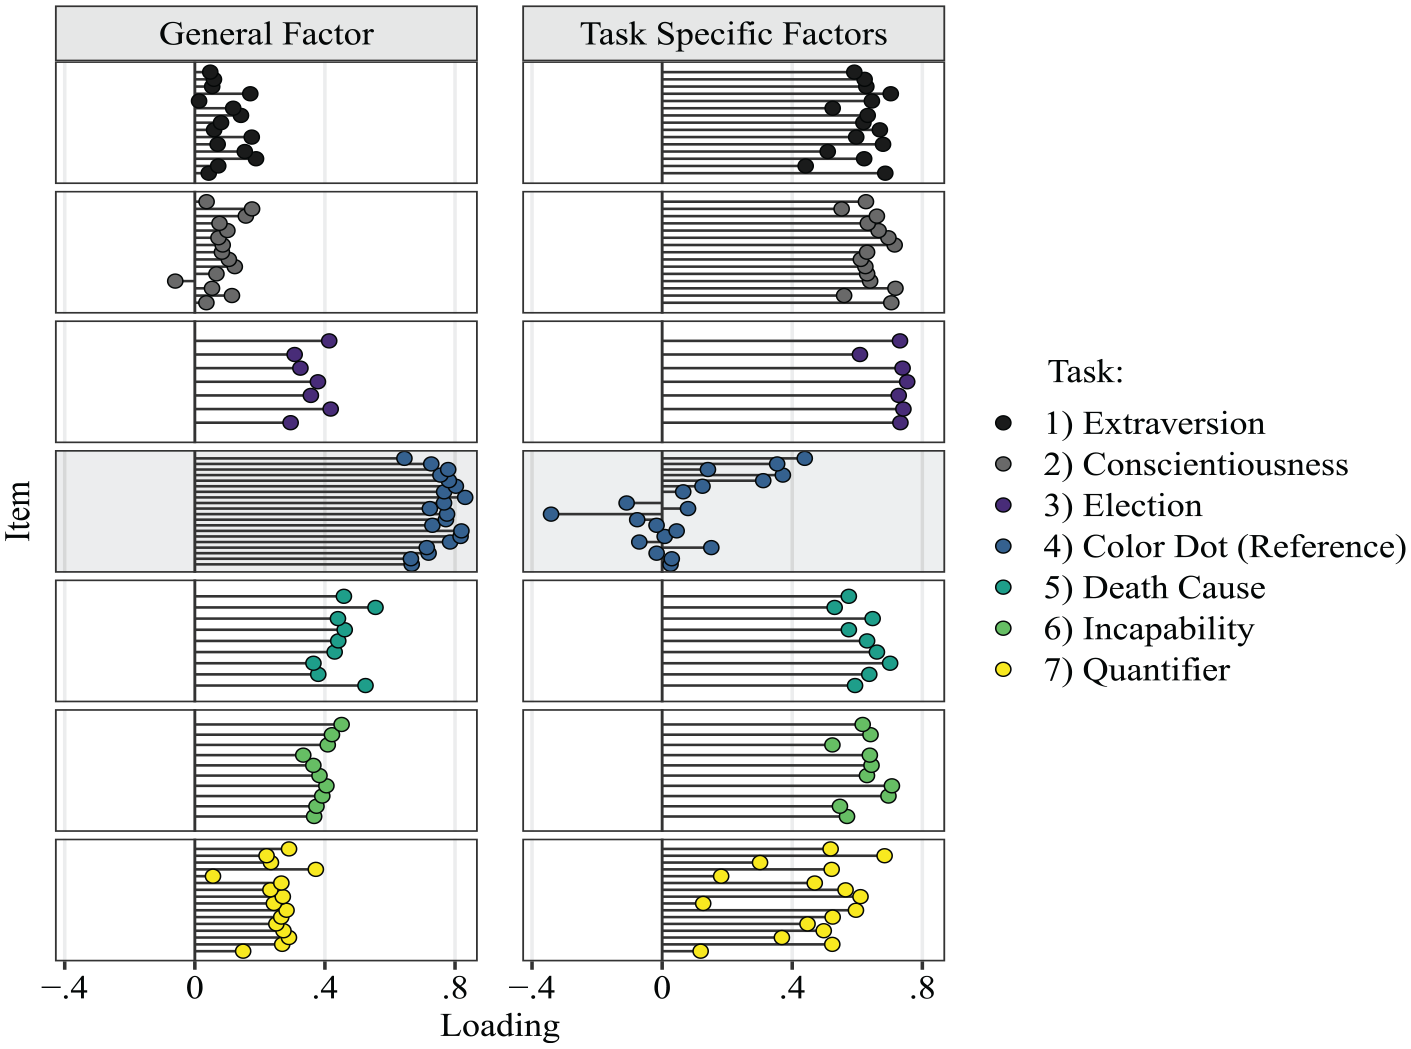
Factor Loadings Bifactor Model: General Factor versus Six Task-Specific Factors.
Overall, the relative size of loadings on the general factor matched the degree of objectivity of the tasks. The chosen reference task, a perceptive task, necessarily had the highest loadings, followed by those tasks in which a true (or hypothetically true value in the case of the election forecasting) had to be estimated. Next in the hierarchy in terms of objectivity were judgments of verbal quantifiers, where we can expect different groups to have different truths, or where the truth might even change depending on the context. Still, we can expect some consensus in the daily pragmatic use of verbal quantifiers. Last in the hierarchy of objectivity were self-ratings on the personality descriptive adjectives, which are entirely subjective. Assuming that respondents have perfect knowledge about the variability in their behaviors and cognition, subjective uncertainty should have a negligible influence. The small loadings of the personality items on the general factor support this reasoning. Overall, the pattern of loadings makes it plausible that the general factor represents general subjective uncertainty. If the general factor instead represented a response style for a particular preferred width, the loadings should be similarly sized across all tasks.
For the six specific factors (Figure 6, right column), loadings were mostly medium to high in the range between .44 and .75. An exception was the specific factor for the color-dot task (i.e., the reference task), with loadings ranging from −.34 to .44. The verbal quantifier control items also had particularly Iow loadings on their specific factor, which is plausible given the desired low construct-relevant variance of responses to these items (i.e., we expect a certain degree of respondents agreement on the probability ranges). Since the specific factors are residual factors after accounting for the general factor, it is to be expected that for the reference task, some corresponding loadings are negative. The direction of loadings follows from the choice of the reference item for the specific factor.
The correlations between the specific factors, shown in Table 1, provide further insight into the factor structure of the tasks. The correlations quantify task similarity after controlling for the general factor. The most similar tasks with the largest correlation were the estimation of death causes and the estimation of reasons for incapability to work
Robustness Checks
For the analyses reported above, we used the interval widths after applying the isometric log-ratio transformation. As a robustness check, we reran all analyses using the stick-breaking transformation and the untransformed interval widths. For all EFA and CFA models, the isometric log-ratio transformation yielded the best and the stick-breaking transformation the second-best model fit in terms of RMSEA and SRMR (see Table 2). Moreover, using the untransformed intervals yielded a seven-factor solution in the EFA. Also, in the reanalysis of the six-factor EFA, the untransformed interval widths showed a loading pattern that deviated more strongly from a simple structure than the results using the isometric log-ratio transformation (the analysis and plots can be found at the OSF repository). We therefore conclude that the isometric log-ratio transformation was the appropriate choice in our case. However, with other data sets, the stick-breaking transformation may provide a better fit, and future research could further investigate the conditions that give one transformation an advantage over the other.
Model Fit Indices for the Different Link Functions.
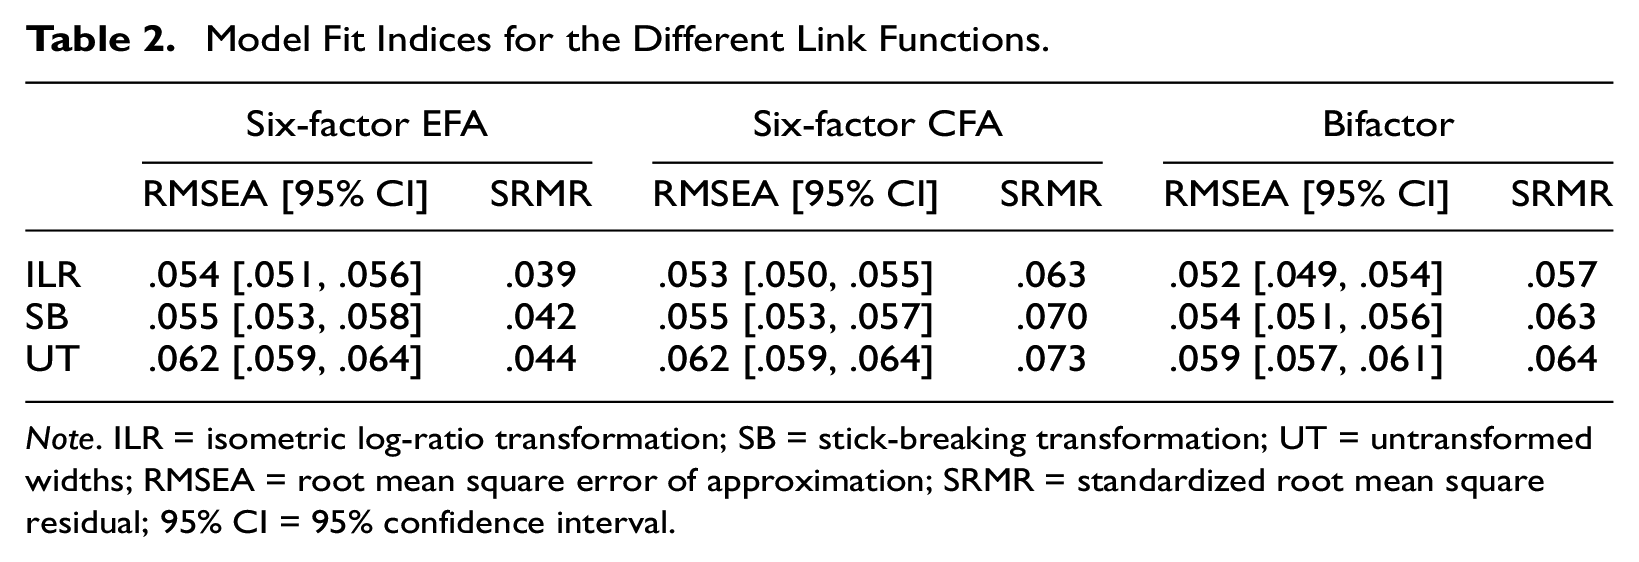
Note. ILR = isometric log-ratio transformation; SB = stick-breaking transformation; UT = untransformed widths; RMSEA = root mean square error of approximation; SRMR = standardized root mean square residual; 95% CI = 95% confidence interval.
Discussion
This article investigated the discriminant validity of interval widths across different tasks and domains. An EFA showed that the dimensionality of interval widths reflected the structure of the administered tasks. A consecutive six-factor confirmatory analysis with a simple structure corroborated the previously found factorial structure. We further fitted a bifactor model to test for the presence of a general factor, which would provide evidence for an overall response bias of giving narrow or wide interval widths across all tasks. Loadings on the general factor, with the color-dot task serving as the reference task, were low to moderate for all other tasks. Loadings were slightly higher for the different estimation tasks than for the two personality scales and the ambiguity task, which asked for judgments of verbal quantifiers.
The results of the factor analyses were in line with the assumption that respondents are sensitive to the constructs of interest targeted by the interval widths in the different tasks. Also, the fact that a general factor across all tasks accounted only for a limited proportion of the variance compared to the specific factors implies that respondents did not simply respond with a particular preferred interval width across all items. However, we found that more similar tasks showed less discriminant validity. We replicated the results of Kloft et al. (2024) that trait variability in Extraversion and Conscientiousness was highly correlated, as reflected by a common factor in our study. However, the interval widths of the two personality scales did not correlate with those of the remaining tasks targeting different constructs (i.e., uncertainty and ambiguity). The mixed picture in terms of discriminant validity indicates that the close link between interval widths in Extraversion and Conscientiousness may be due to a common response mechanism for judging trait variability in the Personality domain. This may be explained by a general factor of perceived variability in one’s behaviors and cognition that affects all personality dimensions alike (Baird et al., 2006). Future research should thus investigate the dimensional structure of trait variability for more than just two personality dimensions.
Similar to the personality scales, the more similar estimation tasks showed lower discriminant validity. This is particularly evident for the estimation tasks concerning the percentages of death causes and reasons for incapability to work, which showed a high correlation between their specific factors after controlling for the general factor in the bifactor model. One explanation may be that respondents use similar heuristics for similar tasks to decide on a particular width of the response interval. Another explanation might be that respondents have similar levels of expertise and domain knowledge, and thus, a comparable degree of confidence for more similar tasks, which could in turn lead to a higher correlation of interval widths. All other correlations between specific factors in the bifactor model were in the small to medium range, suggesting a higher discriminant validity between the respective tasks. This also makes sense from a substantive standpoint, as all other estimation tasks were more dissimilar than the estimation of percentages of death causes and reasons for incapability to work.
A major strength of this article is the application of a suitable logit transformation for continuous, bounded interval responses. The transformation is easy to apply and renders interval responses more suitable for standard statistical frameworks that assume a normal distribution of (multivariate) response values (e.g., regression or structural equation modeling). In this article, we focused only on the transformed interval width, but not on the interval location. Future research could jointly model transformed locations and widths using multivariate-normal models. In such models, one may be interested in estimating the correlation between the two multivariate-normal dimensions corresponding to the interval location and width (Kloft et al., 2023). Future research may be directed at finding a suitable parameterization for this correlation.
Our study also had some limitations. One of them is that we examined the dimensional structure of interval responses only in a small sample of mostly psychology students. This may limit the variance in interval widths, and thus, the generalizability of the found factor solutions. Another limitation concerns the order and presentation of the different tasks. We presented all items from one particular task in one block, with the block of personality scales always being presented first. The particular sequence of tasks might have influenced response behaviors, for instance, due to the temporal proximity of certain tasks. Our study only used a closed response format for eliciting interval responses. Future research could investigate the response process for interval responses in more depth, for instance, via cognitive interviews (Miller, 2014). Statistically, fitting a bifactor model allowed us to examine the extent to which interval widths were influenced by a single factor across all qualitatively different tasks. To get a deeper understanding of the influence of response styles in the DRS response format, future research could fit latent-class models that allow for a mixture of different factor solutions for different response processes (Ulitzsch et al., 2022).
In summary, we found that the factor structure of interval widths resembles the structure of the different tasks. This provides evidence that respondents are sensitive to the demands of different tasks that target the constructs of variability, uncertainty, and ambiguity. Therefore, our study contributes to a better understanding of interval responses, in particular their widths, for the measurement of psychological constructs.
Footnotes
Appendix
Author Contributions
Matthias Kloft contributed to conceptualization, model development, formal analysis, investigation, data curation, writing—original draft, and writing—review & editing. Daniel W. Heck contributed to conceptualization, model development, formal analysis, writing—review & editing, and supervision.
Declaration of Conflicting Interests
The authors declared no potential conflicts of interest with respect to the research, authorship, and/or publication of this article.
Funding
The authors received no financial support for the research, authorship, and/or publication of this article.