
Abstract
The use of discrete categorical formats to assess psychological traits has a long-standing tradition that is deeply embedded in item response theory models. The increasing prevalence and endorsement of computer- or web-based testing has led to greater focus on continuous response formats, which offer numerous advantages in both respondent experience and methodological considerations. Response styles, which are frequently observed in self-reported data, reflect a propensity to answer questionnaire items in a consistent manner, regardless of the item content. These response styles have been identified as causes of skewed scale scores and biased trait inferences. In this study, we investigate the impact of response styles on individuals’ responses within a continuous scale context, with a specific emphasis on extreme response style (ERS) and acquiescence response style (ARS). Building upon the established continuous response model (CRM), we propose extensions known as the CRM-ERS and CRM-ARS. These extensions are employed to quantitatively capture individual variations in these distinct response styles. The effectiveness of the proposed models was evaluated through a series of simulation studies. Bayesian methods were employed to effectively calibrate the model parameters. The results demonstrate that both models achieve satisfactory parameter recovery. Neglecting the effects of response styles led to biased estimation, underscoring the importance of accounting for these effects. Moreover, the estimation accuracy improved with increasing test length and sample size. An empirical analysis is presented to elucidate the practical applications and implications of the proposed models.
Introduction
When conducting educational assessments or psychological tests with subjects, the most frequently encountered data formats include dichotomous item responses (such as true or false) or ordered categorical responses (such as the Likert-type rating scale). Specific types of item response theory (IRT) models must be employed for these distinct categorical item types. IRT models help capture the nonlinear relationship between an individual’s trait level and the likelihood of endorsing a specific response to a test item. Numerous IRT models employing either dichotomous or polytomous scoring methods are readily available for researchers to analyze collected data (e.g., Lord, 1980; Samejima, 1969). Although comprehensive and illustrative examples have widely covered the realm of IRT application with respect to larger-scale international assessments or personality diagnosis (Martin et al., 2017; Spence et al., 2012), confining a person’s responses within certain defined categories may hinder the true feelings and propensities that should be reflected in the measurement scale and may consequently lead to information loss during the model calibration process.
Continuous Response Measurement
In contrast to the ordered categorical responses used in traditional IRT models, there is a growing trend toward adopting continuous item response formats in attitude or personality assessments. This approach permits subjects to express diverse degrees of agreement toward statements, allowing their views to be more comprehensively represented. For instance, the original five-point Likert-type rating scale ranging from strongly disagree (a score of 1) to strongly agree (a score of 5) of the celebrated Big Five Inventory (John & Srivastava, 1999) can be replaced with a line segment with continuous scores between 0 and 1000 (Simms et al., 2019). In this revised setup, individuals are instructed to mark a point on the continuous scale to indicate the extent to which they endorse a given statement. This differs from the conventional practice of providing only a few discrete categorical responses.
The visual analog scale (VAS), which is commonly employed for the collection of continuous responses, uses a scaled and visualized line segment on which respondents are allowed to mark any position along the continuous line to reflect their view on a given statement and has been frequently applied across various social science fields (e.g., Brumfitt & Sheeran, 1999; Christ et al., 2013; Ferrando, 2002). This continuous response format empowers respondents to more finely convey their sentiments or judgments, resulting in more precise propensity estimates than those exhibited by discrete item response formats (such as Likert-type scales; Bejar, 1977; García-Pérez, 2023). In addition, rapid progress has been made in digital technology involving the use of more convenient VASs, such as by integrating slider bars into computer or online surveys, facilitating easier management and precise measurements without manual scoring.
While continuous item response formats are well established in the literature and the corresponding IRT models can be traced back to the work of Samejima (1973) and later Müller (1987), continuous IRT models are utilized for data analysis less often than discrete IRT counterparts designed for Likert-type scales (Zopluoglu, 2020). When handling collected continuous outcome data, factor-analytic models are traditionally favored over continuous IRT models (Mellenbergh, 2016). In our approach, we chose to embrace continuous IRT modeling rather than factor-analytic modeling for fitting VAS data. This is because continuous IRT modeling offers a more theoretically sound foundation than factor-analytic modeling and maintains a strong connection to conventional discrete IRT models. For a more in-depth exploration of this choice, refer to Ferrando (2002) and García-Pérez (2023).
The Continuous Response Model and Its Relative Measurement Issues
A prominent IRT model for analyzing continuous responses in VAS data is the continuous response model (CRM), which was pioneered by Samejima (1973). It functions by constructing a probabilistic framework for continuous responses, accounting for individuals’ latent tendencies and the characteristics of the items. Furthermore, when the number of response categories approaches infinity, the CRM can be viewed as a special case of the graded response model (Samejima, 1969). In real-time testing scenarios, item responses may not be influenced solely by the distinctions between individuals’ and items’ positions on a latent continuum. Instead, extraneous factors unrelated to the intended measurement domain, such as varying cognitive strategies, test-taking behaviors, differential item functioning (DIF), and response styles, could introduce complexities that impact respondents’ scores on the assessed content variables. These factors have been extensively studied in the realm of discrete IRT models (e.g., Falk & Cai, 2016; Holland & Wainer, 1993; Huang, 2020; Meyer, 2010; Mislevy et al., 2008; C. Wang et al., 2018).
With respect to Likert-type data, disregarding potential nuisance factors during tests can lead to significant estimation bias and distort ability inferences for respondents (Liu & Wang, 2016; Merhof & Meiser, 2023). However, the impact of extraneous variables unrelated to the content on estimating individuals’ trait levels and item characteristics garners less attention when the CRM is fit for VAS responses, with a few exceptions. For example, Zopluoglu (2020) extended the CRM using a mixture model to investigate the heterogeneity in item response behavior among respondents. Applying a five-item continuous-scoring personality measurement, Zopluoglu (2020) found that respondents tended to respond to items with different strategies and identified two latent classes that appeared to differ in the use of extreme endpoints. In addition, Ferrando and Navarro-González (2021) introduced a more comprehensive CRM through a dual modeling approach, considering both items and respondents as sources of differential measurement error. Considering the person-trait fluctuations that occur during the response process, Ferrando and Navarro-González asserted that the correlation between the target trait and external criterion could be corrected for attenuation. Recently, Finch (2023) applied the CRM to generate VAS data that incorporate DIF effects and compared the detection efficiencies of various existing DIF detection methods; the MIMIC method was recommended to serve as an efficient approach to detecting DIF in his simulation settings.
Response Styles in Survey Data
Response styles, referring to the inclination to consistently answer self-report inventories in specific ways regardless of item content, have been examined within discrete IRT models and classic analytic approaches for Likert-type data (e.g., De Beuckelaer et al., 2010; De Jong et al., 2008; Falk & Cai, 2016; Plieninger & Meiser, 2014; Weijters et al., 2010). However, limited attention has been given to the measurement challenges posed by response styles in VAS data when the CRM is used for fitting. While response styles encompass a broader spectrum of construct-irrelevant and systematic response behaviors for individuals’ use of rating scales (Baumgartner & Steenkamp, 2001), in our study, we focus on two specific response styles: extreme response style (ERS), characterized by an excessive inclination toward selecting the endpoints of a continuous scale, and acquiescence response style (ARS), characterized by an inclination toward preferring the higher points on a continuous scale regardless of their true attitude and judgment (i.e., a tendency to agree with items). This focus stems from the extensive research available on ERS and ARS effects (e.g., Böckenholt, 2012; Bolt & Newton, 2011; Falk & Cai, 2016; Henninger & Meiser, 2020a, 2020b; Jin & Wang, 2014; Jonas & Markon, 2019; Plieninger, 2017; Thissen-Roe & Thissen, 2013). This existing body of literature, along with the corresponding IRT models designed for discrete responses, offers valuable insights for advancing and expanding the CRM to accommodate these two response styles in VAS data.
Although the concepts of ERS and ARS originate from research on discrete item response formats, the same definition still applies to VAS format measurements. Specifically, respondents with ERS tendencies are more likely to endorse extreme options on a Likert-type scale and give rating points near the extremity on a continuous rating scale, depending on their attitude intention (e.g., positive or negative judgment). Respondents with ARS tendencies tend to choose the highest category on a Likert-type scale or mark the highest points on a continuous scale, regardless of their initial attitudes and judgments.
Existing Measurement Models for Response Styles
A multitude of psychometric models that can deal with the ERS and ARS tendencies have been proposed in terms of various theoretical perspectives and views on the nature of the measurement scale. When viewing the item responses as discrete variables (e.g., Likert-type rating scales), at least four approaches have been developed within the framework of IRT models to control for or quantify the ERS or ARS effect; these approaches deserve additional attention and discussion.
The first approach employs multidimensional IRT models to characterize latent traits of the measured substantive domains alongside distinct latent tendencies for various response styles, including ERS and ARS (Bolt & Johnson, 2009; Bolt & Newton, 2011; Falk & Cai, 2016; Johnson & Bolt, 2010; Plieninger, 2017). The second approach uses mixed IRT models and qualitatively separates the normal and ERS latent classes, in which the ERS latent class is assumed to have smaller intervals between adjacent thresholds than the normal class (Huang, 2016; Morren et al., 2012; von Davier et al., 2007). The third approach applies the perspectives of cognitive psychometrics and assumes that item responses can be deconstructed into content-related and response style–related aspects with an IRTree model (Böckenholt, 2012; De Boeck & Partchev, 2012; Thissen-Roe & Thissen, 2013). Like the multidimensional IRT models applied in the first approach, the fourth approach introduces either a multiplicative person parameter on thresholds to modify the distance between adjacent thresholds for ERS (Jin & Wang, 2014, 2018) or an additive person parameter on item locations to account for shifts in item difficulty for ARS (Jonas & Markon, 2019). Since the middle response style (MRS) works conversely to ERS along the same axis, its effect can also be incorporated and modeled within random-threshold IRT models.
Regardless of the approach employed in previous simulation and empirical studies, they have consistently indicated that response styles bias parameter estimation, compromise test validity, and interfere with people’s inference ability (e.g., Henninger & Meiser, 2020a). These IRT extension models, however, are not capable of accounting for ERS and ARS tendencies when item responses are continuous (i.e., VAS data). Intuitively, a traditional factor-analytic model may be directly employed to fit the VAS data, and the substantive domain representing the target trait and the nuisance domains representing the ERS or ARS effect can simultaneously influence item responses (e.g., Billiet & McClendon, 2000; Ferrando, Lorenzo-Seva, 2010). This approach, however, ignores the boundary of the continuous scale (i.e., continuous-limited item responses) and provides approximate estimates only under an ideal testing scenario (Ferrando, 2002).
To consider the boundary effects of VAS responses, Ferrando (2009) modified the factor-analytic model by defining the lower bound and the upper bound for the range of latent trait levels and reparametrized the intercept/location parameters to produce a form similar to that of standard IRT models. Furthermore, Ferrando (2014) extended his previous normative model (Ferrando, 2009) to become the so-called differential discrimination model (DDM) and allowed individual differences in the item discrimination parameters to quantify different sensitivities to the use of the scale. Although the DDM is promising and encouraging for investigating potential response extremes, several limitations deserve further investigation. First, the range of trait levels may not perfectly correspond to the constrained range that the DDM has defined because the target latent traits are often assumed to be normally distributed in psychometric models. Second, the estimation algorithm of the DDM depends on the two-stage method with bivariate information that is commonly applied for classical factor-analytic models, which may result in imprecise parameter estimation due to ignoring estimation errors compared with the one-stage approach with full information (Hung & Huang, 2022). From a statistical perspective, linear homoscedastic models, such as the DDM, are less flexible than and less applicable to nonlinear heteroscedastic models (e.g., the CRM) in VAS data analyses (Ferrando, 2002, 2009, 2014; Samejima, 1973; Tutz & Jordan, 2023). Consequently, in this study, we seek to expand the CRM for analyzing VAS data by accommodating the ERS or ARS.
This article is structured as follows: First, a concise overview of the CRM is provided, followed by the subsequent development and elaboration of its extensions to incorporate ERS and ARS. Next, a series of simulation studies were conducted to assess the parameter recovery of the proposed models and explore the ramifications of disregarding ERS and ARS effects in VAS data. Afterward, an empirical demonstration is presented that showcases the application of the developed models to VAS data to detect whether ERS or ARS affects respondents’ continuous responses. Finally, the article is concluded by summarizing the implications derived from the results of both the simulation and the empirical analyses, and suggestions for future research are presented.
The CRM and Its Extension to Account for ERS and ARS
The CRM was introduced by Samejima (1973) to formulate the probability density function of continuous responses in relation to a person’s trait level and an item’s characteristic, similar to the objectives of conventional discrete IRT models. If we consider a continuous scale ranging from zero to
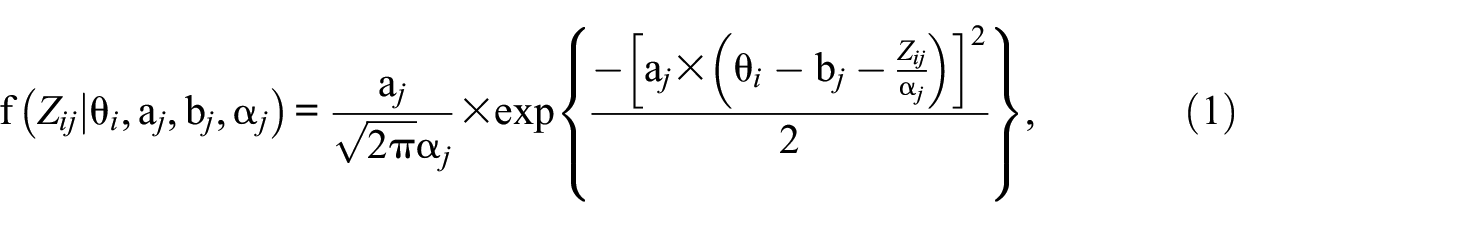
where
The Extended CRM for Accounting for ERS
Given that ERS entails a consistent inclination toward selecting the endpoints of a categorical or continuous rating scale, it is reasonable to assume that an individual with an ERS tendency would choose higher ratings on the continuum than their actual assessed ratings if
To model the relationship between ERS propensity and the deviation of the latent trait from item difficulty, we introduce variability in the scaling parameters across individuals and reparametrize the random-effect scaling parameters to connect with the target latent trait via a linear model of normally distributed residuals. As such, the logit-transformed random variable
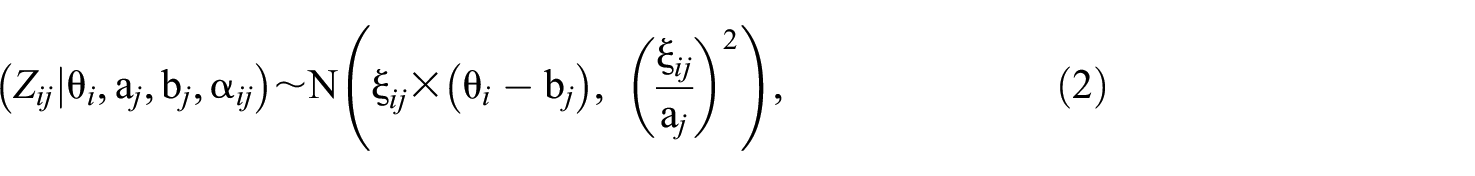

and

where
To elucidate the influence of random-effect scaling parameters on item responses, we present an illustrative example. We consider three chosen latent trait levels of θ = -1, 0, and 1 for responding to an item with parameters a = 1.5, b = 0, and α = 1, respectively. The parameter γ is set at values of 1, 0, and -1, which correspond to the ERS, normal, and MRS classes, respectively. For each combination of latent trait (θ) and ERS propensity (γ), we simulate 2,000 persons’ responses to the given item using Equations 2 and 3. The observed scores are obtained by transforming
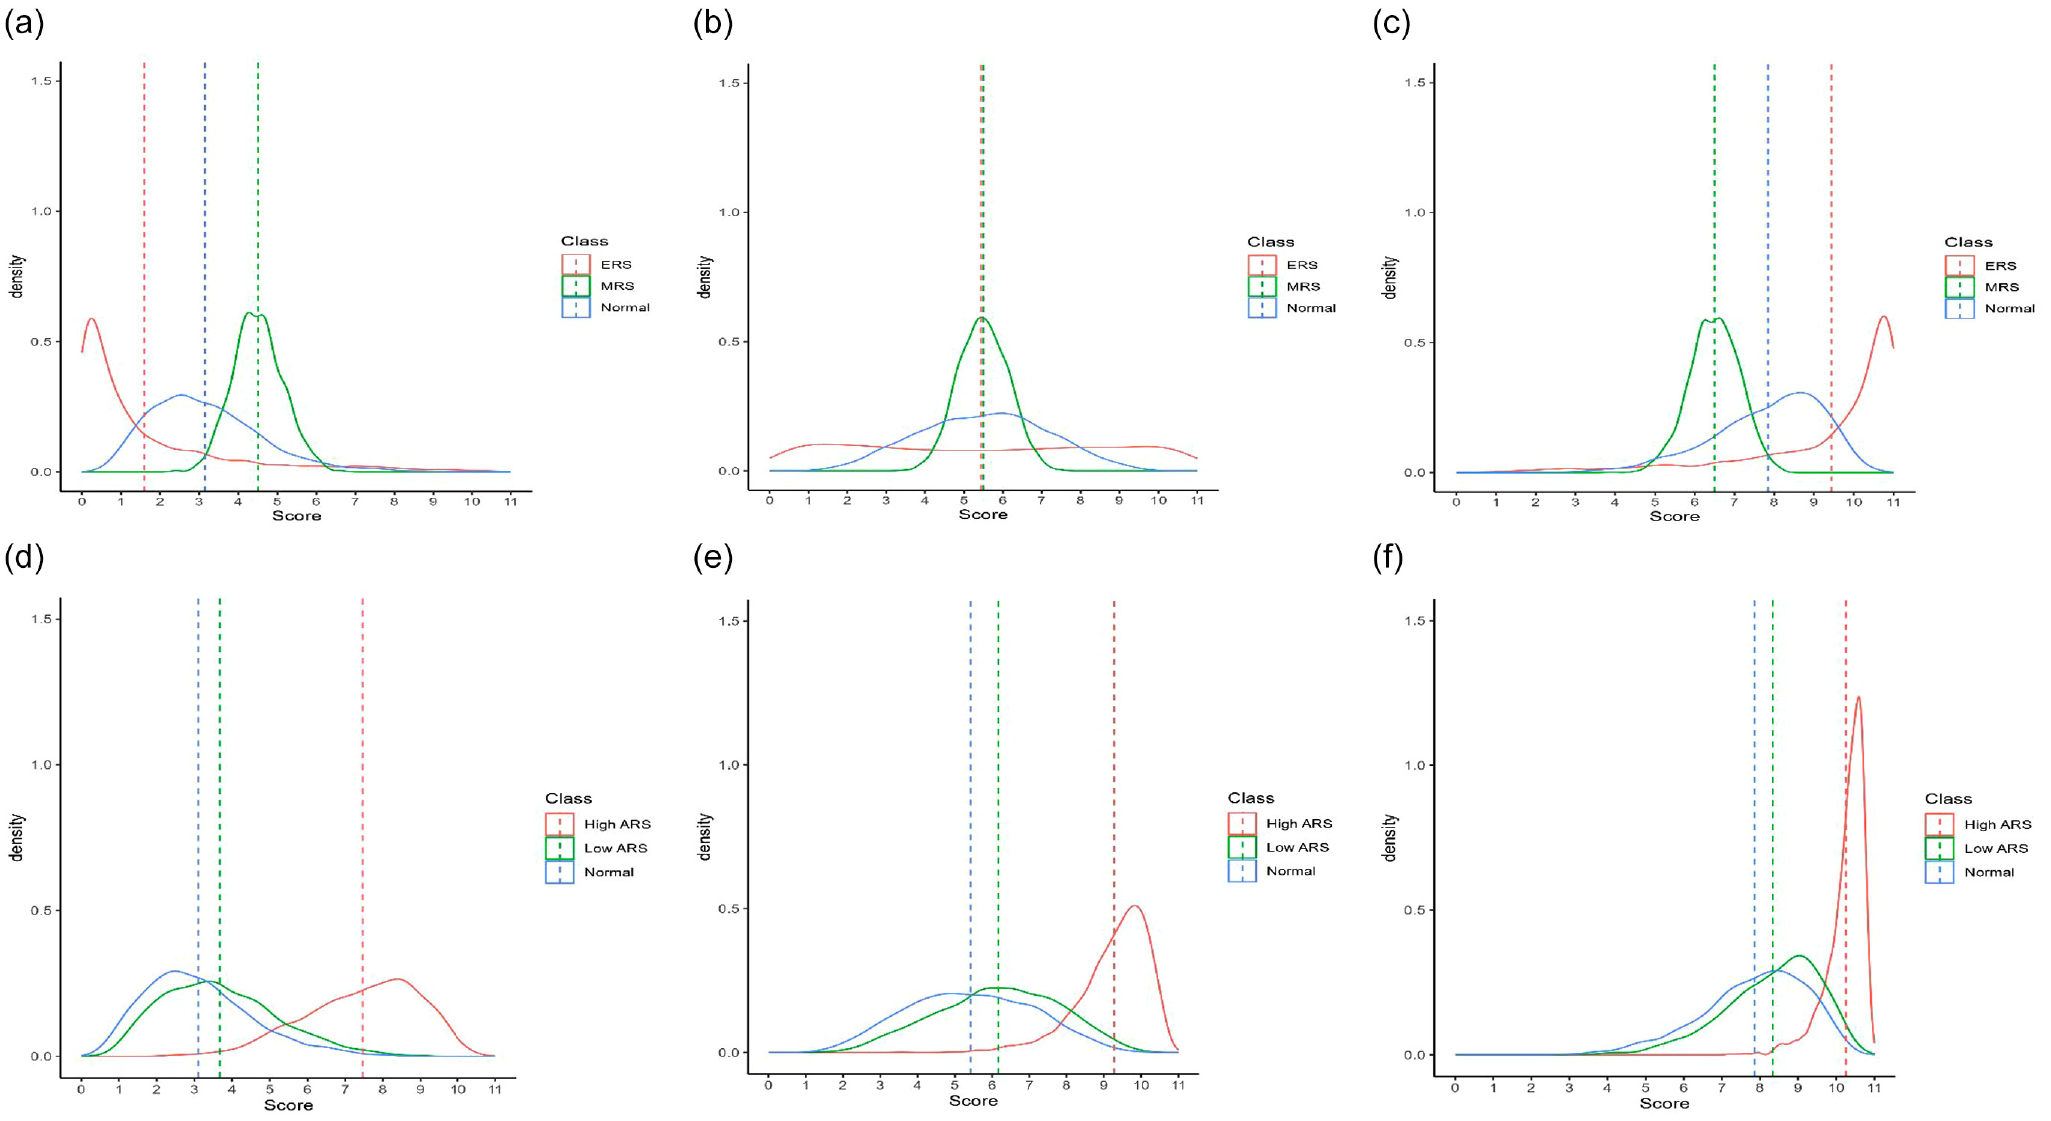
Conditional Distribution of the Continuous Response at Three Trait Levels for the CRM-ERS (a–c) and CRM-ARS (d–f): (a) CRM-ERS When Theta = −1. (b) CRM-ERS When Theta = 0; (c) CRM-ERS When Theta = 1; (d) CRM-ARS When Theta = -1; (e) CRM-ARS When Theta = 0; (f) CRM-ARS When Theta = 1
When an individual’s trait level aligns with the item difficulty (θ = 0), the three response class distributions exhibit similar means, as shown in Figure 1(b). However, the ERS class (with γ = 1) is more likely than the other classes to select extreme positions on the continuum. In addition, the MRS class (with γ = -1) demonstrates a strong tendency to select the middle rating, in contrast to the normal class (with γ = 0). Finally, when individuals possess a high trait level (θ = 1), as depicted in Figure 1(c), the distribution of observed scores for those with γ = 1 (or γ = −1) is influenced by ERS (or MRS), causing a shift toward the right (or left) end of the continuum. The distribution of the normal class with γ = 0 lies between the two ERS and MRS classes.
To clearly illustrate the distributional patterns under the same response style, we present the conditional distribution of continuous responses, demonstrating the variation in the γ parameter for the CRM-ERS. This information is depicted in the upper panel of Figure A1, which is included in Online Supplement A. In Figure A1(a), when respondents lean toward MRS
The Extended CRM for Accounting for ARS
Considering the inclination toward ARS in the VAS data, the CRM can be extended to accommodate respondents who tend to choose higher ratings on continuous scales than expected (i.e., a tendency to agree with item statements). Although the ERS tendency works like the tendency of intriguing respondents to give higher ratings on a continuous scale, a major difference should be clearly noted. The ARS manifests as a consistent tendency to choose ratings near the high end of the continuous scale regardless of personal or item characteristics, while the ERS reveals that the tendency to choose a point near the high or low end of the continuous scale depends on the difference between the person’s trait and the item’s location, as shown in Figure 1(a) to 1(c).
The presence of ARS suggests that the likelihood of person i obtaining a score of x or higher on item j surpasses the scoring probability anticipated by a conventional CRM for the same person and item. Mathematically, this is expressed as
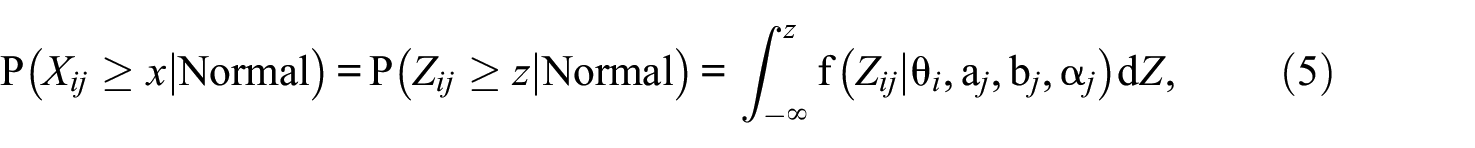
representing the probability of normal responses without exhibited response styles.
To increase the conditional probability under the same conditions, we can include a nonnegative person-specific parameter governed by the ARS dimension in Equation 1. This inclusion enforces a higher conditional probability
where
The interpretations of the CRM-ARS parameters differ somewhat from those of the conventional CRM and warrant further attention. The expected item score is equal to 0.5 when
The identifiability issue on the CRM-ARS should further be discussed. First, the slope parameter of the ARS dimension for one item must be fixed at an arbitrary value. Following the tradition of IRT regarding constraints on discrimination parameters (as seen in Huang & Wang, 2014), we arbitrarily choose
Although the orthogonal constraint derives from statistical considerations, the correlation between trait levels and ARS propensity revealed different patterns depending on the response-style modeling approach. For example, Plieninger (2017) found a near-zero correlation between a measured trait and ARS dimensions; on the other hand, Liu and Wang’s (2019) study showed a moderate negative correlation between two-person parameters during unfolding data analysis. Nevertheless, one may allow correlation estimation in the CRM-ARS when at least one item can be identified to purely measure the target trait and ARS domains in a confirmatory way (Holman & Glas, 2005). In this case, identification of the ARS-free items is necessary. However, flagging ARS-free items is methodologically challenging and may be attained by purifying iteration methods employed in searching for DIF-free anchor items (e.g., Huang, 2014), which may go beyond the scope of this study.
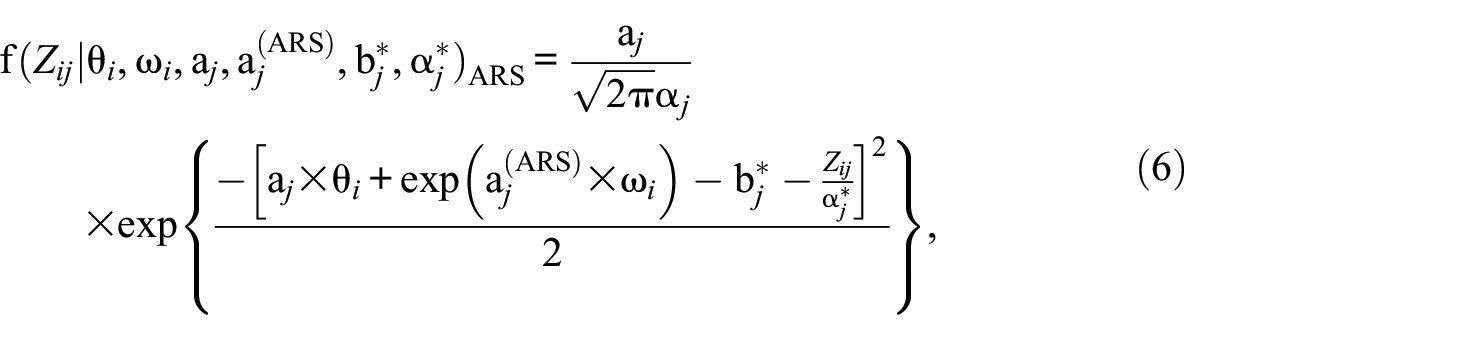
Consequently, the conditional probability of obtaining a score of x or higher on item j for person i with an ARS tendency can be derived by integrating Equation 6, expressed as:

where the logit-transformed score
The same illustrative scenario applied to the CRM-ERS, involving the continuous responses of 2,000 individuals to an item across three trait levels, also illustrates the impact of ARS using the CRM-ARS. However, in this case, the ARS propensity for respondents is set as ω = 1 for high ARS levels and ω = −1 for low ARS levels. In addition, the slope of the ARS dimension is set to one. This is displayed in the bottom panel of Figure 1. In the context of the three trait levels, a higher ω parameter causes a more pronounced shift in the observed continuous response distribution toward the right end of the continuum than a lower ω parameter does. The CRM-ARS allows acquiescent tendencies to be individually captured and quantified.
When examining the conditional distribution of continuous responses with respect to variations in the ω parameter, Figure A1 in Appendix A provides a clear depiction of the impact of the ARS on observed scores. In contrast to the standard responses associated with the traditional CRM (where the ω value is set to negative infinity, as depicted in Figure A1[e]), respondents with ω = -1 exhibit a slight shift toward the right end of the continuum, irrespective of their trait levels (refer to Figure A1[d]). Conversely, respondents with ω = 1 demonstrate a significant shift toward the right end of the continuum (refer to Figure A1[f]), highlighting that the inclination toward ARS can dominate the variation in the ω parameter.
In certain instances, respondents might lean toward using the lower range of the continuous scale, manifesting a disacquiescence response style (DRS). DRS, wherein respondents tend to respond to items in a negative manner, can be conceptualized as the opposite effect of ARS. For instance, DRS propensity may be observed when reverse-keyed items are administered to evoke a DRS inclination (Ferrando & Lorenzo-Seva, 2010). The developed CRM-ARS can be adapted to address the DRS effect by constraining the distributional mean of the conditional probability density function. This adjustment involves reducing the mean as a respondent’s DRS propensity
Method
Design
Two simulation studies were conducted to assess the performance of the proposed models, the CRM-ERS and CRM-ARS, in comparison to the conventional CRM. The CRM-ERS and CRM-ARS were used as data-generating models for the simulations. Simulated data were generated based on these models and then fitted to their corresponding true models as well as the conventional CRM (which does not account for response styles). This evaluation was conducted to measure the estimation accuracies of the proposed models and to explore the impact of neglecting the impacts of ERS and ARS under different conditions. The rationale behind the use of true and misleading models to fit the simulated data is that, provided by the results, we can determine the extent to which the parameter recovery obtained from the conventional CRM deviates from that obtained from the true CRM-ERS or CRM-ARS. If the deviation of the conventional CRM from the true models is substantial, then the ERS or ARS effect cannot be ignored, and the CRM-ERS or CRM-ARS must be employed. In contrast, if the deviation is small, the CRM would be sufficient for providing a parsimonious estimation. This approach is a typical procedure commonly observed in the literature when developing a novel model and investigating its efficiency in estimation (e.g., Huang, 2023; Jin & Wang, 2014; Merhof & Meiser, 2023).
In both simulation studies, two sets of sample sizes, 500 and 1,000, were employed, along with two test lengths, 10 and 20 items. These conditions were chosen to align with previous research on CRM (Finch, 2023; Zopluoglu, 2020). For the CRM-ERS simulations, two-person parameters,
For the CRM-ARS simulations, the intended measure
Continuous item responses were generated within the range of zero to 11, where the highest possible item score was 11. The item parameters were established following settings similar to those designed by Zopluoglu (2022). In both simulations, the simulated values for the item parameters were randomly selected from a uniform distribution with an item difficulty parameter range of -1 to 1, an item scaling parameter range of 0.8 to 1.2, and a range of 0.5 to 2.5 for item discrimination (slope) parameters concerning θ and ω. In essence, a combination of manipulated factors led to eight conditions (i.e., two sample sizes × two test lengths × two correlation levels) emerging for the CRM-ERS simulation. For the CRM-ARS simulation, four conditions emerged (i.e., two sample sizes × two test lengths). All of these conditions were replicated 100 times to evaluate the parameter estimation accuracy.
Note that the item parameter generation for the simulation was chosen to be consistent with or similar to the ranges that have been observed and used in previous studies (e.g., Finch, 2023; Shojima, 2005; Zopluoglu, 2022). However, we cannot exclude the possibility that the real item parameters may be outside the ideal distribution of the item parameters. As demonstrated in the following empirical analysis, the item difficulty parameters were estimated to be lower, and the respondents thus intended to mark a higher point on the continuous scale. To examine whether the proposed model is robust to the variation in item parameters obtained from real data analysis, a follow-up simulation that mirrored the real-world scenario was conducted, as shown in the section followed by the empirical analysis.
When VAS data are collected, an important question arises regarding which model can provide a better fit to the data to detect the potential response styles for the CRM. For this purpose, we employ two criteria to evaluate the model fit: the deviance information criterion (DIC; Spiegelhalter et al., 2002), which functions as a partial Bayesian method, and leave-one-out cross-validation with Pareto-smoothed importance sampling (PSIS-LOOCV; Vehtari et al., 2017, 2019), which is recognized as a comprehensive Bayesian approach. To assess the efficiency of the two fit criteria, the third simulation study was conducted in which the three models of the CRM-ERS, CRM-ARS, and CRM were used to generate item responses over 100 replications, and the three respective models were then fit to the simulated data to calculate the corresponding DIC and PSIS-LOOCV values. It was expected that when the data-generating model was consistent with the fitting model, the DIC and PSIS-LOOCV would be lower than when the data-generating and fitting models were incoherent, suggesting that the data-generating model is superior to the competing models. In this scenario, we fixed the test length to 10 items and the sample size to 500 persons to investigate the effectiveness of the fit indices in a less ideal situation.
Analysis
Because existing statistical packages cannot be applied to the newly proposed models, we devised the JAGS (Plummer, 2017) syntax by employing Bayesian estimation. This approach was used to effectively calibrate the model parameters for the extended CRM encompassing response styles. The prior distribution of each parameter was a prerequisite for establishing the joint posterior distributions of the parameters. Markov chain Monte Carlo (MCMC) methods were employed to efficiently and sequentially sample and construct specific posterior distributions for each parameter. The priors employed in this study were determined using a vaguely sound approach and were similar to those utilized in prior Bayesian IRT studies (e.g., Huang, 2016, 2020). The JAGS syntax for the CRM-ERS and CRM-ARS can be readily found in Online Supplements B and C, respectively. These resources are provided to interest readers in developing customized models.
A normal prior distribution with a mean of zero and a variance of four was implemented for the item difficulty parameters. A lognormal prior distribution with a mean of zero and a variance of one was implemented for the item discrimination and item scaling parameters. A gamma prior distribution with both hyperparameters set at 0.01 was specified for the standard deviation of the ERS (i.e.,
Furthermore, the bias and root mean square error (RMSE) were calculated for each estimator, and the correlations between the true and estimated values were also calculated. To save space, the correlations between true and estimated item parameters were calculated separately for each parameter and then averaged across estimators. This calculation served two purposes: first, to assess the accuracy of parameter recovery when fitting the model to the data generated by the proposed data-generating model, and second, to explore the implications of utilizing the misleading CRM to fit data involving ERS or ARS effects in VAS data.
Results
Simulation 1: Parameter Recovery Evaluation for the CRM-ERS
The effectiveness of parameter recovery was assessed by examining biases and RMSEs for both the CRM-ERS and the CRM-ARS. The outcomes are presented using box plots. When the data-generating model was the CRM-ERS, as depicted in Figure 2, the bias values had upper and lower that were closer to zero than those of the CRM. Figure 3 shows the box plots for the RMSEs. The CRM-ERS yielded lower RMSE values than did the CRM across all parameter estimators. Furthermore, increasing the sample size led to reduced bias and RMSE values when calibrating the CRM-ERS parameters. Conversely, the test length and correlation level had relatively minor impacts on the estimations of the item and structural parameters.
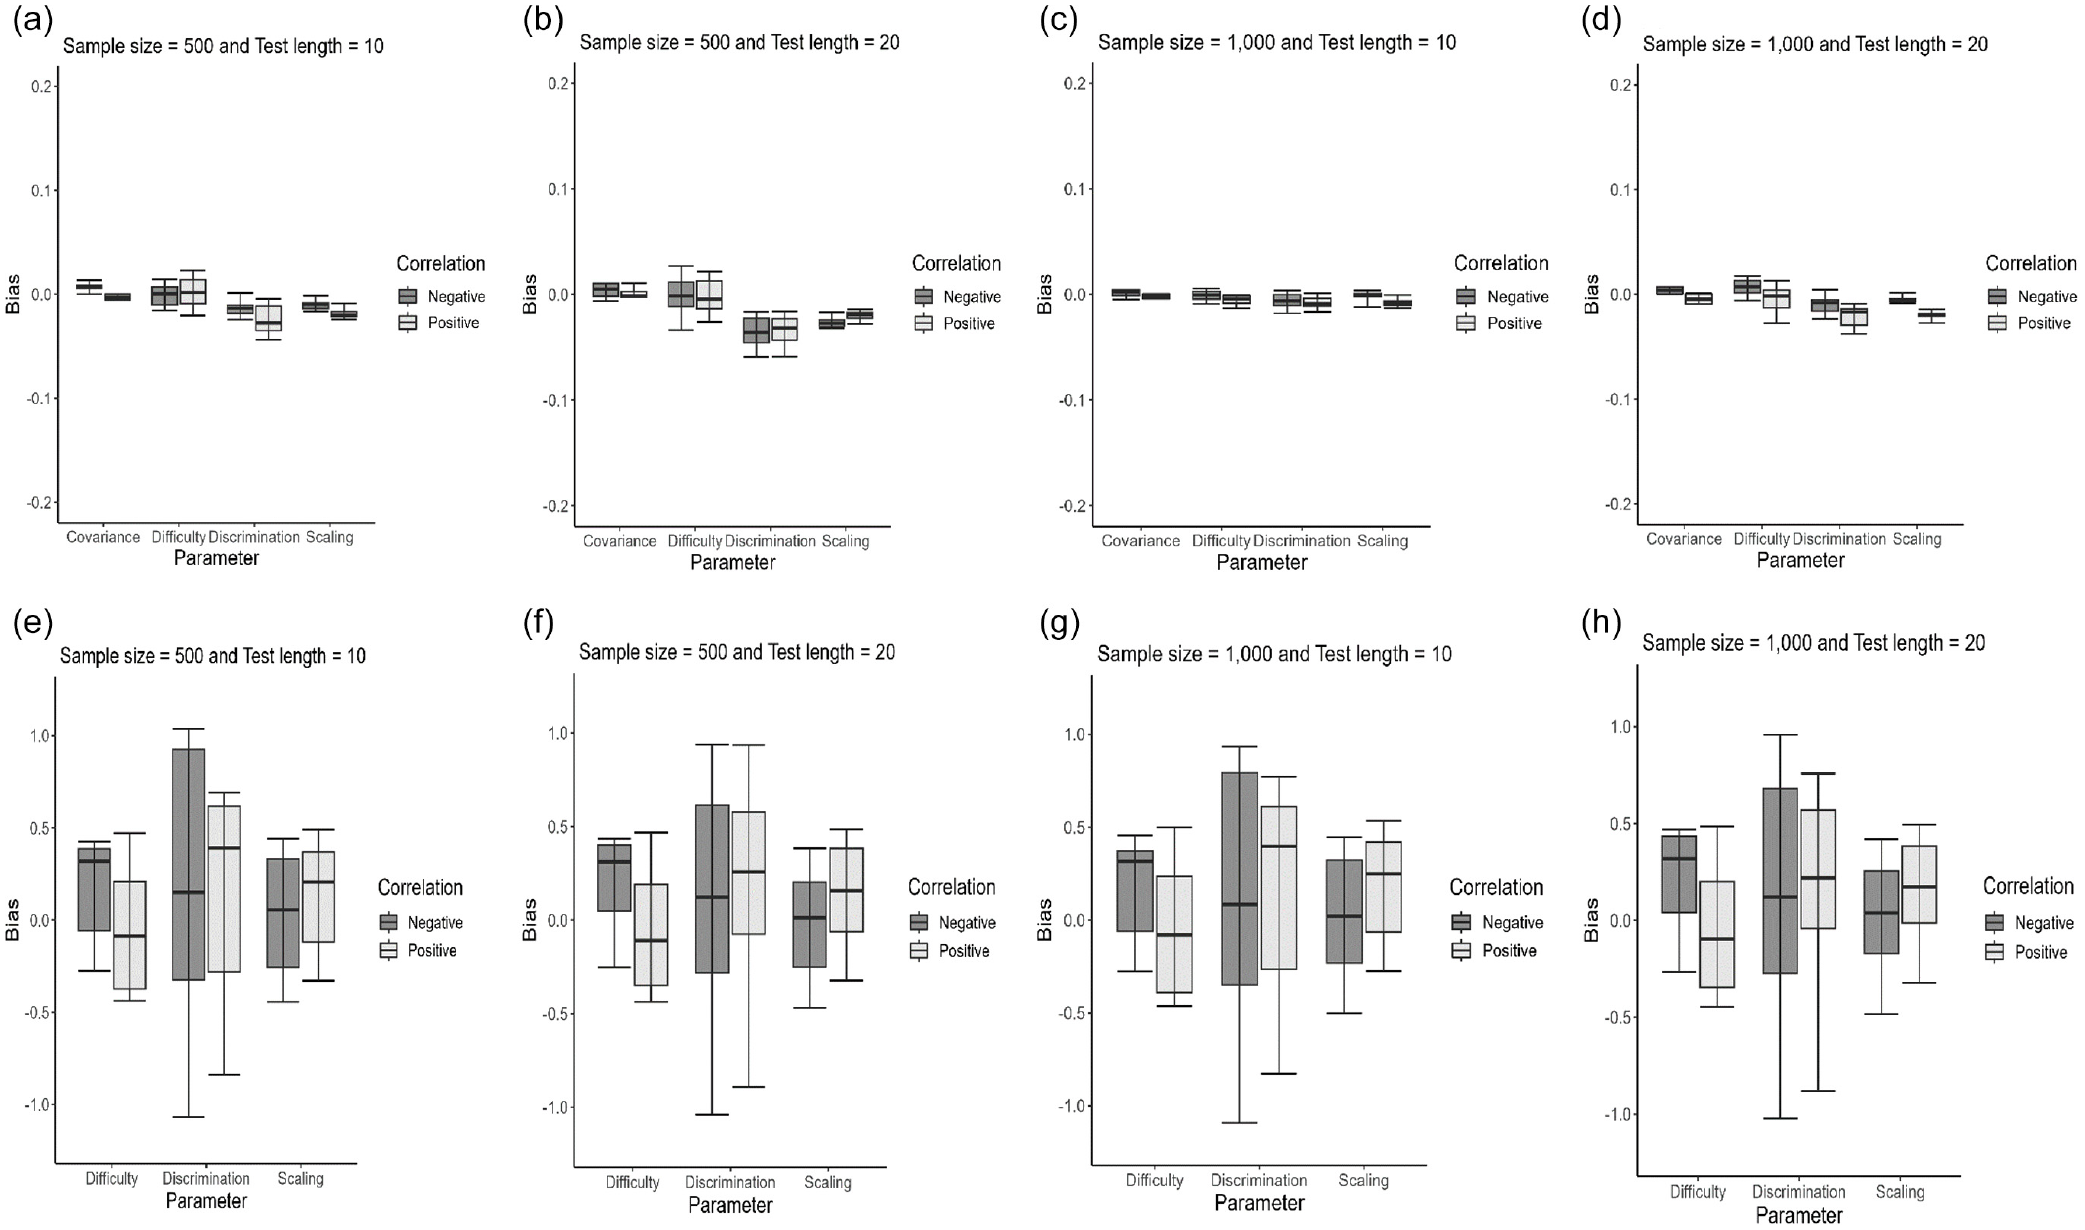
Box Plots of the Biases of the Parameter Estimates Calibrated Under Different Conditions When the CRM-ERS (a–d) and CRM (e–h) Are Fit to the Simulated CRM-ERS Data
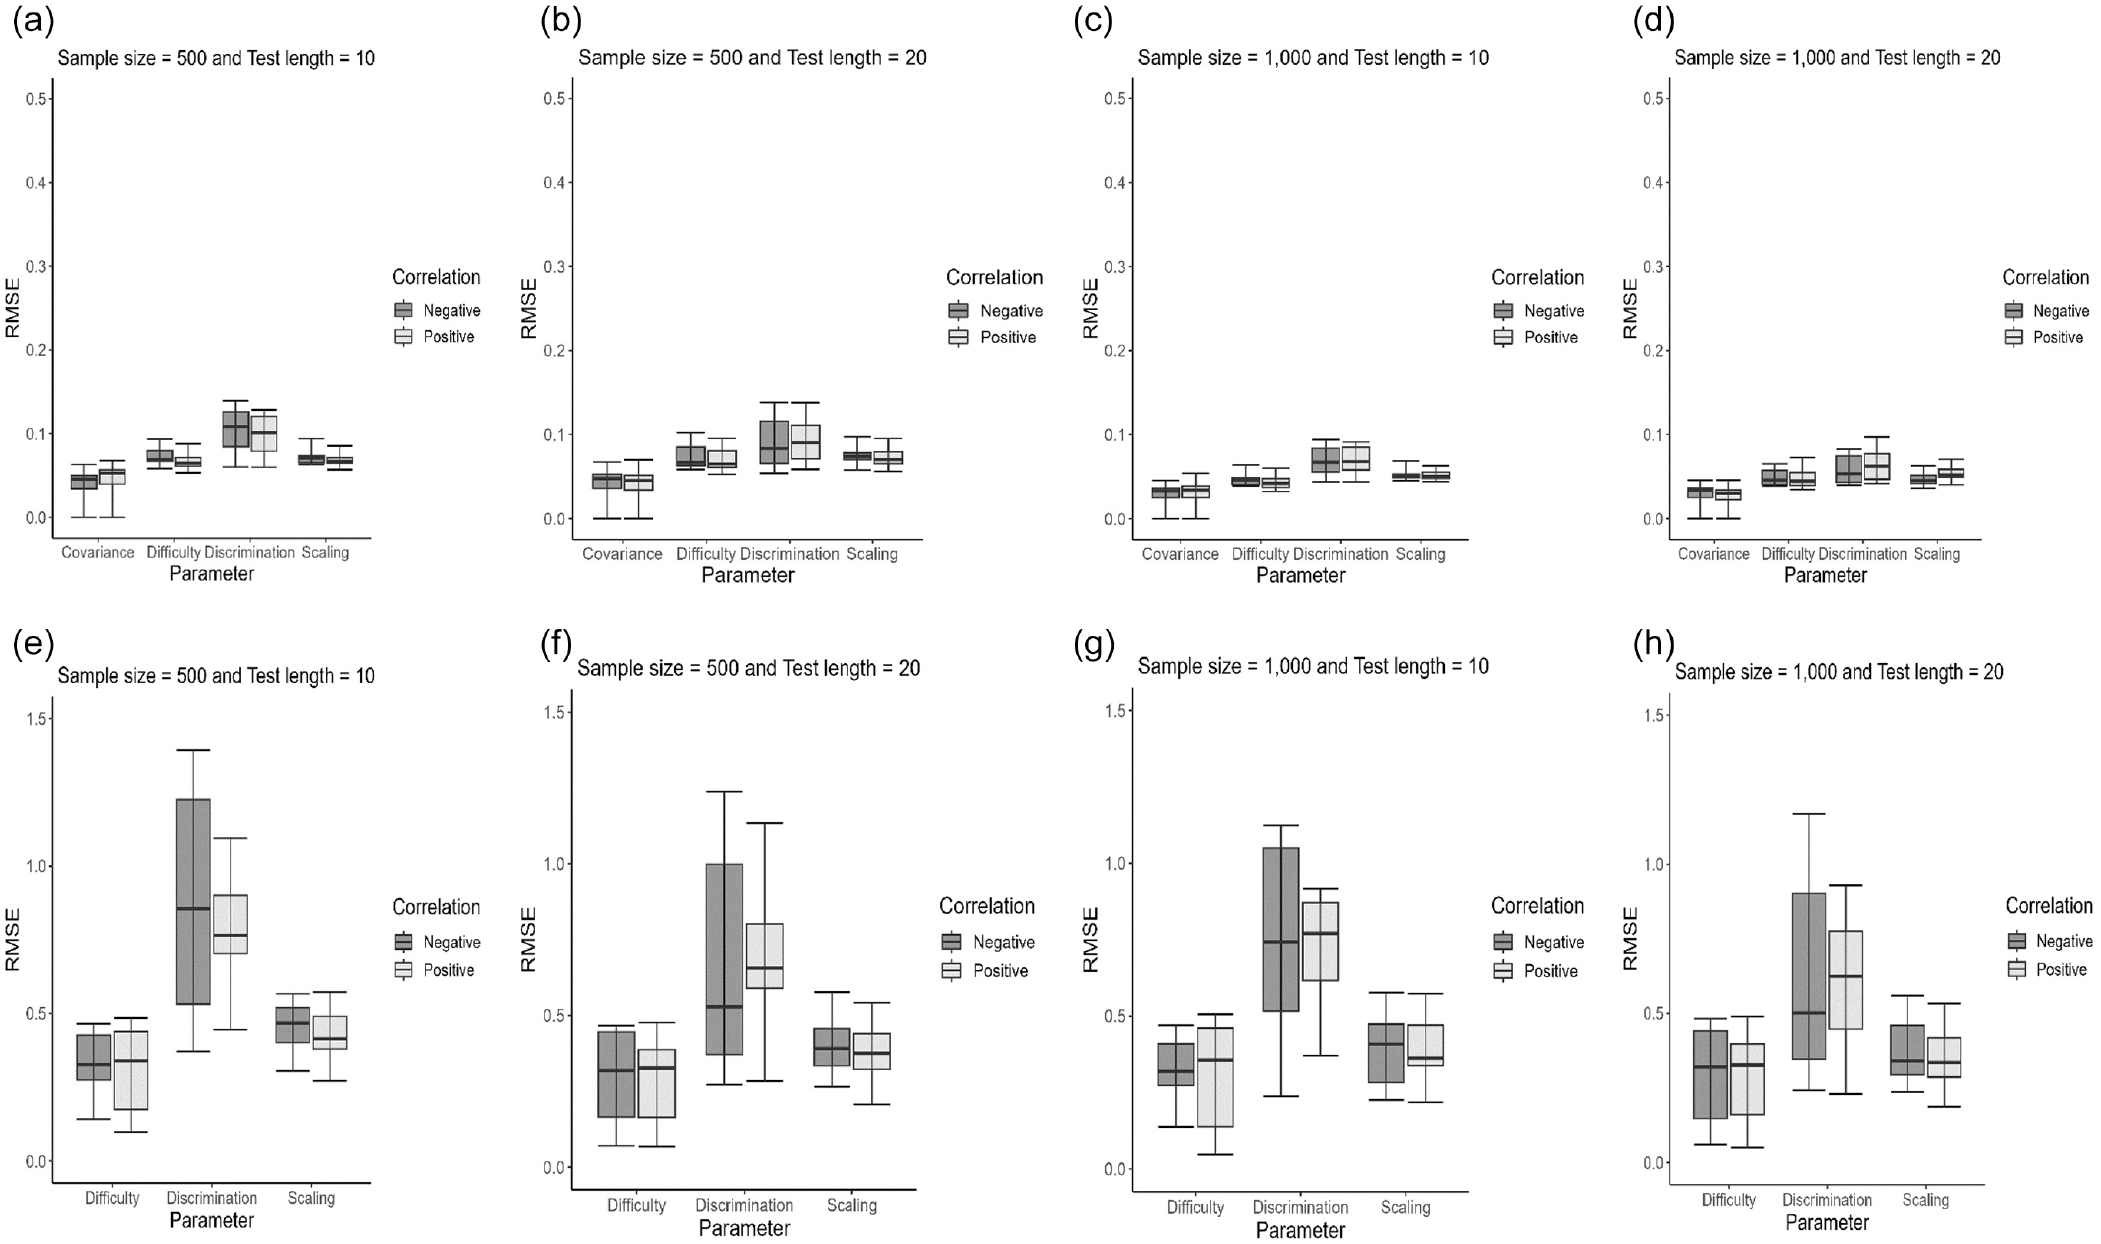
Box Plots of the RMSEs of the Parameter Estimates Calibrated Under Different Conditions When the CRM-ERS (a–d) and CRM (e–h) Are Fit to the Simulated CRM-ERS Data
Regarding the recovery of latent trait parameters, as depicted in Figure 4(a) and 4(b), the CRM-ERS more accurately estimated the latent trait than the CRM, regardless of whether the correlation was positive or negative. Furthermore, extending the test length further enhanced the precision of latent trait estimation within the context of the CRM-ERS. The CRM-ERS necessitated estimating an additional parameter related to ERS propensity, and Figure 4(c) illustrates that this parameter could be satisfactorily estimated, particularly when 20 items were administered. Furthermore, when inspecting the correlations between the true and estimated parameters, as shown in the upper portion of Table 1, the CRM-ERS had higher correlation values than the CRM for all conditions, and the conclusions described above can be directly applied.
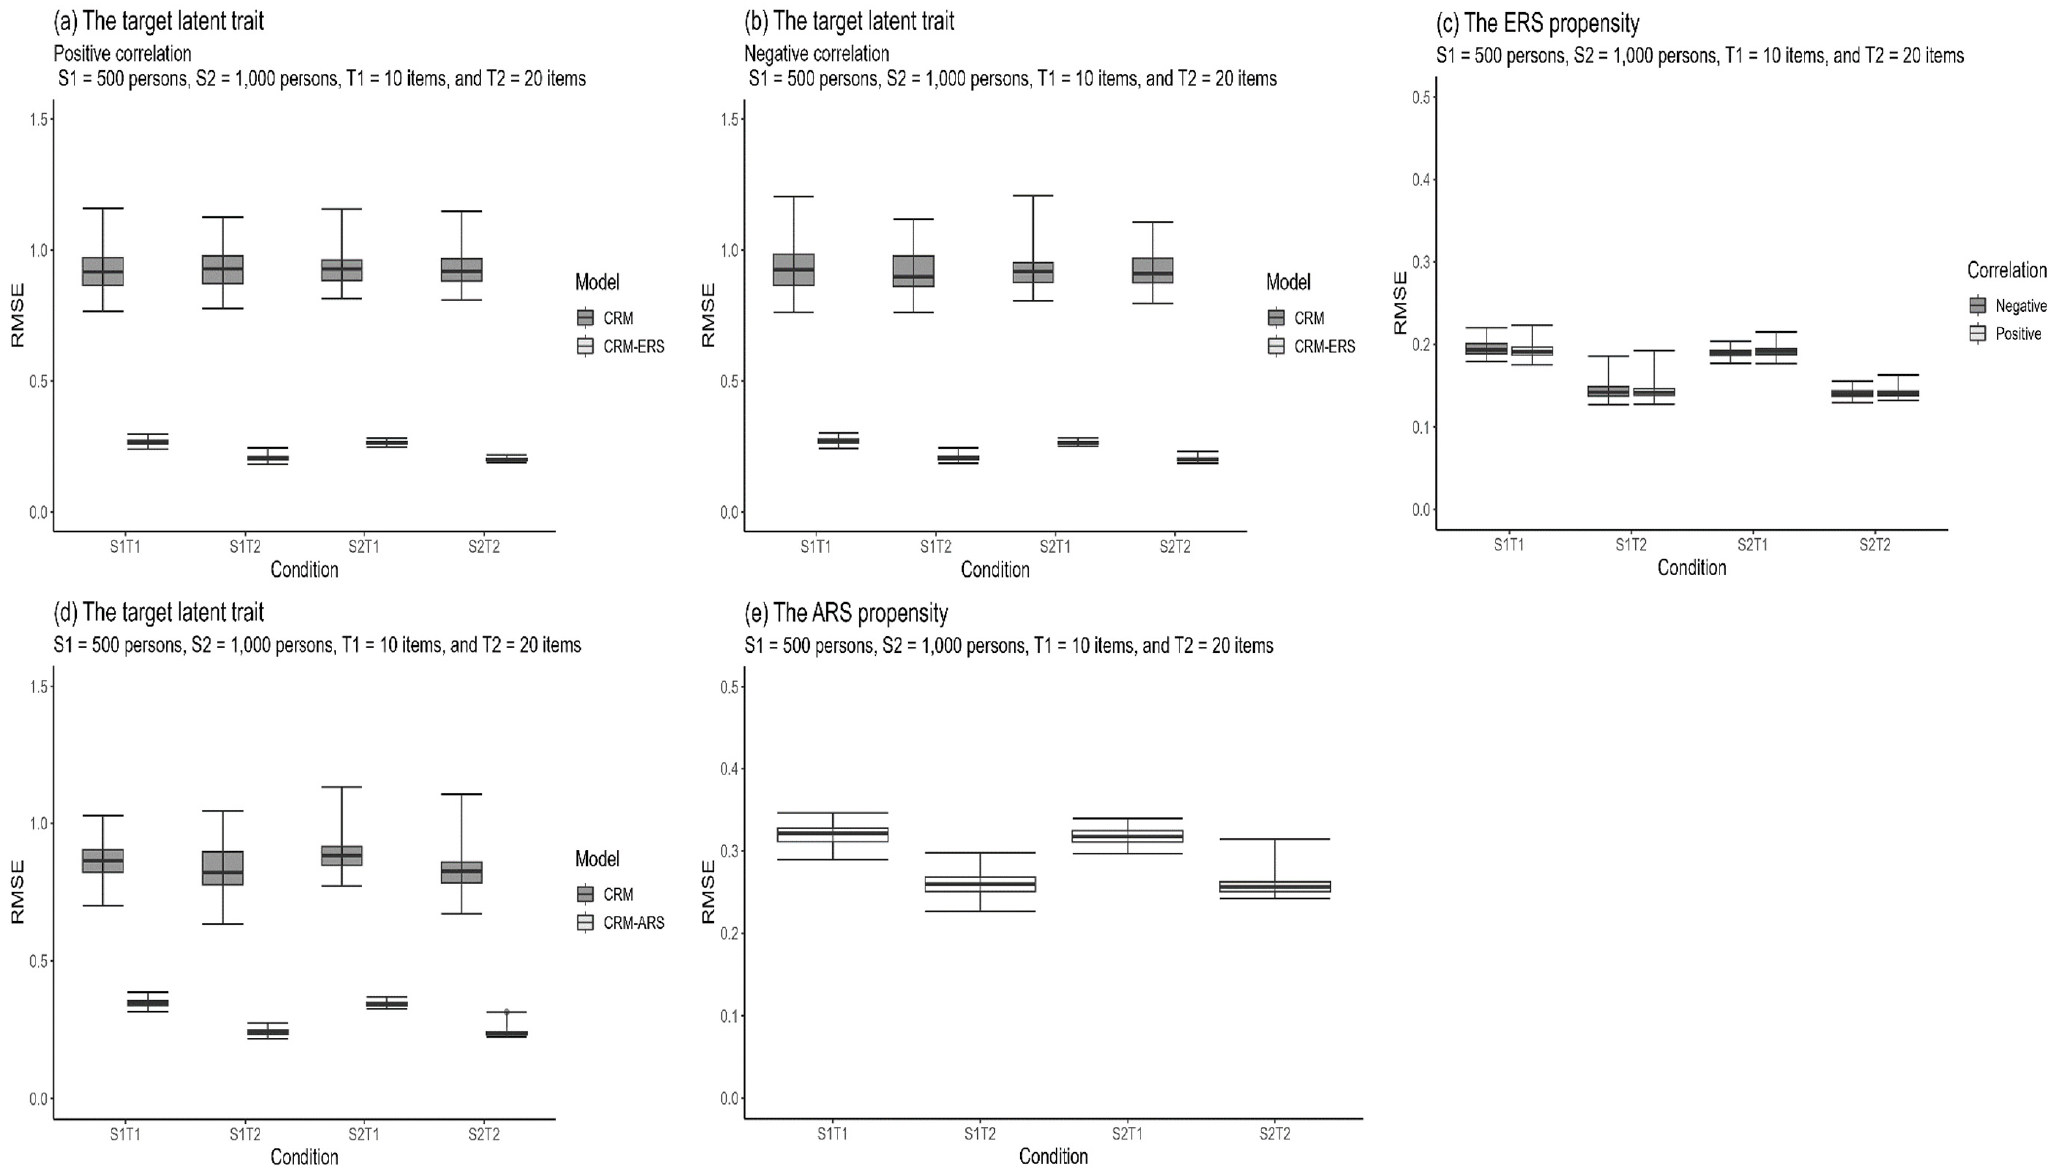
Box Plots of the RMSEs for Assessing the Recovery of the Person Parameters Under Different Conditions When the Data-Generating Models Are CRM-ERS (a–c) and CRM-ARS (d–e)
Mean Correlation Between the Generated and Estimated Parameters for the Simulated Data
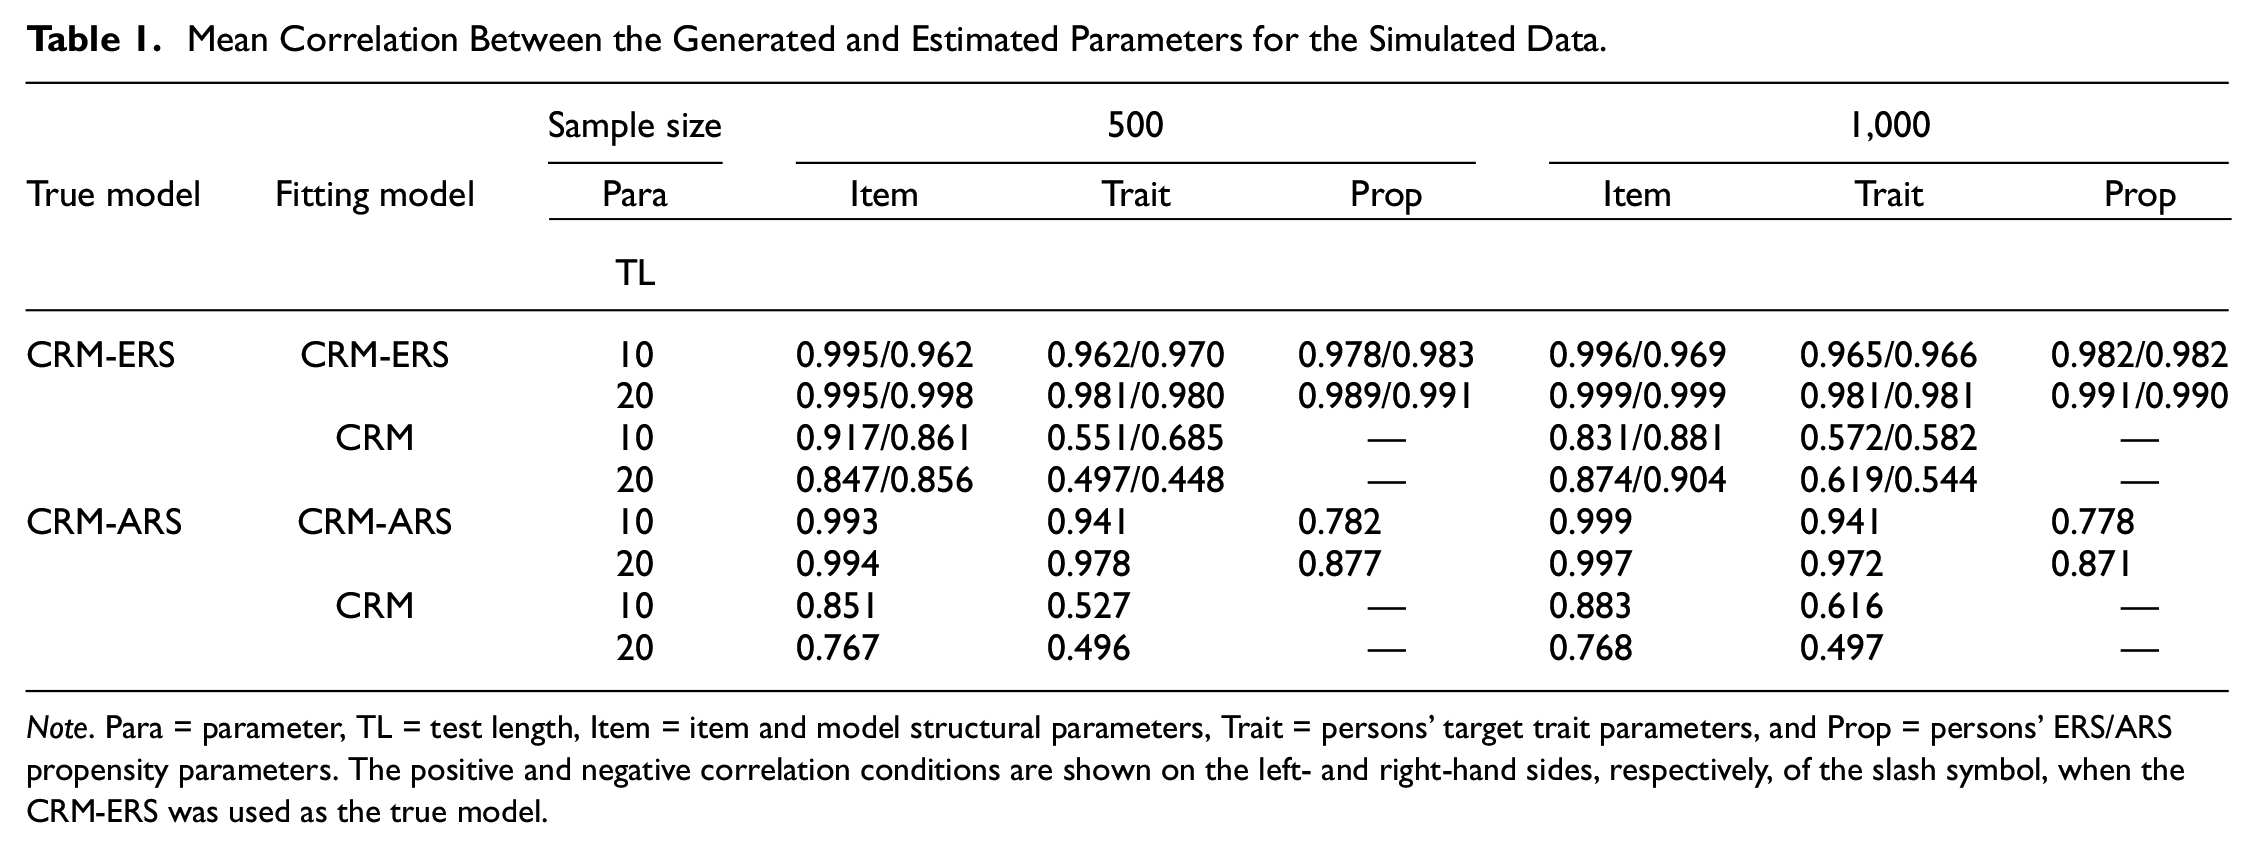
Note. Para = parameter, TL = test length, Item = item and model structural parameters, Trait = persons’ target trait parameters, and Prop = persons’ ERS/ARS propensity parameters. The positive and negative correlation conditions are shown on the left- and right-hand sides, respectively, of the slash symbol, when the CRM-ERS was used as the true model.
Simulation 2: Parameter Recovery Evaluation for the CRM-ARS
Figure 5 displays box plots depicting the RMSE and bias values for item and structural parameter estimations when the CRM-ARS and the CRM were applied to the CRM-ARS-generated data across various manipulation conditions. In terms of both bias and RMSE, the CRM-ARS consistently generated more accurate parameter estimates than the CRM. Notably, the evaluation criteria for the CRM-ARS and CRM exhibited substantial discrepancies, underscoring the significance of accounting for the effects of ARS on item responses. The majority of the CRM-ARS parameters were satisfactorily estimated, although slight variations were observed, particularly in the discrimination parameters pertaining to the ARS dimension (i.e.,
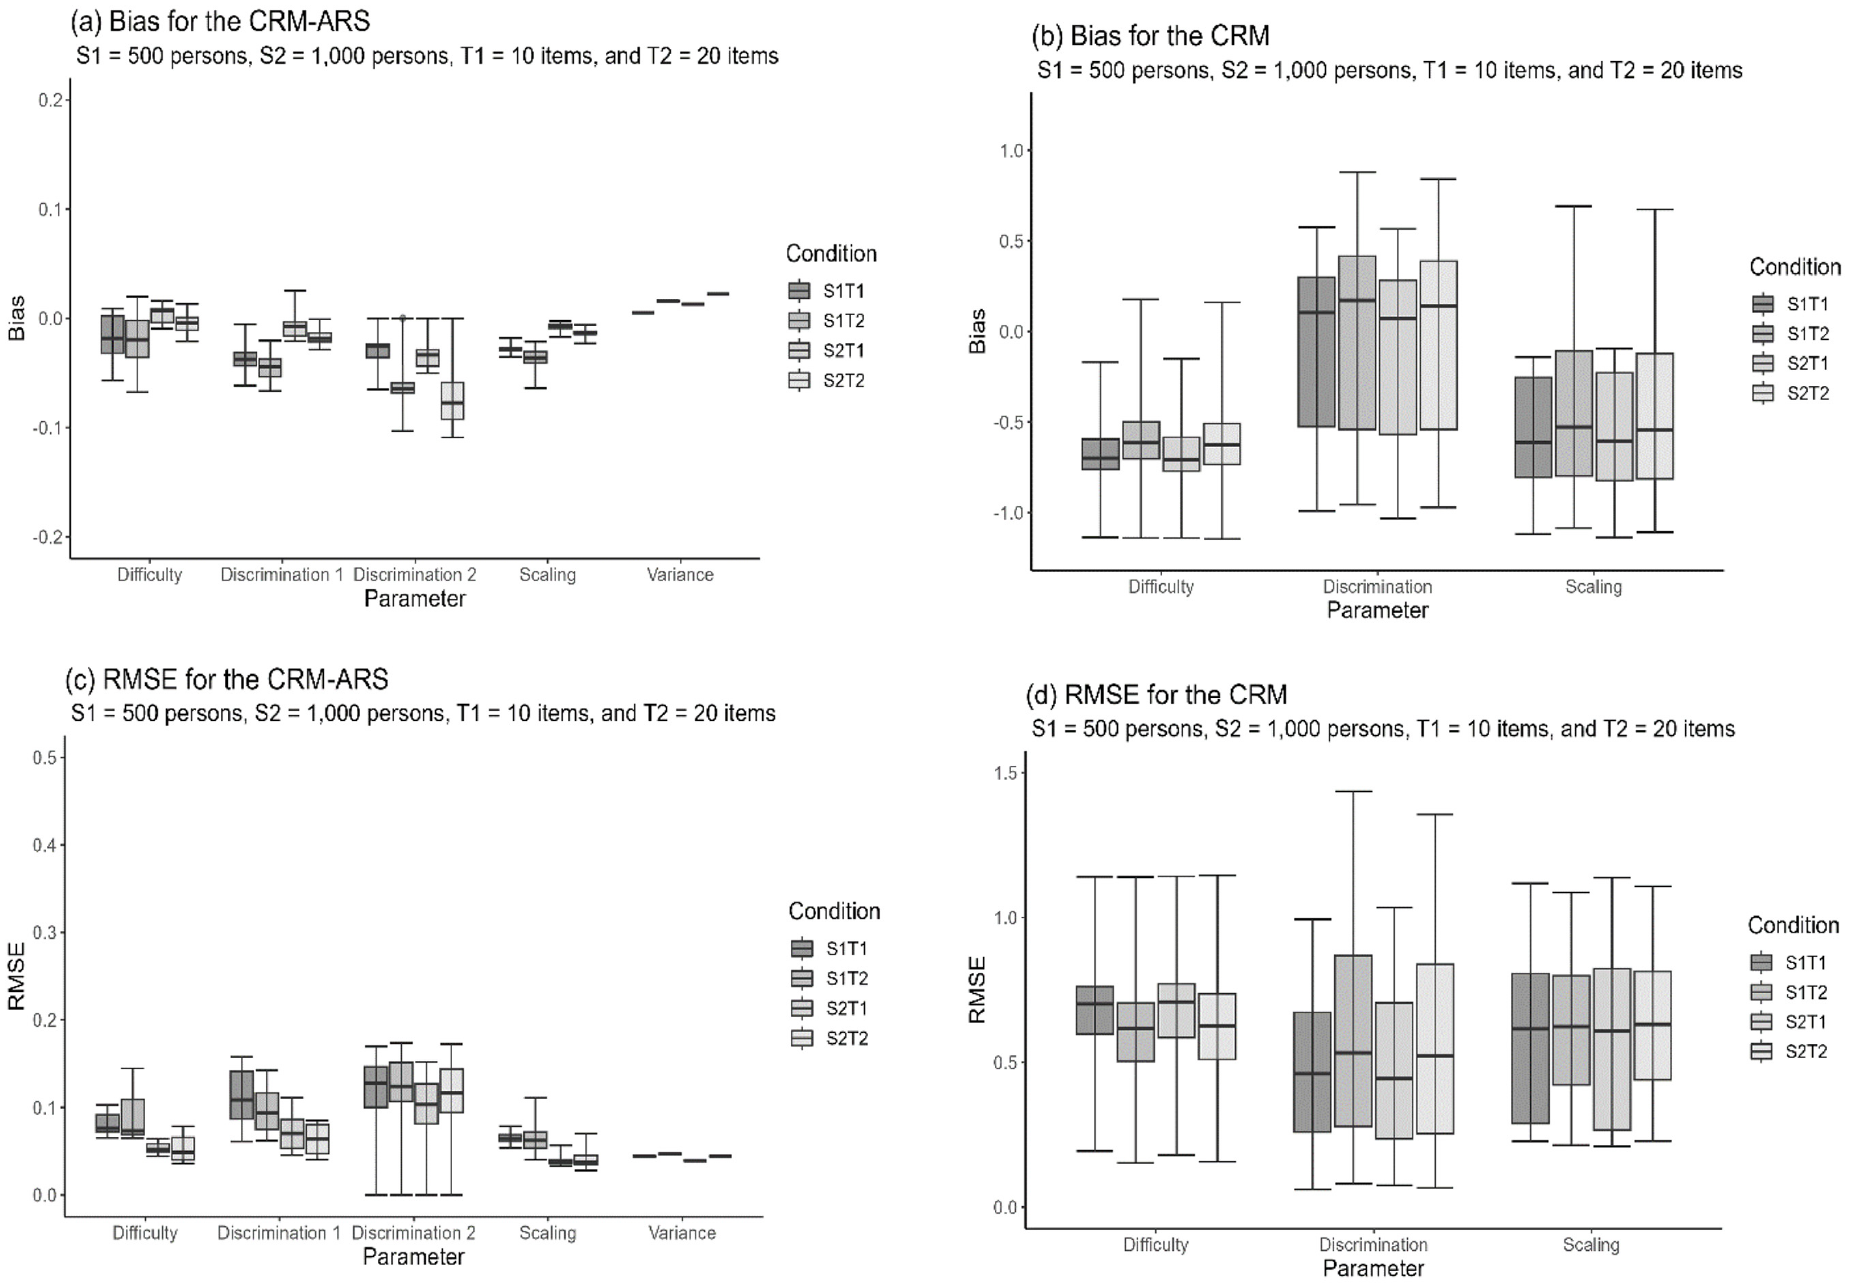
Box Plots of the RMSEs and Biases of the Parameter Estimates Calibrated Under Different Conditions When the CRM-ARS (a and c) and CRM (b and d) Are Fit to the Simulated CRM-ARS Data
When examining the effect on the recovery of personal parameters, the CRM-ARS exhibited more accurate latent trait estimates than the CRM. Furthermore, the CRM-ARS yielded acceptably precise estimations for ARS propensity, as demonstrated in Figure 4(d) and 4(e). The parameter recovery patterns of the CRM-ARS resembled those of the CRM-ERS, where longer test lengths correlated with more accurate person parameter estimations and larger sample sizes contributed to increased precision for item and structural parameter estimations. Again, the patterns of the correlations between the true and estimated parameters were consistent with those obtained from the inspection of the biases and RMSEs, as shown in the lower portion of Table 1. The results suggested that the CRM-ARS provided better parameter estimation than the CRM when individuals’ responses were influenced by the ARS tendency.
Simulation 3: Evaluation of Model-Data Fit Criteria
Table 2 shows the efficiency of the DIC and PSIS-LOOCV criteria when the VAS data were simulated according to a specific model fit to the true (data-generating) model and the other two misspecified models. When the true models were the CRM-ERS and CRM-ARS, employing the true model to fit the simulated data always yielded smaller DIC and PSIS-LOOCV values, and the proportions of individuals selecting the true model as the best-fitting model over replications approached one, suggesting that the DIC and PSIS-LOOCV criteria work efficiently in the detection of different response styles. The two fit criteria, however, failed to flag the CRM as the best-fitting model when the CRM data were fit to the three respective models. Next, we calibrated the item and person parameters under the fit of the three models for the CRM data and examined whether there were substantial differences in the parameter estimation between the CRM (i.e., the true model) and the two misspecified models.
Efficiency Evaluation of Model-Data Fit Criteria for the Simulated Data
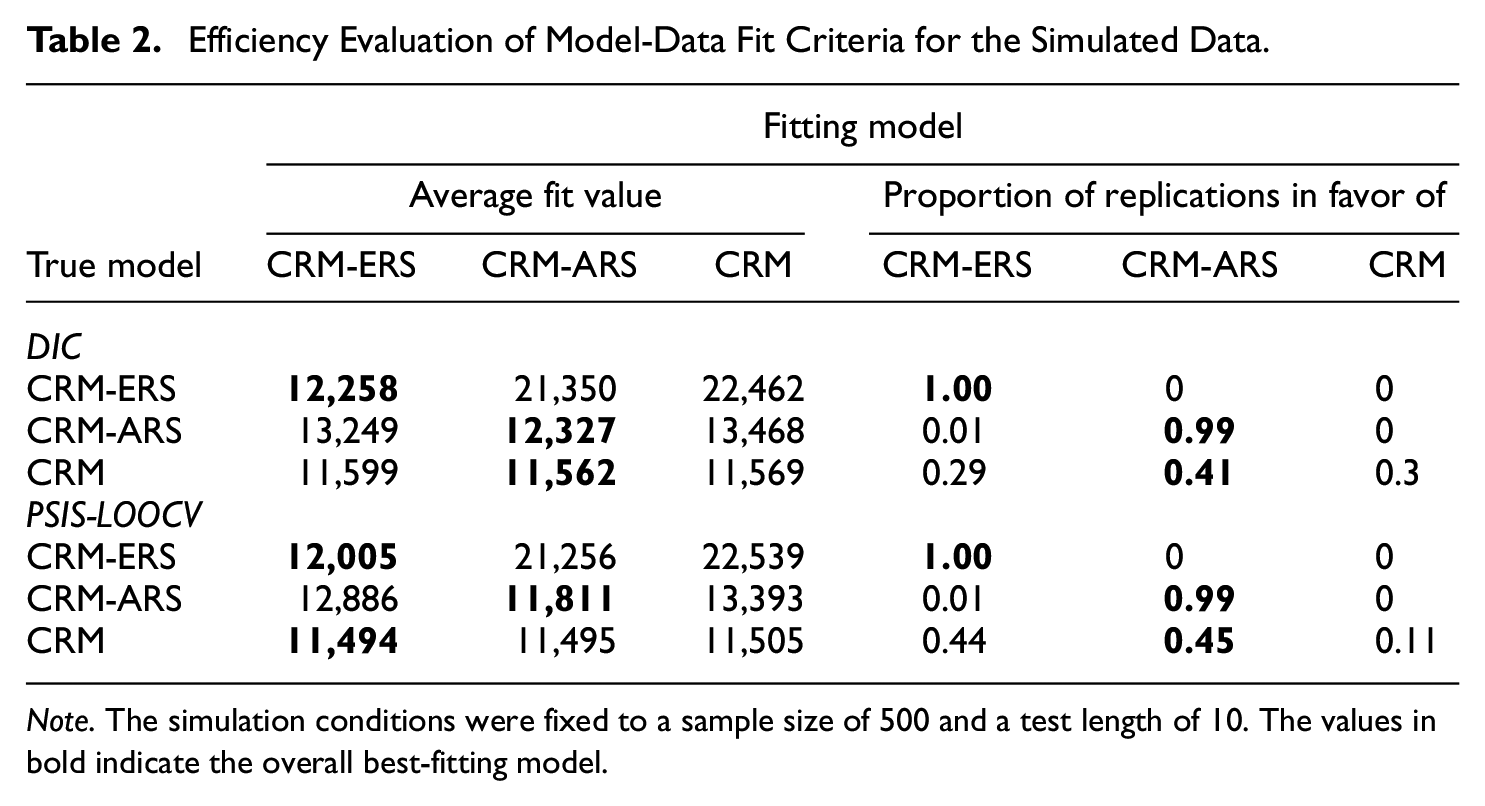
Note. The simulation conditions were fixed to a sample size of 500 and a test length of 10. The values in bold indicate the overall best-fitting model.
The CRM can be considered a special case of the CRM-ERS when the variance in the ERS propensity (i.e.,
Figure 6 shows the box plots for the bias and RMSE values under the fit of the three models to the CRM data when a small sample size of 500 persons and a short test length of 10 items were applied. The three fitting models, including the true CRM and the two extended CRMs considering the ERS and ARS effects, produced nearly comparable and satisfactory estimations for the item and person parameters because of their smaller bias and RMSE values. As expected, the mean of the estimate across replications was 0.000 for the variance in the ERS propensity under the fit of the CRM-ERS, and the CRM-ARS had a mean estimate of −5.000 and 0.000 for the distributional mean and variance in the ARS propensity, respectively; additionally, the mean
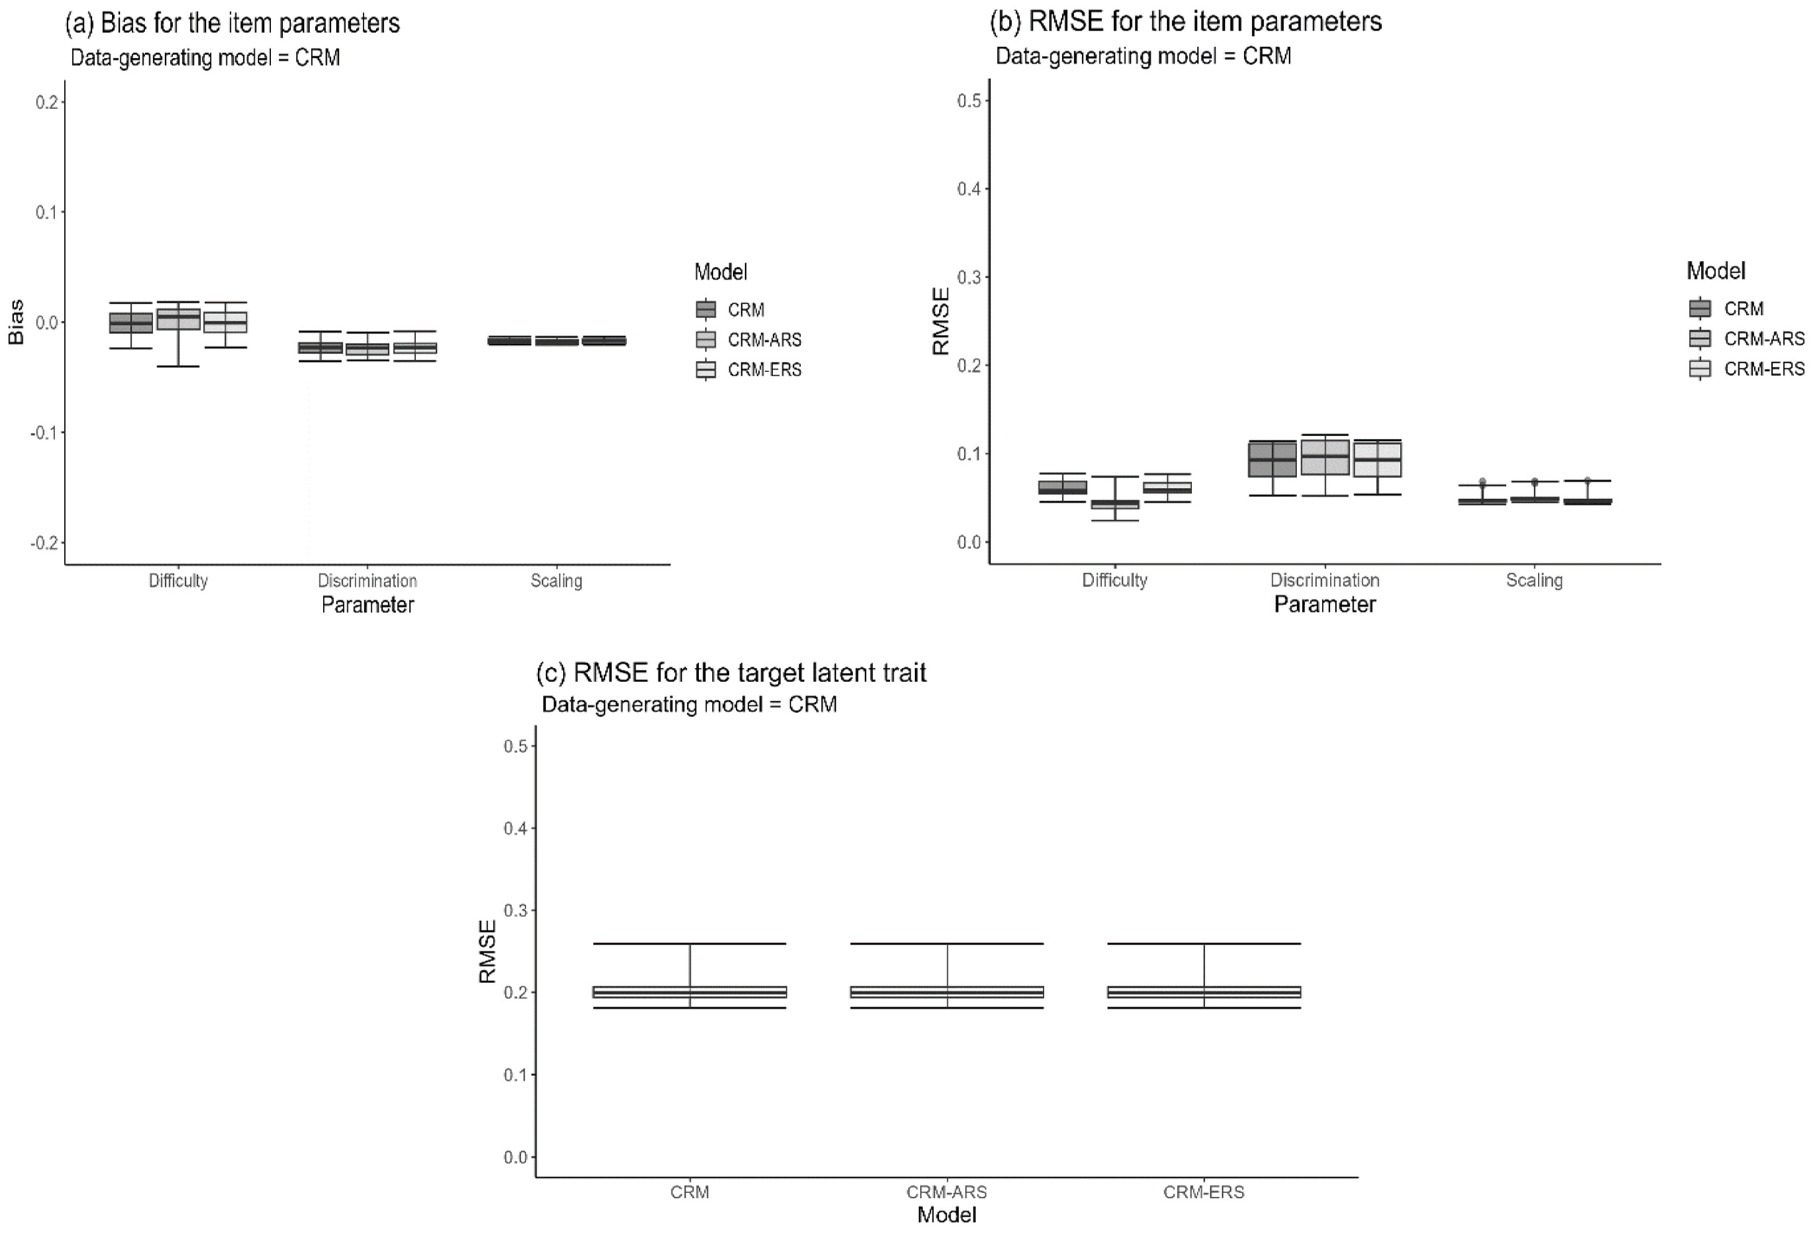
Box Plots of the RMSEs and Biases of the Parameter Estimates Calibrated Under Different Models When the Data-Generating Model Was the CRM
Empirical Study
In a study conducted by Kan (2009), a survey was administered to 307 preservice teachers to assess teacher self-efficacy in various teaching activities. The participants were instructed to indicate their judgments on ten measurement items by marking a point on an 11-cm line segment, with the endpoints representing extremes of certainty (cannot do at all to highly certain can do). This dataset can be found in the R package “ESTCRM” (Zopluoglu, 2022). To demonstrate the applicability of the extended CRMs for response styles, we applied our proposed models to this continuous dataset. Specifically, three models were utilized: the CRM-ERS, CRM-ARS, and conventional CRM. We aimed to fit these models to the data and subsequently compare their model-data fit performances.
To evaluate the model fit, two criteria, DIC and PSIS-LOOCV, were employed, and smaller DIC and PSIS-LOOCV values indicate a more favorable model-data fit. The JAGS program was utilized to calibrate the model parameters and the same prior distributions as those utilized in the simulation study were employed. The CRM-ERS demonstrated the most favorable fit, as indicated by the DIC values, which were 6,079, 7,148, and 6,725 for the CRM-ERS, CRM-ARS, and conventional CRM, respectively. In addition, the PSIS-LOOCV values were 5,783, 6,653, and 6,684 for the respective models. To explore the potential repercussions of disregarding extreme responses in VAS data, our focus shifted to the estimation disparities between the best-fitting model and the conventional model.
The upper portion of Table 3 depicts the parameter estimates for the model structural and item parameters under the CRM-ERS. These estimates ranged from 1.02 to 2.25 with an average of 1.71 for the item discrimination parameters, from −2.27 to −1.42 with an average of −1.90 for the item difficulty parameters, and from 0.81 to 1.01 with an average of 0.93 for the scaling parameters. In addition, the propensity for ERS exhibited a moderate negative correlation with the target trait, and the variation in ERS tendency across individuals appeared to be relatively mild.
The Estimates of the Model Structural Parameters Under the CRM-ERS (Upper Panel) and the Estimates of the Person Parameters Under the CRM and CRM-ERS Along With the Raw Response Scores for Selected Samples (Lower Panel)
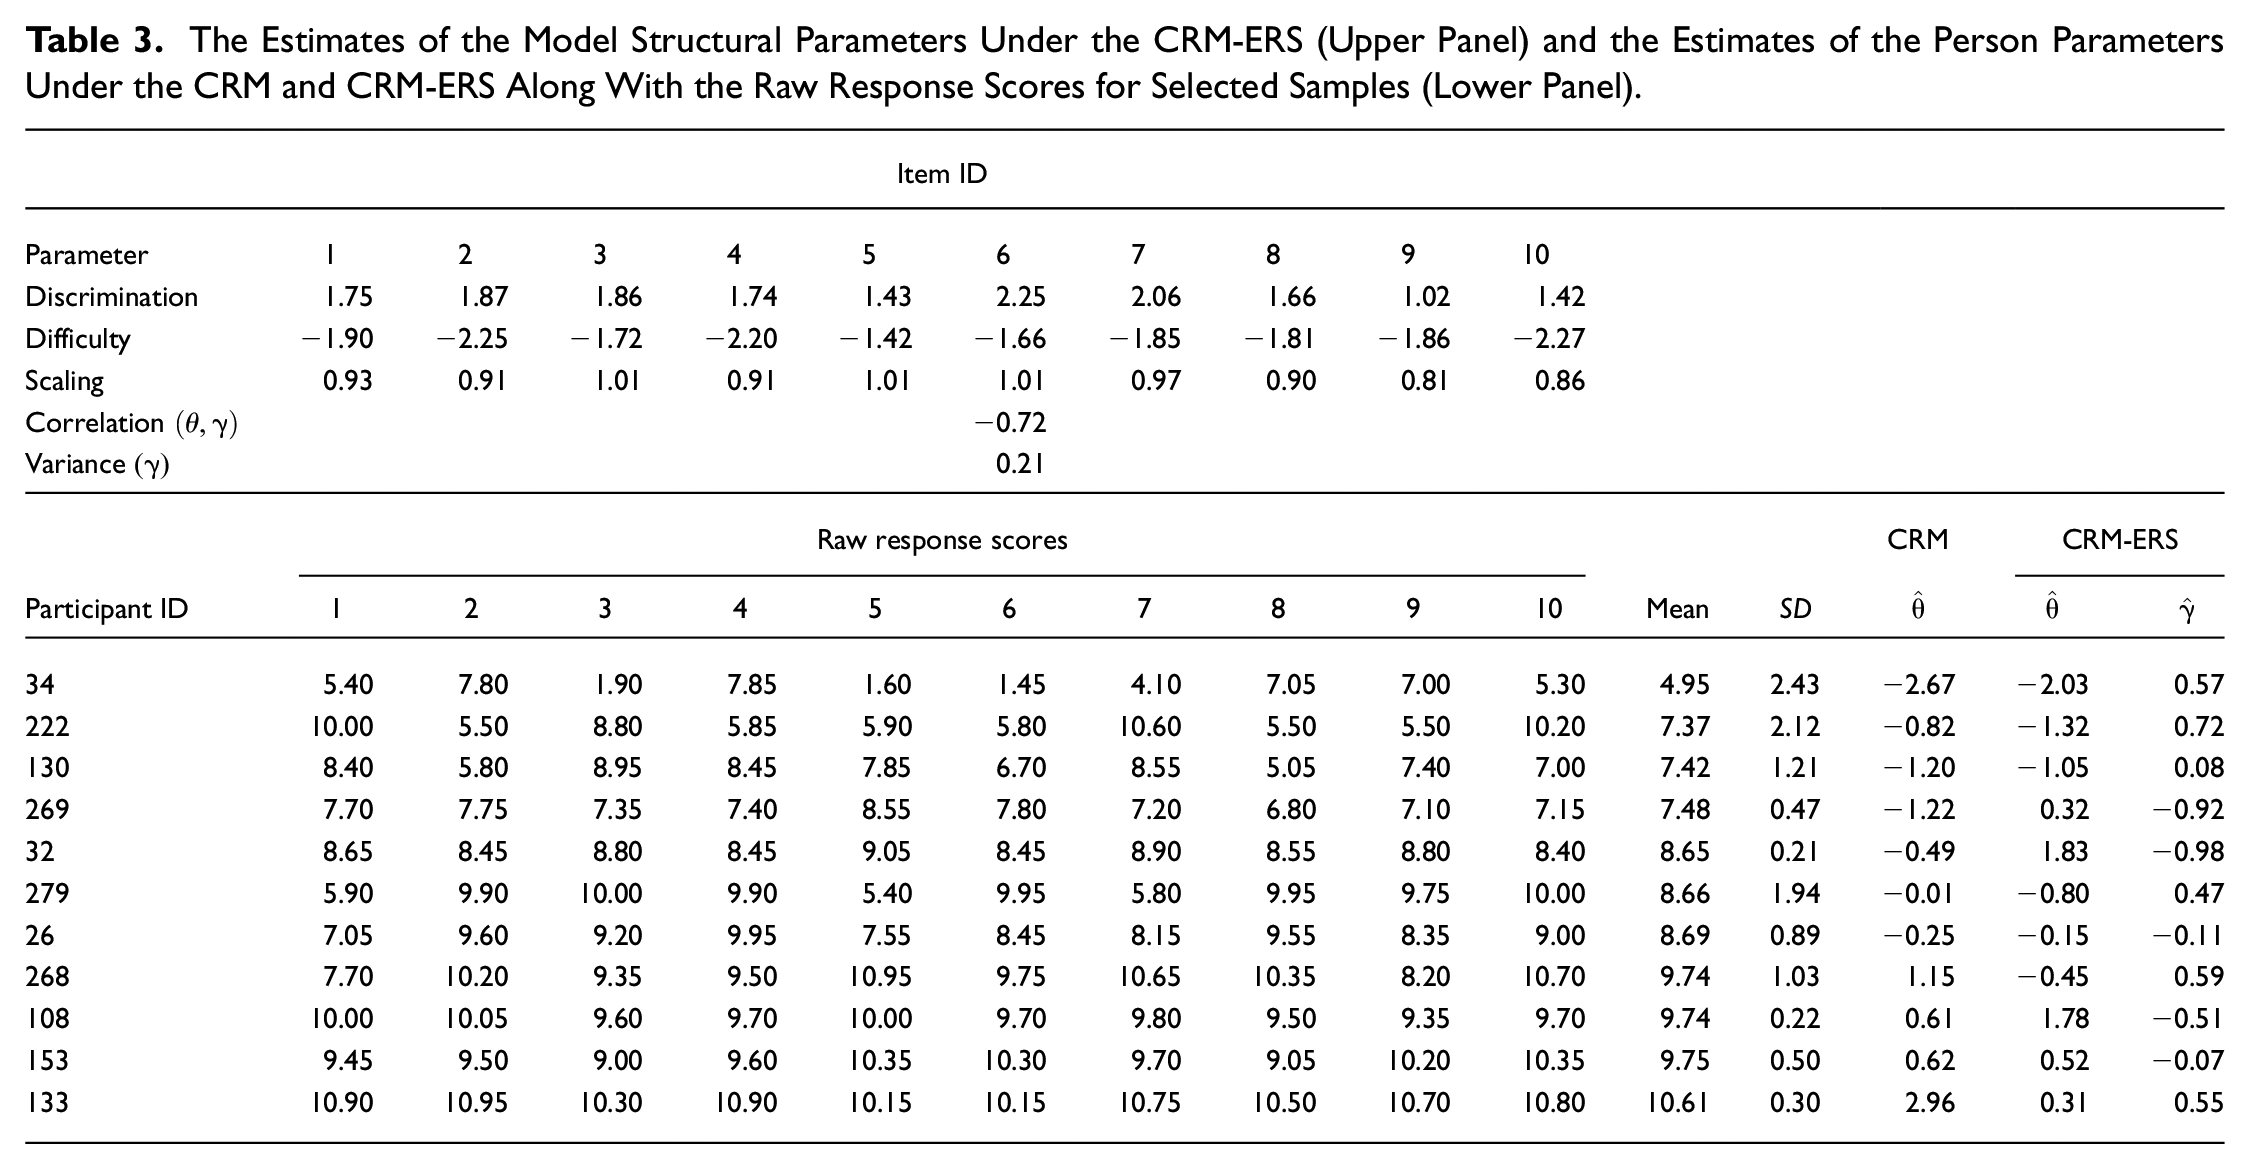
The literature indicates varying correlation estimates between substantive traits and ERS propensity: some studies have shown a moderate positive correlation (Plieninger & Meiser, 2014; Thissen-Roe & Thissen, 2013), some have exhibited a moderate negative correlation (LaHuis et al., 2019; Liu & Wang, 2019), and others have shown a slight or near-zero correlation (Bolt & Newton, 2011; LaHuis et al., 2019). The diverse findings may be attributed to the use of different modeling approaches and may depend on the survey contents applied for analysis. For example, LaHuis et al. (2019) applied two IRTree models derived from different cognitive process assumptions to fit real data and found that the correlations between the content and ERS dimensions were substantially different. Furthermore, Bolt and Newton (2011) used a multidimensional nominal response model to analyze multiscale data and found that the correlation estimation depended on which content was analyzed (see also Falk & Cai, 2016). Therefore, we cannot clearly determine the reasons behind the negative correlation estimated from our example or compare the results with those of previous studies because the measurement models and assessed tests were entirely different. As suggested by Liu and Wang (2019), a qualitative interview may be designed to identify the underlying cognitive bias triggering preservice teachers’ ERS tendencies and to investigate why people with lower teaching self-efficiency exhibit a greater tendency toward ERS. However, this approach is not accessible for the current analysis due to the nature of the secondary data.
The lower portion of Table 3 displays the raw response scores along with the corresponding θ and γ estimates for the selected samples. Given that the estimates for the item difficulty parameters were relatively low, only three respondents had a mean score below the median score of 5.5 on the scale (i.e., the midpoint of the continuum). This implies that most participants were more inclined to mark a point toward the right end of the continuum if their γ estimate was higher. Participant 34 was one of three individuals whose mean score fell below 5.5. Due to the elevated propensity for ERS
Participants 222, 130, and 269 had similar item mean scores but different γ estimates. Similar patterns emerged among Participants 32, 279, and 26 and among Participants 268, 108, and 153. When the mean scores were comparable, individuals with higher γ estimates consistently yielded higher θ estimates calibrated by the conventional CRM than those calibrated by the CRM-ERS. This indicates that neglecting the influence of ERS leads to an overestimation of θ. Conversely, individuals with a tendency toward MRS were associated with lower γ estimates. In these cases, the CRM-ERS attributed higher θ estimates to respondents with MRS tendencies. For example, Participant 32, with a
Notably, as in discrete multiple-parameter IRT models, respondents’ target trait estimates are no longer linearly correlated with their corresponding raw scores because the items are allowed to have different discriminating powers with respect to the substantive dimension (Embretson & Reise, 2000). For example, the CRM estimated the target trait parameter as 1.55 and 0.61 for Participants 268 and 108, respectively, while they had different item response patterns and the same mean raw score. In addition, the CRM-ERS is capable of separating the influences of target trait parameters from ERS propensity parameters on item responses to provide more precise estimations of target trait parameters. This finding implied that the trait estimates adjusted via the CRM-ESR would largely deviate from those calibrated by the conventional CRM and the corresponding raw scores when the ERS effect was considerably involved in the item responses. The deviation in the person-trait estimates between the CRM and CRM-ERS is illustrated by the following analysis.
Finally, we generated a scatter plot, as shown in Figure 7, to examine the relationship between the θ estimates obtained from the CRM and those obtained from the CRM-ERS. Notably, the scatter points deviated noticeably from the diagonal identity line. The correlation coefficient for the θ estimates between the two models was 0.58, underscoring the substantial differences in the θ estimates of the CRM-ERS and CRM. Aligned with the simulation results and the literature on response-style-relative IRT models (e.g., Jin & Wang, 2014; Liu & Wang, 2019; Plieninger, 2017; Tutz et al., 2018), it can be concluded that persons’ trait scores adjusted by the CRM-ERS are more predictive and inferable for their true performance levels than are those adjusted by the conventional CRM. To summarize, the empirical analysis of the data revealed that participants’ item responses were influenced by varying tendencies toward ERS or MRS. In addition, the CRM-ERS exhibited greater precision in estimation, positioning it as a valuable tool for quantifying different levels of extreme or middle responses.
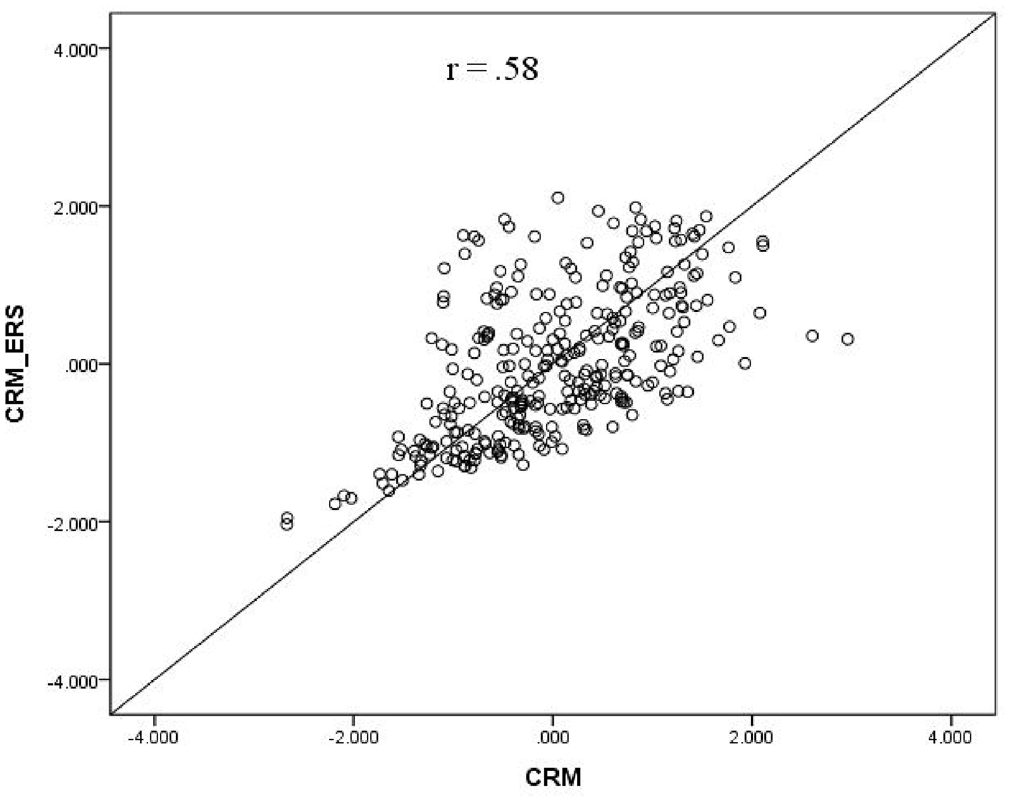
Relationship of the θ Estimates Between the CRM-ERS and CRM
A Follow-Up Simulation
Although the results of the empirical study indicated that the CRM-ERS provided a better fit to the real data than the competing models, the estimates of the item parameters did not spread within a range that was perfectly congruous with that of the simulation manipulation, especially for the item difficulty parameters (i.e., the items were much easier for participants). Therefore, a follow-up simulation that mimicked the real-data analysis conditions was conducted to evaluate the robustness of the CRM-ERS to variations in the model parameters. The item and structural parameters were set the same as the estimates from the above analysis, and the sample size was fixed to 307. The data responses were generated according to the CRM-ERS and then fit to the true model to examine the parameter recovery using the same procedure as in the above simulation. The simulation conditions were also replicated 100 times.
To respect the space constraints, the results of the parameter recovery are summarized as follows. The bias (or RMSE) values were between −0.048 (0.018) and −0.014 (0.156) for the item discrimination parameter, between −0.053 (0.089) and −0.012 (0.156) for the item difficulty parameters, between −0.019 (0.053) and −0.010 (0.067) for the scaling parameters, 0.014 (0.035) for the trait correlation parameter, and −0.006 (0.018) for the variance of the ERS propensity. In addition, the mean RMSEs across replications were 0.445 and 0.201 for the target trait and ERS propensity estimates, respectively. The quality of the parameter estimation derived from the real-time test was comparable to that obtained from the ideal conditions (as shown in Figures 2 to 4), indicating that the parameter recovery was less influenced by the variations in the parameter distribution.
Conclusion
Both discrete and continuous rating scales are frequently employed in survey research, and individuals’ responses can be influenced by various interpretations of these scales. Neglecting to appropriately account for response styles can potentially compromise the validity of tests and hinder accurate inferences about individuals’ abilities (Baumgartner & Steenkamp, 2001; Falk & Cai, 2016; Huang, 2016; Plieninger & Meiser, 2014). In light of the extensive investigation of ERS and ARS within the framework of discrete IRT modeling, we developed the CRM-ERS and CRM-ARS to accommodate these effects within VAS data. To explore the ramifications of the ERS and ARS effects, we simulated continuous response data under various conditions using the CRM-ERS or CRM-ARS. We then employed Bayesian methods to calibrate the model parameters based on the data-generating model and the conventional CRM. This approach allowed us to assess parameter recovery and investigate the implications of neglecting ERS and ARS effects on VAS responses.
The results of the simulations demonstrate that both the CRM-ERS and CRM-ARS exhibit satisfactory recoveries of item and person parameters when compared with the misleading conventional CRM. However, the discrimination parameters associated with the ARS dimension in the CRM-ARS displayed only marginally acceptable estimation precision due to their transformation through an exponential function within the probabilistic density function. Consistent with most psychometric models, increasing the test length enhances the measurement precision of person parameters, while increasing the sample size improves parameter calibration for both item and structural parameters in the CRM-ERS and CRM-ARS.
For ease of application and illustration, we selected an empirical dataset that employed a continuous item response format to measure the self-efficacy of preservice teachers in teaching activities. We then fit this dataset to the extended CRMs we developed, aiming to detect potential ERS and ARS effects. Following model-data fit evaluation, the CRM-ERS emerged as the optimal choice, indicating that the presence of ERS influences item responses and revealing variations in participants’ tendencies to overuse the endpoints or middle points on the response continuum. Due to the relatively low estimates for the item difficulty parameters within the CRM-ERS (all negative estimates), participants tended to select higher scores on the continuum. Most notably, the ERS dimension influenced the rightmost points of the continuous rating scale for most participants. A comparison of the outcomes derived from the best-fitting CRM-ERS with those from the conventional CRM demonstrated that the conventional CRM calibration tended to underestimate the target latent trait parameters when a participant exhibited a tendency toward the MRS (i.e., a negative
Under the framework of general linear models, the proposed CRM-ARS can be thought of as a special case of the random intercept item factor analysis model (Maydeu-Olivares & Coffman, 2006) when the random intercept term is assumed to be positive and the observed responses have been logit-transformed. Therefore, the CRM-ARS can be flexibly modified to meet the needs of real testing situations. For example, to reduce the influence of the ARS, a balance scale (Ray, 1983), which designs half of the test items to measure the target trait in one direct direction and the other half to measure the opposite direction (i.e., reverse-worded items), has frequently been applied in the social sciences. Due to the poor measuring properties found for negatively worded items (Barnette, 2000), the CRM-ARS can be utilized to fit positively and negatively related item responses for the purpose of controlling for the ARS. Following common practice, one can first reverse score for reverse-worded items and then postulate a positive loading on the ARS dimension for the positive-worded items and a negative loading on the ARS dimension for the negative-worded items because, for the negative-worded items, a low score implies the propensity to agree with these items. In addition, to make the parameter estimation more stable and calculable, the weak assumption of balance can be adopted, and the sum of the loadings on the ARS dimension can be forced to be zero (see Ferrando et al., 2011; Ferrando & Lorenzo-Seva, 2010).
When fitting the proposed CRM-ERS and CRM-ARS to empirical VAS data in real testing situations, several recommendations are provided to guide the research direction. First, the lower and upper boundaries should be inspected, and the observed item responses should be rearranged by removing maximum and minimum scores or enlarging the scoring interval to avoid the difficulty of logit transformation (Finch, 2023; Tutz & Jordan, 2023). The second step is to determine which response style matches the data. For the current application, one can fit the CRM-ERS, CRM-ARS, and conventional CRM to the data and compare them with each other in terms of model-data fit criteria, as we used DIC and PSIS-LOOCV. The third step is to examine whether the variance of the ERS or ARS propensity is substantially small and not statistically significant or whether the distributional mean of the ARS score is extremely low when the CRM-ERS and CRM-ARS are selected as the best-fitting models. Although the DIC and PSIS-LOOCV criteria are not sensitive to the choice of a simple model, using complex CRM-ERS and CRM-ARS models to fit CRM data always produces precise and satisfactory parameter estimations. Considering model parsimony, parsimonious CRM is recommended when the response styles have no effect. For the fourth step, the item content is reviewed, and the items that are likely to trigger ERS or ARS are rewritten. For example, the
While this study holds significant value in the development and extension of the CRM to account for ERS and ARS, further efforts are necessary, and additional research is warranted to comprehensively address this complex topic. First, importantly, response styles are not confined to the ERS and ARS effects alone; multiple response styles could concurrently influence respondents’ strategies when utilizing continuous rating scales. A diverse array of discrete IRT models has been formulated under a comprehensive measurement framework to simultaneously address various response styles and enable latent subpopulations to be impacted by distinct response styles using a mixture modeling approach (Falk & Cai, 2016; Huang, 2016; Liu & Wang, 2019; Plieninger, 2017). By applying this approach to the analysis of VAS data, one might contemplate merging the CRM-ERS and CRM-ARS to quantify both ERS and ARS tendencies or explore latent heterogeneity concerning ERS or ARS tendencies within the population. However, such extensions can present estimation efficiency challenges, given the simultaneous involvement of multiple latent propensities and the need to appropriately address model identifiability. Future research in this domain could explore these complexities and strive to develop models that accommodate a broader spectrum of response styles in VAS data. This approach would contribute to a more comprehensive understanding of the intricacies involved and pave the way for improved measurement practices.
Second, leveraging additional information to enhance measurement precision and offer insights into cognitive processes has potential. For instance, the time respondents take to answer individual items could be collectively modeled with the distribution of item responses, enabling the interplay among the target trait, response-style-related tendencies, and speed factors to be explored. This could be achieved within the hierarchical modeling framework (van der Linden, 2007). Furthermore, external covariates such as gender, age, or other relevant background variables could be integrated to elucidate population heterogeneity through regression of latent propensities against the covariate set. This objective could be accomplished by employing the explanatory item response modeling framework (De Boeck & Wilson, 2004), which warrants further exploration and investigation.
Recently, Tutz and Jordan (2023) introduced a comprehensive framework of latent trait response models tailored for continuous responses. They developed a threshold model that is remarkably flexible in accommodating a wide array of continuous response types, encompassing positive responses and range restrictions, through specifying diverse response and difficulty functions (also referred to in Tutz, 2022). Various existing models for measuring continuous scales, including the CRM (Samejima, 1973; T. Wang & Zeng, 1998), factor-analytic models (McDonald, 1985), generalized linear IRT model (Mellenbergh, 1994), and lognormal response-time model (van der Linden, 2006), can be viewed as special examples of this threshold model. Effectively addressing the influence of response styles on VAS scores within the general thresholds model perspective requires substantial effort. Exploring how to extend the threshold model to cater to these requirements is an intriguing subject worth further investigation.
Supplemental Material
sj-docx-1-epm-10.1177_00131644241242789 – Supplemental material for Exploring the Influence of Response Styles on Continuous Scale Assessments: Insights From a Novel Modeling Approach
Supplemental material, sj-docx-1-epm-10.1177_00131644241242789 for Exploring the Influence of Response Styles on Continuous Scale Assessments: Insights From a Novel Modeling Approach by Hung-Yu Huang in Educational and Psychological Measurement
Footnotes
Author’s Note
Hung-Yu Huang is currently a professor at the Institute of Education, National Cheng Kung University, Taiwan. The address is No. 1, University Rd., East District, Tainan City 70101, Taiwan. Correspondence should be addressed to
Declaration of Conflicting Interests
The author declared no potential conflicts of interest with respect to the research, authorship, and/or publication of this article.
Funding
The author disclosed receipt of the following financial support for the research, authorship, and/or publication of this article: This study was supported by the National Science and Technology Council (No. 112-2410-H-845-036).
Supplemental Material
Supplemental material for this article is available online.
References
Supplementary Material
Please find the following supplemental material available below.
For Open Access articles published under a Creative Commons License, all supplemental material carries the same license as the article it is associated with.
For non-Open Access articles published, all supplemental material carries a non-exclusive license, and permission requests for re-use of supplemental material or any part of supplemental material shall be sent directly to the copyright owner as specified in the copyright notice associated with the article.