
Abstract
The multidimensional forced-choice (MFC) format is an alternative to rating scales in which participants rank items according to how well the items describe them. Currently, little is known about how to detect careless responding in MFC data. The aim of this study was to adapt a number of indices used for rating scales to the MFC format and additionally develop several new indices that are unique to the MFC format. We applied these indices to a data set from an online survey (N = 1,169) that included a series of personality questionnaires in the MFC format. The correlations among the careless responding indices were somewhat lower than those published for rating scales. Results from a latent profile analysis suggested that the majority of the sample (about 76–84%) did not respond carelessly, although the ones who did were characterized by different levels of careless responding. In a simulation study, we simulated different careless responding patterns and varied the overall proportion of carelessness in the samples. With one exception, the indices worked as intended conceptually. Taken together, the results suggest that careless responding also plays an important role in the MFC format. Recommendations on how it can be addressed are discussed.
Keywords
When using self-reports to infer respondents’ trait levels, one concern researchers and practitioners alike have is that some participants might not have responded accurately and carefully to some (or even most) items, that is, data quality might be affected by careless responding. Alternative response formats to the ubiquitous rating scales, such as the multidimensional forced-choice (MFC) format, which requires participants to rank multiple items rather than rate individual items, have been successful in reducing other response biases such as faking. However, it is currently unclear how to detect careless responding in this format. The aim of this study was therefore to develop indices to detect careless responding in the MFC format. In doing so, we took existing indices for rating scales, adapted them to the MFC format, and developed new indices which are unique to the MFC format. Our first aim was to examine the performance of and correlations among these indices in the MFC format (Research Question 1). Furthermore, we were interested in whether different types of careless respondents in MFC questionnaires exist (i.e., different classes in a latent profile analysis; Research Question 2) as well as in the proportion of the sample that responded carelessly on the developed indices (Research Question 3) and over the course of the study (Research Question 4). Moreover, we conducted a simulation study for a conceptual proof of the developed indices.
In the following, we will give some background on the forced-choice format and briefly present it as an alternative to rating scales in personality questionnaires. Then, we will introduce careless responding as a response bias and present methods to detect careless responding in rating scale data. Next, indices that can be used to detect careless responding in MFC questionnaires are described. Finally, our research questions and hypotheses are derived.
The Multidimensional Forced-Choice Format
In the forced-choice format, two or more items are presented together in blocks. Participants are then instructed to select the items that describe them most and/or least (partial ranking) or to rank all items according to how well they describe them (full ranking). The items within a block can measure the same trait or different traits. The latter is known as the MFC format (see Figure 1 for an example). Variations in block size and different ranking instructions are described in Wetzel et al. (2020), for example. In our study, blocks were multidimensional and we instructed participants to rank the three items according to how well the items described them in their typical behavior (i.e., full ranking of three items representing different traits).
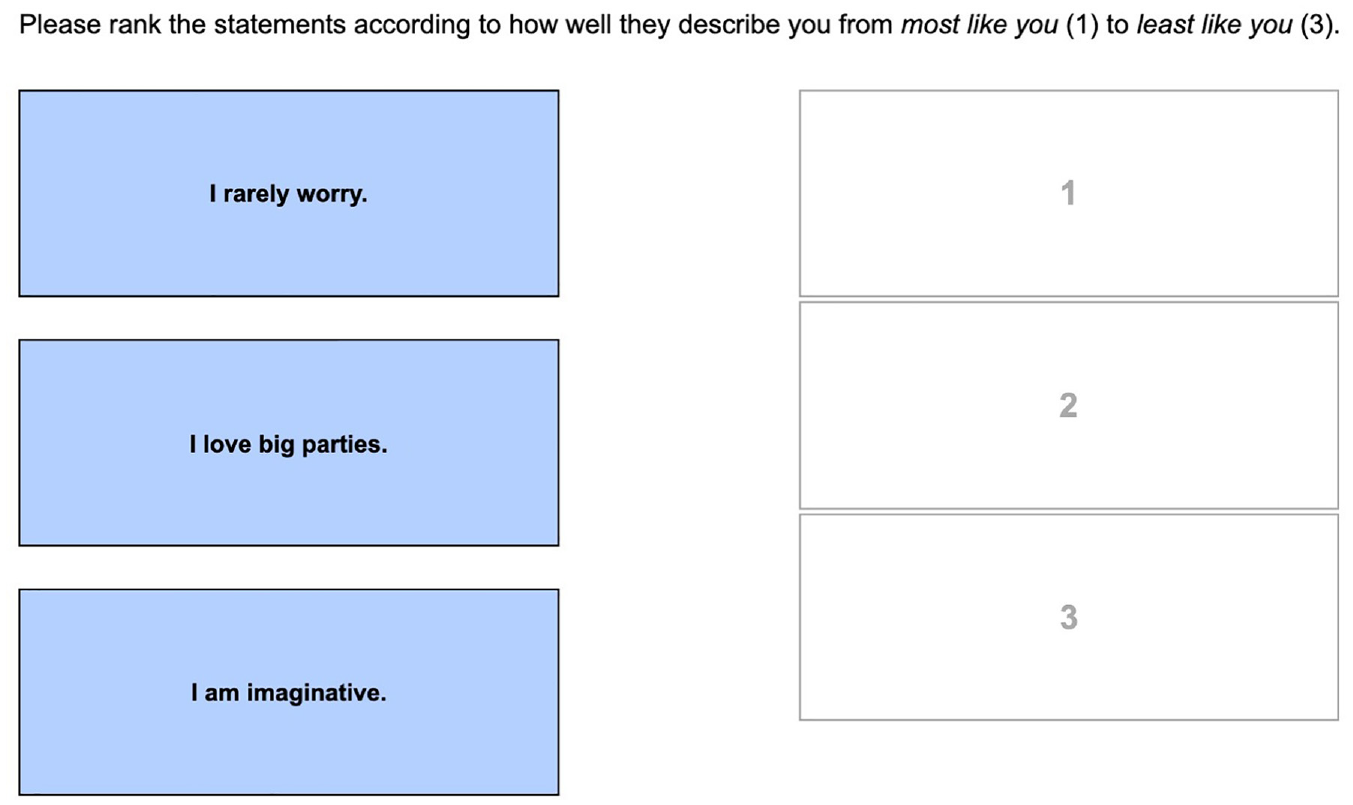
An Example Triplet in the Multidimensional Forced-Choice Format.
Given the circumstance that items are presented together in blocks, the resulting rankings are relative. Therefore, applying classical scoring techniques results in ipsative trait estimates that only allow for intraindividual comparisons (e.g., Hicks, 1970). As interindividual comparisons are essential in many assessment settings, the use of the MFC format was limited in the beginning. This limitation was overcome in the past decade with the development of multidimensional item response theory models that enable obtaining normative trait estimates and therefore allow drawing interindividual comparisons (see Brown, 2016, for an overview of these models). One of these models is the Thurstonian item response theory model (Brown, & Maydeu-Olivares, 2011). This model was applied in the current study because it is suitable for modeling multidimensional item responses to blocks of three (or more) items. In addition, it is broadly applicable (e.g., to a variety of latent variable structures or other variants of the forced-choice format), and it can be estimated in available software, like Mplus (Muthen & Muthen, 1998–2021). This versatility is transparent by its predominant use in the last few years (e.g., Frick, 2023; Guenole et al., 2018; Lee et al., 2021; Walton et al., 2020; Watrin et al., 2019; Wetzel & Frick, 2020). When describing the indices in detail below, we will briefly delineate some of the model properties that are relevant for understanding the indices and refer the reader to Brown and Maydeu-Olivares (2011, 2018) for a deeper understanding of the model.
Careless Responding
In most self-report questionnaires assessing personality traits, participants are instructed to indicate an intensity. For example, they might be asked to what extent they agree or disagree with a given item (e.g., “I am often late”) or how often they engaged in a specific behavior in a given time period. Answers are conventionally measured on a rating scale with different response options (e.g., from “I strongly agree” to “I strongly disagree,” or from “never” to “always”). This format is also known as a single-stimulus format because participants respond to one item at a time.
In the rating scale format, a number of response biases can occur (Paulhus, 1991). These include, for example, response styles such as a preference for extreme or non-extreme categories, socially desirable responding (i.e., faking and self-deception), and careless responding. Careless responding is characterized by selecting response options without considering the (full) item content (e.g., Nichols et al., 1989). As the expression “careless” suggests, it is a listless, unmotivated, or uninterested participant behavior that manifests itself in responses that seem to be arbitrary or indiscriminate. Other terms for the same response behavior include inattentive (e.g., Maniaci & Rogge, 2014), random (e.g., Credé, 2010), or insufficient effort (e.g., Huang et al., 2012) responding. Notably, we define careless responding as a participant behavior that therefore is distinguishable from computer-generated (i.e., survey bot or automated) responses. The detection of such responses is described elsewhere (e.g., Dupuis et al., 2019; Teitcher et al., 2015).
Like all response biases, careless responses add noise to the data. Therefore, not removing careless respondents from the sample can potentially lead to erroneous conclusions. Various studies have investigated how different proportions of careless respondents in a sample can impact the results when using rating scale questionnaires. These studies suggest that not removing careless respondents can inflate or deflate the correlations between items (Credé, 2010; Huang et al., 2015), distort the factor structure (Goldammer et al., 2020; Schmitt & Stuits, 1985), reduce statistical power (Maniaci & Rogge, 2014), or even change the results of statistical tests (DeSimone & Harms, 2018). Nevertheless, researchers should be cautious about flagging participants if the construct of interest is associated with careless responding (e.g., Rios et al., 2017). The base rate of careless responding differs considerably between samples, applied methods to detect careless responding, and other determinants. Using factor mixture modeling to detect careless respondents in personality questionnaires, Arias et al. (2020) flagged between 4% and 10% in their online samples and Meade and Craig (2012) flagged between 10% and 12% in a sample of undergraduate students. In a group assessment of leadership rankings in military training, 33% of the recruits were identified as careless respondents relying on four careless responding indices (Goldammer et al., 2020). Another characteristic of careless responding is that it increases over the course of the study (e.g., Bowling et al., 2021; Clark et al., 2003; Galesic & Bosnjak, 2009).
Researchers have developed various methods to detect careless responding in rating scale data. Meade and Craig (2012) differentiated two types of methods. The first type comprises special items or scales to detect careless responding. These should be assessed together with the questionnaires of interest. They include, for example, items asking the participants to report the quality of their data such as, “Did you expend effort and attention sufficient to warrant using your responses for this research study?” or items with instructions on which response category should be chosen, such as “For this query, mark X [insert X] and move on.” (Abbey & Meloy, 2017, p. 66). The second type consists of indices that can be computed after data collection is complete. These include analyses of the response time (e.g., extremely fast responses), the inconsistency of the responses (e.g., responding differently to similar items), response patterns (e.g., choosing the same response option multiple times consecutively), and outliers (e.g., responses that deviate strongly from the average responses of the sample). Curran (2016) and DeSimone et al. (2015) summarized the existing methods and indices for detecting careless responding in questionnaires using rating scales.
Careless Responding in the MFC Format
Within a given MFC block, it is only possible to place one item on each rank (see Figure 1). Hence, the nature of the forced-choice format prevents the occurrence of the aforementioned response styles. One of the main reasons why the forced-choice format gained research interest was to prevent or mitigate faking as one form of socially desirable responding (e.g., Christiansen et al., 2005). Meta-analytic results from the rating scale and forced-choice format indicate that responses to personality inventories are less susceptible to faking in the forced-choice format (Birkeland et al., 2006; Cao & Drasgow, 2019; Viswesvaran & Ones, 1999). They are even less susceptible to faking when the items within blocks are matched in terms of their social desirability (Wetzel et al., 2021).
Unlike the other aforementioned response biases, careless responding cannot be prevented by the design and characteristics of the MFC format. Whether the occurrence of careless responding can be reduced by using the MFC format rather than rating scales is an open research question. To our knowledge, careless responding has not been investigated in MFC questionnaires. As the design of the forced-choice format differs substantially from rating scales, some of the methods used to identify careless responding in rating scale data cannot be applied and others need to be adapted. Hence, little is known about how to identify careless responding and how often it occurs in questionnaires using the forced-choice format.
Indices for Detecting Careless Responding in MFC Questionnaires
In this study, we focus on the development of indices 1 to detect careless responding in MFC questionnaires. Indices to detect careless responding in the MFC format can be grouped into two types, following Meade and Craig (2012). First, we implemented special items such as instructed response triplets and self-report items on data quality together with the questionnaires in the online study. Second, we adapted and developed post hoc methods such as analyses of response time, consistency of the responses (i.e., consistency score), response patterns (i.e., rank order indices and triplet variance), and outliers (i.e., Mahalanobis distance). These indices will now be described in detail (see Table 1 in the Supplemental Materials for an overview). All of the indices were preregistered together with our research questions, hypotheses, and a detailed analysis plan (https://osf.io/sfwnp/). The response time index and missing values index were not part of the preregistration and are therefore marked with an asterisk.
Response Time
For each participant, the completion time for each page of the survey was measured. In addition to this response time measure, we developed a response time index (RTI*) combining two approaches from the literature: First, some studies that included the response time to screen for careless responding decided to treat breaks or study interruptions as missing values (e.g., Meade & Craig, 2012). Second, other studies focused more on detecting extremely fast responses because some participants respond so quickly that it seems unlikely that they have really read and considered the item content (Wise & Kong, 2005). Hence, these researchers used a lower cutoff (e.g., two seconds per item) to screen for careless respondents (e.g., Bowling et al., 2016; DeSimone & Harms, 2018; Huang et al., 2012). To combine these two approaches, we extended the response time effort index developed by Wise and Kong (2005) to include an upper threshold for delayed responses (
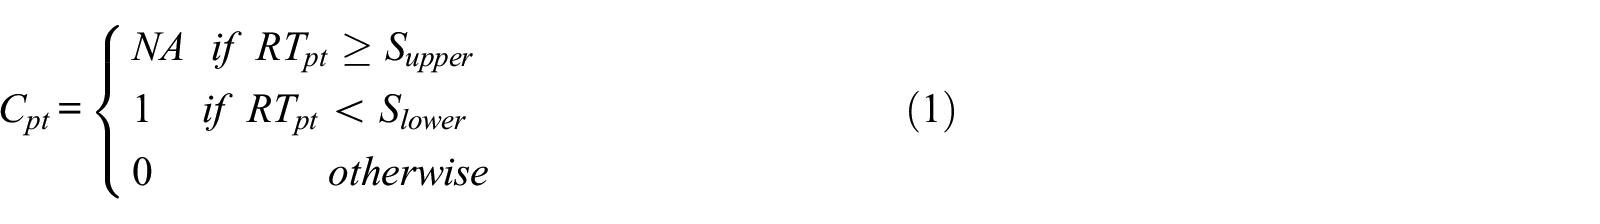
Second, the RTI for each participant is determined as:

where k is the number of values of
Self-Report Items
At the end of the online survey, participants were asked to evaluate (a) the effort they put into the study: “I put forth . . . effort towards this study” (response options: “almost no,”“very little,”“some,”“quite a bit,” and “a lot of”), (b) the attention they paid to the study: “I gave this study . . . attention” (response options: “almost no,”“very little of my,”“some of my,”“most of my,” and “my full”), and (c) whether their data should be used in the analyses (use me): “In your honest opinion, should we use your data in our analyses in this study?” (response options: “yes,”“no”; Meade & Craig, 2012). All three items and instruction sets originated from Meade and Craig (2012, p. 441).
Instructed Response Triplets
In two questionnaires of the online study, an instructed response triplet appeared at a random position. The items making up these triplets contain instructions in which order to place the statements (see Figure 2 for an example).
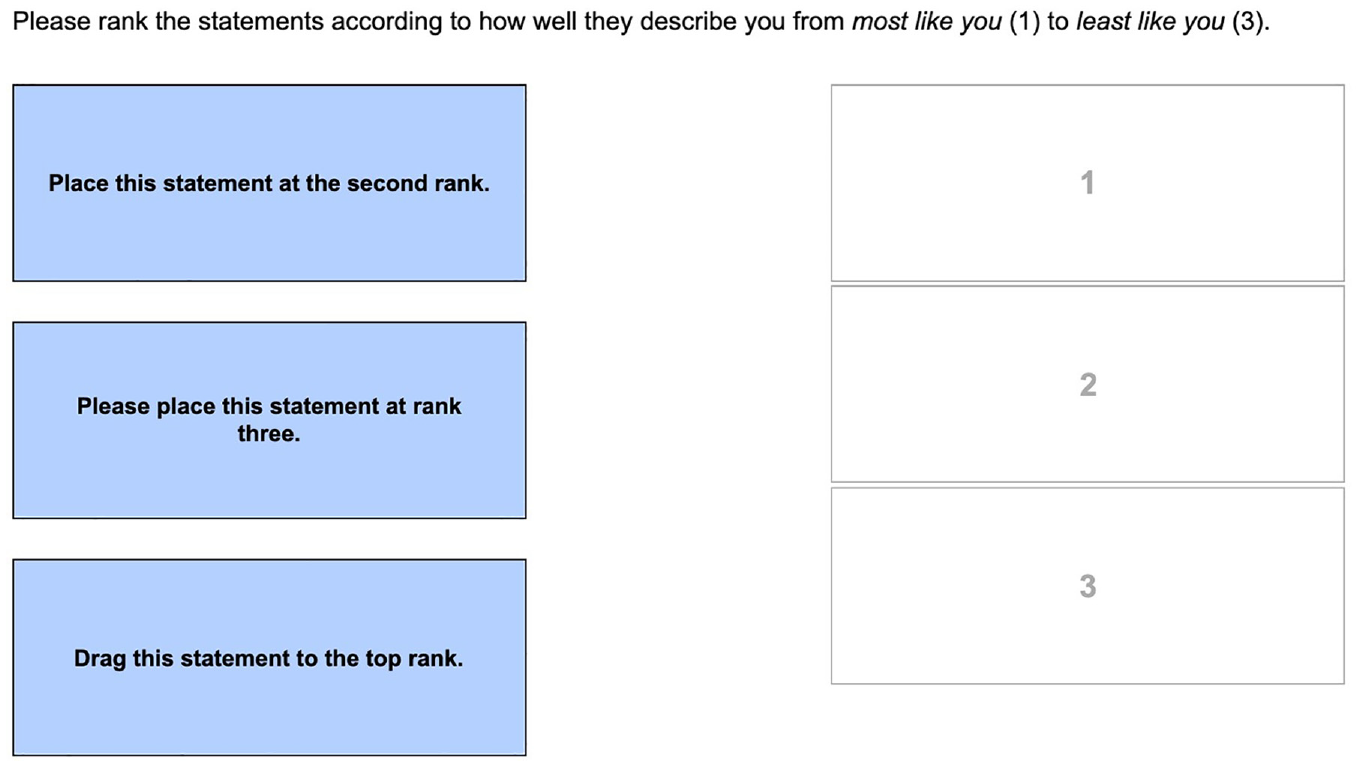
An Example of an Instructed Response Triplet.
Consistency Score
In the Thurstonian item response theory model, it is assumed that participants’ ranking preferences can be described by their trait levels and item parameters (Brown & Maydeu-Olivares, 2011). A consistency score can be calculated to examine whether participants responded consistently with this model (Brown & Bartram, 2011). To better explain the consistency score, we will briefly mention some features of the Thurstonian item response theory model. For a deeper understanding of the model, we refer the reader to Brown and Maydeu-Olivares (2011, 2018). Before analyzing the data from forced-choice questionnaires, the responses are coded into binary outcomes of pairwise comparisons. In the case of triplets, three pairwise comparisons are made: Item 1 with Item 2, Item 1 with Item 3, and Item 2 with Item 3. When the first item i in the pairwise comparison is preferred over the second item k, the binary outcome
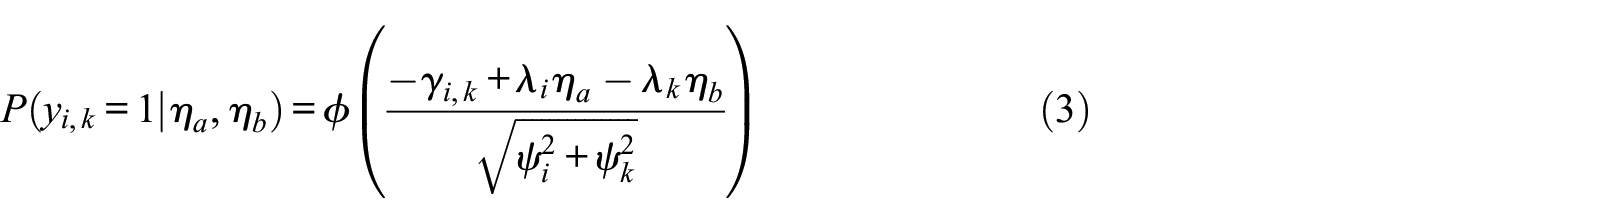
However, note that response probabilities for pairwise comparisons involving the same items are locally dependent given the latent traits. To account for this, in the Thurstonian item response theory model the item parameters involving the same items are constrained to the same absolute value, and the item parameters and trait covariances are estimated via limited information methods. The local dependencies are neglected in the estimation of the person parameters; however, this has a negligible impact on the estimates’ precision according to a simulation study conducted by Maydeu-Olivares and Brown (2010).
In Equation 3, the parameter
Mahalanobis Distance
A commonly used method to detect outliers, for example on predictors in regression analysis, is Mahalanobis distance (Mahalanobis, 1936). Mahalanobis distance is the multivariate generalization of the Euclidian distance between two points. It can be used to detect values that deviate more from the centroid of all participants in the sample than the other participants’ values do (e.g., Pituch & Stevens, 2015). Thus, Mahalanobis distance expresses the distance between a person’s response and the sample mean, accounting for correlations between responses. In the case of an MFC questionnaire, the vector

Rank Order 2 Indices
In the rating scale format, LongString indices are used to identify respondents who repeatedly choose the same response category (Johnson, 2005; Meade & Craig, 2012). We adapted the logic of LongString indices to the MFC format to generate longOrder indices. In an item block of size
Triplet Variance
This index expresses the variance of a person’s ranking patterns across all triplets in a questionnaire or the whole survey. The variance is high when participants use all rank orders equally often and low(er) when some rank orders are preferred over others. For a nominal variable with K! levels, the dispersion H can be calculated as (Eid et al., 2017, p.133):

In the MFC format, K! equals the number of possible rank orders and
Missing Values Index*
This index expresses the ratio of missing values (NA) on item ranks to the total number of item ranks in the questionnaire or survey. This index was not part of the preregistration and therefore the analyses regarding this index are exploratory.
The Present Study
Our aim was to examine the performance of and correlations among the indices we developed to detect careless responding in the MFC format. Furthermore, we were interested in the types of careless respondents in MFC questionnaires as well as in the proportion of the sample that responded carelessly. We preregistered four exploratory research questions and three hypotheses (https://osf.io/sfwnp/) that are described in the following. In addition, we conducted a simulation study in which we modeled careless responding in MFC questionnaires to provide a conceptional proof of the developed indices for detecting careless responding in MFC questionnaires. The simulation study was suggested by reviewers and was therefore not included in the preregistration. The design and rationale of the simulation are described in the Method section.
Research Questions and Hypotheses
For rating scales, Meade and Craig (2012) found that three factors underly the indices: consistency, self-report, and LongString. As the nature of MFC data differs substantially from rating scale data, we sought to investigate how the indices to detect careless responding in the MFC format relate to each other. Thus, our first research question was:
Some of the indices including the self-report items and the consistency or rank order indices have also been used to detect careless responding in rating scale data (e.g., Meade & Craig, 2012). For these indices, based on Meade and Craig’s findings, we posited the following three hypotheses:
Besides investigating the intercorrelations among the indices to detect careless responding, we were also interested in whether different subgroups of respondents exist. Studies on detecting careless responding in rating scale data have often found three subgroups/classes of respondents (e.g., Kam & Meyer, 2015; Maniaci & Rogge, 2014; Meade & Craig, 2012). One class contains thoughtful participants, a careless class contains participants who choose one response option repeatedly in a row, and another careless class contains participants with inconsistent response patterns. The sizes of the different classes varied in these studies. To extend this knowledge with regard to MFC data, we asked:
As described above, the proportion of the sample that responds carelessly in studies based on rating scales varies across studies, indices, and cutoff values. Identifying careless respondents by performing latent class or latent profile analysis is only one approach commonly used in the literature. A more widely used approach is the multiple hurdle approach (e.g., Goldammer et al., 2020). In this index-based approach, a set of careless responding indices is computed and cutoffs (hurdles) are applied to each of them to identify careless respondents. To investigate what proportion of the sample responds carelessly according to the different indices in the MFC format with different cutoff values, we asked:
Some researchers (e.g., Bowling et al., 2021; Clark et al., 2003; Galesic & Bosnjak, 2009) expect careless responding to occur more frequently near the end of a questionnaire due to tiredness or listlessness among participants. For example, Galesic and Bosnjak (2009) found that participants responded faster at the end of the study and that the variance in the responses decreased. Therefore, in our study, we compared the proportion of careless respondents identified by the six indices in the first and last questionnaires of the online survey, and thus asked:
Exploratory Analyses on the Criterion Validity and Reliability Estimates
Besides these research questions and hypotheses, we also preregistered exploratory analyses to investigate the impact of removing careless respondents from the sample in the MFC format. As described earlier, for rating scales, various studies have investigated how different proportions of careless respondents can impact the size and direction of observed correlations (see, for example, Credé, 2010). To examine the criterion validity in our sample, we computed several correlations with and without the respondents identified as careless in our analyses and compared these results with correlations reported in the literature. We focused on the relationships between the Big Five personality traits and narcissism with age and gender. Our tentative expectation was that the correlations without careless respondents would be more in line with those reported in the literature and stronger than those with careless respondents. A second exploratory analysis concerned the reliability of trait estimates on the scales, as some researchers (e.g., DeSimone et al., 2018) argued that careless responding leads to decreased reliability estimates. Hence, we compared the empirical reliability of trait estimates on the scales based on the whole sample to that in the sample without the careless respondents.
Method
In the following, we report how we determined our sample size, all data exclusions, and all measures in the study. In addition, we report which software we used for the analyses and a detailed analysis plan that we also preregistered. Moreover, we describe the design of the simulation study that we conducted to gain first insights into the kind of careless responding patterns that are detected by different kinds of indices.
Sample
Data were collected online on Prolific Academic (https://www.prolific.co) on September 21, 2017 and October 5, 2017. Participants signed up for the study, gave informed consent, and filled out the questionnaire online on SoSci Survey. On September 21, 2017, participants were remunerated with 1.75 British pounds, although participants who took longer than 20 min to complete the questionnaire received bonus payments of between 0.40 and 2 British pounds depending on their response time to comply with the payment principles of Prolific Academic with respect to minimum wage. These participants did not know beforehand that they would receive bonus payments if they took longer. On October 5, 2017, all participants were remunerated with 2.35 British pounds.
The computation of some of the careless responding indices is based on parameters from the Thurstonian item response theory model. Therefore, the sample size was determined based on simulation studies regarding the recovery of the model parameters (e.g., Maydeu-Olivares & Brown, 2010). We planned conservatively (N > 1,000) because only one of the six questionnaires was originally an MFC instrument. This sample size was also sufficiently large for the planned statistical analyses (e.g., correlations, latent profile analysis, and McNemar’s
After the removal of cases without a valid Prolific Academic ID (who were therefore not remunerated for their participation), cases who began the questionnaire multiple times, and cases who sent strange emails to the study organizer, the sample consisted of N = 1,169 persons. This sample size deviates from the preregistered size of N = 1,211 because the preregistered sample included some participants who were not remunerated for their participation. The mean age of the final sample was 36.27 years (SD = 11.27) and 64% were female. The participants originated from six different English-speaking countries (68% from the United Kingdom and 28% from the United States).
Measures
We administered six questionnaires in English. We used an MFC format with items presented in triplets and a full ranking instruction. The participants were instructed to rank the items as follows: On each page you will be presented with a block of three statements. Rank these statements according to how well they describe you in your usual behavior. Place the statement that describes you best at the top, the statement that describes you neither best nor least in the middle, and the statement that describes you least at the bottom.
We included questionnaires measuring personality traits (HEXACO, Big Five, Dark Triad), vocational interests, and other scales related to personality. The six questionnaires in the online survey are displayed in Figure 3. Only the Big Five Triplets is originally an MFC instrument. For the HEXACO-60, we used the MFC version from Wetzel and Frick (2020). For the other instruments, we constructed an MFC version with triplets. The number in the boxes in Figure 3 corresponds to the number of triplets in the questionnaire. In two questionnaires (SD3 and IPIP), an instructed response triplet appeared at a random position. The order in which the triplets were presented was randomized within the six questionnaires, but the order of the questionnaires was the same for all participants (as displayed in Figure 3).
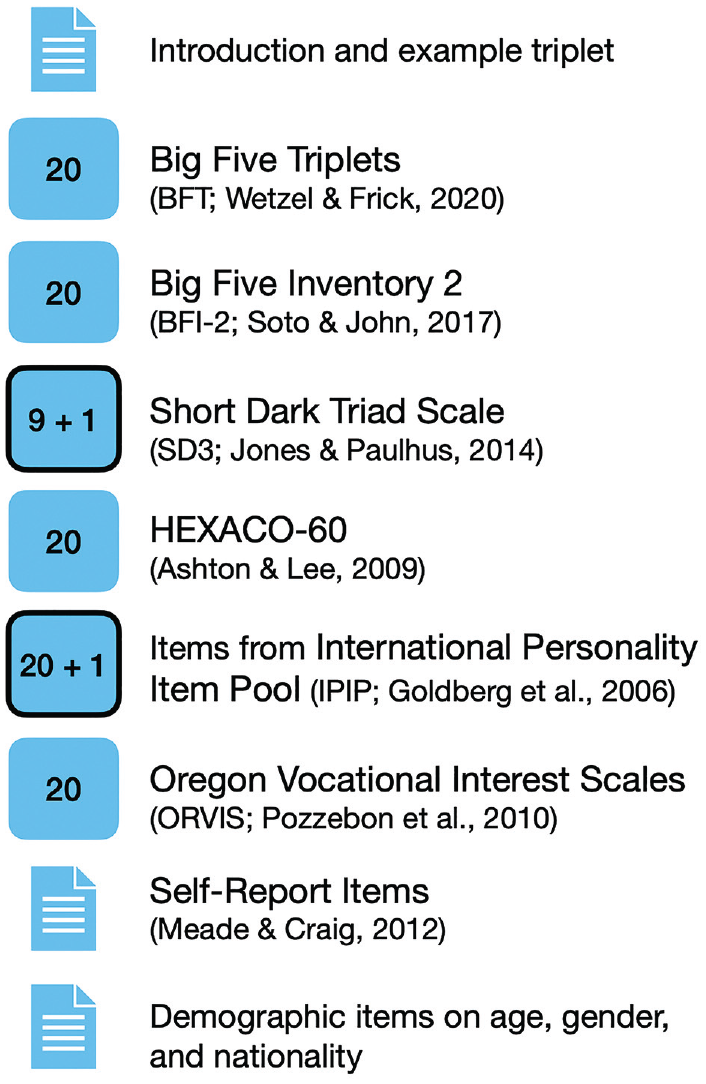
Properties and Questionnaires of the Online Survey.
Following the questionnaires, participants were asked to evaluate the quality of their data. Three self-report items were used to assess the effort they put into the study, the attention they paid to the study, and whether their data should be used in the analyses (for more details on the item wording see Section Indices for Detecting Careless Responding in MFC Questionnaires). On the last survey page, the participants were asked for demographic information (age, gender, and nationality).
Analytic Strategy
The analyses were conducted using Mplus Version 8.9 (Muthen & Muthen, 1998–2021) and R Version 4.1.0 (R Core Team, 2021) with the packages psych (Revelle, 2021), MplusAutomation (Hallquist & Wiley, 2018), tidyLPA (Rosenberg et al., 2018), mice (van Buuren & Groothuis-Oudshoorn, 2011), MOTE (Buchanan et al., 2019), multiplex (Ostoic, 2020), MFCblockInfo (Frick, 2023), doParallel (Corporation & Weston, 2020), ggplot2 (Wickham, 2016), patchwork (Pedersen, 2022), and apaTables (Stanley, 2021). Moreover, we wrote functions to calculate the careless responding indices in the MFC format (CRinMFC, Kupffer et al., 2022b) and other functions to prepare and read out data related to the Thurstonian item response theory analyses (TirtAutomation, Frick & Kupffer, 2022). Both packages containing these functions are available on GitHub. The analysis plan described in this section was also part of our preregistration.
Pre-Analysis
Sometimes longer response times per page occur due to pausing the study, distraction, or spending more time than usual on thinking before answering. This can bias the average response time over all triplets. Therefore, we calculated the average response time per triplet for each participant. These values are shown in Figure 1 in the Supplemental Materials. To avoid extreme response time values from skewing the overall measure, we replaced values that were at least twice as high as the 75th percentile of the sample’s average response time per triplet (green dashed line in bottom boxplot) with random values between the 25th and the 75th percentile. In total, 5,766 (4%) values were replaced. We replaced these values rather than treating them as missing because missing response times already occur when participants drop out.
Research Question 1
To answer the first research question regarding the correlations among the indices and their factor structure, we first computed the correlations among the indices. For testing Hypotheses 1 to 3, we defined a low correlation as
Research Question 2
To answer the second research question regarding whether different subgroups of careless respondents existed, we ran a latent profile analysis with the following indices: response time, self-reported effort, self-reported attention, consistency score, Mahalanobis distance, longOrderMax, longOrderAvg, sameOrder, and triplet variance. To determine the number of latent groups, we used the Bayesian Information Criterion (BIC; with smaller values indicating a better fit) and the model entropy (above .60, with higher values indicating a more accurate classification of respondents into latent groups), the interpretability of the resulting groups, and the parsimony of the solution.
Research Question 3
To answer the third research question regarding the proportion of careless respondents, we computed the proportion of respondents identified as careless by each index. Furthermore, we derived the proportion of persons assigned to profiles that indicated careless responding from the latent profile analysis.
Research Question 4
To answer the fourth research question regarding the occurrence of careless responding, we compared the proportion of careless respondents measured by our indicators in the first (BFT) and last (ORVIS) questionnaire of the online study. For both questionnaires, we computed the proportion of careless respondents identified by the following indices: consistency score, Mahalanobis distance, longOrderMax, longOrderAvg, sameOrder, and triplet variance. These proportions were compared using McNemar’s tests with a Bonferroni-corrected significance level of α = .01.
Simulation of Different Careless Responding Patterns and Proportions
The simulation study aimed to conceptually prove the developed indices and supplements the empirical part by giving first insights into the kind of careless responding patterns that can be detected by different kinds of careless responding indices. Thus, the research questions were: (a) How do the developed indices respond to increasing proportions of careless responding? (b) Which manifestations of careless responding patterns can be detected by which kind of careless responding index? and (c) What is the sensitivity and specificity of the indices at different cutoff values?
According to the literature on careless responding in rating scale data cited earlier, the base rate of careless responding is between 4% and 33%. Therefore, we varied the proportion of careless responding in our samples between 2% and 40% (in intervals of 5%). We modeled the two kinds of careless responding patterns that are discussed in the literature: randomness and longString (in our case longOrder). We divided the second kind into a moderate and a strong form of rank order repetition. The first careless responding pattern type is called random order, as it is manifested in the random selection of the rank orders for all of the blocks in the questionnaire. The second type strong repetition order is manifested in the selection and repetition of one rank order throughout the whole questionnaire. The third type moderate repetition order is manifested in the selection and repetition of one rank order for five consecutive triplets. In all types of careless responding patterns, the rank order “1–2–3” had a higher probability (p = .25) of being selected than the remaining rank orders (p = .15).
We also varied the sample composition. Thus, for each proportion of careless responding in the sample, we also varied the shares (0, .25, .50, .75, and 1) of random and one of the repetition order patterns. For example, for an overall percentage of careless responding in the sample of 2%, we simulated nine different sample compositions (see Table 1). In the first condition, only one type of careless responding (i.e., strong repetition order) was modeled. In Condition 9 on the contrary, the subsample of careless respondents (also 2% in total) consisted of 75% random selection of rank orders and 25% moderate repetition of rank orders. This results in a total of 72 conditions. Each of the simulation conditions was modeled with a sample size of N = 1,000 and was replicated 1,000 times.
Simulation Design of Sample Compositions.
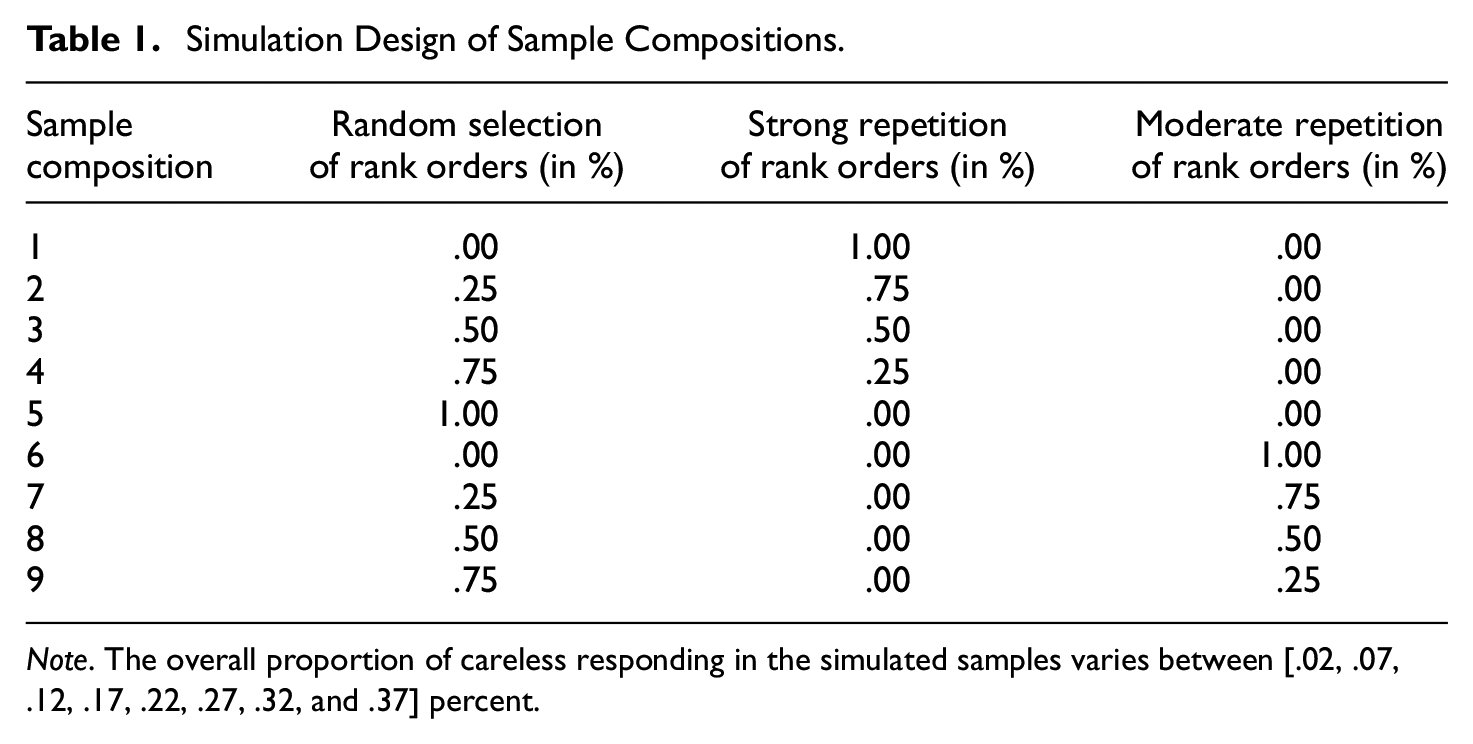
Note. The overall proportion of careless responding in the simulated samples varies between [.02, .07, .12, .17, .22, .27, .32, and .37] percent.
The simulation was based on the Big Five Triplets questionnaire (for details see Table 2 in the Supplemental Materials), as it is the only validated MFC instrument in our study. We simulated the careful/thoughtful responses based on the Thurstonian IRT model with intercepts [–1; 1] and loadings [0.65; 0.95] sampled from a uniform distribution. For model identification we set the trait means to zero. The correlations among the Big Five traits were set to the correlations obtained in the meta-analysis by Anglim et al. (2020, p. 60).
In each replication, we computed the mean and standard deviation of the indices consistency score, Mahalanobis distance, triplet variance, longOrderMax, longOrderAvg, and sameOrder. 3 A range of cutoff values were applied to each index (see Table 2) to compare sensitivity and specificity at these cutoff values. Specifically, we used the Youden-Index (YI; Youden, 1950) to determine the trade-off between sensitivity and specificity. As an overall performance measure of the careless responding indices, taking into account the balance between sensitivity and specificity over a range of cutoff values, we calculated the Area Under the Receiver–Operating Characteristic Curve (AUC).
Cutoff Values in the Simulation Study.
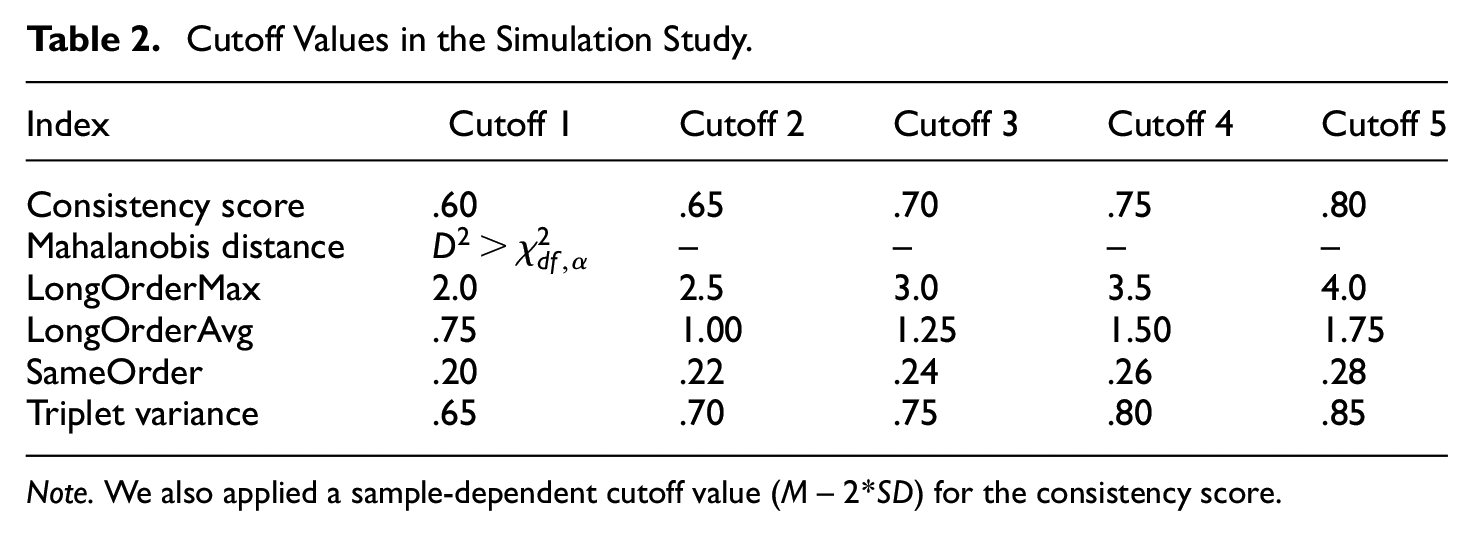
Note. We also applied a sample-dependent cutoff value (M– 2*SD) for the consistency score.
Results
We first calculated all of the indices adapted to and developed for the MFC format. As the consistency score is based on parameters from Thurstonian item response theory models, we ran these models for each questionnaire before calculating the indices. Unfortunately, the model for the Short Dark Triad Scale (Jones & Paulhus, 2014) in the MFC format failed to converge. Therefore, the consistency score was calculated for each of the remaining five questionnaires. These scores were then averaged. According to the root mean square error of approximation, the model fit of the remaining models was good (BFT = 0.040, BFI-2 = 0.035, HEXACO = 0.031, IPIP scales = 0.033, and ORVIS = 0.044). The three rank order indices, the triplet variance, and the missing values index were calculated for each of the six questionnaires as well as for the whole survey (including all 121 triplets). The response time and RTI were calculated for the whole survey and the RTI for the first and last questionnaires as well. Table 3 displays the means, standard deviations, confidence intervals, cutoff values, and percentage of the sample identified as careless respondents by the indices.
Descriptive Statistics on the Careless Responding Indices Including Cutoff Values and % of the Sample Identified as Careless Respondents by Each Index.
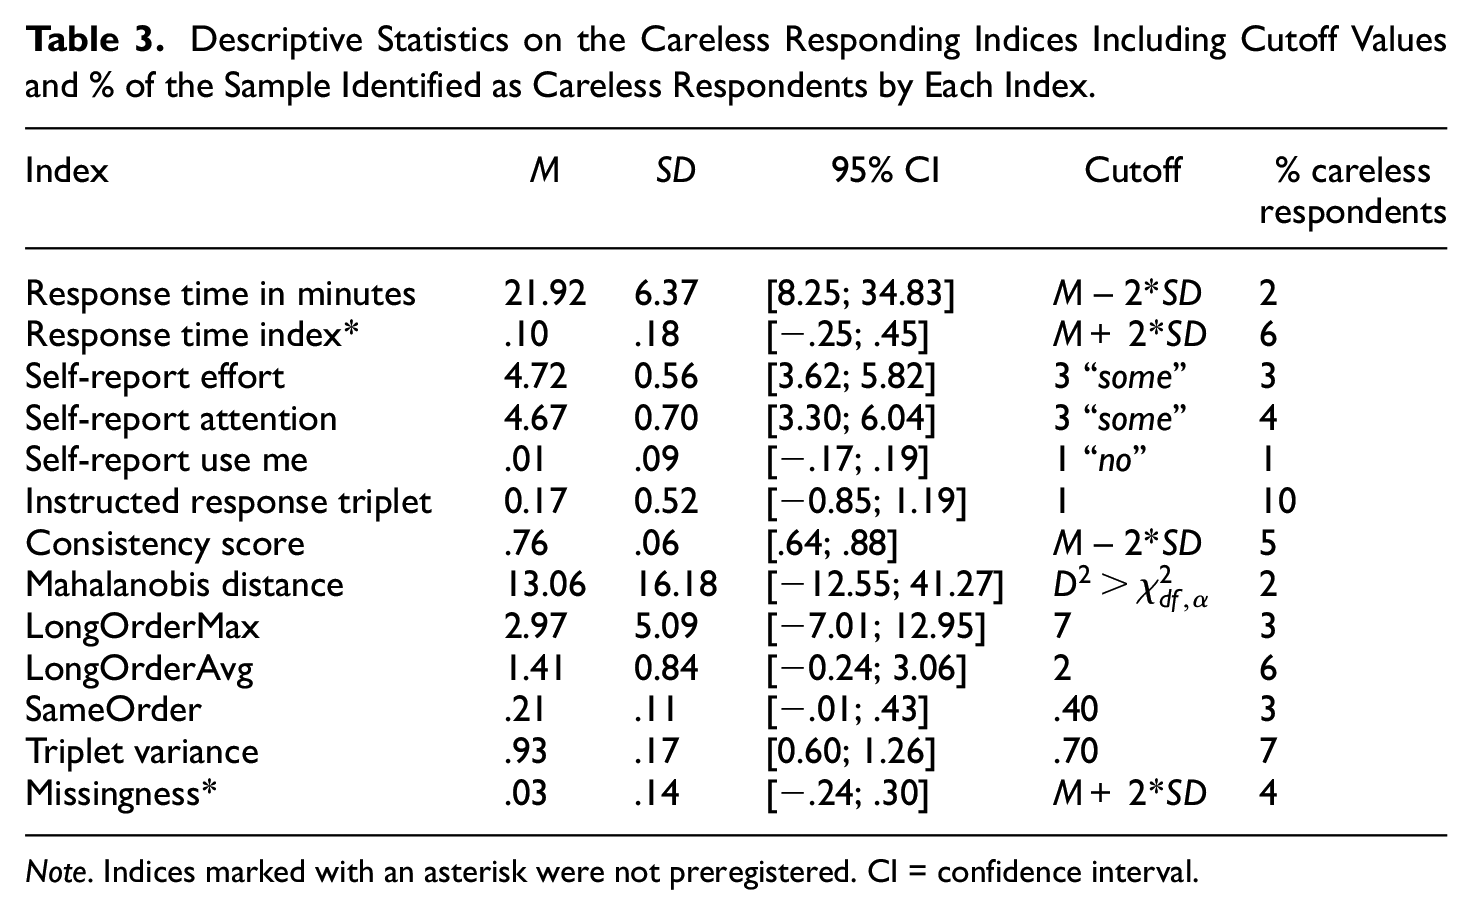
Note. Indices marked with an asterisk were not preregistered. CI = confidence interval.
For some of the indices, including the self-report items and the instructed response triplets, natural cutoff values exist. For example, on the instructed response triplets, a given participant can be flagged as careless when he or she fails to select the prescribed rank order. For other indices, cutoff values are needed. As this study is the first to investigate the newly developed indices in the MFC format, no established cutoff values exist. Hence, we used visual inspection to determine cutoff values for the indices longOrderMax, longOrderAvg, sameOrder, and triplet variance and calculated deviations from the sample mean to determine the cutoff values for the response time, RTI, consistency score, and missing values indices. The calculation of the indices and the determination of the cutoff values are part of the R-script “4_calc_indices.R.”
After the cutoff values were applied, a sum score of the 11 preregistered indices was calculated for each participant (TotalSumScore). The TotalSumScore thus counts the number of indices on which a participant was flagged as careless and ranges from 0 to 11. Eight hundred and eighty-four participants (76% of the sample) were not flagged by any of the indices, 165 participants (14% of the sample) were flagged by one index, and 120 participants (10% of the sample) were flagged by two or more indices. Two participants scored the highest TotalSumScore of eight.
RQ1: Correlations Among the Indices
To test Hypotheses 1 to 3, we calculated the correlations among the indices and tested whether two-thirds of the correlations met the criteria of a small or moderate correlation as described above (the correlations are displayed in Table 4). The indices response time and missing values index were not part of the preregistration and therefore not included in the hypotheses tests, but are reported as exploratory results. Bivariate scatter plots of the indices are displayed in Figure 2 in the Supplemental Materials. The self-report item use me did not correlate with most of the preregistered indices. The self-report item effort had a positive but small correlation with the other indices, except for the sameOrder index and Mahalanobis distance for which there were no correlations. The self-report item attention had a positive but small correlation with the instructed response triplet, longOrderMax, and triplet variance indices. Only 11 (out of 24) correlations were low or moderate. Therefore, Hypothesis 1 was not confirmed. The correlation between the self-report items attention and effort was moderate and positive. The correlations of use me with effort and use me with attention were positive but small. Therefore, Hypothesis 2 was not confirmed. The indices longOrderAvg and longOrderMax did not correlate with the consistency score. Therefore, Hypothesis 3 was not confirmed. As preregistered and described in the Method section, we used two criteria to decide whether applying principal axis factoring is reasonable. The Bartlett test showed that the correlations among the indices differed significantly from zero,
Correlations Among the Careless Responding Indices.
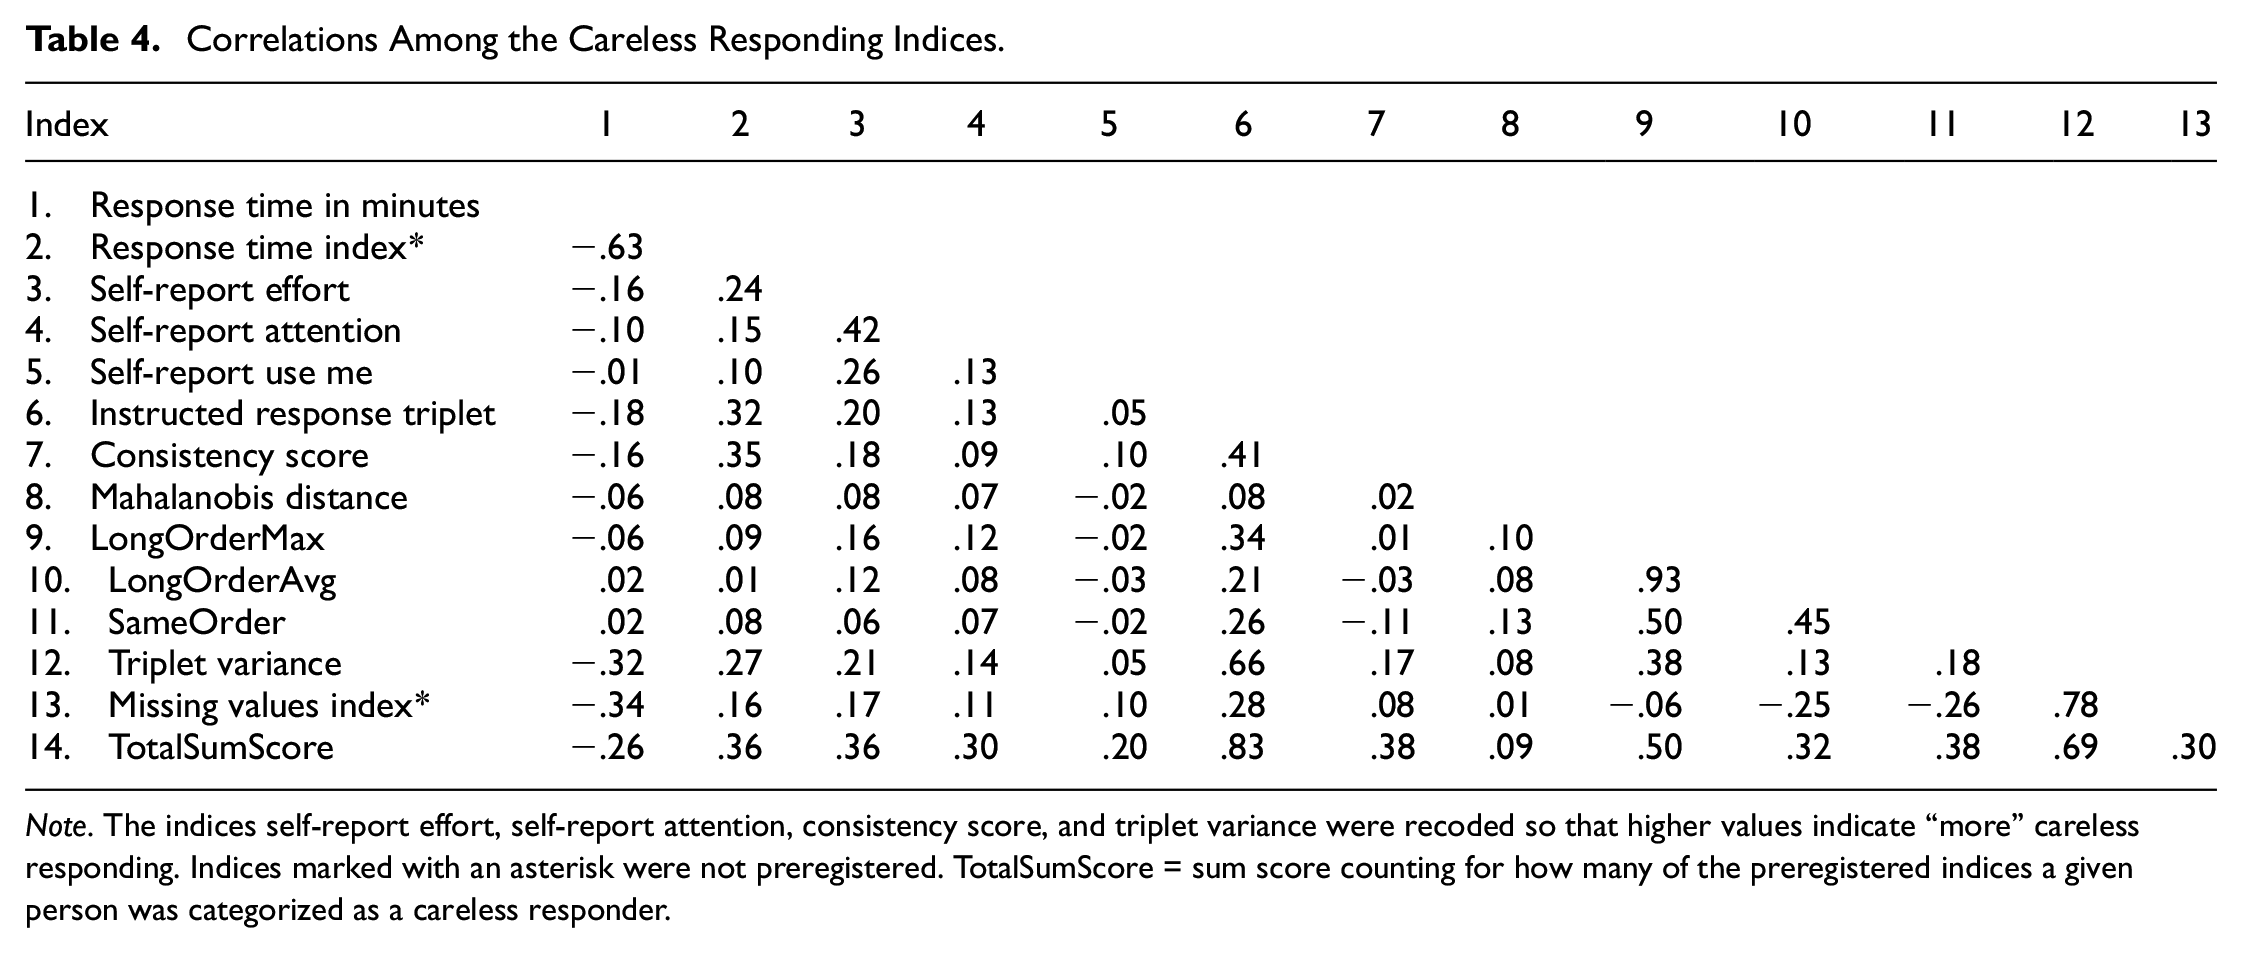
Note. The indices self-report effort, self-report attention, consistency score, and triplet variance were recoded so that higher values indicate “more” careless responding. Indices marked with an asterisk were not preregistered. TotalSumScore = sum score counting for how many of the preregistered indices a given person was categorized as a careless responder.
RQ2: Subgroups of Careless Respondents
We conducted a latent profile analysis on the indices response time, self-report effort, self-report attention, consistency score, Mahalanobis distance, longOrderMax, longOrderAvg, sameOrder, and triplet variance. As described above, we used the BIC and the entropy of the models, the interpretability of the resulting groups, and the parsimony of the solution to determine the number of latent groups. Using these criteria, two models seemed to fit to the data: Model 1 with two classes and Model 3 with four classes (see Table 5). The model with five classes failed to converge. All latent profile analysis models are displayed in Table 6 with the resulting class means on the different indices. In Model 1, 84% of the sample was assigned to Class 1 and 16% to Class 2. A comparison of the predicted class means of the two classes in this model revealed that participants who were assigned to Class 2 on average responded a bit faster, scored lower on the self-report item attention, had higher Mahalanobis distance values, repeated a rank order twice as often in a row on longOrderMax, and had a lower triplet variance. The response time index, instructed response triplet, missing values index, and the self-report item use me were not part of the latent profile analysis. Therefore, for these indices, the class means were calculated post hoc. On average, a participant who was assigned to Class 2 missed one (out of two) instructed response triplets and had 18% missing values. Based on the class means, it appears that Class 2 contains careless participants.
Model Fit of the Latent Profile Analysis Models.
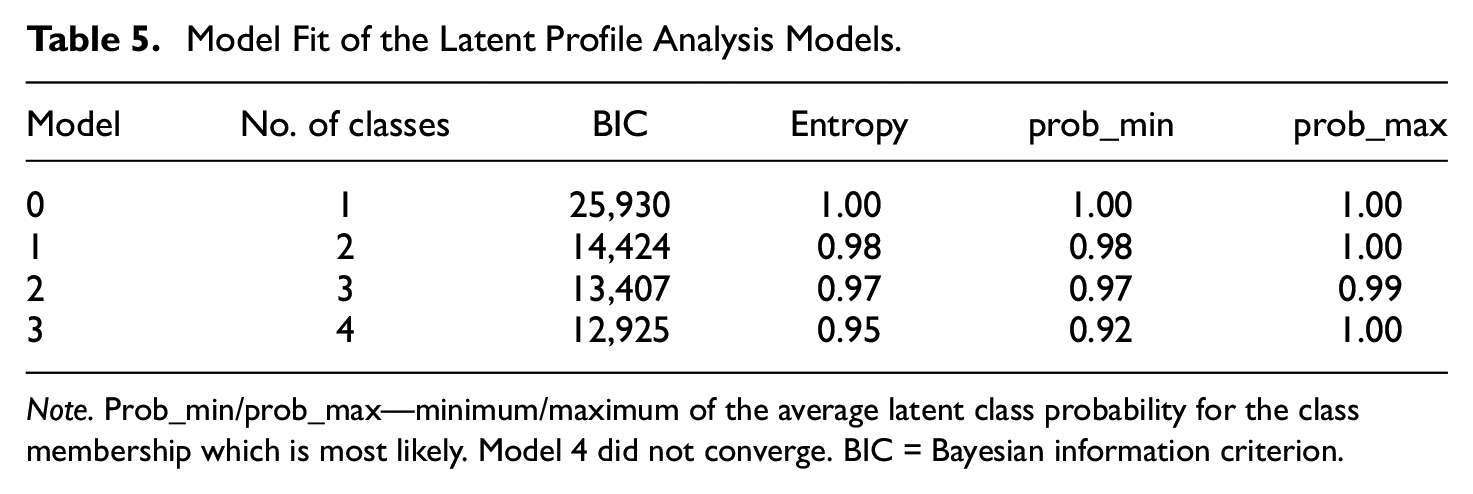
Note. Prob_min/prob_max—minimum/maximum of the average latent class probability for the class membership which is most likely. Model 4 did not converge. BIC = Bayesian information criterion.
Latent Profile Analysis Results.
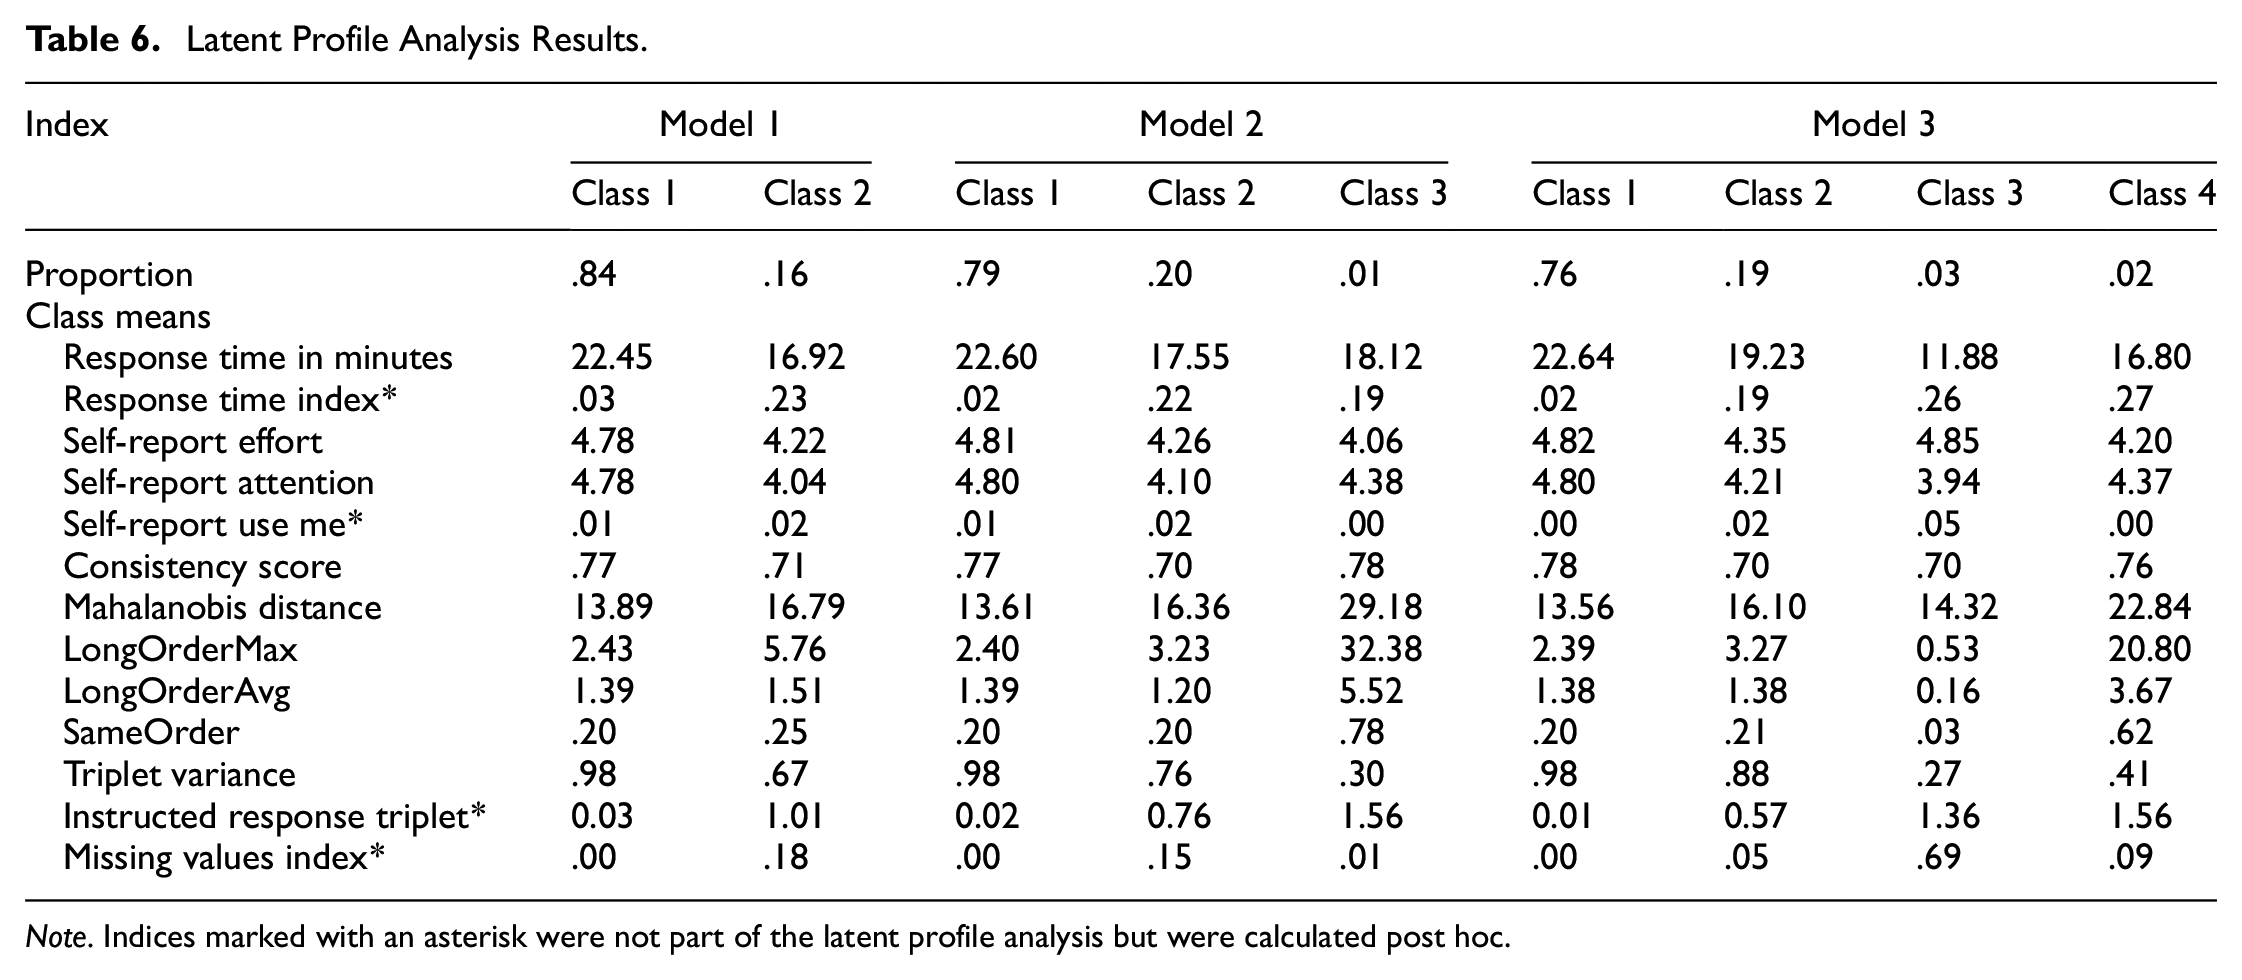
Note. Indices marked with an asterisk were not part of the latent profile analysis but were calculated post hoc.
In Model 3, 76% of the participants were assigned to Class 1. The second largest class (19%; Class 2) was on average 3 min faster than Class 1, scored lower on the self-report items (especially on attention, similarly to Class 2 in Model 1), had higher Mahalanobis distance values, and repeated on average one triplet more on longOrderMax. Respondents who were assigned to Class 3 (comprising 3% of the sample) responded ten minutes faster on average than Class 1 and skipped on average 69% of the items. Due to this high rate of missing values, the other indices will not be described for this class. The fourth class in this model (Class 4; 2%) contained respondents who responded on average almost five minutes faster than Class 1. Participants in this class had on average high values on the rank order indices and Mahalanobis distance and low values on triplet variance. Based on the class means, Model 3 revealed three different classes of careless respondents: one that was characterized by producing many missing values, another one that repeated one rank order very often in a row, and one that exhibited less extreme values on the indices but still deviated from the careful respondents in Class 1.
Graphical and Statistical Model Validation
In order to cross-check the results of Model 3, we conducted additional analyses. For a graphical model validation, we selected three of the indices used in the latent profile analysis to gain deeper insights into the behavioral differences between the four classes: triplet variance, response time, and longOrderMax. Figure 4 in the Supplemental Materials shows violin plots combined with scatter overlays to compare the density distribution and dispersion of data points across five (sub)samples: the first column shows data from all participants and the second through fifth columns show data from Classes 1 to 4. In general, the distinction between the four classes is most obvious when looking at the differences between the classes on several indices (not just one).
Triplet Variance
Class 1 contained participants with high values on the triplet variance. The dispersion in this class was very small compared with Class 2 which also included participants with comparably high values. The values on triplet variance in Class 3 and Class 4 also had a large dispersion, but the majority of the values were below .70, which is rather low compared with the total sample.
Response Time
Participants in Class 3 had on average the fastest response times. It was also evident that Class 2 included participants with faster response times in comparison to the careful Class 1.
LongOrderMax
The lower left plot shows the large dispersion in the total sample and Class 4 on the index longOrderMax. Shortening the y-axis (12 values are truncated in the lower right plot), again Class 1 contained the homogeneous values and Class 2 had a greater dispersion. Class 3 contained those individuals who had the fewest repetitions on the index longOrderMax compared with the total sample. As a reminder, a longOrderMax of 0 means that a participant selected a rank order and on the next page a different rank order, i.e., individuals in this class on average repeated a rank order less than once. Class 4 contained those participants who repeated a given rank order very often in a row.
Multinominal Logistic Regression Models
To evaluate the plausibility of the four classes resulting from Model 3, we ran two multinominal logistic regressions to examine the relationship between the indices response time index and instructed response triplet and class membership. We chose these indices because they were not used to assign the participants to the latent classes and thus can be used to cross-check the model solution. The dependent variable has four categories (i.e., the classes of Model 3). We chose Class 1 as the reference category because it is the largest class and expected to include careful/thoughtful participants.
Response Time Index
The model fit the data (
Instructed Response Triplet
The model fit the data (
In summary, the model validation of the latent profile analysis was accomplished in two ways: (a) graphically by going deeper into indices that were part of the analysis and (b) statistically by multinominal logistic regression models in which class membership was predicted by indices that were not included in the latent profile analysis. Both kinds of analyses revealed that respondents in the four classes differed on a behavioral level that is captured by the careless responding indices.
RQ3: Proportion of Careless Responding
According to the results of the latent profile analysis, 16% to 24% of the sample were assigned to classes that showed careless responding behaviors. Another approach to group respondents as careless versus careful is the use of cutoff values. Table 3 displays the proportion of the sample identified as careless by each of the indices. The proportion of participants flagged by the indices varied between 1% for the self-report item use me and 10% for the instructed response triplets.
RQ4: Comparison of Careless Responding Between First and Last Questionnaire
In this part of the analyses, we compared the proportion of careless respondents identified by our indices in the first (BFT) versus the last (ORVIS) questionnaire in the online survey. We applied the cutoff values described in Table 3. The results of the McNemar’s tests are displayed in Table 7. For four out of the six preregistered indices (longOrderMax, longOrderAvg, sameOrder, and triplet variance), the proportion of careless respondents differed significantly between the two questionnaires. For three of these, the proportion of careless respondents was larger in the last compared with the first questionnaire, whereas for sameOrder, the effect went in the opposite direction. We additionally compared the proportion of careless respondents identified by the response time index and missing values index in an exploratory analysis, as these indices were not preregistered. For both indices, the proportion in the last questionnaire was higher than in the first.
Careless Responding in the First and Last Questionnaire in the Online Survey.
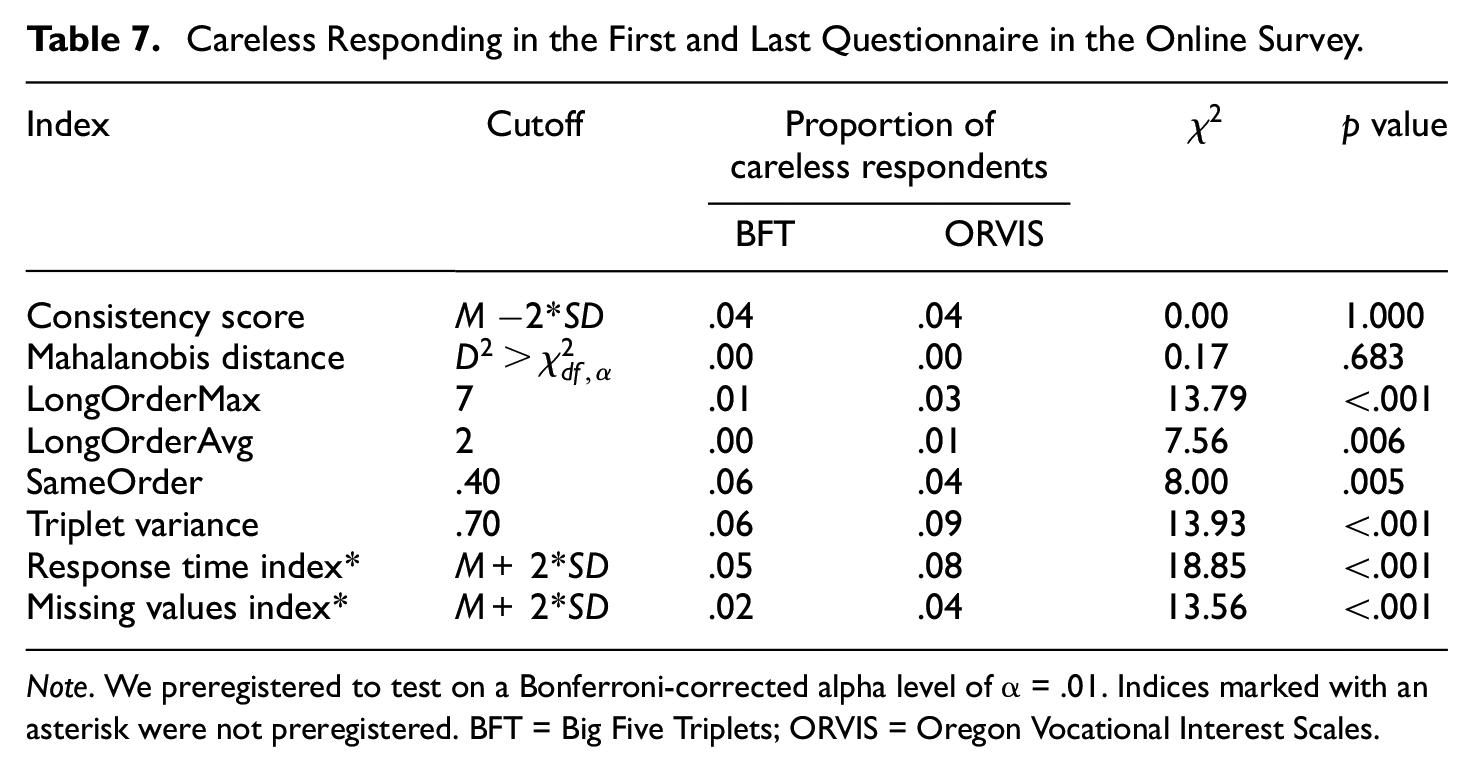
Note. We preregistered to test on a Bonferroni-corrected alpha level of α = .01. Indices marked with an asterisk were not preregistered. BFT = Big Five Triplets; ORVIS = Oregon Vocational Interest Scales.
Exploratory Analyses: Impact of Removing Careless Respondents From the Sample
To investigate the impact of removing the participants who were flagged as careless by our indices from the sample, we computed several correlations with and without these respondents and compared the results with correlations reported in the literature (see Table 3 in Supplemental Materials). We chose two criteria on which to flag individuals: (a) the results of the latent profile analysis (Class 2 to 4 in Model 3) and (b) the combination of four of our indices (RTI, triplet variance, instructed response triplet, and longOrderMax). Criterion A flagged 24% of the sample and Criterion B 16%. Seventy-four percent of the sample was identified as careful by both criteria and 14% as careless by both criteria. For 12% of the sample, the two criteria did not overlap. The results of these two approaches did not differ much. Due to estimation problems with the Thurstonian item response theory model for the Short Dark Triad Scale, we cannot compare the correlations of narcissism with age and gender as we planned in our preregistration.
The correlations of the Big Five personality traits with age and gender reported in the literature and based on our sample are displayed in Table 3 in the Supplemental Materials. In general, most of the correlations did not differ meaningfully after removing the careless participants from the sample. A second exploratory analysis addressed the reliability of trait estimates on the scales. We compared the empirical reliability of the trait estimates on the scales based on the whole sample with the one without the careless respondents. To compare the reliability estimates, we transformed them using Fischer’s Z transformation. Removing the careless participants slightly improved the reliability estimates of all Big Five scales measured using the Big Five Inventory 2 (see Table 3 in Supplemental Materials).
Simulation Study
In 22,831 of the 72,000 replications (32%), factor scores could not be computed due to convergence problems of the Thurstonian item response theory model. These convergence problems occurred mainly in conditions where the proportion of careless responding exceeded 22% of the sample and strong repetition of rank orders was modeled. Thus, the first finding of the simulation study is that high proportions of careless responding can lead to model convergence problems. In these cases, the consistency score index could not be computed. Details on the simulation study can be found in the GitHub repository in the subfolder “7_simulation_study.”
Type of Careless Responding
A number of possible sample compositions were modeled (see Table 1). Figure 4 shows the trend for each index as the number of careless respondents increases. For each index, the values are also broken down by modeled type of careless responding. Thus, the purple line of strong repetition order consists only of values from conditions where 100% strong repetition of rank orders was modeled. The red line represents the average across all conditions for the given proportion of careless responding in the sample. As expected, the indices do capture different manifestations of careless responding, which will be addressed in detail.
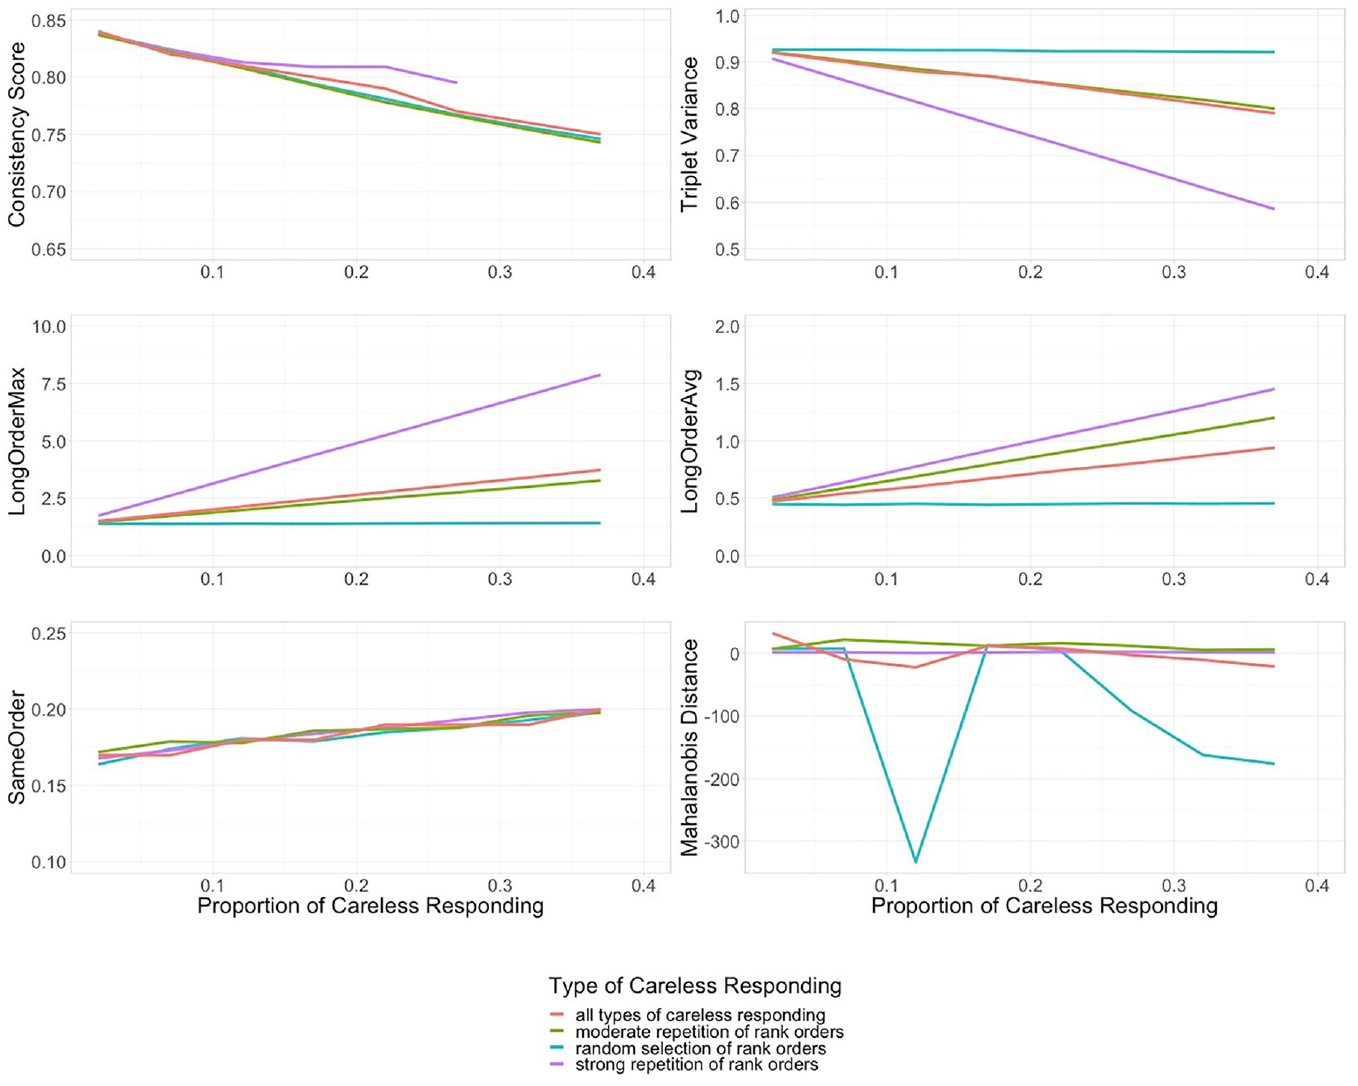
Different Proportions and Types of Careless Responding in the Simulated Samples.
Consistency Score
With increasing proportions of careless responding in the sample, the trend for all modeled types of careless responding is negative for the consistency score (see upper left corner in Figure 4). Higher values indicate a more consistent response pattern and thus less careless responding. Therefore, the results are in line with the conceptual idea of this index. Due to the above-mentioned convergence problems with the Thurstonian item response model, some data points are missing for strong repetition of rank orders.
Triplet Variance
With increasing proportions of careless responding, the trend for moderate and strong repetition of rank orders is negative while random selection of rank orders remains stable. Higher values refer to more variance in the response pattern (i.e., variation in the different ranking options). Therefore, the results are in line with the conceptual idea of this index.
LongOrderMax and LongOrderAvg
With increasing proportions of careless responding, the trend for moderate and strong repetition of rank orders is positive while random selection of rank orders remains stable (see middle row in Figure 4). Higher values indicate a longer sequence of repeated rank orders. Therefore, the results are in line with the conceptual idea of the two indices.
SameOrder
The third rank order index expresses the proportion of triplets for which the presented rank order was copied. With increasing proportions of careless responding the trend for all types of careless responding is slightly positive. The results are in line with the conceptual idea of the index.
Mahalanobis Distance
This index expresses the distance between a person’s response and the sample mean, accounting for correlations between responses. With increasing proportions of careless responding the trend for all types of careless responding is stable (despite the outlier). Therefore, the results are not in line with the conceptual idea (i.e., more carelessness, more deviation from the sample mean) of this index.
Sensitivity, Youden-Index, and AUC for a set of Cutoff Values
In Table 8, the results regarding the sensitivity, Youden-Index of different cutoff values, and the AUC for each index are displayed. This table is condensed, as only the means for three proportions of careless responding are reported. A complete results table can be found in the Supplemental Materials. For all analyzed indices except for the Mahalanobis distance, the AUC values are in an acceptable to excellent range (see Figure 5). The Youden-Index yields the best results for the following cutoff values: consistency score of .70 or .75, triplet variance of .80, LongOrderMax of 3 or 3.5, LongOrderAvg of 1.25 (but comparable to the other values), and sameOrder between .20 and .24. The Youden-Index for the cutoff value for the Mahalanobis distance is very low (see Figure 6).
Simulation Study Results.
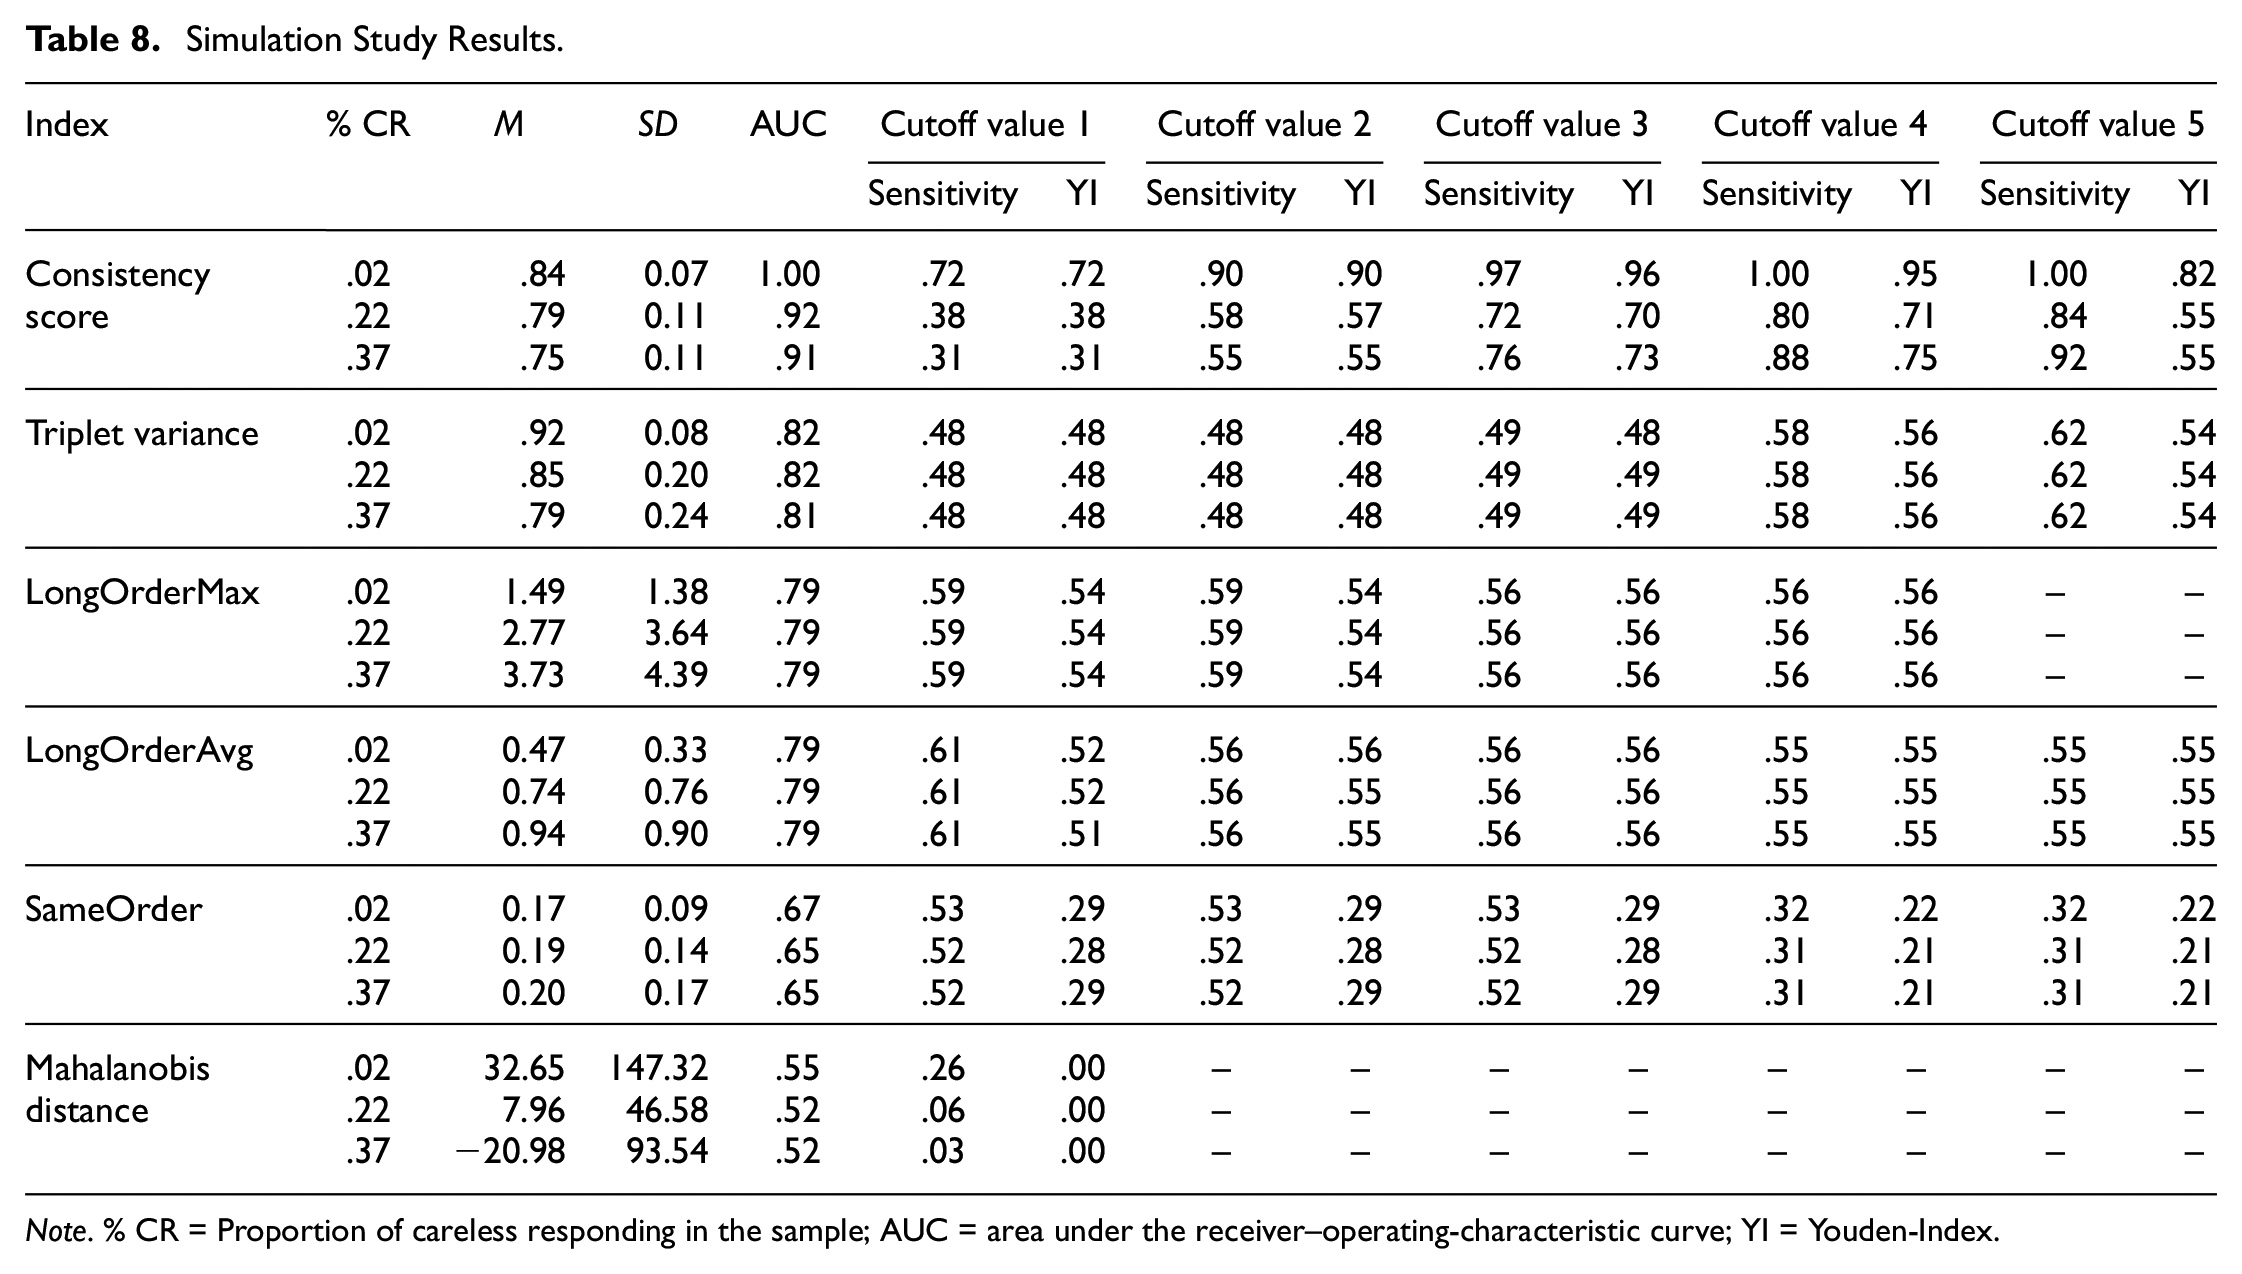
Note. % CR = Proportion of careless responding in the sample; AUC = area under the receiver–operating-characteristic curve; YI = Youden-Index.
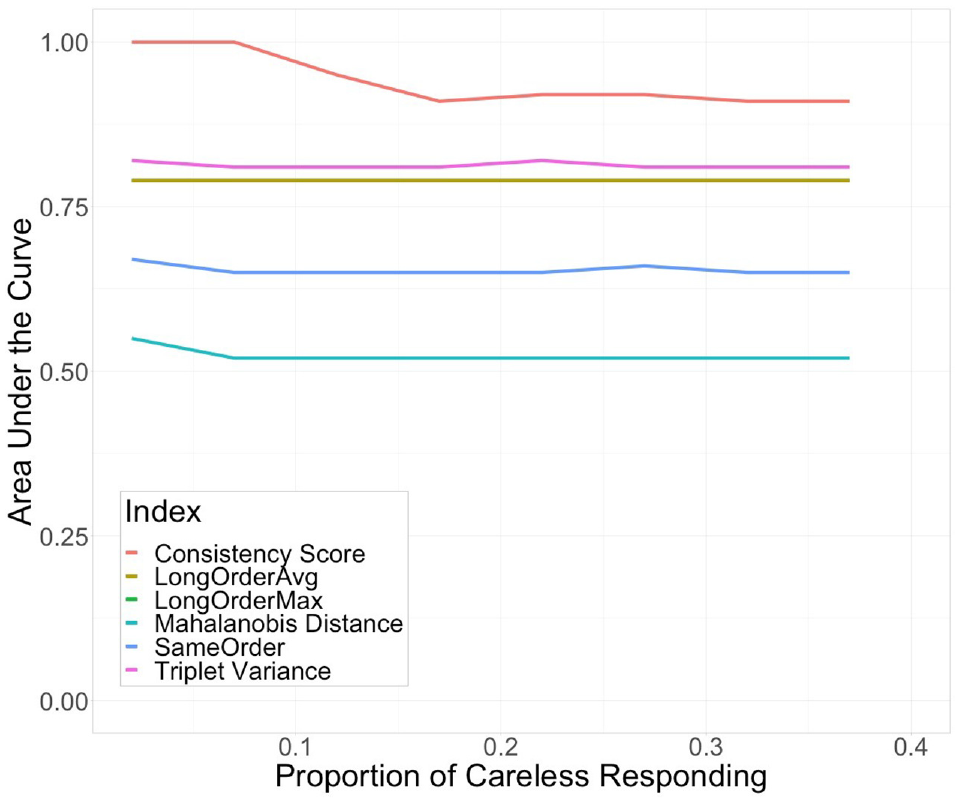
Area Under the Receiver–Operating Characteristic Curve Values for Different Careless Responding Indices and Proportions of Careless Responding in the Sample.
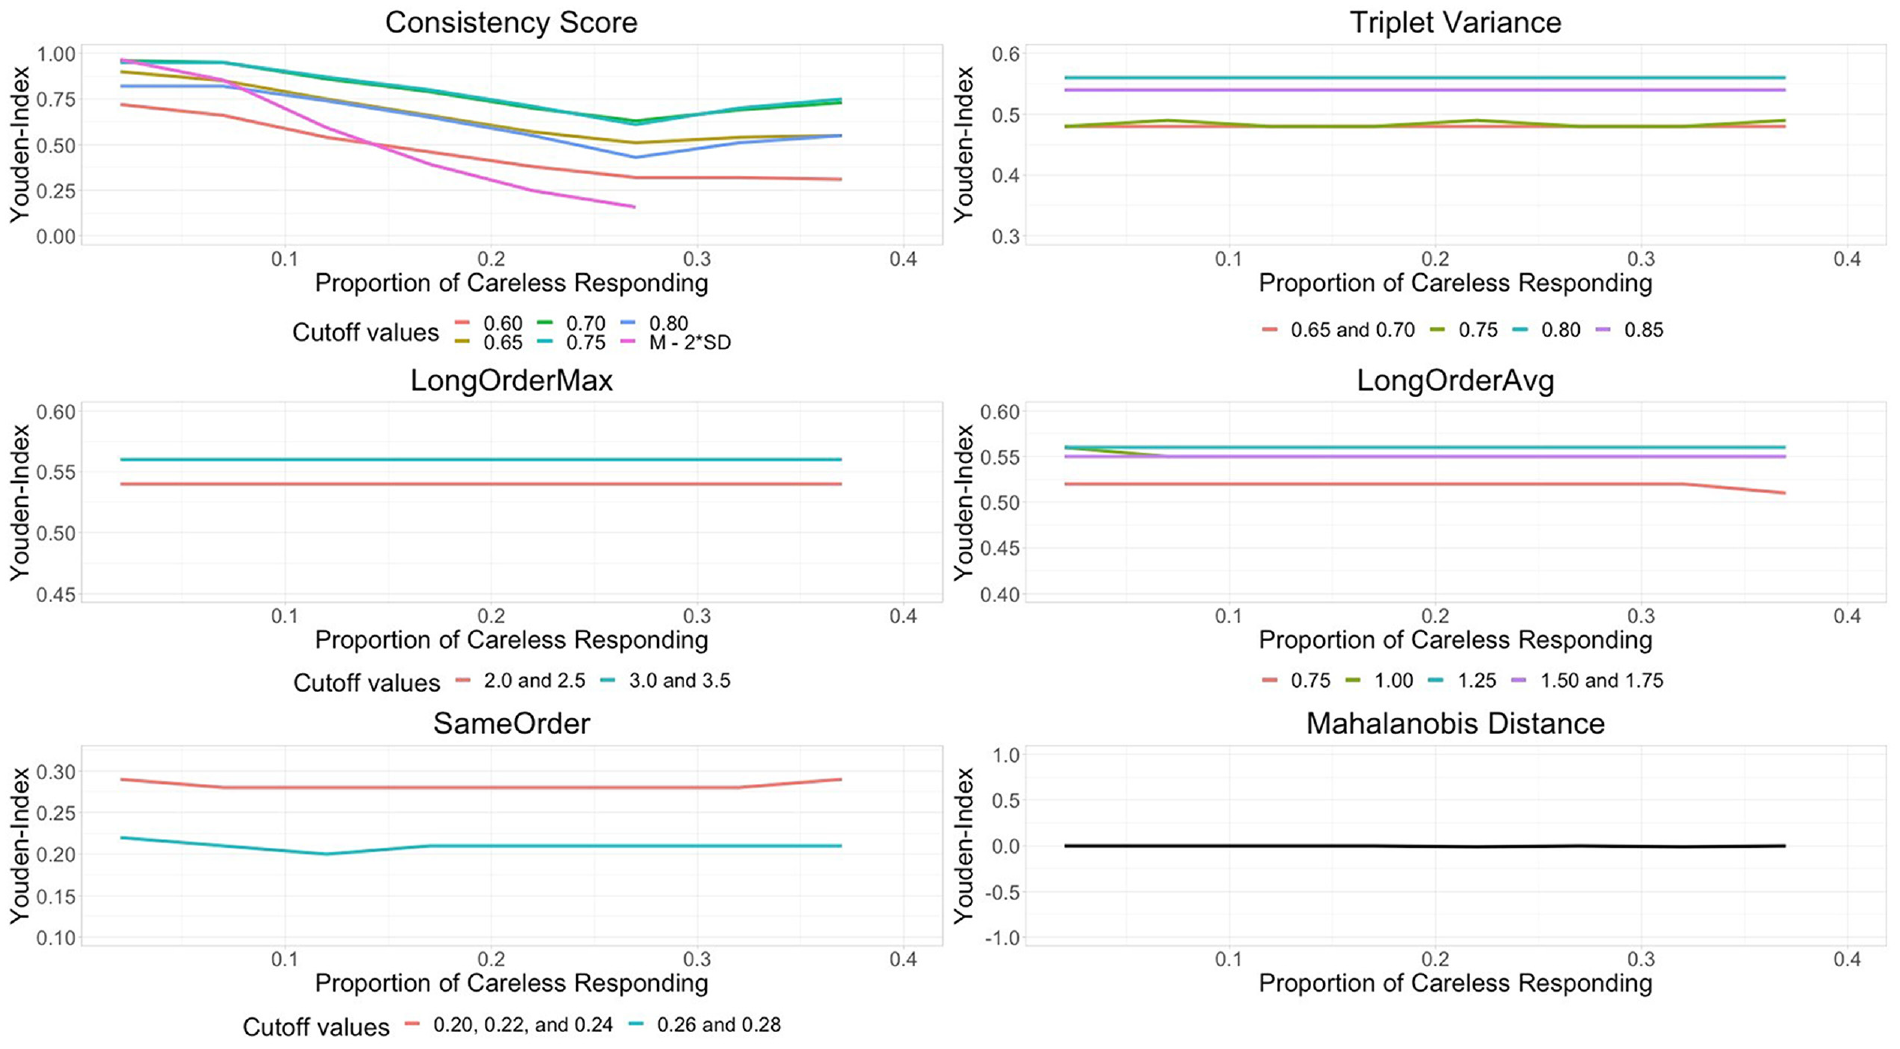
Youden-Index for Different Cutoff Values for the Careless Responding Indices.
The results of the simulation study can be summarized as follows: (a) With the exception of Mahalanobis distance, the results are consistent with the conceptual idea of the indices, resulting in trends in the expected direction with increasing proportions of careless responding in the sample. (b) The indices capture different kinds of careless responding: the consistency score captured moderate and random responding best, the triplet variance captured strong and random responding best, the longOrderMax and -Avg captured strong and moderate responding best, and the sameOrder captured all forms of careless responding. (c) The balance between sensitivity and specificity of the indices over a range of cutoff values (i.e., AUC) was in an acceptable to excellent range.
Discussion
The development of models that allow deriving normative trait estimates boosted the use of the MFC format in research and practice. Several MFC questionnaires especially for the assessment of personality traits have been developed including occupational personality inventories (e.g., Watrin et al., 2019), and scales assessing maladaptive personality traits (e.g., Guenole et al., 2018). In addition, research has, for example, investigated the validity of existing instruments (e.g., Walton et al., 2020; Watrin et al., 2019; Wetzel & Frick, 2020; Zhang et al., 2020) and developed methods that can be used for constructing new instruments (e.g., Frick, 2023; Pavlov et al., 2021) and for detecting differential item functioning (e.g., Lee et al., 2021). However, it was so far unclear how to detect careless responding in MFC data. Therefore, in this study, we developed a number of indices to detect careless responding in MFC questionnaires. These indices can easily be computed using the functions we published on GitHub (https://github.com/rkupffer/CRinMFC). In the present study, we provide a first examination of the indices’ performance and the extent of careless responding in MFC data based on a large online sample. In general, it seems that careless responding is an important issue that should be addressed not only in rating scale data but also in the MFC format. However, adapting careless responding indices from the rating scale to the MFC format is not straightforward and will not necessarily lead to the same behavior and performance. Our hypotheses on the indices’ relations, which were based on prior research with similar indices in the rating scale format, all had to be rejected. According to the results of the latent profile analysis, between 16% and 24% of the sample responded carelessly. The examined indices differed in their performance with the triplet variance, longOrderMax, instructed response triplets, and response time index performing best overall. There was twofold evidence for this in the data: (a) the correlations of these indices with the other indices were comparatively high, and (b) the average class means in the latent profile analysis differed on these indices. Removing participants who were flagged by these four indices slightly improved reliability estimates for most of the scales. The results of the simulation study confirmed that, with the exception of the Mahalanobis distance, the examined indices work as intended conceptually.
Is Careless Responding the Same in Rating Scales and MFC Questionnaires?
Various results from this study can be compared with the results of studies investigating careless responding in rating scale questionnaires. Although the correlations among the indices for the MFC format were smaller than expected, the results regarding latent classes of careless respondents and the increase in careless responding over the course of the online survey were in line with studies using questionnaires in the rating scale format. These similarities and differences will be discussed in the following paragraphs.
Correlations Among the Careless Responding Indices
Our results showed some differences to findings from rating scales regarding the nature of careless responding and the performance of the indices. One of the most evident differences was the correlational structure among the indices. Some of the indices that worked well in the rating scale format, including Mahalanobis distance, did not correlate with most of the other indices in the MFC format. Moreover, the indices did not share a substantial amount of variance, as indicated by a low KMO value.
We posed our hypotheses regarding the correlations among the indices based on results obtained with rating scale data by Meade and Craig (2012) and implemented the same self-report items in our online survey as they did. Two of the three hypotheses concerned the correlations with and among the three self-report items effort, attention, and use me. The two response formats differ from each other; therefore, it is not surprising that the correlations of our MFC indices with the self-report items differed from the ones reported by Meade and Craig for the rating scale indices. However, the correlations among the self-report items also differed between studies, despite the fact that these items were identical in both studies. The most striking differences were found for use me, for which we found no relationships with most of the other indices. It is possible that this result is related to our data collection using Prolific Academic. On this platform, every user has a unique ID that can be linked across several studies. Researchers who detect low-quality or suspicious data can report these IDs to Prolific (e.g., Lumsden, 2018). Participants might have feared being rejected from future studies if they stated that their data should not be used for analysis.
Types of Indices and Groups of Respondents
Other studies using the rating scale format tended to report small relationships among the careless responding indices and argued that this small overlap underscores the need to use different types of indices (e.g., DeSimone & Harms, 2018). With the term types of indices, we refer to groups of indices that capture similar response behavior: For instance, the rank order indices are of the same type, while the self-report items are of another type. Another result of our study which might support the recommendation to use different types of indices for data cleaning are the different latent classes. In latent class or profile analysis, multiple indicators are used to assign participants to classes. The results of the latent profile analysis in this study suggest that our sample consisted of four classes: a large careful class containing the majority of participants, and three smaller careless classes. The three careless classes differed with regard to the extent and manifestation of careless responding measured by our indicators. Studies conducting latent profile analysis to investigate careless responding in the rating scale format have often found three classes of respondents (e.g., Kam & Meyer, 2015; Maniaci & Rogge, 2014; Meade & Craig, 2012). The additional class we found is more likely to be attributed to differences in the handling of missing values (i.e., we did not exclude participants with missing values from the analysis) than to the difference in response format. The remaining three classes converge with those found for rating scales. In line with results by Kam and Meyer (2015), Maniaci and Rogge (2014), and Meade and Craig (2012), we found a small class containing participants who chose one response option (scale point or rank order) repeatedly in a row and another (somewhat larger) careless class with participants responding inconsistently. In the previous studies, the latter class was also distinguishable from the other classes by high values on Mahalanobis distance, which was not evident in our data. The proportion of the sample assigned to the different classes varied in previous research. In Kam and Meyer (2015), the class of careless respondents with high values on LongString comprised 14% of the sample. In our sample as well as in the other two rating scale studies (Maniaci & Rogge, 2014; Meade & Craig, 2012), this class was notably smaller (i.e., 1–2%). Thus, although the rating scale and MFC format differ substantially from each other, our results suggest some similarities in the nature of careless responding across the two formats.
Careless Responding Over the Course of the Study
For the rating scale format, increases in the occurrence of careless responding over the course of the study have been found (e.g., Bowling et al., 2021; Clark et al., 2003; Galesic & Bosnjak, 2009). Hence, we compared the percentage of respondents identified as careless in the first and last questionnaires of the online survey. Interestingly, the sameOrder index yielded a larger proportion of careless respondents in the first questionnaire. This might be related to the fact that people who are not yet familiar with the forced-choice format choose the presented rank order more often when they are unsure about how to rank the items. Later in the questionnaire, as they gain more experience, they may choose different rank orders in this case.
The proportion of participants flagged as careless by the other two rank order indices, longOrderMax, and longOrderAvg, and by the triplet variance was significantly higher in the last questionnaire. This increase in careless responding over the course of the study is in line with findings for the rating scale format regarding the LongString index (Bowling et al., 2021) and the variability in the response pattern (Galesic & Bosnjak, 2009). In an exploratory analysis, we found that the proportion of participants identified as careless by the response time index and missing values index was higher in the last questionnaire. The result for the response time index is in line with previous research (e.g., Bowling et al., 2021; Galesic & Bosnjak, 2009), but the result for missing values contrasts with the results by Galesic and Bosnjak (2009), who reported no increase in missing values.
These results suggest that at least some participants who were flagged as careless respondents by the indices did not respond carelessly to all questionnaires in the online study. Therefore, it might be beneficial to exclude careless respondents using model-based approaches, perhaps based on response times (e.g., Ulitzsch et al., 2022), or on the questionnaire level rather than cutoff values based on the whole survey.
Recommendations for Detecting Careless Responding in the MFC Format
The results of our study have several implications for practitioners using questionnaires in the MFC format. First, we recommend including instructed response triplets together with the questionnaire of interest. The efficacy of the instructed response triplets was highlighted by the results of the latent profile analysis: The instructed response triplet index was not used as a variable to assign the participants to different classes, but the post hoc calculation of the average class mean on this index showed that the careful classes missed practically none of the instructed response triplets. When including this kind of question in a survey, researchers must bear in mind that it may unsettle or confuse participants who are conscientiously filling out the questionnaire. Therefore, it is recommended to keep the number of instructed response items in balance with the total number of survey items (e.g., one instructed response item per 50–100 questionnaire items; Meade & Craig, 2012).
Second, throughout both parts of our study, the Mahalanobis distance did not provide promising results. Specifically, there was no substantial overlap with the other indices. Moreover, with increasing proportions of careless responding in the sample, there was no obvious effect on the Mahalanobis distance visible. Therefore, we recommend calculating the index only as an additional measure, if at all.
Third, as our indices varied in their sensitivity to different manifestations and degrees of careless responding, we recommend using different kinds of indicators to identify distinct careless responding groups. Therefore, after data collection is completed, we recommend using at least the indices triplet variance, longOrderMax, and response time index to screen for careless respondents. These three indices capture different kinds of careless responding behaviors. To calculate the response time index, the response time per page is needed. Therefore, when implementing an online survey, it is advisable to check beforehand how the response time is measured.
Limitations and Future Directions
As this study is the first to investigate detection methods for careless responding in the MFC format, the results need to be validated in further studies using different data sets. For practitioners, the careless responding indices can be a valuable tool. However, we must acknowledge their limitations (e.g., flagging false positives). As our understanding of the manifestation of careless responding in MFC questionnaires deepens, future research should focus on the development of model-based detection methods. A general limitation of some indices, including Mahalanobis distance or the response time, is that their cutoff values are sample-dependent and cannot easily be generalized across studies. The simulation study was useful for a conceptual proof of the indices and we identified cutoff values for some indices. These results are subject to validation in further analysis, as we made strong assumptions in our simulation (e.g., only interindividual variation of careless responding). Furthermore, the performance of the consistency score might depend on how well the model fits the data. Another limitation of the present study is that all questionnaires were forced-choice questionnaires with three items per block and a full ranking instruction. For other variants of the MFC format, the careless responding indices may have to be slightly modified. To what extent our results are applicable to other variants of the MFC format needs to be investigated in further studies.
Conclusion
This study serves as a starting point for investigating careless responding in MFC questionnaires. The adapted and newly developed indices to detect careless responding in the MFC format differed in how well they worked. Some practical recommendations include using an instructed response triplet and calculating several indices post hoc that capture different manifestations of careless responding behavior. Future studies should validate the results and work to establish appropriate cutoff values.
Supplemental Material
sj-pdf-1-epm-10.1177_00131644231222420 – Supplemental material for Detecting Careless Responding in Multidimensional Forced-Choice Questionnaires
Supplemental material, sj-pdf-1-epm-10.1177_00131644231222420 for Detecting Careless Responding in Multidimensional Forced-Choice Questionnaires by Rebekka Kupffer, Susanne Frick and Eunike Wetzel in Educational and Psychological Measurement
Footnotes
Declaration of Conflicting Interests
The authors declared no potential conflicts of interest with respect to the research, authorship, and/or publication of this article.
Funding
The authors disclosed receipt of the following financial support for the research, authorship, and/or publication of this article: This research was supported by a grant from the Young Scholar Fund of the University of Konstanz awarded to Eunike Wetzel and by the Deutsche Forschungsgemeinschaft (DFG, German Research Foundation)—GRK 2277 “Statistical Modeling in Psychology.”
Data Availability Statement
The study was preregistered (https://osf.io/sfwnp/). The data and analysis code are available on GitHub (Kupffer et al., 2022a; ![]() ).
).
Supplemental Material
Supplemental material for this article is available online.
Notes
References
Supplementary Material
Please find the following supplemental material available below.
For Open Access articles published under a Creative Commons License, all supplemental material carries the same license as the article it is associated with.
For non-Open Access articles published, all supplemental material carries a non-exclusive license, and permission requests for re-use of supplemental material or any part of supplemental material shall be sent directly to the copyright owner as specified in the copyright notice associated with the article.