
Abstract
To improve the validity of self-report measures, researchers should control for response style (RS) effects, which can be achieved with IRTree models. A traditional IRTree model considers a response as a combination of distinct decision-making processes, where the substantive trait affects the decision on response direction, while decisions about choosing the middle category or extreme categories are largely determined by midpoint RS (MRS) and extreme RS (ERS). One limitation of traditional IRTree models is the assumption that all respondents utilize the same set of RS in their response strategies, whereas it can be assumed that the nature and the strength of RS effects can differ between individuals. To address this limitation, we propose a mixture multidimensional IRTree (MM-IRTree) model that detects heterogeneity in response strategies. The MM-IRTree model comprises four latent classes of respondents, each associated with a different set of RS traits in addition to the substantive trait. More specifically, the class-specific response strategies involve (1) only ERS in the “ERS only” class, (2) only MRS in the “MRS only” class, (3) both ERS and MRS in the “2RS” class, and (4) neither ERS nor MRS in the “0RS” class. In a simulation study, we showed that the MM-IRTree model performed well in recovering model parameters and class memberships, whereas the traditional IRTree approach showed poor performance if the population includes a mixture of response strategies. In an application to empirical data, the MM-IRTree model revealed distinct classes with noticeable class sizes, suggesting that respondents indeed utilize different response strategies.
Introduction
Questionnaires are common tools in psychological and educational research to measure unobservable constructs (e.g., personality traits; Caprara et al., 1993) in large samples efficiently and inexpensively. However, many factors can damage the quality of questionnaire data, such as item wording effects (Nye et al., 2010), item position effects (Gehlbach & Barge, 2012; Tourangeau & Rasinski, 1988), socially desirable responding (Ones et al., 1996), and response styles (RS). RS are defined as tendencies to choose specific response categories regardless of the item content (Baumgartner & Steenkamp, 2001; Paulhus, 1991). Two commonly reported kinds of RS are extreme RS (ERS) and midpoint RS (MRS). ERS is defined as the tendency to choose the extreme response categories, whereas MRS is defined as the tendency to choose the middle response category.
Respondents can make use of RS as a way of heuristic responding, thereby they aim to reduce the cognitive and time cost of responding to questionnaire items (Krosnick, 1991; Krosnick et al., 1996; Podsakoff et al., 2012). If not controlled for, RS can bias trait estimates (Bolt & Johnson, 2009), score correlations and structural relationships between traits (Böckenholt & Meiser, 2017; Tutz et al., 2018), and psychometric properties of the questionnaire (Ashton et al., 2017; Kreitchmann et al., 2019; Plieninger, 2017). Moreover, there is a substantial amount of research that found between-group differences in RS as a source for measurement non-invariance (D’Urso et al., 2022; Eid & Rauber, 2000; Liu et al., 2017).
Item Response Theory (IRT) models are popular tools for dealing with RS. IRT-based approaches model RS either with person-specific threshold shifts (Falk & Cai, 2016; Jin & Wang, 2014) or additional traits influencing respondents’ category choices, for instance, in the multidimensional nominal response model (MNRM; Bolt & Johnson, 2009; for an overview, see Henninger & Meiser, 2020a). If researchers opt for the additional traits approach, they can either model a priori specified RS with fixed scoring weights (e.g., a trait that makes respondents favor the extreme categories) or estimate these scoring weights and interpret the meaning of RS traits post hoc.
A more recent approach, item response tree (IRTree) models, can also be used to control for a priori specified RS (Böckenholt & Meiser, 2017). IRTrees capture the cognitive processes underlying responding by modeling an observed response as a product of several decision-making processes. There are many different uses of IRTree models depending on the theoretical assumptions and the number of response categories (for an overview, see Böckenholt, 2012; De Boeck & Partchev, 2012; Jeon & De Boeck, 2016). When the aim is to separate the substantive trait from RS traits, researchers usually model the following three decisions for a 5-point rating scale item: (1) whether to choose the middle category (i.e., judgment), (2) whether to agree with the item content (i.e., direction), and (3) whether to choose an extreme category (i.e., intensity). RS are defined a priori in a way that the outcomes of the judgment, direction, and intensity decisions are determined by the MRS, the substantive, and the ERS traits, respectively. Therefore, only the response direction is determined by the substantive trait, whereas choosing a middle or extreme category is largely determined by RS traits.
Regardless of an exploratory approach or a priori specification of RS, the models being used imply that all respondents use the same set of RS while responding. For example, the MNRM assumes that the same RS traits and their scoring weights influence the category choices of all respondents in the same way, and IRTree models assume that MRS and ERS traits influence the judgment and extremity decisions of all respondents. However, respondents might differ in their response strategies, such that some respondents might use only the substantive trait, some might use only one type of RS, and some might use all possible RS while responding to an item. These between-person differences in response strategies cause between-person differences in measurement models and, thus, measurement non-invariance. Ignoring measurement non-invariance and fitting only one measurement model for all respondents is likely to yield biased estimates and threaten the validity of our inferences about persons, groups, and test characteristics (Vandenberg & Lance, 2000; Wicherts, 2016).
There can be several reasons for differential use of RS among respondents. First, respondents with better cognitive skills, stronger motivation, or better knowledge about the research topic may spend their resources on deciding on the response option that describes them best. Therefore, their responses will be less affected by RS and will mainly determined by the substantive trait instead. Indeed, Khorramdel and colleagues (2019) found that respondents with higher cognitive literacy and numeracy scores used ERS to a lesser extent. Second, if respondents lack the motivation to participate in a study or lack related cognitive skills, they can incorporate RS in their response strategies to minimize their cognitive efforts (i.e., heuristic responding, Galesic et al., 2008; Krosnick, 1991). However, it does not necessarily mean that respondents use all types of RS at once or randomly choose one type of RS and make use of it. There can be situational (Shulman, 1973), demographic (Krosnick et al., 1996; Meisenberg & Williams, 2008), or individual covariates (e.g., personality traits) that determine which specific RS are employed by respondents to achieve effort minimization.
Approaches to Detect Heterogeneity in Response Strategies
If there are latent subpopulations of respondents following different response strategies, we do not know which respondents belong to which subpopulation in advance. In other words, there is not an observed grouping variable that indicates which response strategy a respondent uses. For such problems, the most suitable approach is to make use of mixture models (Lindsay, 1995; McLachlan & Basford, 1988). Mixture models assume that the data contains multiple subpopulations of respondents (i.e., latent classes), each of which follows a different type of distribution or a common type of distribution with different parameter values.
For modeling heterogeneity in response behaviors, earlier studies used mixture Rasch models (Rost, 1990; Wetzel et al., 2016), mixture (generalized) partial credit models (gPCM, Huang, 2016; Rost, 1991), HYBRID models (von Davier & Yamamoto, 2004; Yamamoto, 1982; Yamamoto & Everson, 1995), and mixture IRTree models (Khorramdel et al., 2019; Kim & Bolt, 2021; Tijmstra et al., 2018). Mixture Rasch and PCM models capture subpopulations of respondents who differ in threshold parameters. Therefore, these models detect respondents who merely differ in what part of the response scale they tend to use (Henninger & Meiser, 2020a). However, we are interested in detecting respondents who differ in their response strategies that stem from different underlying cognitive processes. Therefore, mixture Rasch and PCM models are not considered in this study. Two other model families, HYBRID and confirmatory mixture IRTrees, handle responding as a cognitive process and investigate heterogeneity in these processes with some assumptions about the response strategies used in their mixture components.
HYBRID Model
The HYBRID model proposed by Yamamoto (1982) is specified to have two classes: an IRT class and an independence class. In the first class, an IRT model holds. In the second class, an independence model holds that corresponds to traditional latent class analysis (von Davier & Rost, 2006; von Davier & Yamamoto, 2004, 2007). Responses are determined by a substantive trait in the IRT class, whereas respondents randomly choose their responses in the independence class. Although this line of research accounts for heterogeneity in cognitive processes underlying response behavior, it still assumes homogeneity of response strategies in the IRT class.
General Mixture Item Response Models
Tijmstra and colleagues (2018) proposed a confirmatory mixture item response model for 5-point rating items to identify respondents who use the middle category to reflect a nonresponse choice (IRTree class) and those who use it to indicate their endorsement level (gPCM; generalized partial credit model class). In the IRTree class, respondents first make a binary decision on whether to choose the middle category, which is affected by an MRS trait. If the middle category is not chosen, then they decide which of the other four reflects their endorsement level, which is determined by the substantive trait through a gPCM in compliance with categories’ ordinal interpretation. In the gPCM class, the middle category is also interpreted as part of the ordinal scale of item endorsement. Therefore, responses in this class are modeled with a unidimensional gPCM, where a substantive trait affects the probability of all five categories. Tijmstra and colleagues (2018) found that around 30% of the respondents interpret the middle category as a nonresponse, whereas the rest consider it as part of the ordinal scale.
There are some drawbacks to the mixture model of Tijmstra and colleagues (2018). In their model, an extreme response can occur only because of a high or low substantive trait score, as extreme categories are part of a unidimensional gPCM in both classes. However, earlier studies reported that ERS can have a significant impact on choosing extreme categories. To account for that, one can extend their model to accommodate an ERS trait in gPCM parts. Nevertheless, even if ERS is incorporated in their mode, there can be heterogeneity in the source of extreme category choices just like for the middle category choices, and one must further account for it.
In this study, we propose a new mixture model that is fully in the IRTree framework, detects heterogeneity in the use of middle category and extreme categories, and can be extended to any number of categories.
Stepwise Mixture IRTree Approach
Khorramdel and colleagues (2019) proposed a stepwise mixture multidimensional IRTree model to differentiate respondents who use only the substantive trait and those who use the substantive trait and ERS trait. It is a three-step approach involving the following steps: (1) testing whether RS exists in the data via IRTree models, (2) testing whether heterogeneity in RS exists via a mixture 2PL model on IRTree data, (3) fitting IRTree models in each class to see if and which RS exist in that class. With this approach, the first step can yield erroneous results if there is heterogeneity in RS use that is yet to be detected in the second step; therefore, the first step can be skipped, as the authors also suggest. Furthermore, their approach rules out an effect of the substantive trait on response intensity, while an extreme response can actually indicate an extreme opinion.
A Mixture IRTree Model for Extreme RS
Recently, Kim and Bolt (2021) proposed a 2-class confirmatory mixture IRTree model that can distinguish respondents, who use the substantive trait for the response direction and ERS for the response intensity, from those who use the substantive trait for both the response direction and intensity. Their model is well suited for detecting heterogeneity in the use of ERS with 4-point rating items. However, when we have five or a higher number of categories, then we also need to model the MRS effects and heterogeneity in the use of MRS. For 5-point rating items, we can extend their model to have an additional decision node for the middle category choices affected by an MRS factor (see Figure 1 and Böckenholt & Meiser, 2017). Then, it becomes cumbersome to model the heterogeneity in the use of MRS because this traditional IRTree structure does not include the middle category in the ordinal response process. In other words, we cannot specify an alternative class where the middle category is chosen due to moderate level of substantive trait (see the next section for further details). To simultaneously model heterogeneity in the sources of middle and extreme category choices, a different IRTree structure that does not separate the middle category from the response process is needed. The present study proposes a new IRTree structure for 5-point rating items, including MRS effects, incorporating the middle category into the ordinal endorsement scale, and modeling the heterogeneity in the sources of both extreme and middle categories simultaneously.
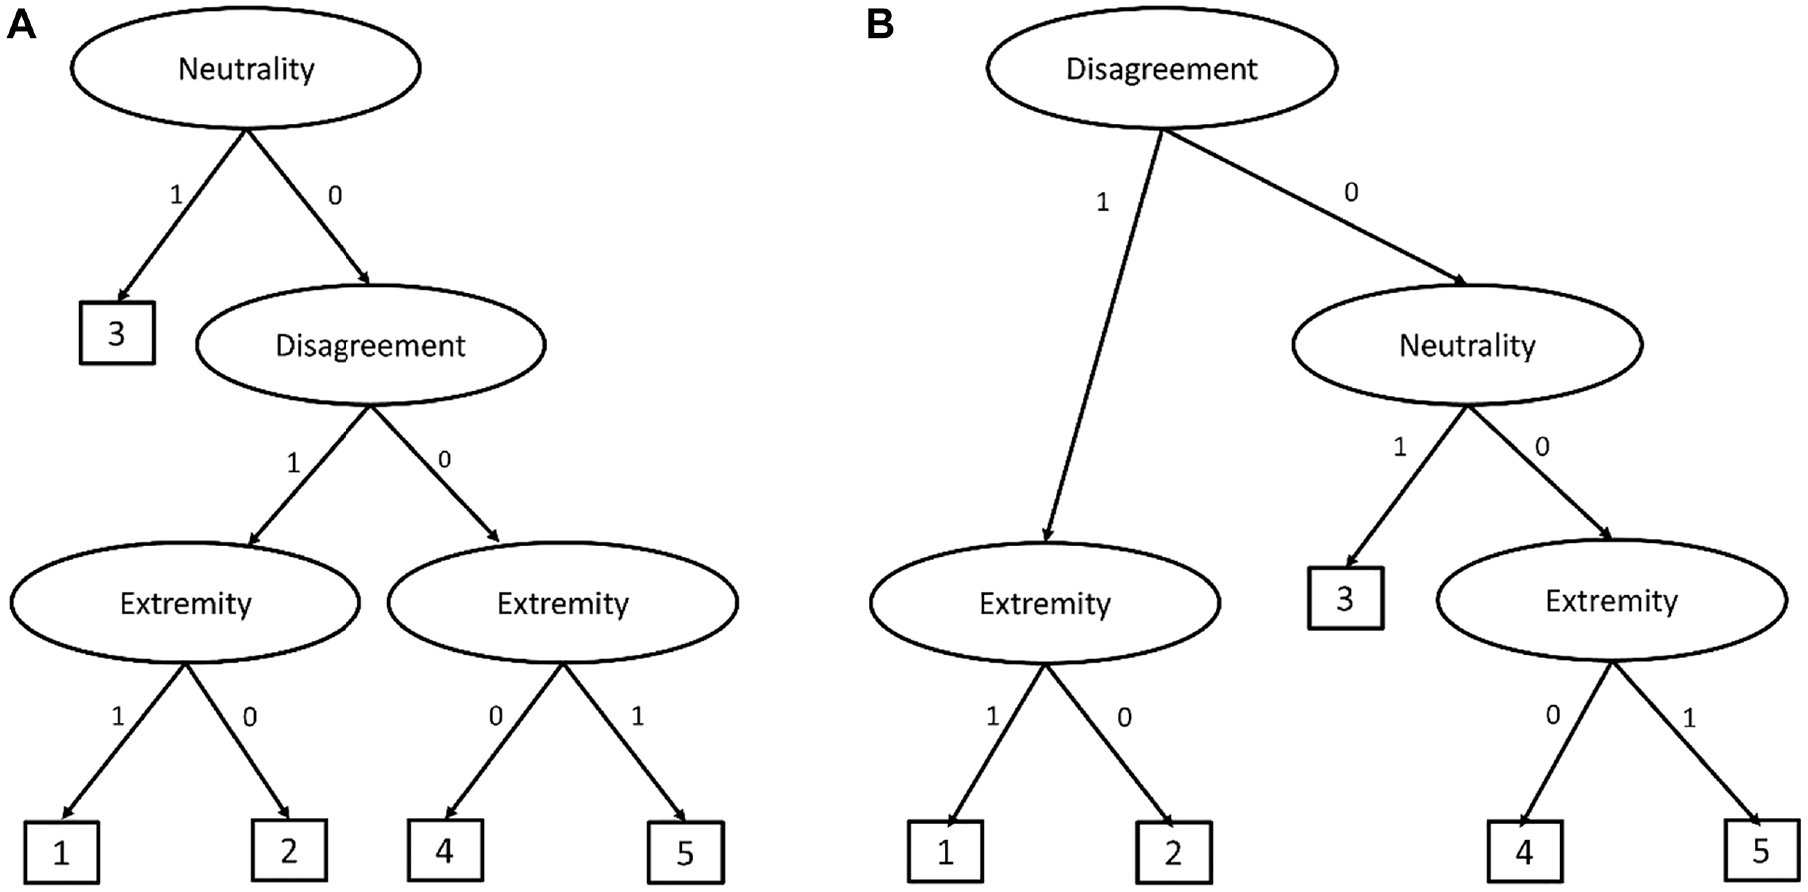
(A) Tree Structure in Böckenholt (2012). (B) Tree Structure of M-IRTree.
In the present study, we propose a confirmatory mixture multidimensional IRTree (MM-IRTree) model. The MM-IRTree model detects respondent subpopulations that differ in what kinds of RS they use in their response strategies in addition to the substantive trait that is to be measured. More specifically, the proposed MM-IRTree model consists of four classes that are defined as the following: (1) respondents who use only ERS, (2) respondents who use only MRS, (3) respondents who use both ERS and MRS, (4) respondents who use neither ERS nor MRS. The MM-IRTree framework offers at least three advantages to researchers. First, it functions on 5-point rating items that are commonly used in psychological and educational measurement. Second, it accounts for the heterogeneity in the sources of middle-category and extreme-category responses simultaneously. Third, it purifies the substantive trait estimates from the effects of stylistic responding by acknowledging that each respondent can be contaminated by a different set of RS.
The next section introduces the new multidimensional IRTree model for 5-point rating items and its mixture extension. Then, we describe the model estimation, simulation settings, and simulation results. Next, we illustrate the proposed model by analyzing an empirical data set. We end the paper with a conclusion and discussion.
IRTree Models
We present an example IRTree model for 5-point rating items from Böckenholt (2012) in Figure 1(A). In the example IRTree model, respondents make up to three decisions until they reach a response. At the first node, they decide whether they give a judgment about the item content or pick a neutral middle category. If they give a judgment, then, they decide whether to agree or disagree with the item content at the second node. Finally, they decide whether to choose an extreme or intermediate category at the third node. By relating the MRS trait to the first, the substantive trait to the second, and the ERS trait to the third nodes, the effects of RS on the measurement of the substantive trait are accommodated (for further technical details, we refer readers to Böckenholt, 2012; Böckenholt & Meiser, 2017).
There are two limitations to this example IRTree model. First, the middle category is treated as a non-informative neutral response and separated from the response process. However, respondents can choose the middle category not only because they have a high MRS score but also because of a medium substantive trait value (Tijmstra et al., 2018). Second, the IRTree model in Figure 1(A) assumes that the substantive trait only affects the binary decision between agreement and disagreement. This assumption disregards the possible information about the substantive trait that would come from the middle and extreme categories. Indeed, previous research showed that the substantive trait also plays a role in the fine-grained selection among relative disagreement and agreement categories for 6-point rating items (Meiser et al., 2019). Therefore, we introduce a multidimensional nodes IRTree (M-IRTree) model for 5-point rating items that allow the substantive trait to affect middle category choices and fine-grained selection among the agreement and disagreement categories.
Multidimensional Nodes IRTree Model
As a first step to introduce the M-IRTree model for 5-point rating items, we describe the decisions involved in the response process. According to the M-IRTree, respondents make up to three judgments, as depicted in Figure 1(B). At the first node, respondents decide whether to disagree with the item content or not. If the decision is disagreement, respondents go to the extremity node to decide whether they choose the extreme disagreement category. If the decision is against disagreement, respondents proceed to the neutrality node to decide whether they stay neutral or agree with the item content. If they decide to stay neutral, they choose the middle category. If they decide to agree, in contrast, they go to the extremity node, where they decide whether to choose the extreme agreement category. It is important to note that the first two nodes are actually a sequential IRT model, where disagreement, neutrality, and agreement are modeled as ordinal outcomes (Tutz, 1990). Therefore, we addressed the first limitation of the IRTree model in Figure 1(A) by allowing the substantive trait to play a role at the neutrality node. 1
The second step of model specification is to decompose items into pseudo-items. According to the M-IRTree structure presented in Figure 1(B), an observed rating response is decomposed into three pseudo-items that represent the disagreement node (i.e.,
Pseudo-Items, Value Assignments for Original Response Categories, and Response Probabilities of Each Pseudo-Item.
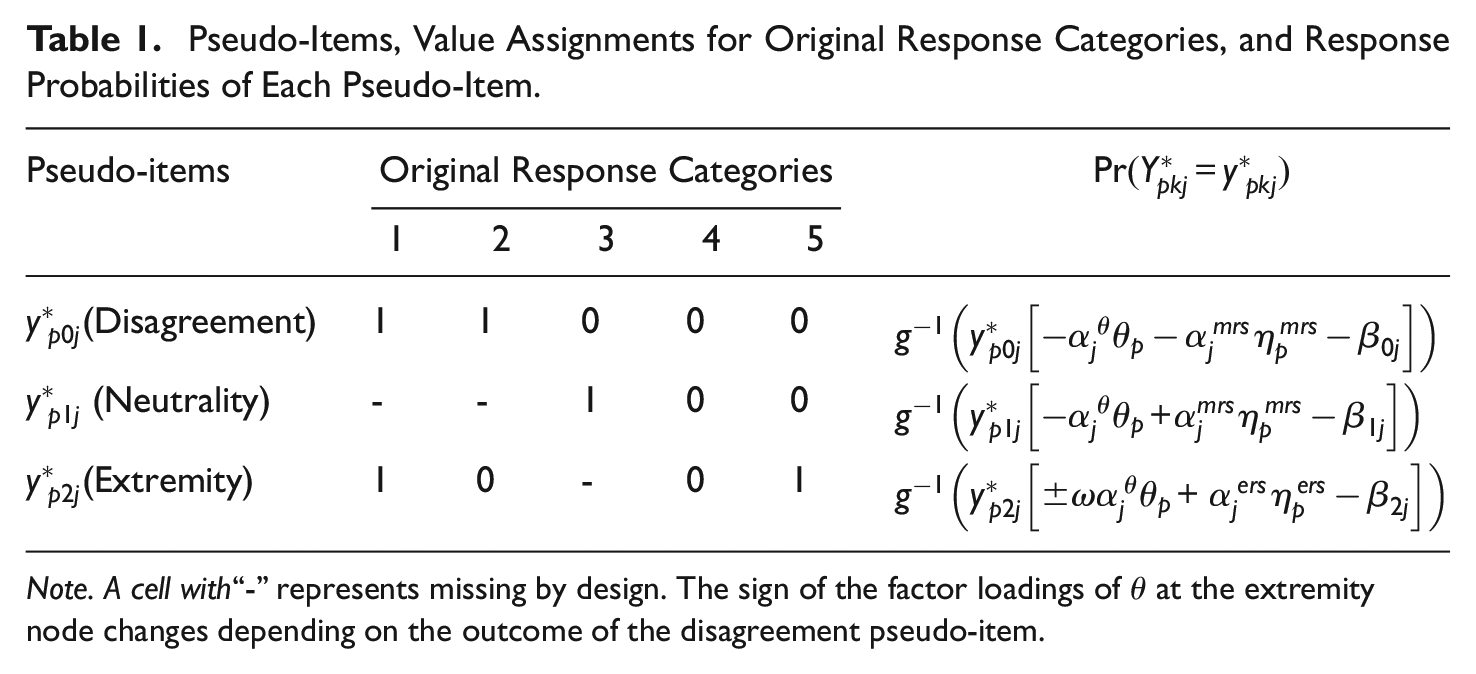
Note. A cell with“-” represents missing by design. The sign of the factor loadings of
The third step is to relate latent variables to these three nodes with a 2PL item response model. The decision about which latent variables should be involved at which nodes depends on what we aim to model. Assume that we aim to model both ERS and MRS while also allowing the substantive trait to affect the middle and extreme categories. Then, we can relate the substantive trait, ERS trait, and MRS trait to the M-IRTree nodes as follows:
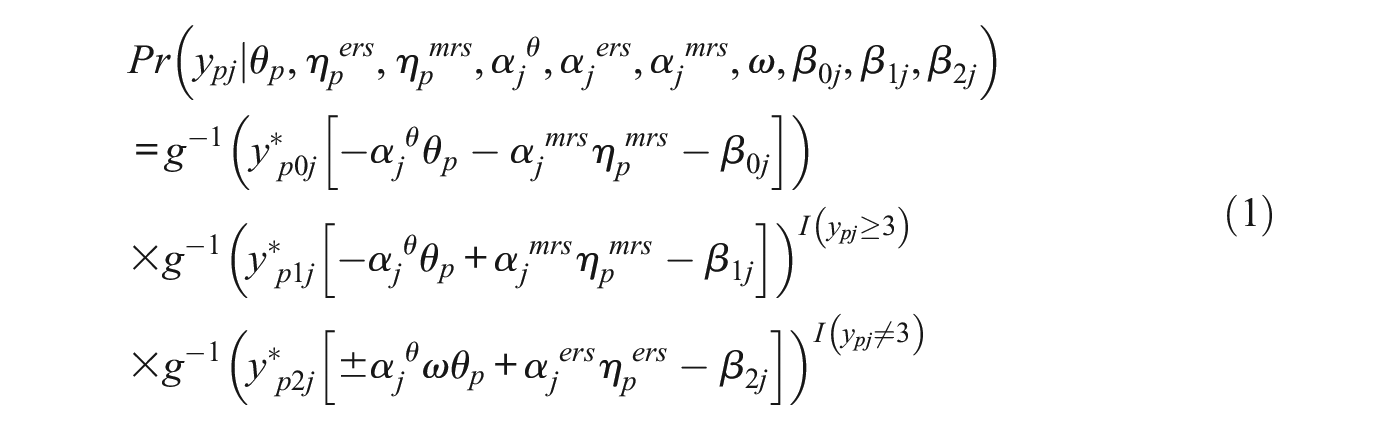
The fourth and the last step is to formally express the item response model for the original response categories. Let
The M-IRTree model assumes that all respondents make use of both ERS and MRS traits in their response strategy. However, if there are subpopulations of respondents who use only ERS, only MRS, or neither of them, M-IRTree would yield biased estimates as it assumes all respondents make use of both types of RS to the same extent.
Mixture Multidimensional Nodes IRTree Model
The proposed MM-IRTree model is a confirmatory mixture model with four latent classes. In all classes, the substantive trait is involved in the disagreement, neutrality, and extremity nodes in the way that the higher the substantive trait score, the higher the probability of choosing higher categories (see Table 1). However, the four classes differ in what RS respondents use as part of their response strategy. In the “ERS only” class, respondents use the ERS trait at the extremity nodes. In the “MRS only” class, respondents use the MRS trait at the disagreement and neutrality nodes. In the “2RS” class, respondents use the ERS trait at the extremity node and the MRS trait at the disagreement and neutrality nodes, while respondents use neither the ERS trait nor MRS trait as part of their response strategy in the “0RS” class.
We transcribe these four class definitions into our model by fixing the factor loadings of ERS and MRS traits at zero when they are not used in the response strategy of a class. Formally, the following factor loadings are fixed to zero: (1) MRS factor loadings in the “ERS only” class, (2) ERS factor loadings in the “MRS only” class, (3) both ERS and MRS factor loadings in the “0RS” class. Factor loadings of ERS and MRS traits in the “2RS” class are freely estimated because its members use both RS as part of their response strategy. An important aspect of this transcription is that we do not imply that some respondents do not have ERS or MRS per se. In contrast, we imply that, even though all respondents may have any values on ERS and MRS traits, some of them might not use them on certain occasions due to the reasons mentioned in the introduction. Fixing the factor loadings of an RS to zero means that the RS does not affect the observed rating responses or, more formally, that no variance is explained by the underlying RS factor in the model.
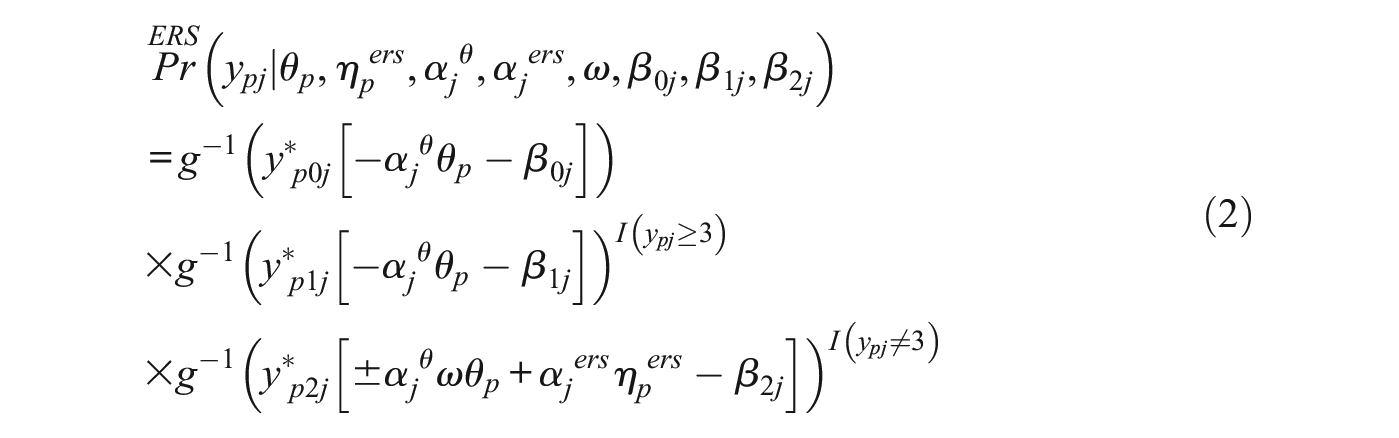
For the further description of the MM-IRTree model, we will first introduce the response model for each class separately. The response models assume that respondents are homogeneous in their response strategy within a given class. Using the same notation as in M-IRTree (see Equation 1), Equation 2 presents the response model for the “ERS only” class, where respondents use the substantive trait and ERS as part of their response strategy. This model will be referred to as “ERS IRTree” since it only models ERS:
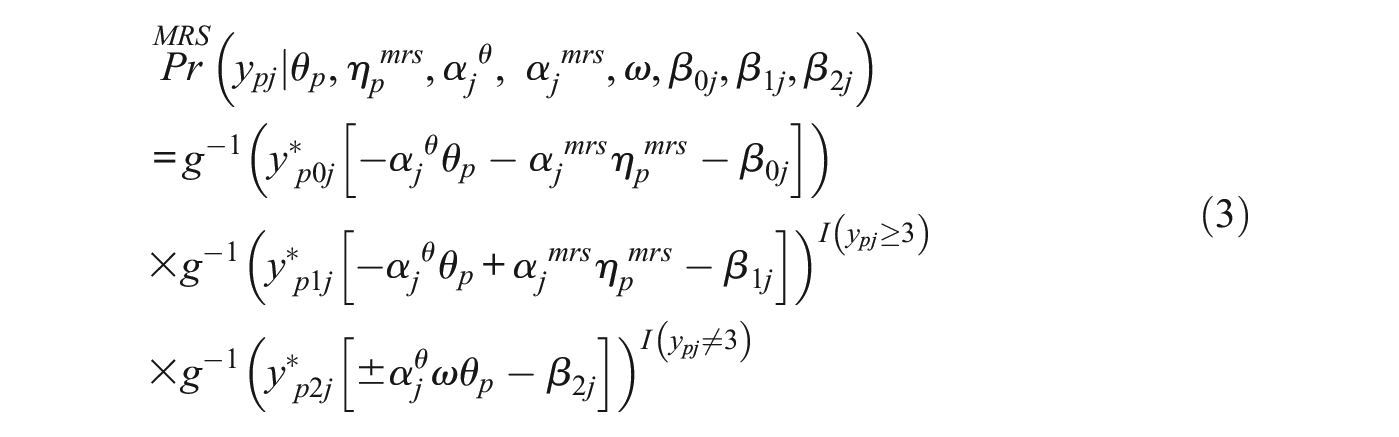
Equation 3 presents the response model for the “MRS only” class, where respondents use the substantive trait and MRS trait as part of their response strategy. This model will be referred to as “MRS IRTree” since it only models MRS:
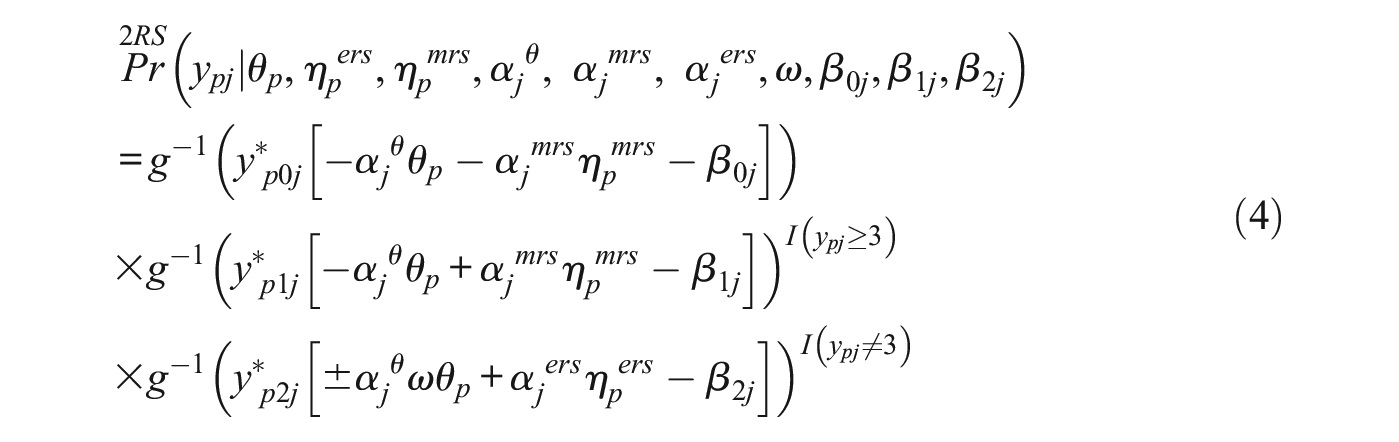
Equation 4 presents the response model for the “2RS” class, where respondents use the substantive trait, ERS, and MRS as part of their response strategy. It is the same model as the one presented in the M-IRTree section, but from now on, we will refer to it as “2RS IRTree” for consistency.
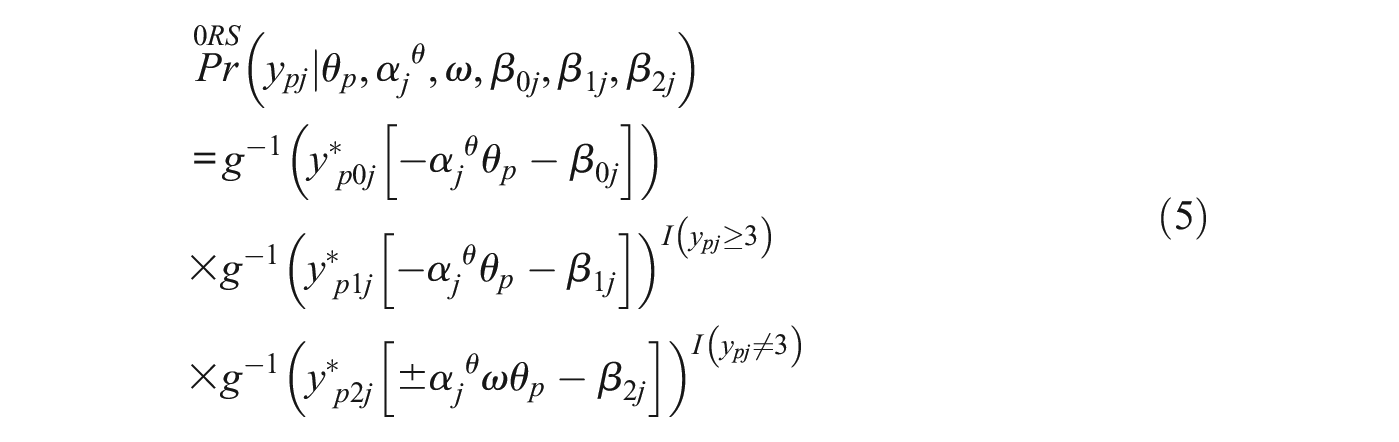
Finally, Equation 5 presents the response model for the “0RS” class, where respondents use the substantive trait but neither ERS nor MRS as part of their response strategy. This model will be referred to as “0RS IRTree” since it does not model any RS.
For the MM-IRTree model, let
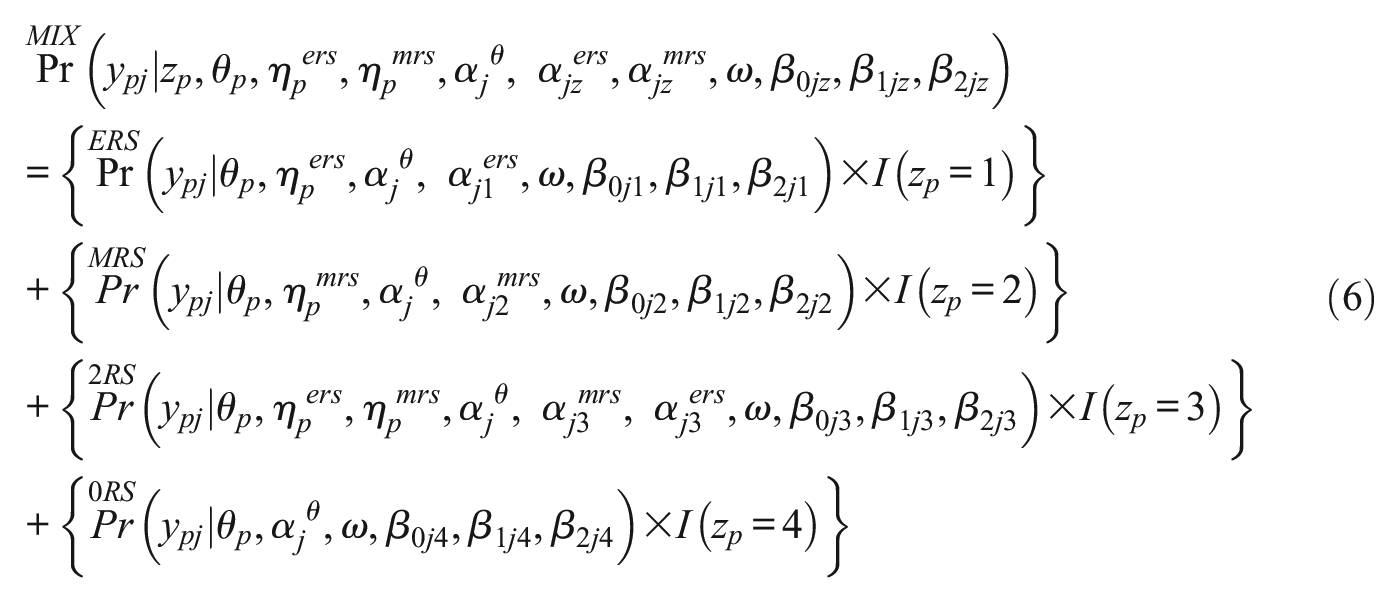
The MM-IRTree consists of four response models (i.e., four IRTree models) in Equations 2 to 5.
4
Depending on the class membership of a respondent
Before going into details of the model estimation, we explain why we made some parameters class-invariant and others class-specific. First, we made factor loadings of the substantive trait (
Second, we set factor loadings of RS traits
Third, we assume node difficulties to be class-specific for two reasons. The first reason is we find it unrealistic to have different numbers of traits yet the same node difficulties in different classes, and the second reason is to allow for an increase in the class separation (i.e., how easy it is to distinguish classes from each other).
Finally, we assume trait scores to be multivariate normally distributed, where their expectations are fixed at zero and variances are fixed at one for identification. However, correlations between traits are freely estimated and made class-invariant. The reason for a class-invariant correlation matrix is that we do not expect relationships between the latent variables in our model to change between classes since we ensure that the same substantive trait is measured in all classes via class-invariant
In summary, with the MM-IRTree model, we assume that all respondents have values on the substantive trait θ, the ERS trait
In other words, the proposed MM-IRTree can be considered as a confirmatory mixture approach that combines the specification of hypothesized response processes with probabilistic component models and probabilistic assignment of respondents to latent subpopulations.
Estimation
In the simulation study and empirical example, we also fit single-class IRTree models specified in Equations 2 to 5 in addition to the MM-IRTree as benchmarks for model selection and parameter recovery. For all models estimated in this paper, we use a Bayesian MCMC algorithm. We implemented the estimation in “Just Another Gibbs Sampler” (JAGS; Plummer, 2017). We used JAGS via the “runjags” package (Denwood, 2016) in the “R” software (R Core Team, 2021). For processing the MCMC outputs, we used the “MCMCvis” package (Youngflesh, 2018) in the R software. All of our model syntaxes, generated data sets, and the R syntax for the analysis of the empirical data set are provided on Open Science Framework and can be accessed via https://osf.io/jq36d/.
Here, we summarize our choices for prior distributions for parameter estimation. First, for the single-class 0RS IRTree model, where there is only the substantive trait as a person parameter, we specified a standard normal distribution. For the other single-class IRTree models and the MM-IRTree, we specified a multivariate normal distribution where means were fixed at zero, variances were fixed at one, and correlations between the modeled traits were freely estimated. For any correlation parameter, we specified a non-informative uniform prior U(−1,1). For any factor loading in all models, we specified a slightly informative normal prior truncated to be positive N(0, 2)T(0,). For any node difficulty, we specified a slightly informative normal prior N(0,2). For the proportionality constant
Simulation Study
Simulation Design
In this section, we describe the settings of our simulation study, which we conducted to investigate how well we can recover item and trait parameters, trait correlations, class proportions, and class memberships. In the simulation study, we manipulated the class proportions of the population model
For each of the nine conditions, we created 10 data sets containing responses from 2,000 respondents on 20 items with a 5-point rating scale. The data sets were generated in the following steps:
We drew
We drew the factor loadings of the substantive trait
Class memberships were generated according to the class proportion condition. The first
Depending on the class membership of a respondent, category probabilities were calculated by plugging the generated parameter values into Equations 2, 3, 4, or 5. Therefore, for each respondent, we obtained five probabilities corresponding to five response categories per item.
We generated multinomial responses by using the probabilities in the previous step. This step yielded a
The responses we generated in the previous step were decomposed into pseudo-items, as depicted in Table 1. Therefore, our final data set had 2,000 rows representing respondents and
We repeated Step 5 and Step 6 to generate 10 data sets.
We repeated Step 4 to Step 7 for each class proportion condition.
In total, we generated
Simulation Results
Model Selection
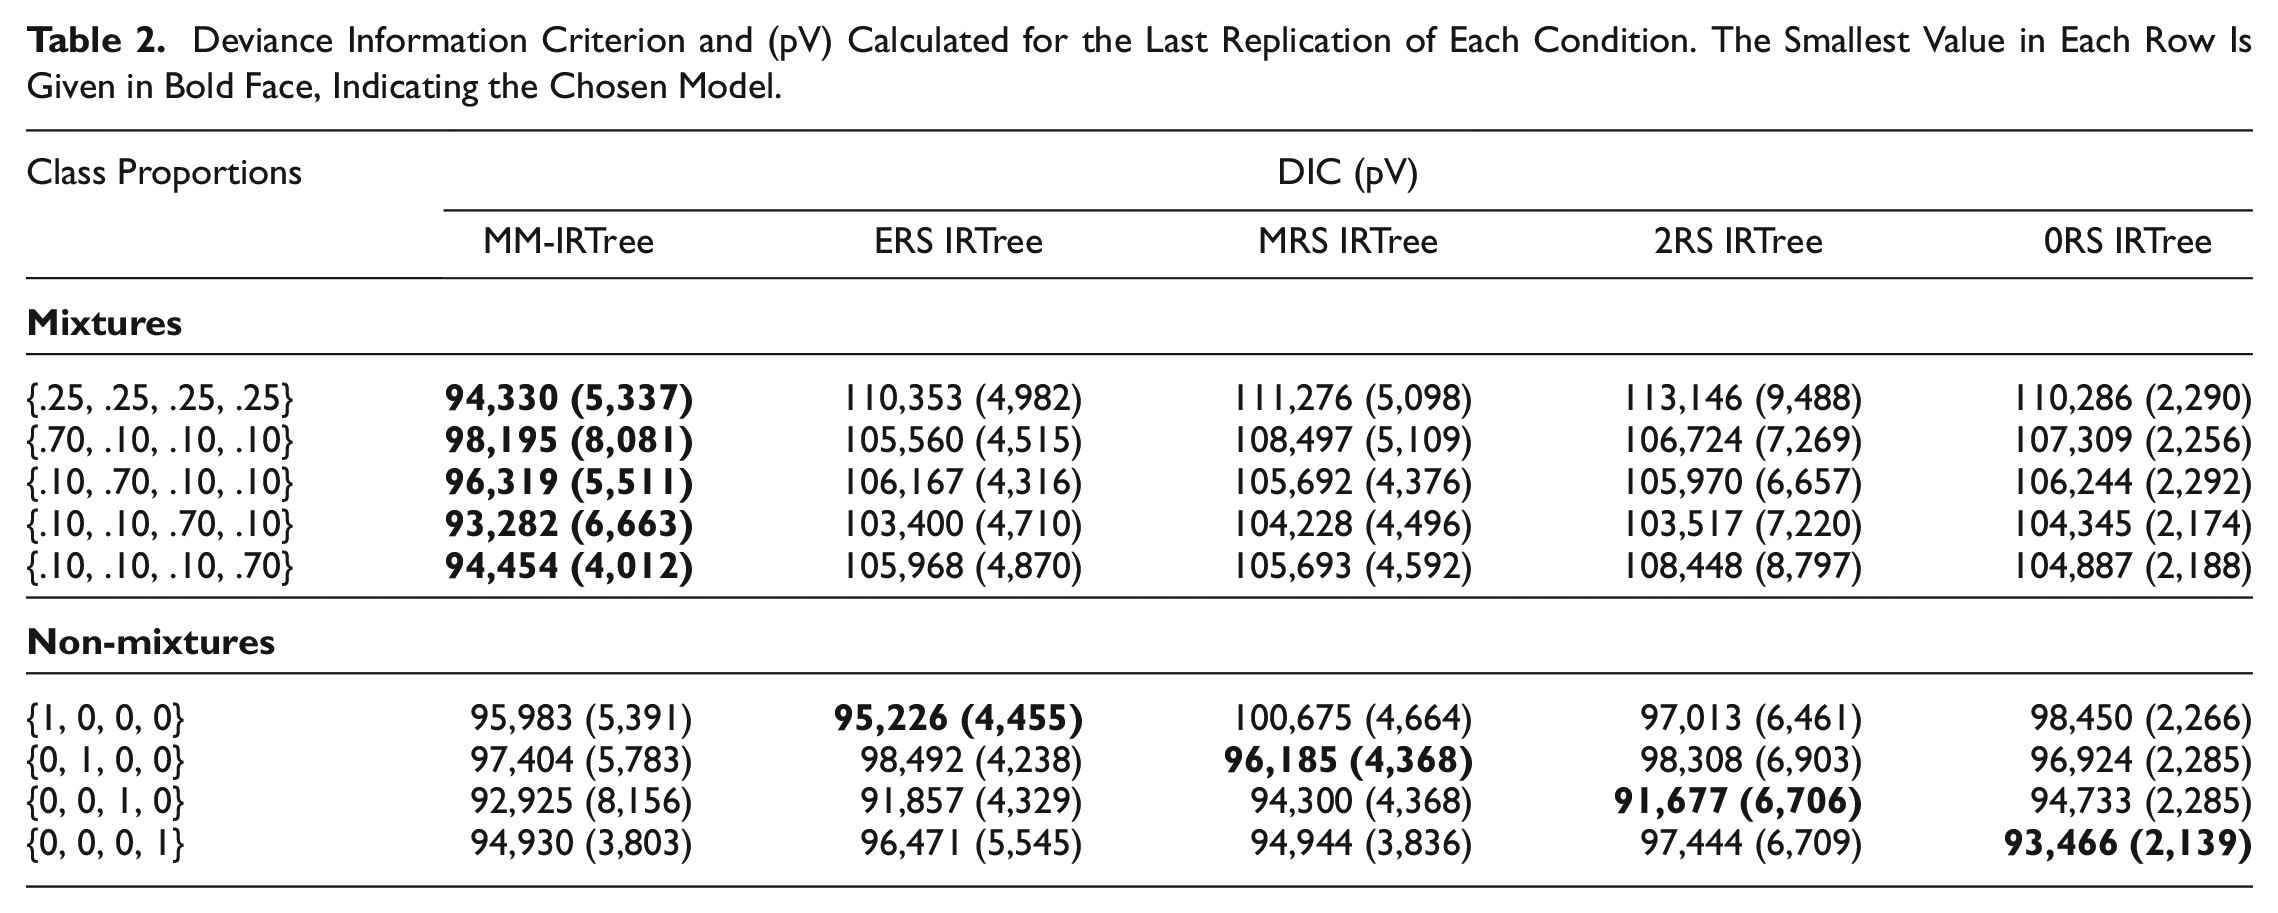
It is essential to demonstrate the accuracy of model selection for the MM-IRTree model when there exists a mixture population model underlying the data. However, due to its complexity, the MM-IRTree model may overfit and incorrectly be chosen over a simpler single-class IRTree model when the data originate from a non-mixture model. Therefore, it is crucial to verify that a single-class IRTree model is accurately selected when the population model is composed of only one class. To achieve this objective, we employed the Deviance Information Criterion (DIC). The DIC is a relative fit index that assesses the model fit while also considering the model’s complexity. There are various methods of calculating the DIC, depending on the model’s characteristics (Celeux et al., 2006; Spiegelhalter et al., 2002). Our calculation of the model fit term involves the expectation of deviance across MCMC iterations
In our simulation study, we found that across all replications of the five mixture class proportion conditions, DIC consistently selected the MM-IRTree model as the best-fitting model, and across all replications of four non-mixture conditions, DIC favored the single-class IRTree model matching with the population model (see Table 2). This highlights the utility of DIC as a reliable method for selecting the appropriate IRTree model, whether it be the MM-IRTree model for mixtures or the single-class IRTree model for non-mixture data. 10
Deviance Information Criterion and (pV) Calculated for the Last Replication of Each Condition. The Smallest Value in Each Row Is Given in Bold Face, Indicating the Chosen Model.
Recovery of Classifications
Class proportions
Our approach for assigning respondents to their classes is based on using posterior class probabilities instead of the expectation of posterior distributions. This is done through the calculation of the posterior class probability for each respondent based on their response vectors, which is then used to assign the respondent to the class for which their probability is highest. This procedure is known as modal assignment (Dias & Vermunt, 2008). The posterior class probability of a respondent is calculated as the proportion of MCMC iterations in which this respondent is assigned to a given class. Then, respondents are assigned to the class for which they have the highest posterior class probability (i.e., the mode of the posterior class membership draws).
To investigate the performance of MM-IRTree in class assignments, we calculated the proportion of respondents who are correctly assigned to their true classes (i.e., hit rate). In Figure 2, we provide the average hit rates per class averaged across the 10 replications of each condition. Overall, the MM-IRTree has very high hit rates while classifying respondents regardless of true class proportions. Hit rates were between 0.93 and 0.96 for a class proportion of 10%, 0.96 and 0.98 for 25%, and above 0.99 for 70%. Even when applied to a non-mixture population, 99.9% of respondents were assigned to their true class. Overall, MM-IRTree’s classification accuracy is very high, even for small class proportions.
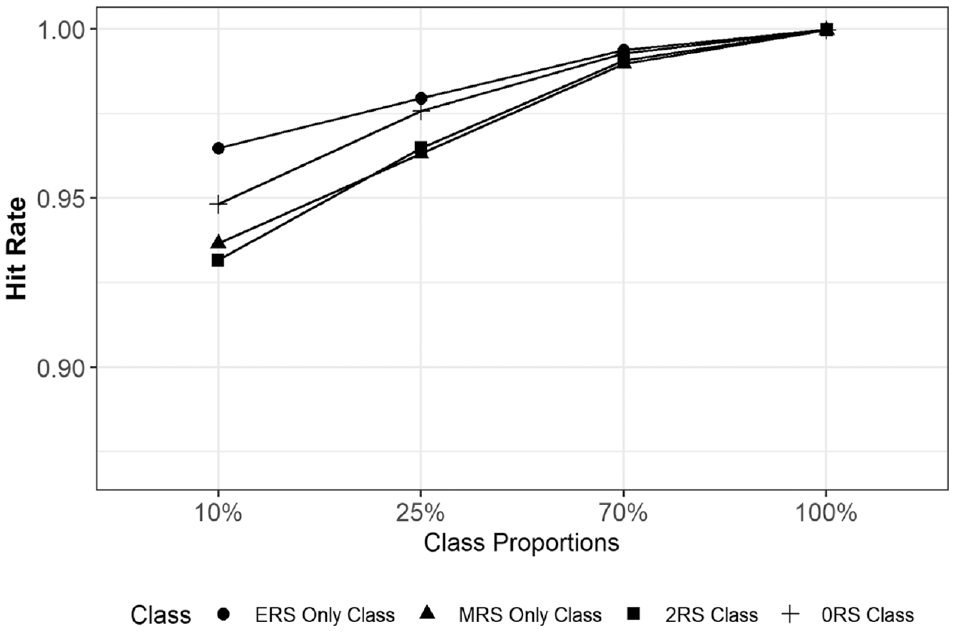
Hit Rates (Proportion of Respondents Correctly Classified Into Their True Classes) for Each Class as a Function of Class Proportions. Values Are Averaged Across Replications of a Condition.
Recovery of Item Parameters
For class-specific RS factor loadings and difficulty parameters, we compared the MM-IRTree model with the single-class IRTree models consisting of those specific RS factor loadings and difficulty parameters (see Figure 3). For
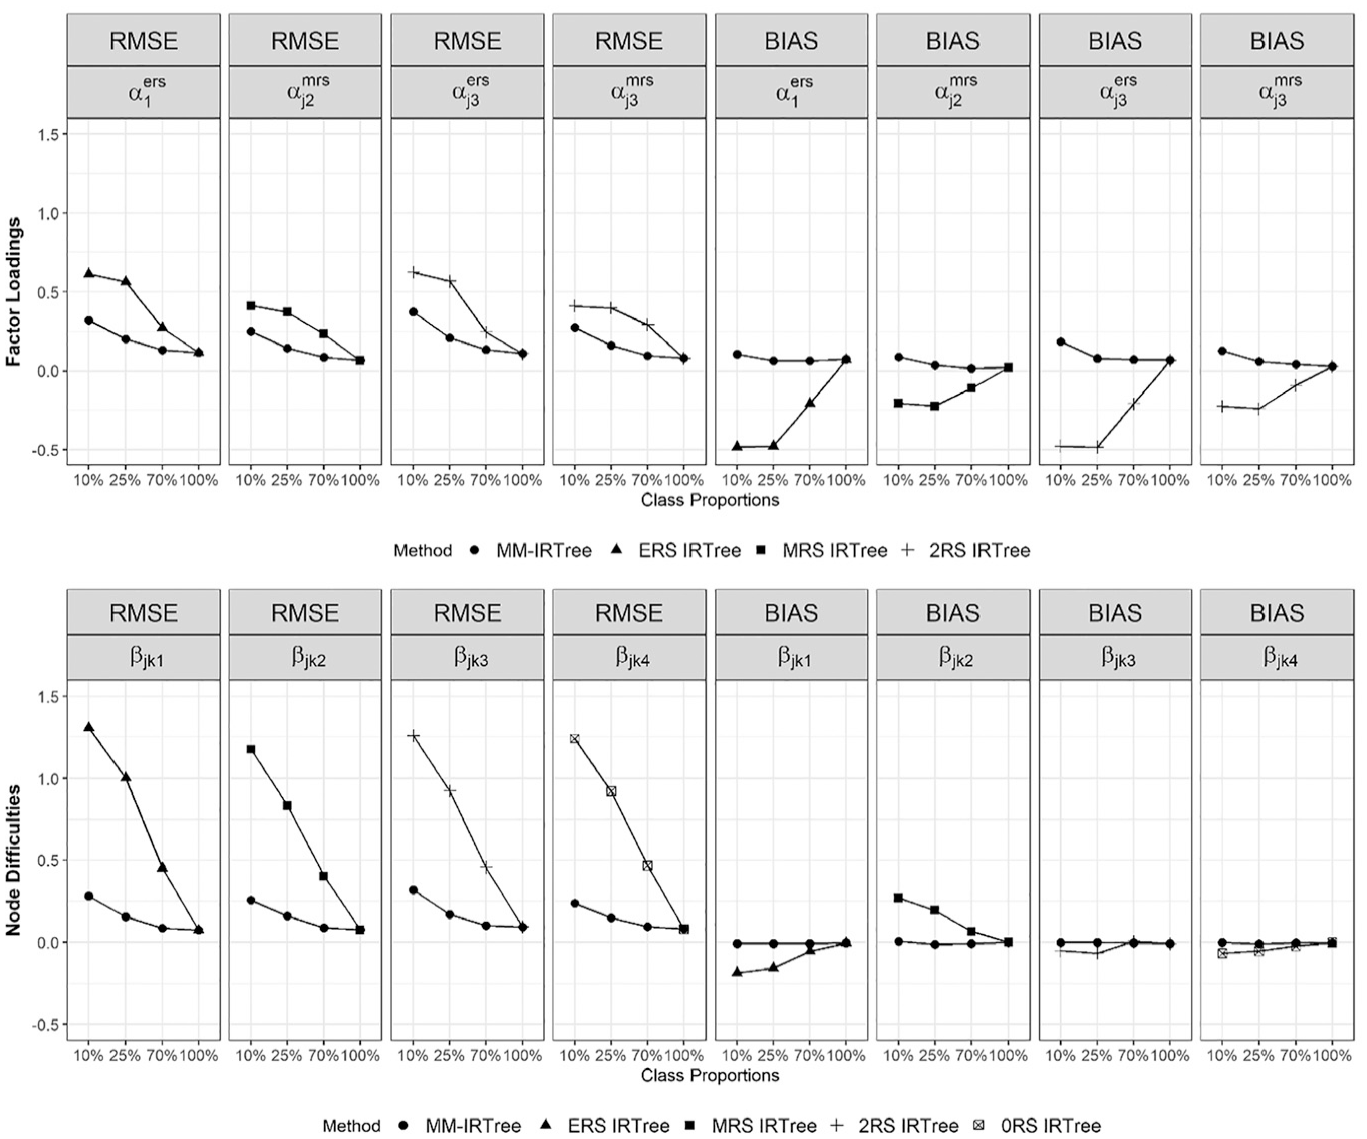
Bias and RMSE of Class-Specific Factor Loadings of Response Style Traits and Class-Specific Node Difficulties. Both Bias and RMSE are Averaged Across Replications and Items (and Nodes for Difficulties).
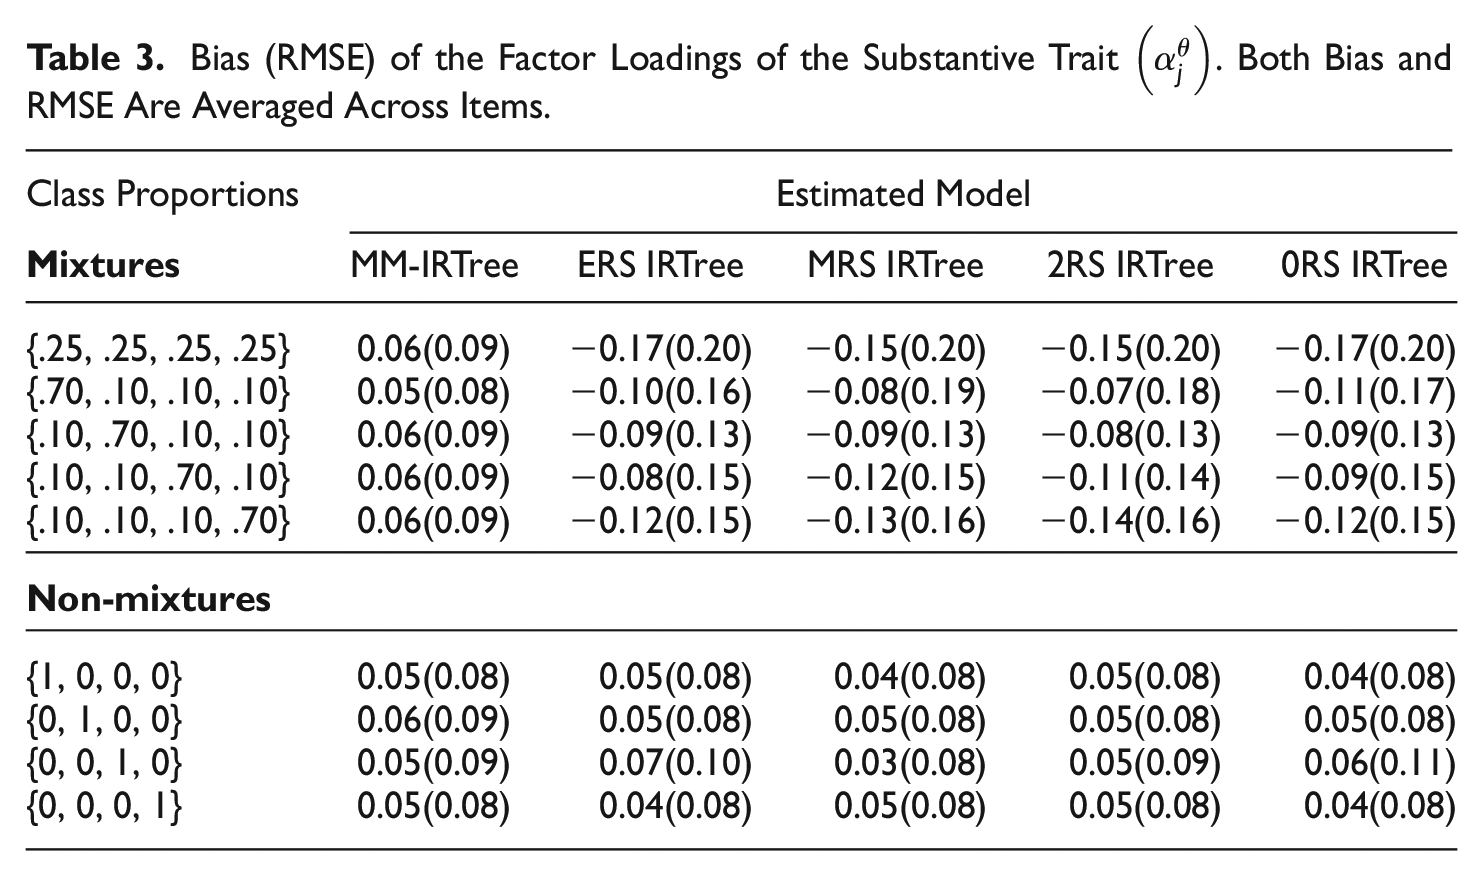
Bias (RMSE) of the Factor Loadings of the Substantive Trait
Class-Specific Factor Loadings of RS
In the presence of a mixture population, the MM-IRTree slightly overestimated class-specific factor loadings of RS traits but still yielded accurate parameter estimates as evidenced by mean bias and RMSE. In contrast, single-class IRTree models led to remarkable underestimation and inaccurate parameter estimates, which were then mitigated as the proportion of classes where RS factor loadings are freely estimated increased. However, even with the largest class proportion in the mixture condition (i.e., 70%), single-class IRTree models yielded twice as large RMSE values as the MM-IRTree model, highlighting the need for using MM-IRTree when the data come from a mixture population.
When the data were not generated from a mixture population (100% condition in Figure 3), both MM-IRTree and single-class IRTrees perform comparably and yield unbiased and accurate parameter estimates.
Class-Specific Node Difficulties
When the data came from a mixture population model, the difficulty parameters were estimated accurately and with no systematic bias by the MM-IRTree. In contrast, single-class IRTree models yielded mixed results, tending to over- or under-estimate the difficulty parameters in addition to the inaccuracy evidenced by high RMSE values. Nevertheless, even when the largest class proportion in the mixture condition was considered (i.e., 70%), single-class IRTree models produced RMSE values that were twice as high as those obtained with the MM-IRTree model, emphasizing the need for using MM-IRTree when the data originate from a mixture population.
When the data came from a non-mixture population (100% condition in Figure 3), both the MM-IRTree and single-class IRTree models performed equivalently, providing accurate and unbiased difficulty estimates.
Results from both class-specific RS factor loadings and node difficulties show that in the presence of a mixture population, it was only the MM-IRTree that yielded accurate and unbiased parameter estimates, while single-class IRTrees provided highly unreliable estimates. In the non-mixture conditions, both MM-IRTree and single-class IRTrees performed comparably.
Class-Invariant Factor Loadings of the Substantive Trait
In the mixture population conditions, the MM-IRTree model tended to slightly overestimate
For the proportionality constant
Recovery of Person Parameters
Recovery of
To illustrate the recovery of
Figure 4 presents the recovery statistics for the θ parameter in the mixture equal class proportions condition. The MM-IRTree model demonstrated minimal bias in estimating θ for parameter values between ±1 and shrunk the extreme values toward zero. In contrast, any of the single-class IRTree models produced substantially greater biases across the entire range of θ scores when applied incorrectly to a mixture of population data. 11 Similar results were observed for the RMSE values. The MM-IRTree model yielded large RMSE only for extreme negative or positive parameter values, while the single-class IRTree models produced large RMSE across the entire range of parameter values. However, in non-mixture populations, the MM-IRTree performed comparably to the single-class IRTree model that matches to the existing class in the population.
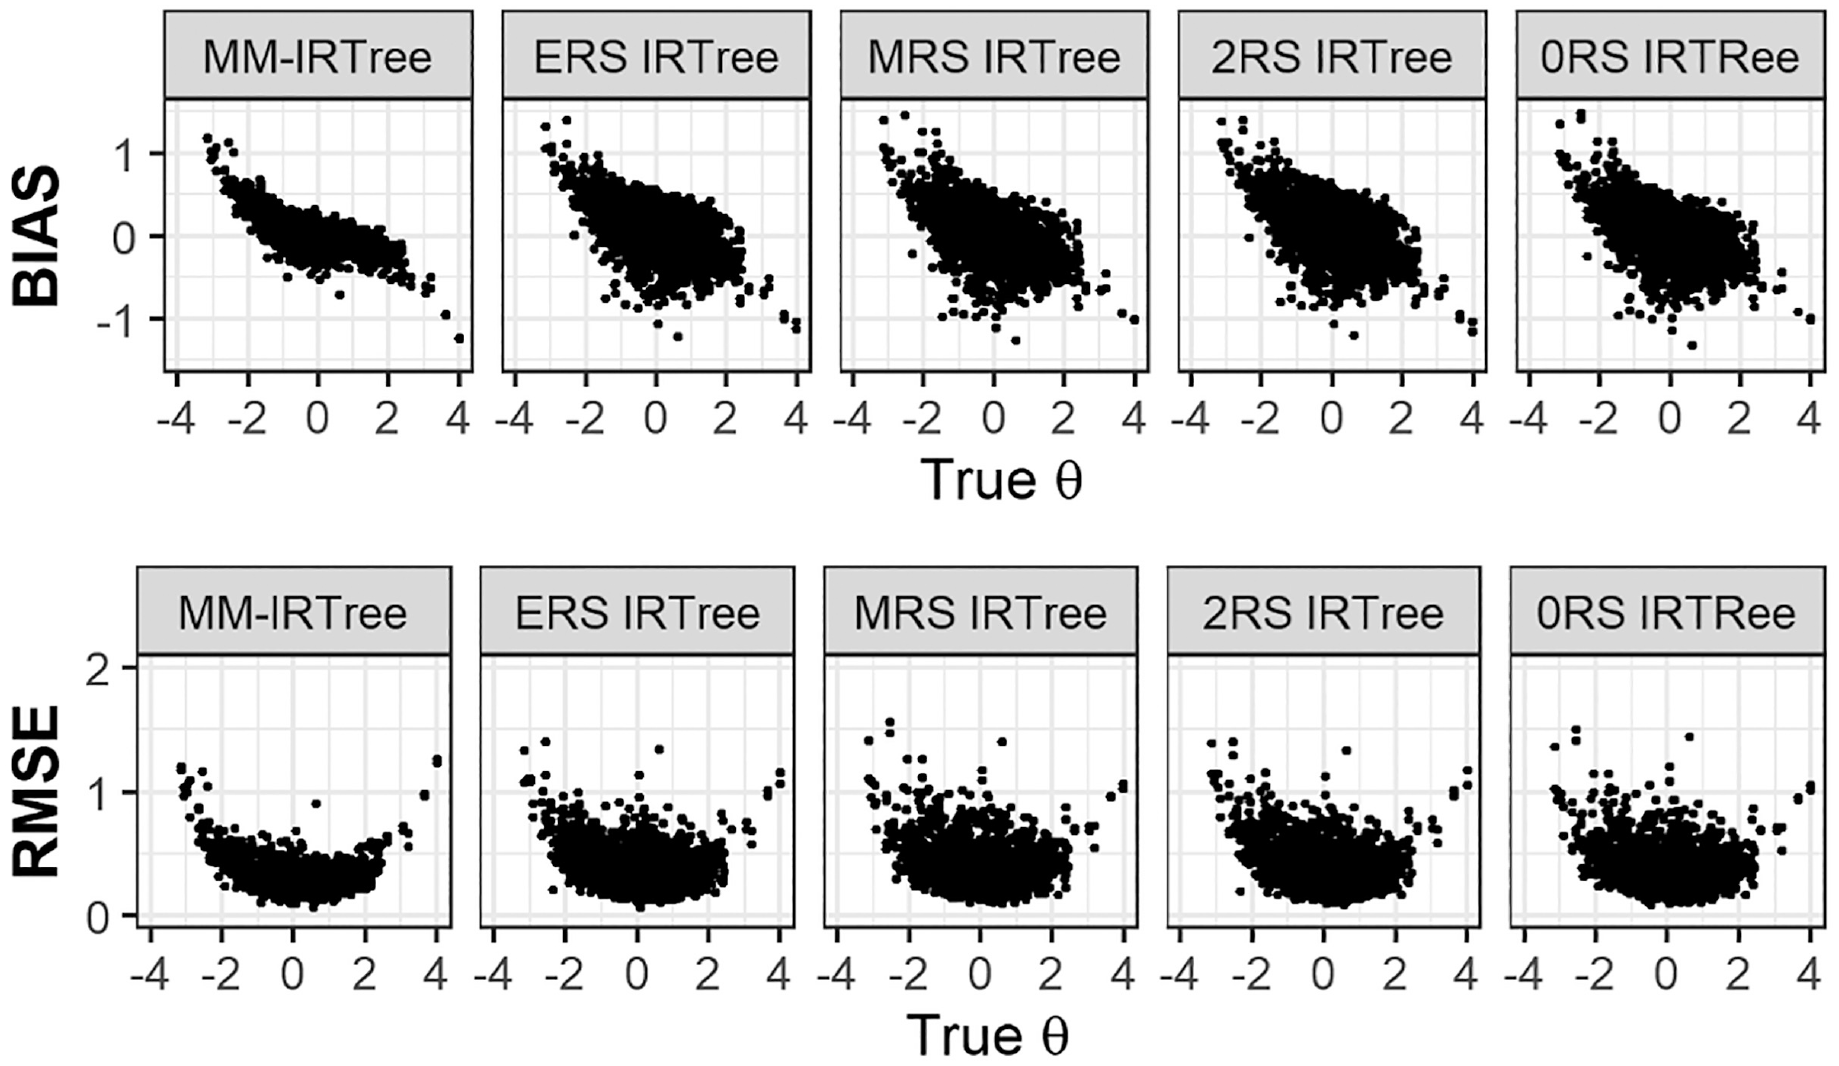
Bias and RMSE of the Substantive Trait
To provide a summary of the recovery of θ scores in other mixture conditions, we can state that the MM-IRTree model consistently outperformed other models in terms of bias and RMSE across all mixture population conditions. More specifically, the single-class IRTree model corresponding to the dominating class in the population was the closest competitor to the MM-IRTree in most conditions, but their performance was always inferior to the performance of the MM-IRTree. Interested readers can refer to the supplementary materials for more detailed figures. (Figure S6 to S13)
Recovery of
Regarding the recovery of RS traits, we present the results of the equal class proportions condition as a representative case of mixture population conditions. In Figure 5, we display the bias and RMSE of
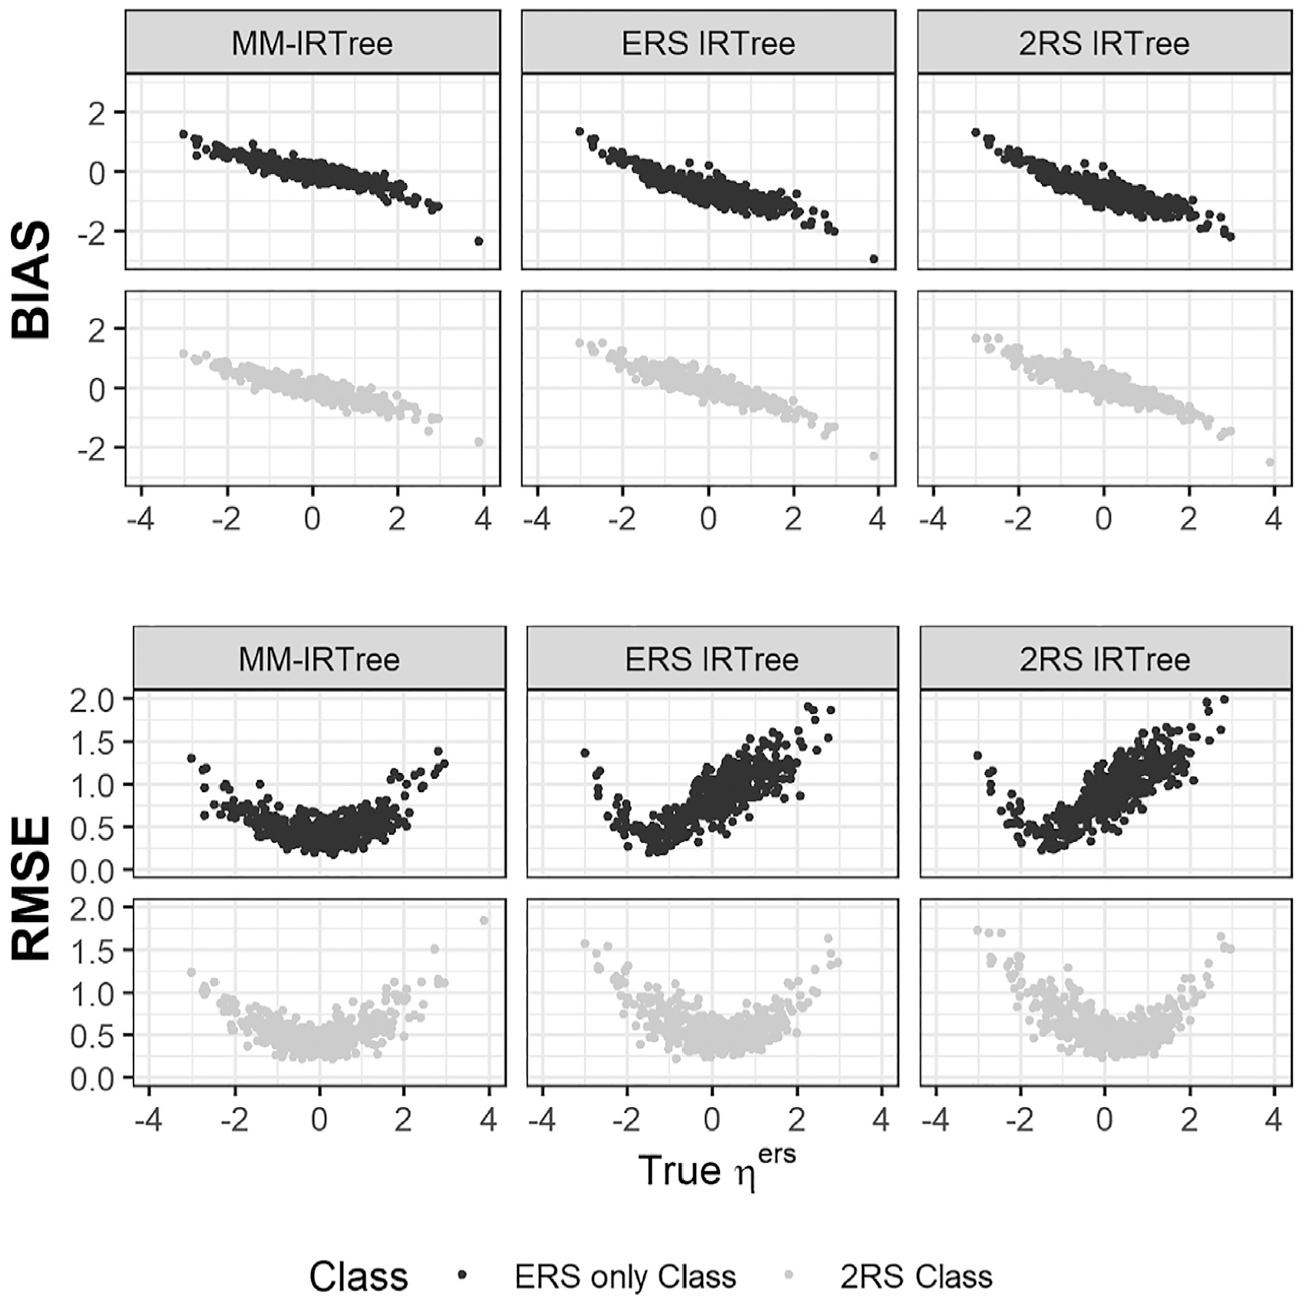
Bias and RMSE of ERS Trait Scores
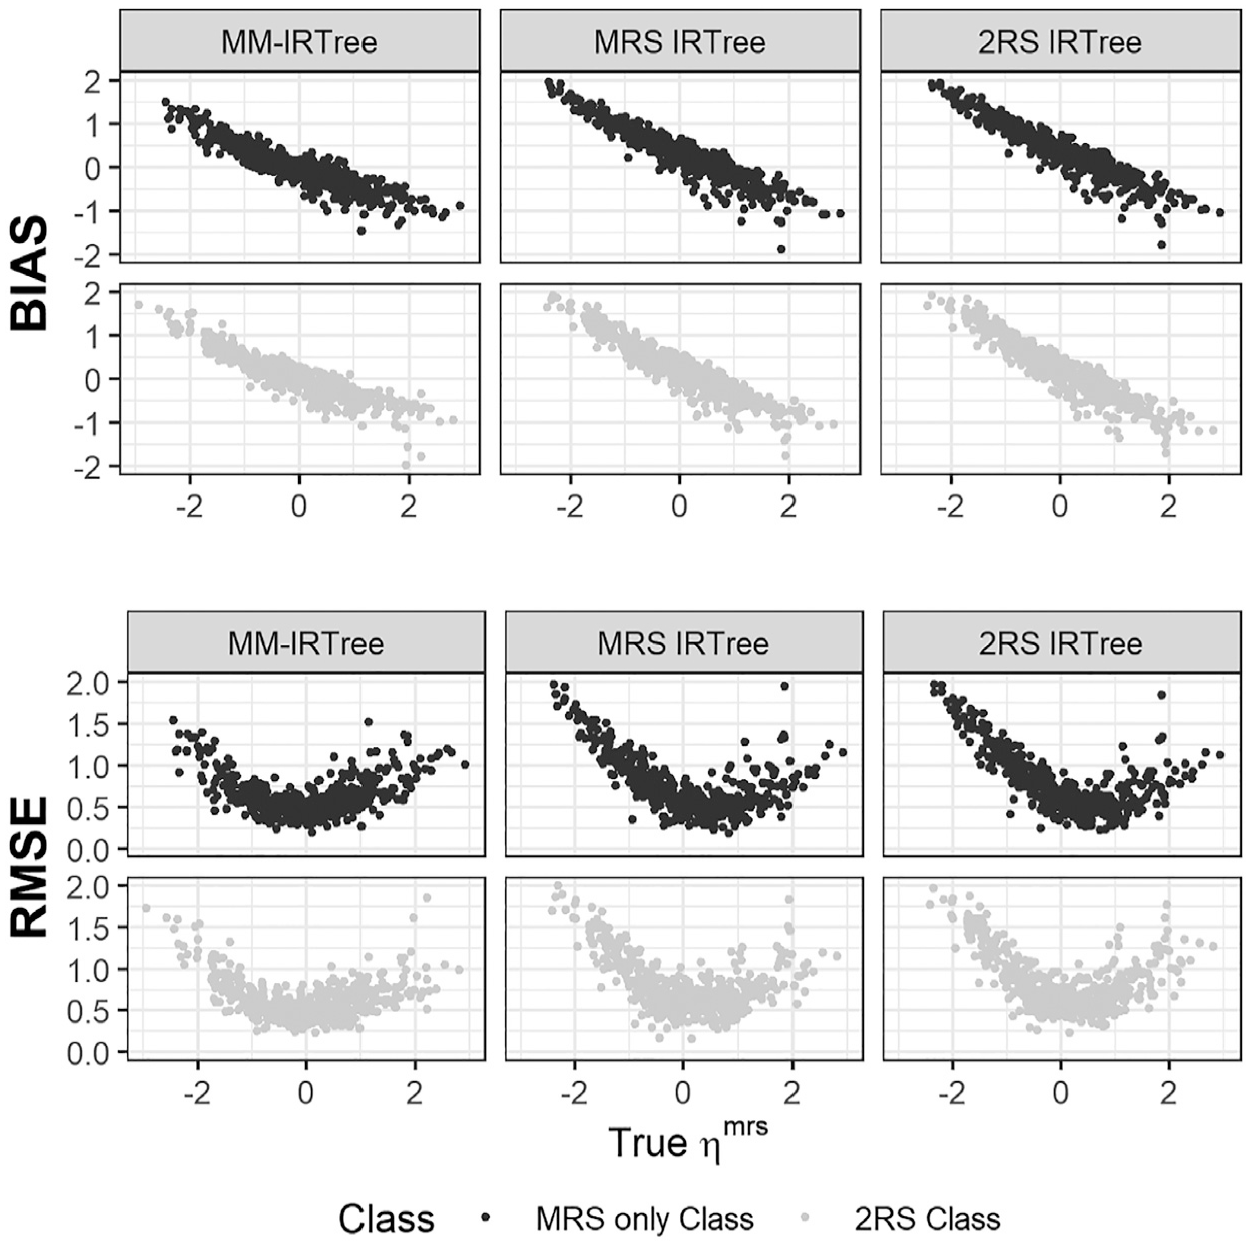
Bias and RMSE of MRS Trait Scores
An important result is that the MM-IRTree model yielded smaller bias and RMSE for the whole range of
The poor performance of single-class IRTrees are, of course, not surprising since they were obtained from the equal class proportion condition. We expect a single-class IRTree to perform better as its matching class contains a larger proportion of respondents. Indeed, a single-class IRTree model showed better recovery when its matching class has 70% of respondents. Yet, MM-IRTree still outperformed single-class models in all mixture-class proportions conditions. In non-mixture conditions, MM-IRTree and the single-class IRTree model corresponding to the population class recovered RS traits equally well (see Supplementary Materials Figure S13 and S15).
In summary, neglecting the heterogeneity in response strategies and applying traditional single-class IRTree models to a mixture of population data resulted in biased item and trait parameters. However, the MM-IRTree model, regardless of a mixture or non-mixture population model underlying the data, provided reliable parameter estimates.
Empirical Example
Data Set
In this section, we illustrate the MM-IRTree model by analyzing an empirical data set from the Experiences in Close Relationships (ECR) Scale developed by Brennan and colleagues (1998). The ECR scale measures the attachment orientations of adolescents and adults. In the original study, with 36 items, authors extracted two factors named attachment anxiety (18 items, Cronbach’s alpha = 0.94) and attachment avoidance (18 items, Cronbach’s alpha = 0.91). The first factor, attachment anxiety, is characterized by the intense fear of interpersonal rejection and distress when a partner is unresponsive. A typical question measuring this factor is, “I worry a fair amount about losing my partner.” The second factor, attachment avoidance, is defined as an intense fear of interpersonal dependence and the need for self-reliance. An example item measuring this factor is, “Just when my partner starts to get close to me, I find myself pulling away.” All items in the questionnaire are rated on a 5-point scale, where categories are labeled as “Strongly disagree,”“Disagree,”“Neither agree nor disagree,”“Agree,” and “Strongly agree.”
For our empirical illustration, we use 18 items measuring attachment anxiety. The sample size of our data set is 2,000, and respondents are sampled from a larger pool with a sample size of 51,492. For choosing this subset, we first listwise excluded the respondents with at least one missing response (N = 4,887) and then randomly sampled 2.000 respondents. The full data set can be found online at www.openpsychometrics.org/_rawdata.
For the analysis of the data set with the MM-IRTree model, we used MCMC estimation with the Gibbs sampler implemented in JAGS. We run 20 parallel MCMC chains, each with 10,000 iterations. 12 We discarded the first 5,000 iterations in each chain as the burn-in phase. We also estimated four single-class IRTree models for model selection purposes. For each single-class IRTree model, we run ten parallel MCMC chains, each with 10,000 iterations. The first 5,000 iterations in each chain are discarded as the burn-in phase. In total, we obtained 100,000 iterations for the estimation of MM-IRTree and 50,000 iterations per single-class IRTree model. The MCMC settings we used yielded Rhat values lower than 1.01 and well-mixed trace plots.
Model Selection
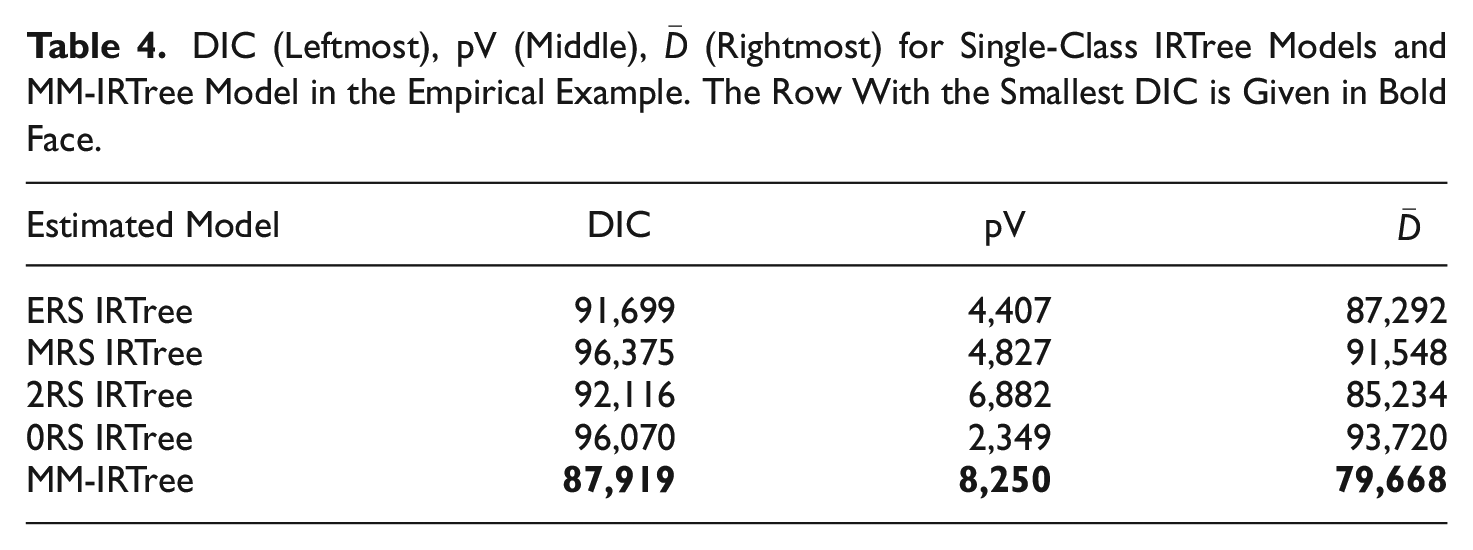
We provide DIC values obtained for each IRTree model in Table 4.
13
Accordingly, we chose the MM-IRTree model over single-class IRTree models as it has the smallest DIC value, in other words, the best balance of model fit
DIC (Leftmost), pV (Middle),
Classifications
As the next step, we examined the estimated class proportions and classifications. As is seen in Table 5, the posterior class proportions suggest that 25% of respondents used only ERS, 15% of respondents used only MRS, 48% of respondents used both ERS and MRS, and 12% of respondents used neither ERS nor MRS as part of their response strategy in addition to the substantive trait. Regarding the classifications of respondents, 501 respondents were assigned to the “ERS only” class, 291 respondents were assigned to the “MRS only” class, 973 respondents were assigned to the “2RS” class, and 235 respondents were assigned to the “0RS” class.
Estimated Class Proportions (Posterior Standard Deviations), the Number of Respondents Assigned to Each Class, and the Mean Posterior Standard Deviation of Assignments in Each Class.
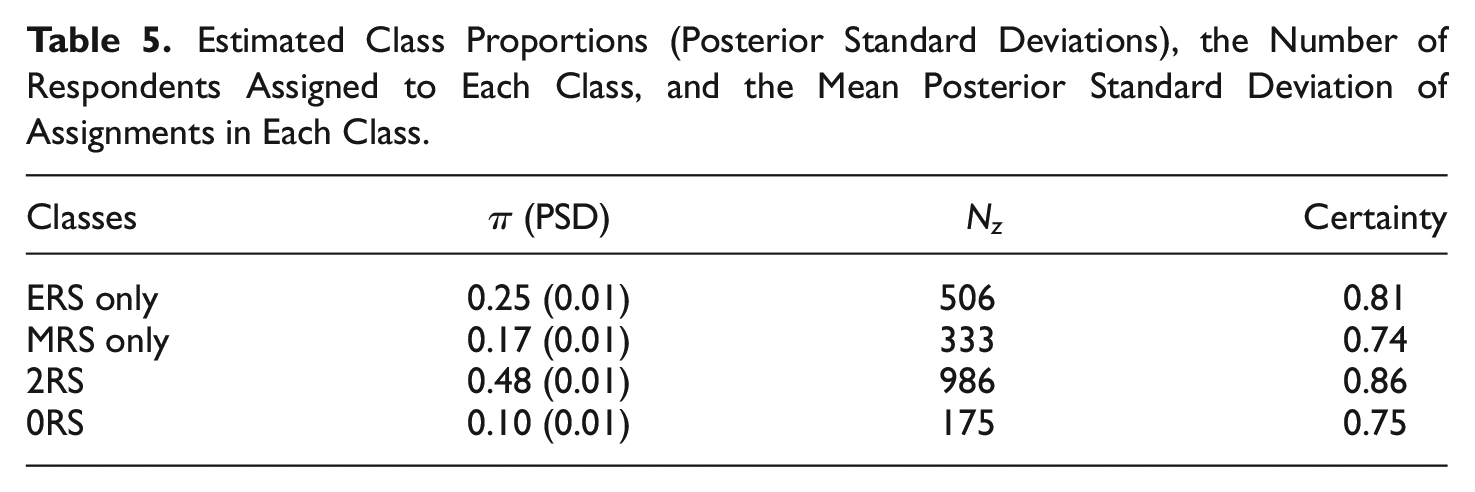
We also calculated the classification certainty, which is the average posterior class probability across the members of a class. Overall, respondents were assigned to the larger classes (“ERS only,”“2RS”) with a higher certainty than those who belong to the smaller classes (“MRS only,”“0RS”). The observed difference in certainty between larger and smaller classes can be attributed to the availability of information for each class. Specifically, larger classes have more data points and provide greater information about the characteristics of component members, which then results in better recovery of structural parameters of a class and higher distinguishability of its members from other classes.
Person Parameters
We were further interested in the extent to which the MM-IRTree and single-class IRTrees differ in the estimated substantive trait scores. Therefore, we calculated
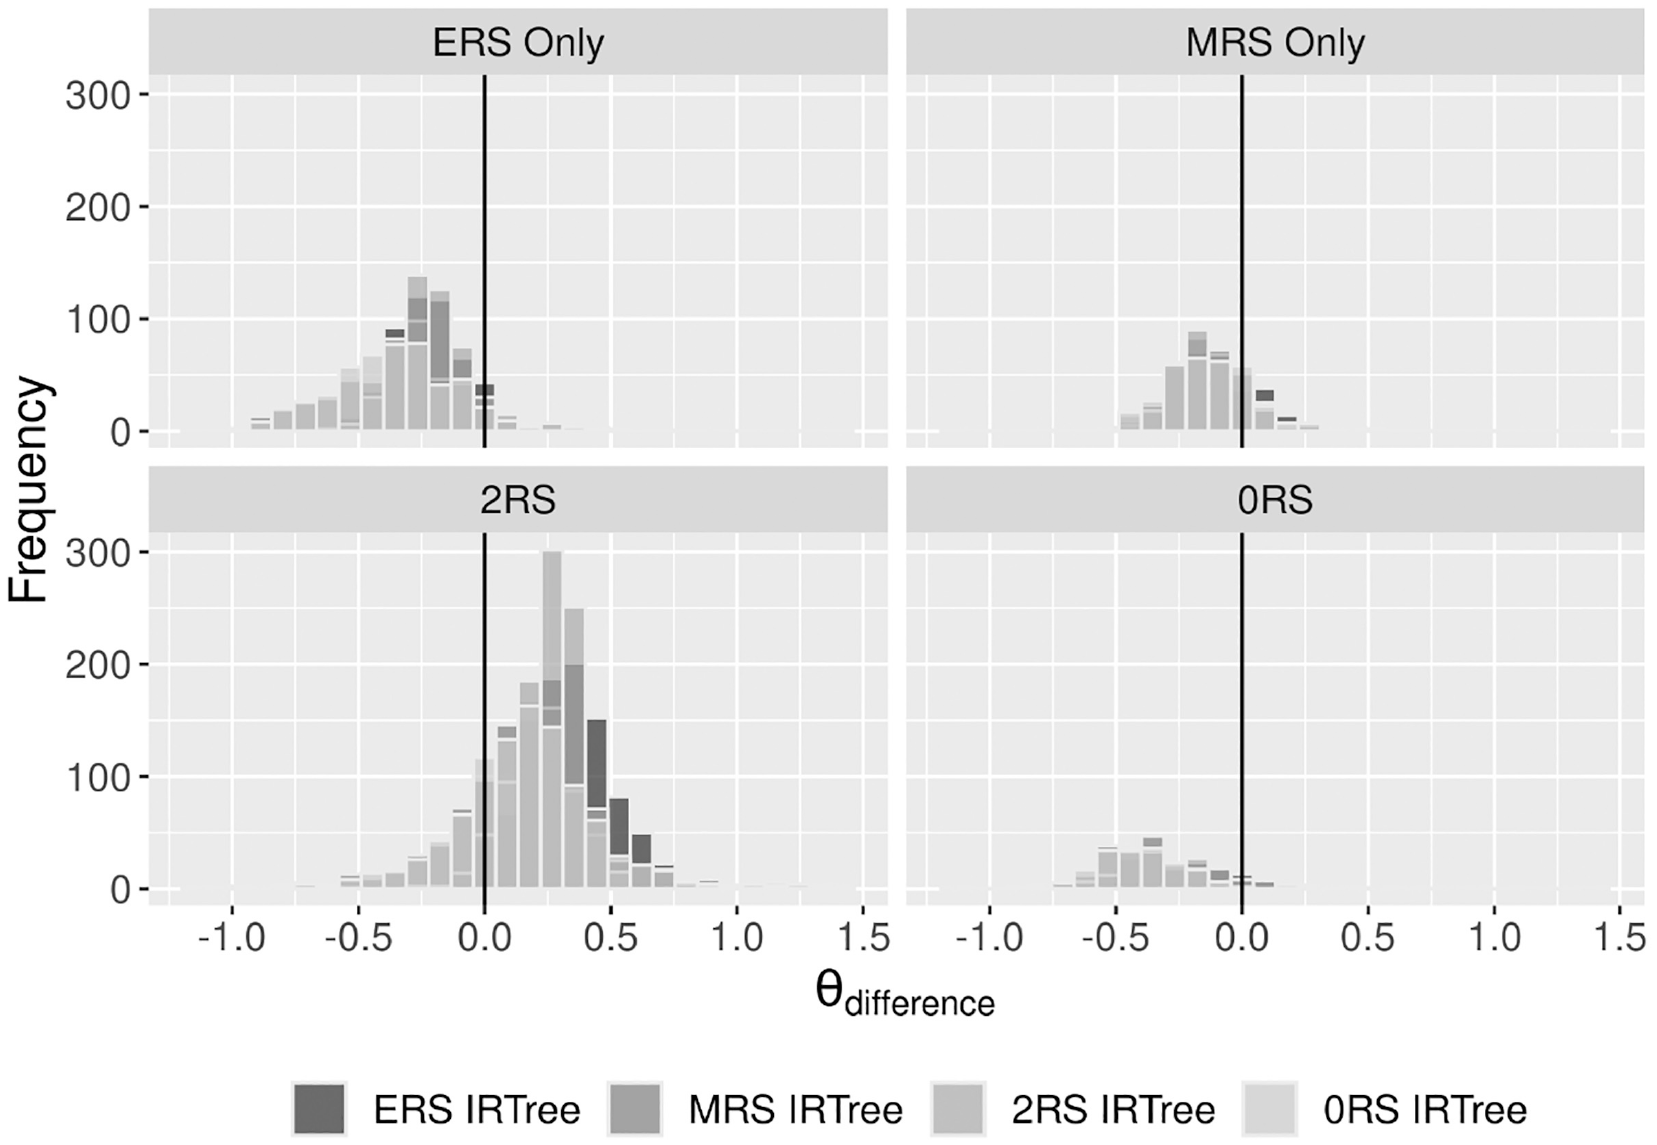
Comparison of Attachment Anxiety Scores Obtained From MM-IRTree and a Single-Class IRTree Model for Each Class. Positive
Regarding the correlations between traits, we found a positive weak correlation between attachment anxiety and ERS
Conclusion and Discussion
Respondents can use RS in their response strategies as a way of heuristic responding, and thus alleviate the cost of responding (Krosnick, 1991; Krosnick et al., 1996; Podsakoff et al., 2012). Applied or methodological studies dealing with RS usually assume that respondents use all available RS (most commonly, ERS and MRS) in their response strategy. However, respondents can exhibit both ERS and MRS when there are at least five response options. Furthermore, they might choose between ERS and MRS to incorporate them into their response strategy. They can use both ERS and MRS at once, use only one of them, and use only the substantive trait to respond. Such a decision can be determined by personality attributes, cognitive skills, education level, motivation to participate, or situational factors.
Indeed, recent studies found evidence that respondents differ in what factors play a role in their response strategies. However, these studies were limited in their scope, such that the model suggested by Kim and Bolt (2021) can only be applied to 4-point rating items and neither models MRS nor the heterogeneity regarding its use, and the model suggested by Tijmstra and colleagues (2018) can be applied to only 5-point rating items and neither models ERS nor the heterogeneity in its use. The mixture IRTree model from Khorramdel and colleagues (2019) models both RS and heterogeneity in their use, but it does not allow the substantive trait to affect middle or extreme categories along with the RS. Finally, although not a mixture model, Meiser and colleagues’ (2019) model allows both the substantive trait and RS to play in response strategies (i.e., 2RS IRTree). Nevertheless, it still assumes homogeneity of response processes and may yield biased results in a population with heterogeneous response processes (e.g., poor performance of 2RS IRTree in our simulation study).
Therefore, in this study, we proposed a mixture multidimensional IRTree model that builds on and extends earlier models. The MM-IRTree approach allows us to investigate whether there are subpopulations of respondents who use (1) only ERS, (2) only MRS, (3) both ERS and MRS, and (4) no RS while the substantive trait consistently affects judgments of disagreement versus agreement, middle and extreme categories for all respondents. The benefits that the MM-IRTree framework offers are: first, it can work with 5-point items and can be extended to any number of categories. Second, it examines the simultaneous heterogeneity in the sources of middle and extreme-category responses. Third, it offers RS-corrected substantive trait scores, which incorporate individualized corrections depending on the RS set that has affected the responses. Fourth, the trait estimates can be interpreted accurately under any scale identification constraints. Fifth, the MM-IRTree provides reliable estimates of item and person parameters for researchers interested in RS research, research on the substantive trait, or scale development. Finally, the latent classes in the MM-IRTree model represent theory-guided response processes as combinations of person parameters in terms of probabilistic component models in a mixture distribution framework. Therefore, the MM-IRTree framework can also be considered as a hypothesis testing approach that tests whether all respondents indeed follow one common cognitive process involving ERS and MRS as assumed by earlier IRT models (see “Introduction” section).
Our simulation study showed that DIC can be used for model selection since it consistently favored the MM-IRTree model in the presence of a mixture population and the correct single-class IRTree in the presence of a non-mixture population. Regarding the recovery of parameters, the MM-IRTree model recovered class proportions and class memberships almost perfectly and outperformed all single-class IRTrees in the recovery of person and item parameters in the presence of a mixture population model. When the population model was a non-mixture, then MM-IRTree and single-class IRTrees performed equivalently. In summary, the MM-IRTree model was proved to be sensitive to detect true heterogeneity in response strategies and to be superior (or comparable when there is no heterogeneity) to traditional single-class IRTree approaches in estimating latent traits and item parameters.
An empirical analysis revealed that the MM-IRTree fits the best to the ECR data set, where 48% of respondents were estimated to belong to the “2RS” class, 25% to belong to “ERS only,” 15% to belong to “MRS only,” and only 12% to belong to “0RS” classes. First, these results show that the majority of respondents (88%) use at least one type of RS in their response strategy; therefore, ignoring the response style effects at all (0RS IRTree) would be the worst route to take. However, even if we were to fit a typical IRTree model containing both ERS and MRS traits (i.e., 2RS IRTree) to correct for RS effects, we would neglect 52% of respondents who follow different response strategies and, thus, obtain biased parameter estimates.
Previous studies investigating heterogeneity in RS reported that around 30% of respondents used only the substantive trait for their responses (Kim & Bolt, 2021; Tijmstra et al., 2018). A direct comparison of class proportions between different studies is not appropriate as these studies involve different populations and tests. However, we can still argue that the counterpart of “0RS” class in the earlier models may absorb respondents from the unmodelled classes and overreport the proportion who do not use any RS. Yet, a common conclusion from the current and earlier studies is that ignoring heterogeneity in response strategies has negative consequences for our inferences about the substantive trait.
We are also aware that our study has some limitations. Our simulation design is limited to one sample size (2,000) and one test length (20) condition. It would be interesting to see if the MM-IRTree performs adequately with a smaller sample size and fewer items, but given the complexity of the mixture model, we recommend using sufficiently large samples and item sets. Because the MM-IRTree performed well with 2,000 observations and 20 items, we are confident that it also works fine with larger designs.
Another limitation is that we have only nine class proportions conditions. We could have investigated even more specific cases, for example, where two out of four classes were empty and other two classes each had 50% of respondents. However, given that the MM-IRTree recovered class proportions with almost no bias in all present conditions, we are confident that it performs well with different class proportions that were not included in our study.
The last limitation to mention is that we have only ten replications per condition. The reason for keeping the number of replications small is the duration of estimation of our models. That is, even with a powerful computer, one replication that includes the estimation of the MM-IRTree model and four single-class IRTrees plus post-processing of results took around 10 hours. The computation time itself may be a limiting factor for applied fields at present, but with the increasing accessibility of high-speed computers, this limitation will diminish in the future.
In addition to accounting for our limitations, future research can further investigate the heterogeneity in response strategies in several ways. First, it would be interesting to examine predictors of class memberships. If researchers can show that class memberships are predicted by some personality attributes or cognitive skills, we can better understand the grounds of individual differences in RS compared to some existing correlational studies.
Second, future research can investigate the consistency of response strategies over time and item content. Earlier studies showed that the response strategies that people use dynamically change throughout the questionnaire (Merhof & Meiser, 2023) and across different psychological constructs (Wetzel et al., 2013). It would be interesting to investigate with the MM-IRTree whether respondents differ in their response strategies across constructs (with a second-level latent class analysis as in Wetzel et al., 2013) or over time (with an item-level mixture model as in Plieninger & Heck, 2018; Tijmstra et al., in press).
Finally, we used respondents who have a complete response vector. However, it is possible that some classes have different tendencies to skip items. For instance, the “2RS” class might be more inclined to skip items and alleviate the cognitive burden to the extent that they have stronger heuristic tendencies (i.e., satisficing, Krosnick, 1991). This would create a missing not-at-random mechanism in full-information maximum likelihood estimation (i.e., one-step estimation) or its Bayesian equivalents, resulting in biased parameter estimates (Alagöz & Vermunt, 2022). Therefore, further research can investigate whether the tendency to provide missing responses can be explained by class memberships.
In conclusion, our simulation study and empirical analysis showed that the MM-IRTree model is a valuable extension of psychometric toolbox to analyze sources of heterogeneity in response processes and to adjust trait measurements for biasing RS effects after taking the heterogeneity into account. The MM-IRTree model’s capabilities and benefits open new avenues for research and have the potential to contribute to a wide range of disciplines and applications in the social sciences.
Supplemental Material
sj-docx-1-epm-10.1177_00131644231206765 – Supplemental material for Investigating Heterogeneity in Response Strategies: A Mixture Multidimensional IRTree Approach
Supplemental material, sj-docx-1-epm-10.1177_00131644231206765 for Investigating Heterogeneity in Response Strategies: A Mixture Multidimensional IRTree Approach by Ö. Emre C. Alagöz and Thorsten Meiser in Educational and Psychological Measurement
Footnotes
Declaration of Conflicting Interests
The authors declared no potential conflicts of interest with respect to the research, authorship, and/or publication of this article.
Funding
The authors disclosed receipt of the following financial support for the research, authorship, and/or publication of this article: This research was funded by the Deutsche Forschungsgemeinschaft (DFG) grant 2277, Research Training Group Statistical Modeling in Psychology (SMiP). The author acknowledges support by the state of Baden–Württemberg through bwHPC.
Notes
References
Supplementary Material
Please find the following supplemental material available below.
For Open Access articles published under a Creative Commons License, all supplemental material carries the same license as the article it is associated with.
For non-Open Access articles published, all supplemental material carries a non-exclusive license, and permission requests for re-use of supplemental material or any part of supplemental material shall be sent directly to the copyright owner as specified in the copyright notice associated with the article.