
Abstract
Words read correctly per minute (WCPM) is the reporting score metric in oral reading fluency (ORF) assessments, which is popularly utilized as part of curriculum-based measurements to screen at-risk readers and to monitor progress of students who receive interventions. Just like other types of assessments with multiple forms, equating would be necessary when WCPM scores are obtained from multiple ORF passages to be compared both between and within students. This article proposes a model-based approach for equating WCPM scores. A simulation study was conducted to evaluate the performance of the model-based equating approach along with some observed-score equating methods with external anchor test design.
Keywords
Oral reading fluency (ORF) has been regarded as an important indicator of overall reading competency and assessed frequently as part of curriculum-based measurements to screen at-risk readers and to monitor progress of students who receive interventions. In a typical administration of ORF assessment, a student is given a grade-level text to read, and the number of words read correctly per minute (WCPM) is computed based on the observed number of correctly read words and the observed reading time. WCPM scores have been the most commonly used measure in ORF assessments in classrooms, as well as in national-level assessments (e.g., White et al., 2021). Previous research provided empirical evidence on the predictive and concurrent validity of WCPM scores (e.g., Fuchs et al., 2001; Hasbrouck & Tindal, 2006). Despite their prevalent use and practical applications, observed WCPM scores have considerable psychometric limitations such as inaccurate standard errors (Christ & Silberglitt, 2007; Nese et al., 2013) and dependence to specific passages read by students (Betts et al., 2009; Francis et al., 2008), which potentially reduces the reliability and validity of reported scores.
Passage dependence of the observed WCPM scores points to the variability in passage difficulties in ORF assessments. In other words, a student may have different WCPM scores by reading an easy or hard passage at the same grade level. In a similar vein, two students with the same level of ORF ability may yield different WCPM scores due to reading passages that have different difficulty levels. Also referred to as “passage effects” (Cummings et al., 2013), this variability in passage difficulties may produce a considerable amount of systematic error, as much as 10% (around 22 WCPM; Chaparro et al., 2018). Such a large magnitude of error in ORF scores can be crucial, especially for students who are identified to be at risk of poor reading outcomes. Moreover, it would be difficult to distinguish the change of ORF scores due to true student growth versus passage dissimilarity, which would jeopardize the validity of longitudinal ORF assessments (Albano et al., 2018; Albano & Rodriguez, 2012). Thus, test developers of ORF assessments need to correct for varying passage difficulties with appropriate methods for more precise measurement of ORF.
Commonly accepted practices for handling passage effects include evaluating passage difficulties through readability indices (e.g., Flesch–Kincaid) and increasing the number of passages read by the student at each session. However, these strategies can generally be insufficient for establishing passage equivalence (Betts et al., 2009; Cummings et al., 2013; Francis et al., 2008; Stoolmiller et al., 2013). For example, the same passage may yield a different readability index score based on a specific index used, which creates another complexity in handling passage effects in ORF assessments through readability indices (Good & Kaminski, 2002; Yi, 2021). Also, Albano and Rodriguez (2012) highlighted the difficulty of obtaining parallel passages based on such readability indices.
As a more comprehensive approach to account for passage effects, test score equating procedures have been used by some researchers and practitioners. The main motivation for equating is to ensure that WCPM scores from different passages can be used interchangeably. In addition to a horizontal equating of WCPM scores that aims to account for within-grade passage effects, a vertical equating across grade levels is thought to be an important effort, especially for monitoring progress of young readers over multiple years. Referred to as observed-score equating methods in psychometric literature, researchers mostly have adapted mean, linear, and equipercentile equating methods (Albano & Rodriguez, 2012; Santi et al., 2016; Stoolmiller et al., 2013) to equate observed WCPM scores across passages. These observed-score equating procedures are sample-specific. Therefore, unless one has a population-representative equating sample, the results of equating would not be generalizable to other samples. This will make the use of observed-score equating procedures difficult to justify for the purpose of a pre-equating.
On the contrary, a model-based approach to ORF assessment data has a potential to overcome these shortcomings. An estimation approach of model-based WCPM scores has recently been introduced by Kara et al. (2020) based on a latent-variable psychometric model for ORF assessment data (Potgieter et al., 2017) as part of an effort to develop an improved computer-based ORF assessment system (Nese & Kamata, 2014–2018). Model-based WCPM scores are in the form of expected WCPM values estimated with the latent-variable model that incorporates person and passage parameters. Please note that we explicitly distinguish the traditional WCPM scores from the model-based WCPM scores by referring the former to as observed WCPM scores in this article.
Strengths of the model-based WCPM scores such as higher reliability and availability of conditional measurement errors have been demonstrated by Nese and Kamata (2021). In addition to having better psychometric characteristics, the model-based WCPM scores can eliminate the need for post-equating. More specifically, the equating procedure by the model-based approach allows one to develop a pool of passages where all passage parameters are calibrated into the same scale by the common-item nonequivalent group (NEG) design. Similar to item response theory (IRT) approach for equating test scores, an equated passage pool allows one to estimate student-level speed and accuracy latent factor scores comparable to each other, no matter which set of passages the student read. As a result, it will be also possible to place the model-based WCPM scores on a common scale.
This study aims to introduce a model-based approach to equate WCPM scores based on Kara et al. (2020) and to provide a numerical demonstration with simulated data. In the numerical demonstrations, we designed a simulation study to compare performance of the proposed model-based approach with traditional observed-score equating methods. The structure of the article is as follows. We first describe the procedures of the proposed model-based approach for equating WCPM scores, including a brief presentation of the model-based WCPM score estimation. Next, we briefly provide information about two observed-score equating methods, namely, linear and equipercentile equating. In the following sections, we describe the details of the simulation study, present the results, and conclude with a discussion section.
Equating WCPM Scores
Model-Based Estimation of WCPM Scores
Estimation of the model-based WCPM scores has recently been introduced by Kara et al. (2020) based on a latent-variable psychometric model with speed and accuracy components (Potgieter et al., 2017). Note that this model-based approach is different from the latent-variable approach demonstrated in Stoolmiller et al. (2013) and Santi et al. (2016), which use observed WCPM scores as the observed indicators of the latent ORF ability in a confirmatory factor model. These factor models can be considered as congeneric models in the classical test theory, which is essentially a model for weighted summed observed scores. Rather, the model for current approach was developed as a joint factor model of speed and accuracy, which is a modification of the hierarchical speed and accuracy model (van der Linden, 2007). In this model, passage-level observed reading times and the number of correctly read words are used as the observed indicators of two separate latent factors, namely, one latent factor for speed and another latent factor for accuracy.
The speed component of the model uses the same log-normal factor model as in van der Linden (2007). Thus, the natural logarithm of
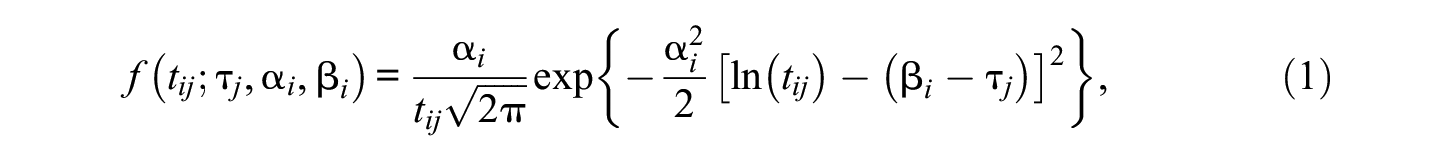
where
Accuracy component of the model uses a binomial-count factor model. The number of the words read correctly in passage i (out of

where
Similar to true scores estimated based on an IRT model, a model-based WCPM score for person j

where

in which

where
Note that
Proposed Equating Method for Model-Based WCPM Scores
Being a latent-variable psychometric model, the measurement model for ORF assessment data by Potgieter et al. (2017) has the same advantages of traditional IRT models in equating studies. In our application of the latent-variable ORF model, passages are analogous to items. As indicated by Kolen and Brennan (2004), IRT models’ strengths stem from modeling response data at the item-level unlike the classical test theory, which focuses on test-level data (i.e., observed total scores). For the ORF latent-variable model, time intensity and difficulty parameters, as well as two types of discrimination parameters for each passage, are estimated from the time and accuracy components of the model. At the person level, speed and accuracy ability parameters are estimated first. Then, a model-based WCPM score is ultimately estimated as a measure of the ORF ability. We propose a four-step approach to produce equated model-based WCPM scores as follows.
In Step 1, the passage parameters are estimated and equated (i.e., calibrated on the same scale) as demonstrated in Equations 1 and 2. In the current study, we performed a concurrent calibration under an NEG common-passage design, where all passage parameters from the combined data were concurrently estimated by treating missing observations from unassigned passages as missing data. As a result, this step would establish a pool of passages with passage parameters calibrated on the same scale.
In Step 2, data from students are collected by using selected passages from Step 1. Then, the accuracy parameter θ and the speed parameter τ are estimated as shown in Equations 1 and 2, assuming the passage parameters are known based on the performed calibration in Step 1. Also, variance of τ and the covariance between τ and θ that estimated from Step 1 are treated as known parameter values in this step. As the model parameters for passages are already equated in Step 1, the estimated θ and τ are comparable between students, as well as within students across multiple testing occasions, regardless of what set of passages they read from the equated passage pool.
In Step 3, a set of passages is selected from the calibrated passage pool (created in Step 1) for the purpose of computing the model-based WCPM scores. We call this set of selected passages as the reference passages. The reference passages can be passages other than the student read to estimate
In Step 4, equated model-based WCPM scores are derived from the estimated θ, τ, and the passage parameters of the reference passages (see f in Equation 3). Equated model-based WCPM scores would be obtained as a result of equated
Equating Observed WCPM Scores With Traditional Methods
Equating observed WCPM scores from different passages has been mostly done by the mean, linear, and equipercentile equating methods (e.g., Albano & Rodriguez, 2012; Santi et al., 2016; Stoolmiller et al., 2013). This study focused on linear and equipercentile equating methods to be compared with the model-based approach.
When applying the observed-score equating methods, appropriate equating designs are necessary to control the confounding effects from differences between groups who take two test forms, X and Y, on the difficulty estimates of the two test forms. The equivalent group (EG) design assumes the groups are sampled from the same target population T. Thus, the groups are considered to be randomly equivalent. This design assumes no confounding effects from nonequivalency of the two groups. On the contrary, the NEG design assumes the two groups are sampled from two different populations, P and Q. Therefore, the confounding effects due to differences between the groups should be controlled statistically, which is usually achieved by the nonequivalent group with anchor test (NEAT) design. Specifically, an anchor test V is taken by both groups and the scores from V are used to control the differences between groups.
In the context of ORF assessments, the “groups” refer to samples of students that read different sets of passages, which are analogous to “test forms.” Also, the “anchor test” is analogous to a set of common passages that are read by both groups of students. Below, we provide brief descriptions of the linear and equipercentile equating methods. Readers are referred to Santi et al. (2016) for a more detailed information about these methods as well as their application to observed WCPM score equating.
Linear Equating
Linear equating is essentially a linear conversion that sets the standardized deviation scores to be equal for the two forms. Let

For linear equating with the NEG design, the formula for the linear conversion becomes

where s indicates the synthetic population.
Equipercentile Equating
Equipercentile equating maps scores on Form X that have the same percentile ranks to scores on Form Y. For the EG design, Braun and Holland (1982) indicated that the equipercentile equating function is
Simulation Study
A simulation study was conducted to evaluate the performance of the model-based equating method in comparison with the observed-score linear and equipercentile equating methods for equating WCPM scores.
Equating Data Collection Design
The current study assumed the NEAT design (Kolen & Brennan, 2004) for observed and model-based score equating. Each group was assumed to read a unique set of passages and a set of common passages, which were used to estimate passage parameters by linking two groups. Common passages were treated as external anchors. In other words, they were not part of the WCPM score estimations. In addition, observed-score equating methods that assumed the EG condition were included to evaluate the impact of the violation of the group equivalence assumption.
Under the NEAT design, Tucker’s linear method and the frequency estimation equipercentile method were used to estimate the synthetic population parameters in the equating functions. The two methods differ in terms of their statistical assumptions and complexity. Tucker’s linear method is simpler and is expected to perform better with small sample sizes, while frequency estimation equipercentile requires large sample sizes to yield accurate parameter estimates.
Simulation Conditions
We assumed two groups of students, where one group read a set of six easy passages (referred to as Group E, hereafter) and the other group read a set of six hard passages (referred to as Group H, hereafter) based on the time intensity and accuracy difficulty parameters. In addition to group-specific passage sets, Group E and Group H were also assumed to have read a set of common passage(s) with medium time intensity and difficulty levels. Common passage(s) were treated as external anchors, namely, they were not part of the ORF scoring. Three manipulated factors in the simulation study were (a) the sample size per group (100, 300, or 500), (b) the number of anchor passages (1 or 3), and (c) population ORF ability discrepancy controlled by speed and accuracy parameters (no discrepancy, small or large). Note that the condition with no population ORF ability discrepancy is the condition where the EG assumption holds (i.e., random equivalence). By crossing all three factors, 18 total conditions were identified for data generations.
These simulation factors were selected due to their relevance to anticipated equating methods performance (model-based and/or observed-score methods). We also aimed to identify realistic conditions to draw more generalizable conclusions. Specifically, the chosen levels of the sample size reflect small to large sample sizes in ORF assessments reported in empirical studies (e.g., Nese et al., 2015). In addition, equipercentile equating is known to require larger samples for more accurate ORF score equating (e.g., Santi et al., 2016). The number of anchor passages is expected to affect the performance of the observed-score and model-based equating methods with the NEAT design. Population discrepancy is expected to affect the estimation accuracy of the observed-score equating methods with the EG design. It may also affect the performance of the model-based and observed-score equating methods with the NEAT design.
Data Generation
True passage parameters were selected from a calibrated passage pool as part of a previously conducted study (Potgieter et al., 2017). ORF data were collected for 150 passages, where approximately 150 students read each passage on average. The selection of the easy and hard passage sets was performed by the inspection of time intensity and difficulty parameters of the calibrated passages. After excluding some outlier values, easy passages were identified from the calibrated passage pool which had difficulty and time intensity parameters close to the lowest values. Similarly, hard passages were ones which had calibrated parameter values close to the highest values in the passage pool. Common passages were also selected from the pool with medium-level difficulty and intensity parameters. Also, during the passage selection, we prioritized passages with close to 50 words to control a possible impact of different passage lengths. The average difference between easy and hard passage sets were .651 and .180 for difficulty and time intensity parameters, respectively. Actual passage parameters and the number of the words for all passages are provided in Table 1.
True Passage Parameter Values
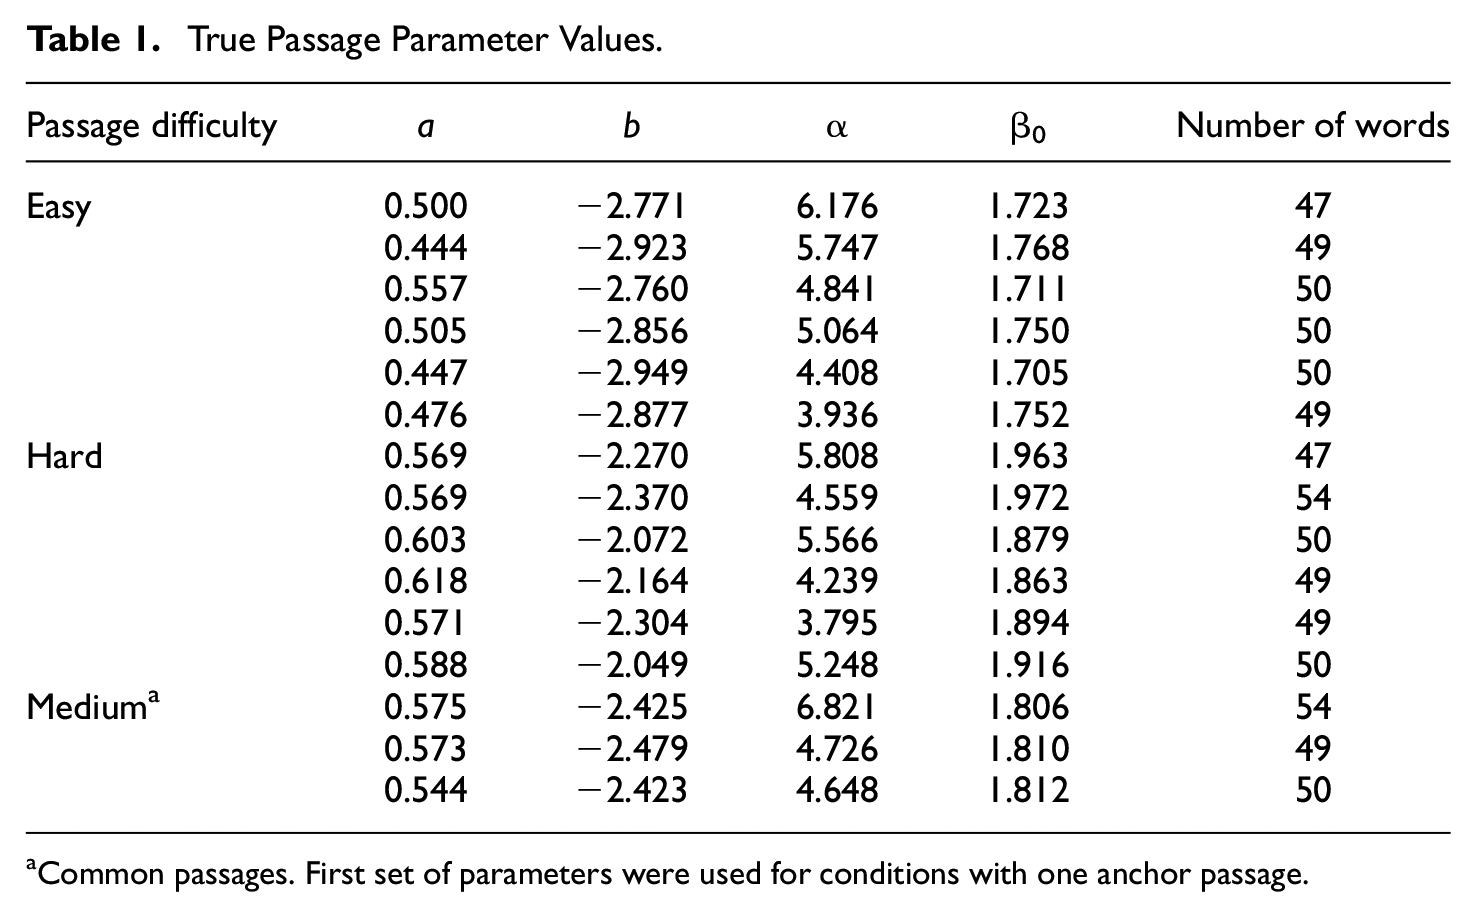
Common passages. First set of parameters were used for conditions with one anchor passage.
Speed and accuracy ability parameters (
True Person Hyperparameter Values
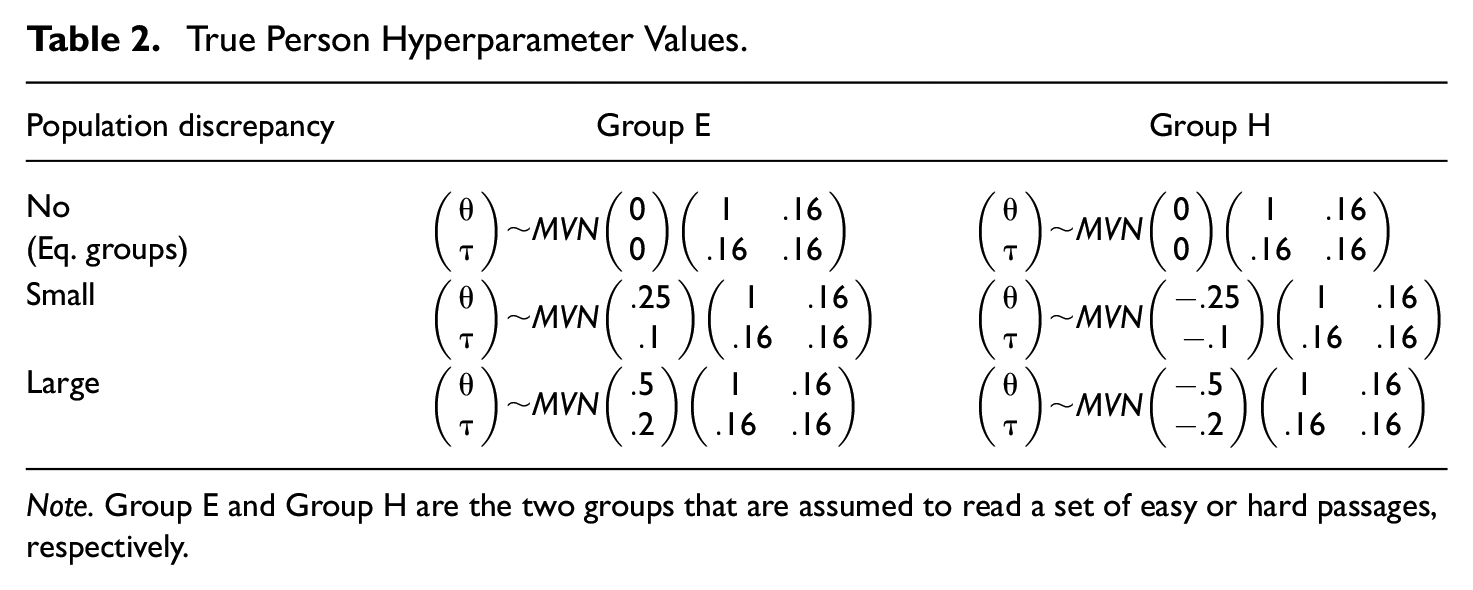
Note. Group E and Group H are the two groups that are assumed to read a set of easy or hard passages, respectively.
Equating Procedures and Analyses
The WCPM scores from Group E are equated to those from Group H. Observed WCPM scores were computed using the generated reading time and correctly read word count data, by dividing the total number of words read correctly by the total reading time in seconds and multiplied by 60. The WCPM scores were rounded to integers before applying the observed-score equating procedures to be consistent with WCPM score reporting in practice. Under the NEG assumption, Tucker’s linear and frequency estimation equipercentile equating methods with loglinear presmoothing (Holland & Thayer, 2000) were performed. Under the EG assumption, linear and presmoothed equipercentile equating methods were performed.
For the model-based equating, we followed the steps described earlier in the previous section. Note that a concurrent calibration of passage parameters was performed for each replication of the simulation. Thus, equating errors associated with passage parameters were incorporated into the process. Then, model-based WCPM scores were obtained using Equation 3, where person parameters (i.e., accuracy and speed) were estimated using the same Bayesian MCMC technique as in Kara et al. (2020). More specifically, we first estimated accuracy and speed parameters (
As per the Bayesian estimation, we set the number of iterations as 40,000, the number of burning as 20,000, and number of thinning as two to alleviate autocorrelations. Three chains were run with initial values set as
Observed-score linear and equipercentile equating were performed by using the R package equate (Version 2.0-5; Albano, 2016). As per model-based equating, we used R package R2jags (Su & Yajima, 2015) to interface with JAGS (version 4.3.0; Plummer, 2015). JAGS syntax for the passage calibration and final equating step with fixed parameter values are provided in the appendix. We used R (Version 4.1.2; R Core Team, 2016) for all our analyses and visualizations.
In summary, we performed four observed-score equating methods, namely, linear and equipercentile equating with EG and NEG (i.e., NEAT) designs. As mentioned earlier, methods with the EG assumption were included in the simulation to demonstrate the effects of their misuse, when the group equivalency assumption is not met. The performance of these observed-score equating methods were compared with the model-based equating under the 18 conditions elaborated above.
Evaluation Criteria
As indicated earlier, the direction of equating was from Group E to Group H. In other words, WCPM scores from easy passages were equated to hard passages, as if Group E read the hard passages. Thus, we examined the degree to which equated ORF scores of Group E was close to their true (i.e., population) values. Population WCPM scores of Group E on the hard passages were computed by using Equation 3 with the population speed and accuracy abilities (
Equating errors were evaluated using the following three measures: absolute relative bias (ARB), standard error (SE), and root mean squared error (RMSE). Given R replications and true WCPM score

The SE of WCPM score estimate

Finally, the RMSE of WCPM score estimate

The averages of the above outcome measures across persons were computed for the group which took the easy passages (Group E) to evaluate the impacts of the manipulated factors.
Results
Results from the simulation study are summarized in terms of the average ARB, SE, and RMSE values for the equated WCPM scores for Group E (the group who took easy passages) in Figures 1–3. Results for the observed-score equating methods with EG design were not shown in the figures due to large recovery index values compared with methods with NEAT design. Rather, we provided our interpretations of the results for observed-score equating methods with EG design in relevant paragraphs. In all conditions, the ORF models’ estimation converged with PSRF <1.1 and ESS >400 for all person parameters in all replications.
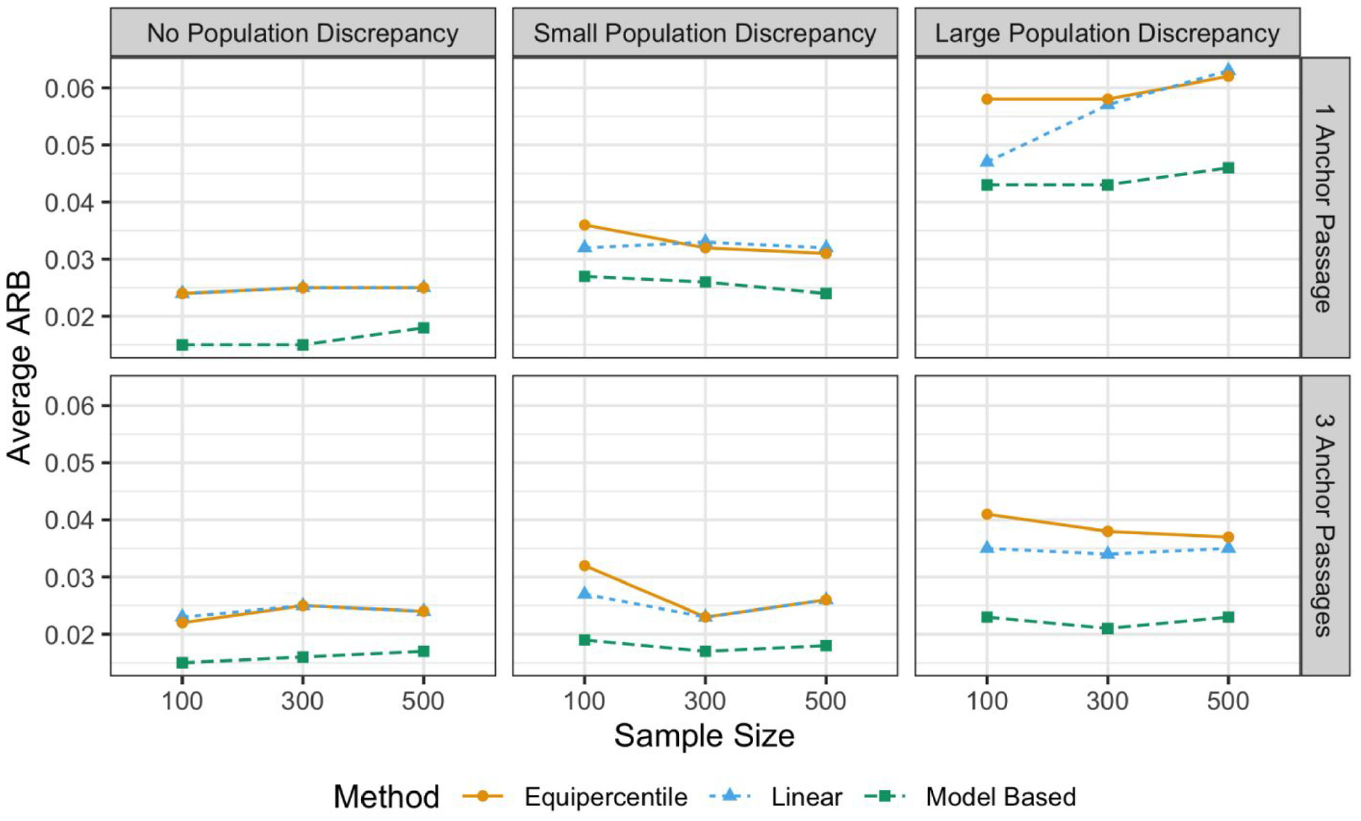
Average Absolute Relative Bias (ARB) of the Equated WCPM Scores
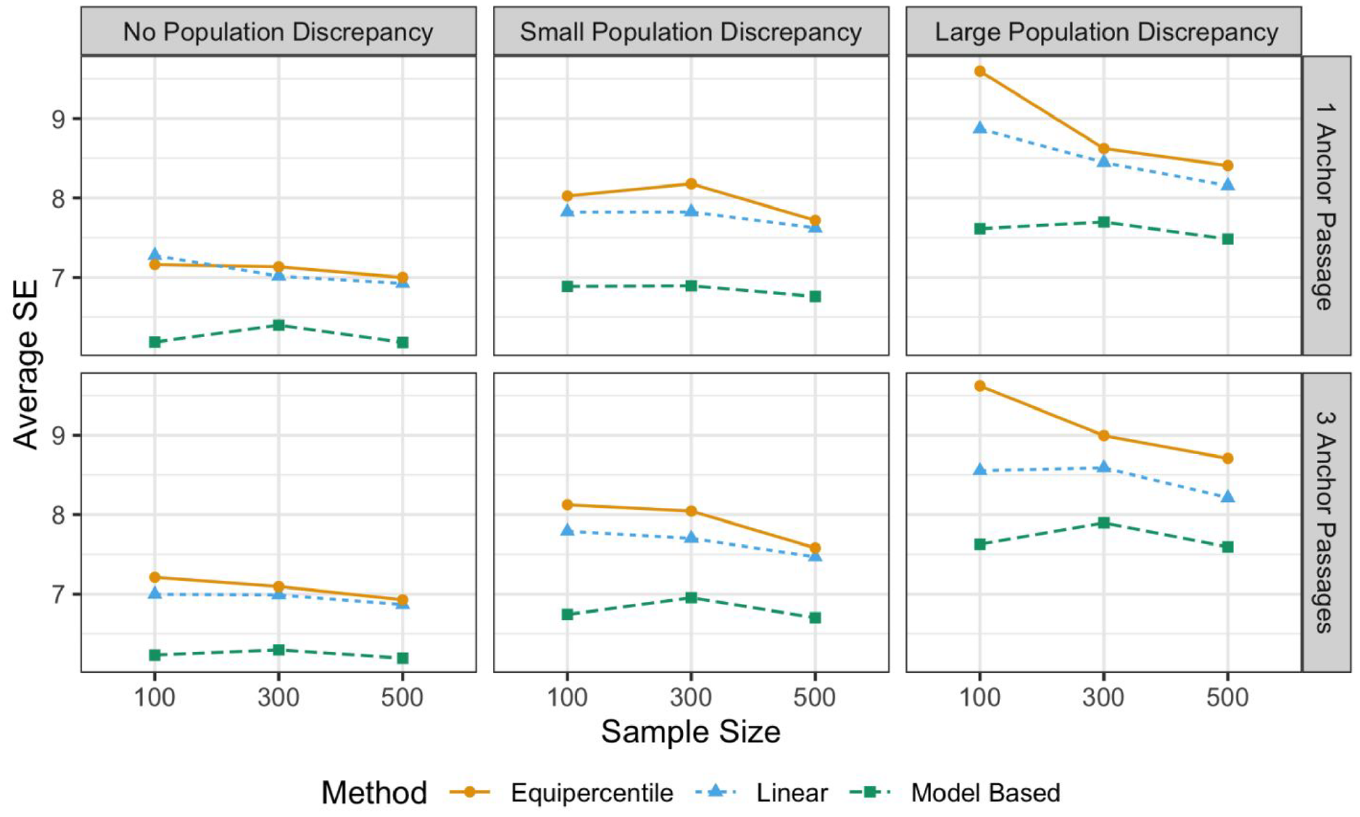
Average Standard Error (SE) of the equated WCPM scores.
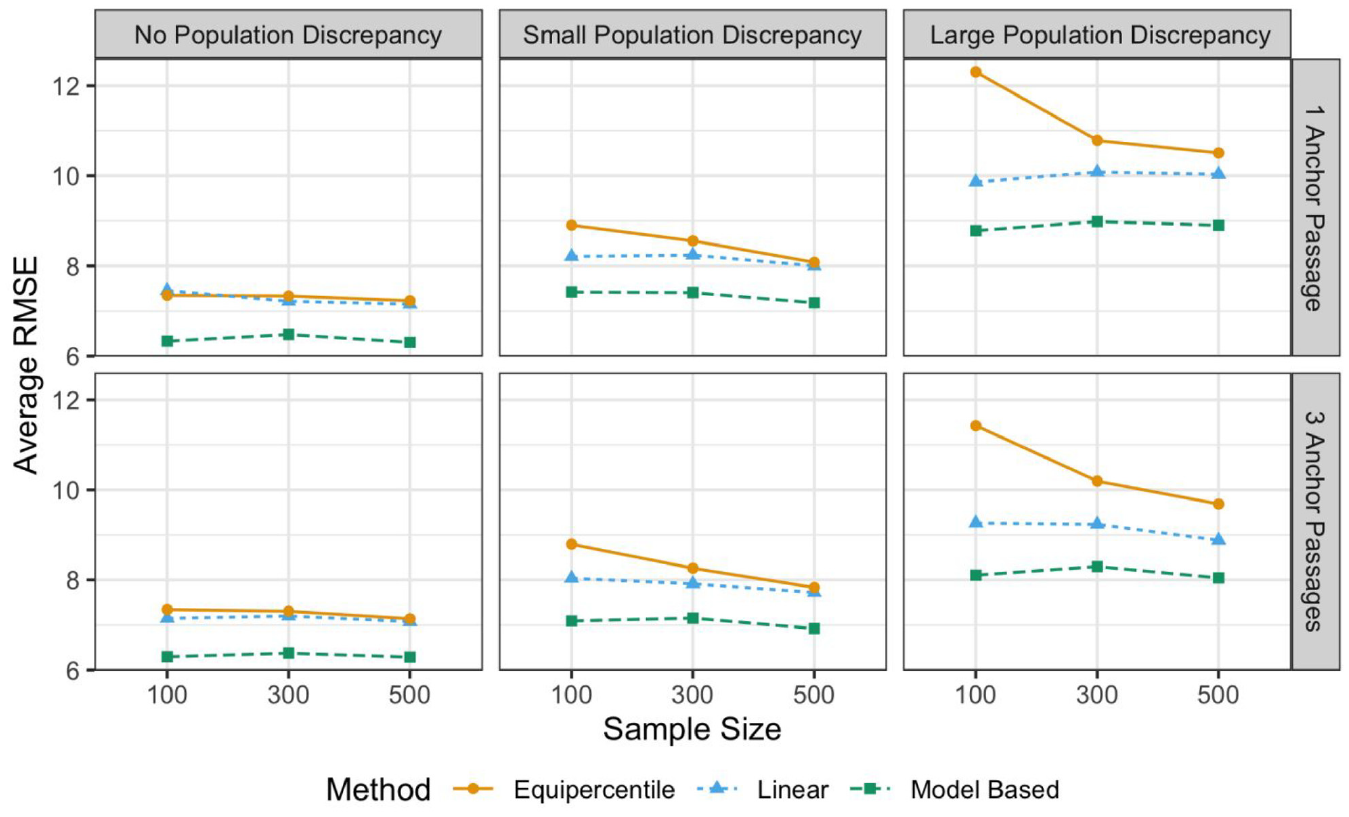
Average Root Mean Square Error (RMSE) of the Equated WCPM Scores
The average ARB values for the equated WCPM scores with the three equating methods that assume the NEAT design are graphically summarized in Figure 1. As expected, the large population discrepancy led to higher average ARB for all three methods. Under all simulation conditions, model-based equating outperformed the linear and equipercentile equating methods. The difference in average ARB values was larger between the observed and model-based methods under the large population discrepancy condition. Having more anchor passages contributed to lower the average bias for all three methods, especially when the difference between groups’ ORF ability was large. The effect of sample size, however, was not as prominent as the other simulation factors. In other words, we did not observe a consistent decrease in average ARB values by increasing the sample size. On the contrary, the effect of wrongly assuming group equivalence with linear and equipercentile equating methods was severe. Although not plotted in Figure 1, the average ARB values for these methods that assumed EGs were much higher than the scale of the vertical axis in Figure 1 can capture: over 0.2 and 0.4 with small and large levels of population discrepancy, respectively.
Note that the ARB values evaluated above were the averages across all observations in each simulation condition. These averages were below .05 for all three methods with no and small population discrepancy conditions. Also, they were all below .05 for all three methods under large population discrepancy conditions with three anchor passages. With a large population discrepancy and a single anchor passage, only model-based method displayed the average ARB below .05 with all sample sizes. To further examine the performance of the three equating methods that assumed the NEAT design, we provided the visuals for individual ARB values per sample size in the supplementary material.
The average SE values of the equated WCPM scores are summarized in Figure 2. As expected, larger sample sizes led to smaller average SE for the observed-score equating methods with the NEAT design. Furthermore, a large population discrepancy led to higher average SE for all three equating methods, yet the effect of the number of anchor passages was not prominent. Average SE values were always lower for the model-based approach under all simulation conditions. Although not shown in Figure 2, for the two observed-score equating methods with the EG assumption, the average SE values were close to their counterparts that assumed the NEAT design, when there was no population discrepancy. Interestingly, under the conditions with a large population discrepancy, the two observed-score methods with the EG assumption had lower average SE values (around 5.5 for all sample sizes and number of anchor passages), which may be counterintuitive. Our interpretation was that it was because they performed consistently worse, due to an incorrect assumption about group equivalency.
The average RMSE values of the equated WCPM scores are presented in Figure 3. Overall, the pattern was similar to the results for average ARB, which is an indication that a majority of errors were due to systematic errors (bias), rather than sampling fluctuations (SE), except that RMSE displayed some impacts of sample sizes attributed to the SEs, especially for the equipercentile equating. Larger sample sizes would be needed for the equipercentile equating to perform as good as the linear equating, when there was a nonzero population discrepancy. The effect of number of anchor passages was not prominent yet a slight decrease was observed with the increase of number of anchor passages, when the population discrepancy was large. In sum, the model-based equating method performed consistently better than other equating methods in all simulation conditions in terms of average RMSE. Finally, the average RMSE for the observed-score methods with EG assumption were much larger than the scale of the vertical axis in Figure 3: 15 and 35 for the conditions with small and large population discrepancy, respectively. Thus, the wrong assumption of the group equivalency by the observed-score equating methods resulted in substantially larger total equating errors, compared with methods that assumed the NEAT design.
Discussion
In this article, we demonstrated the model-based approach for equating WCPM scores in ORF assessments based on a latent-variable measurement model (Kara et al., 2020). We conducted a simulation study to evaluate the performance of the model-based equating method in comparison with traditionally used observed-score equating methods, linear and equipercentile equating.
Overall, the results demonstrated that the model-based approach performed satisfactorily well under all simulation conditions. This was encouraging for the use of the model-based approach to equate WCPM scores. For example, Babcock and Hodge (2020) showed the utility of the Rasch model for performing equating on traditionally scored exams with relatively low sample sizes. Their findings are in line with ours: we demonstrated that the latent-variable model-based approach performed as good as or better than the traditional observed-score equating methods. On the contrary, the performance of the observed-score equating methods depended on specific conditions. This was not surprising as it is known that the accuracy of the traditional equating methods depends on the degree to which the underlying assumptions, such as linearity for the linear equating, are met (Albano & Rodriguez, 2012). Nevertheless, the observed-score equating methods performed equally well as the model-based approach, when the discrepancy was small or nonexistent in terms of the population ORF abilities between groups.
In addition, the results demonstrated dramatic impacts of the EG assumption for the observed-score equating methods. These methods did not perform well, unless the EG assumption was met in the data. As the assumption of having EGs would be realistically hard to ensure in real-life conditions, this strong assumption required by the classical equating methods is likely to be violated. This was also pointed out by Albano and Rodriguez (2012), stating that the traditional WCPM scores as part of classroom-based measurements were not designed to meet such assumptions. Therefore, it is paramount to employ an equating method that incorporates the assumption of group nonequivalence, such as an observed-score equating method with a NEAT design or the model-based equating approach, which does not rely on such an assumption, as demonstrated in this article. In addition to horizontal equating, these methods should be preferred especially for vertical equating, where groups comprise students from different grade levels, where population discrepancies in ORF speed and accuracy abilities naturally exist. Thus, adopting an equating method with a NEAT design or the model-based approach would be an optimal choice for WCPM score equating for the purpose of progress monitoring over multiple years.
Equating ORF assessment scores is essential to ensure score comparability both between and within students. Besides its better overall performance in terms of more accurate equated scores, the model-based equating approach for WCPM scores potentially provides several other practical advantages to researchers and practitioners. First, a calibrated passage pool allows practitioners to build reading passage forms of various difficulties. It is also important to note that building such a calibrated passage pool would not require a complete design where all students are expected to read all passages. This is thought to be an important aspect of adopting a model-based approach not only for equating studies but also for the measurement of ORF ability. Second, similar to the advantage of IRT-based test scoring, having a calibrated passage pool can be a basis for a potential future development of pre-equated ORF assessment forms and a computer adaptive test version of an ORF assessment.
In addition to its advantages in scoring and scaling, it has been demonstrated that the model-based approach to ORF assessment data has an advantage over the traditional observed-score approach, because it allows the computation of standard errors for each estimated WCPM score, namely, conditional standard errors of measurement (CSEM; Nese & Kamata, 2021). On the contrary, with the observed WCPM scores, only one equivalent quantity can be computed for the entire sample of students (namely, SEM: standard error of measurement). Based on these additional advantages of the model-based approach to ORF assessment data and the results from our study, it is recommended that model-based equating method to be considered for equating WCPM scores.
There are several limitations in our study, mainly associated with the simulation we conducted. Specifically, the results from the simulation are limited to a handful of factors manipulated that are sample size per group, number of anchor passages, and level of discrepancy in groups’ ORF ability. The performance of the observed-score and model-based equating methods may differ with other levels of these factors and/or other factors that were not considered, such as the level of test difficulty discrepancy, which was a fixed factor. Nevertheless, it is worth noting that the two passage sets (easy and hard) were formed based on a previously calibrated passage pool. Thus, this level of difficulty discrepancy in the two sets of passages is expected to reflect a realistic condition. On the other hand, the number of unique passages read by each group (i.e., the test length) was also a fixed factor. Moreover, we did not consider the varying lengths of passages by intentionally selecting passages with approximately 50 words. Future studies can focus on factors not considered here and relevant to other realistic ORF assessment conditions.
Supplemental Material
sj-pdf-1-epm-10.1177_00131644221148122 – Supplemental material for Equating Oral Reading Fluency Scores: A Model-Based Approach
Supplemental material, sj-pdf-1-epm-10.1177_00131644221148122 for Equating Oral Reading Fluency Scores: A Model-Based Approach by Yusuf Kara, Akihito Kamata, Xin Qiao, Cornelis J. Potgieter and Joseph F. T. Nese in Educational and Psychological Measurement
Footnotes
Appendix
model{
for (j in 1:J){
for (i in 1:I){
res[j,i]~dbin(p[j,i], nw[j,i])
logit(p[j,i]) <- a[i]*(theta[j]-b[i])
log_tim[j,i]~dnorm(mu[j,i], prec.t[i]) #variance=1/alpha^2, so precision=alpha^2
mu[j,i] <- beta[i]-tau[j]
}
theta[j]~dnorm(0,1)
tau[j]~dnorm(mtau[j], ptau) #distribution of tau conditional on theta
mtau[j] <- cvr*theta[j] #cvr is the covariance between tau and theta
}
for(i in 1:I){
prec.t[i] <- pow(alpha[i], 2)
alpha[i] ~dnorm(0, 0.01) T(0,)
b[i]~dnorm(0, 0.01)
beta[i]~dnorm(0, 0.01)
a[i]~dnorm(0, 0.01) T(0,)
}
ptau~dgamma(0.01, 0.01) #conditional precision of tau
vtau <- 1/ptau
tau.var <- vtau + (pow(cvr,2)) #tau.var is the variance of tau’s marginal distribution
cvr~dnorm(0, 0.01)
crl <- cvr/sqrt(tau.var)
}
Note that in the syntax below, all passage parameters, the variance of tau, and the covariance between theta and tau are treated as known quantities and supplied along with data values during the JAGS estimation.
model{
for (j in 1:J){
for (i in 1:I){
res[j,i]~dbin(p[j,i], nw[j,i])
logit(p[j,i]) <- a[i]*(theta[j]-b[i])
log_tim[j,i]~dnorm(mu[j,i], prec.t[i])
mu[j,i] <- beta[i]-tau[j]
}
theta[j]~dnorm(0, 1)
tau[j]~dnorm(mtau[j], ptau)
mtau[j] <- cvr*theta[j]
}
for(i in 1:I){
prec.t[i] <- pow(alpha[i],2)
}
}
Declaration of Conflicting Interests
The authors declared no potential conflicts of interest with respect to the research, authorship, and/or publication of this article.
Funding
The authors disclosed receipt of the following financial support for the research, authorship, and/or publication of this article: The research reported here was partially supported by the Institute of Education Sciences, U.S. Department of Education, through Grant R305D200038 to the Southern Methodist University and through Grant R305A140203 to the University of Oregon. The opinions expressed are those of the authors and do not represent views of the Institute or the U.S. Department of Education.
Supplemental Material
Supplemental material for this article is available online.
References
Supplementary Material
Please find the following supplemental material available below.
For Open Access articles published under a Creative Commons License, all supplemental material carries the same license as the article it is associated with.
For non-Open Access articles published, all supplemental material carries a non-exclusive license, and permission requests for re-use of supplemental material or any part of supplemental material shall be sent directly to the copyright owner as specified in the copyright notice associated with the article.