
Abstract
This simulation study investigated to what extent departures from construct similarity as well as differences in the difficulty and targeting of scales impact the score transformation when scales are equated by means of concurrent calibration using the partial credit model with a common person design. Practical implications of the simulation results are discussed with a focus on scale equating in health-related research settings. The study simulated data for two scales, varying the number of items and the sample sizes. The factor correlation between scales was used to operationalize construct similarity. Targeting of the scales was operationalized through increasing departure from equal difficulty and by varying the dispersion of the item and person parameters in each scale. The results show that low similarity between scales goes along with lower transformation precision. In cases with equal levels of similarity, precision improves in settings where the range of the item parameters is encompassing the person parameters range. With decreasing similarity, score transformation precision benefits more from good targeting. Difficulty shifts up to two logits somewhat increased the estimation bias but without affecting the transformation precision. The observed robustness against difficulty shifts supports the advantage of applying a true-score equating methods over identity equating, which was used as a naive baseline method for comparison. Finally, larger sample size did not improve the transformation precision in this study, longer scales improved only marginally the quality of the equating. The insights from the simulation study are used in a real-data example.
Keywords
Introduction
Background
The process of equating aims to make scores issued by different multi-item scales comparable (Kolen & Brennan, 2014). Smith and Kramer (1992) divide the theoretical framework for test equating into two methodological approaches: observed-score and true-score equating.
Observed-score equating procedures apply a transformation to approximate the observed-score distributions from different scales. Typically, these procedures first use methods to reduce random variation in the raw scores through, for example, pre-smoothing, estimation of score probabilities, or item response theory (IRT) modeling (von Davier et al., 2013) and then equate the scores, for example, with linear, equipercentile (Skaggs & Lissitz, 1986), or kernel equating methods (Wiberg, 2016). Overviews of observed-score equating methodologies can be found in Peabody (2020) or Battauz (2017).
True-score equating also aligns scores from different scales. The so-called “true score” is established through a latent variable model (Kolen & Brennan, 2014). True-score equating uses one concurrent calibration of scales to estimate common item parameter (
Several assessment designs are available to achieve score comparability through true-score equating. A concurrent calibration of scales can be applied in a common person design (horizontal design) or using a non-equivalent anchor test (NEAT) design. NEAT designs are used when test-takers have answered different scales with some common items, so-called anchor items. NEAT designs are considered more economical and practical than common person designs but also pose challenges, mainly in selecting the best anchor items (Diao & Keller, 2020; He & Cui, 2020; Suanthong et al., 2000). The concurrent calibration with a common person design is often found to be the most intuitive of the latent trait-based approaches with a robust linking approach that only requires all test-takers to answer the different scales (Dorans, 2007). The concurrent calibration analyses, two or more assessment scales simultaneously and ensures that the
Equating with a common person design, also called form-to-form equating, is highly relevant in different fields of questionnaire-based measurement. In educational settings where test-takers can prepare for an examination with a “drill-and-practice” session before undergoing the actual exam, the different scales should be equivalent in terms of their difficulty (Almond et al., 2003). For health measurement, many different scales are available when deciding to measure a health or health-related aspect of interest (Ballert et al., 2019; Velstra et al., 2011). Equating and having a transformation equation enables harmonizing the information collected with different scales and having metrically sound scores for broader usage (Chan et al., 2015; Smith & Taylor, 2004). Equating also relates to item banking. An item bank consists of an item pool placed onto one underlying common metric. Different subsets of an item bank are expected to produce interchangeable metrics (Wolfe, 2000). Form-to-form equating is also relevant when creating a shorter version of an assessment tool. Equated test versions inform the elimination of items by preserving those which best transfer scores from the short to the original version (Ryan & Brockmann, 2010; Xiao et al., 2019).
The multi-item assessment context mimicked in this simulation study is motivated by health-related settings. Individual information about functioning, physical and mental health, as well as living conditions are getting more and more routinely assessed by health systems (ANQ, 2022; AROC, 2022; Canadian Institute for Health Information, 2022). Assessments in health settings are often of smaller scale and often within populations that need to present specific characteristics to be recruited, such as certain diagnoses or certain treatments. In health-related research, questionnaire-based assessments, particularly for studies, are voluntary. This typically leads to smaller sample sizes than in educational settings, for example. The multi-item scales applied in this assessment context are also often shorter and rarely exceed 20 items. These multi-item scales are generally responded to by means of Likert-type response options, indicating increasing endorsement of an item. In this context, equating of scales can provide a richer quantitative basis for empirical studies or facilitate the interchangeability of scores derived from different scales. Data collections can take place within one assessment session with an intention from the assessor to equate scales (Choi et al., 2014; Covic et al., 2012; Gatz et al., 2015; Maritz et al., 2022; Vos et al., 2019). Sometimes, data that are collected over time to monitor the course of a treatment or a rehabilitation intervention can be made available for scale equating (Edelen et al., 2021; Fischer et al., 2011; Jones et al., 2021; McDonough et al., 2020; Taylor & McPherson, 2007; ten Klooster et al., 2013; Velozo & Woodbury, 2011). In health research, equating studies using a common person design are often described by the terms “instrument crosswalk” or “data harmonization.”
In theory, equating is described as ideal when the requirements of equal construct, equal reliability, symmetry, equity, and population invariance are met (Peterson, 2007). By and large, two equated scales, for example, Scale X and Scale Y, should measure, at least to some extent, the same construct with the same reliability. The symmetry requirement expects that the transformation equation is bidirectional. Equity underlines that none of the scales should be more favorable to test-takers. Population invariance assumes that the equating function remains invariant to sample characteristics. Equating literature does not explicitly mention the quality of the scale targeting as a fundamental requirement for equating. However, the good targeting of a scale to the population is important and routinely tested and reported in psychometric studies. A well-targeted scale consists of items that match the ability continuum of the test-takers. Equating when one or all scales do not match a sample’s ability range is questionable and so worth examining. Targeting can be understood as an equity problem when scales are not assessing the same
This study systematically observed the effects on score transformation precision when similarity of the constructs being assessed, their equity, and their targeting were varied. The requirement of equal constructs is central to the present study. In scale construction, the similarity of the latent trait assessed by scales using different items is rarely described as perfect. Disparate operationalizations of one latent construct can diminish the unidimensionality. For example, scales that examine algebra proficiency with equation-type and story-type exercises would typically lead to a multidimensional measure of algebra (Ackerman, 1994). Also, characteristics of the scales, such as the wording of the items (McCreary et al., 2013; Romine et al., 2018; Yamaguchi, 1997) or their response options (Bolt & Adams, 2017) can impact the dimensionality of a common metric. Regardless, if the researcher assumes unidimensionality, true-score equating will just treat the constructs as unidimensional. Statistically, the similarity of instruments’ content can be discussed in terms of the degree of multidimensionality and expressed, for example, by a factor correlation parameter when analyzed with a multidimensional approach. With higher correlation, two scales present more similar operationalizations of a latent trait (Reckase et al., 1988). Equating conditions are ideal with unidimensionality, with one unique latent construct being measured by the two scales. L. L. Cook and Eignor (1989) point out that statistical unidimensionality is not granted even when the same latent construct is assessed by both scales. Some studies indicate that equating with Rasch or IRT methods may still perform well despite departures from strict unidimensionality (Beguin & Bradley, 2001; Surla, 2020). Bolt (1999) found that with correlations between scales above 0.7, true-score equating performs better than observed-score approaches. For IRT-based equating, Choi et al. (2014) reported that for the equating of health outcome measures, inter-scale correlations of 0.75 to 0.8 might be an appropriate minimum when a common person design is used. Fischer et al. (2011) reported good scale score conversions using depression scales that had a correlation of 0.85.
In conjunction with the equal construct requirement, this simulation study also addressed the impact of departures from equity. Equity underlines that none of the scales should be more favorable to test-takers. It must be a matter of indifference whether test-takers assess scale X or scale Y (Lord, 1980), meaning that the scales should be equally difficult. If equity holds, scores for an individual should be identical regardless of the scale. When scales are not equally difficult and measure different ranges of the
This study also considered good targeting as an essential prerequisite when equating scales. Targeting is considered good when the
This equating study uses concurrent calibration with the partial credit model (PCM), a Rasch-type model for polytomous response options (Masters, 1982, 1985). In the following, for simplicity, we will refer to both the Rasch model for dichotomous responses (Rasch, 1960) and extension of the Rasch model for polytomous responses (Masters, 1982) as “Rasch models.” Rasch models build on a probabilistic approach to measurement where the probability of a response to an item is formalized as a function of the item difficulty and the person ability parameters. Skaggs and Wolfe (2010) provide a comprehensive overview on the equating of scales with Rasch models and different equating designs. Smith and Kramer (1992) report that equating procedures are robust to violations of the assumptions of the Rasch model. In this study, the violations occurring were only those intentionally caused by the simulation.
Many true-score equating simulation studies focus on IRT, that is, two-parameter logistic (2PL) or higher-order models for dichotomous item ratings. Rasch-based simulation studies interested in equating are rarer. The effect of lack of similarity of scales in a common person design is very little investigated. This study aims to shed light on the accuracy of score transformations across scales equated through concurrent calibration with a Rasch model. Especially, we want to come up with some concrete insights about the effect of departures from scale similarity, equity, and targeting when equating with the PCM and using a common person design. Before diving into Rasch-based true-score equating, an Appendix is available as Online Supplemental Material for interested readers that describes the measurement assumptions of the PCM and the criteria applied in this study to determine whether the assumptions are met.
True-Score Equating
The true-score equating approach in a common person design uses a process with distinct analysis steps to arrive at a score transformation rule that links the scores from the equated scales. The steps required to equate two scales, called Scale X and Scale Y, throughout the study are described in what follows and shown in Figure 3.
Separate PCMs
Preliminary to the equating of scales, it is essential to consider the degree to which items exhibit proper fit within the respective scales (Wolfe, 2000; Wright & Bell, 1984). An analysis with the PCM determines the extent to which data collected with the scales fulfill fundamental measurement assumptions (see Appendix A in the Supplemental Online Materials). However, separate calibrations of the two scales produce independent estimates of

for form X, and

for form Y. The
The
Concurrent PCM
In this study design, where all test-takers have filled all different scales to be equated, the equating strategy can consist of a joint calibration of all the

The
Anchored PCMs
The concurrent calibration in Step B equates Scale X and Scale Y and puts the two metrics on a common measurement continuum.

for the anchored form X, and

for the anchored form Y.
The process of preliminary fixing the
Concordance Table
When considering a latent trait being measured, each test-taker is expected to have only one ability level. Still, their test scores can vary because of the characteristics of the test versions used for the assessment. The concurrent calibration and analysis with anchored item estimates puts different scales on a common metric. A three-step score transformation is necessary to find the score on Scale Y that is the most equivalent to a score on Scale X. First, for a person
Example of a Concordance Table.
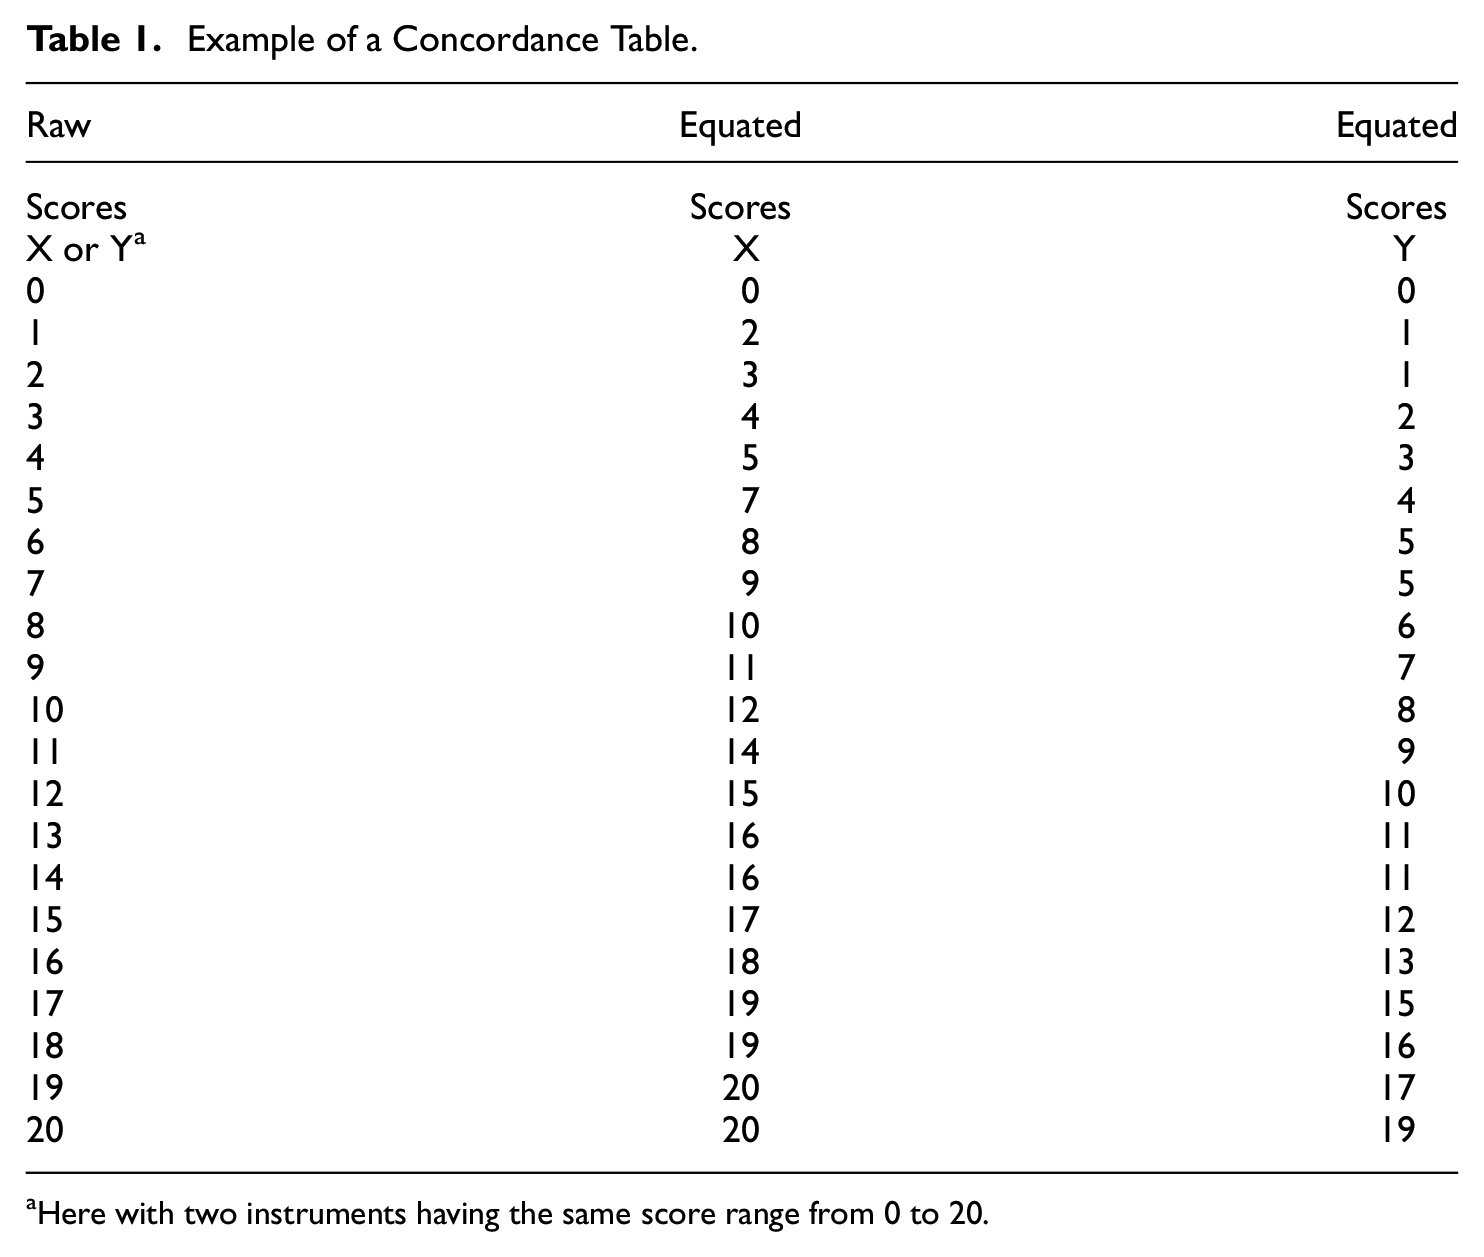
Here with two instruments having the same score range from 0 to 20.
After equating, the concordance table directly links observed scores in one scale to the expected score on an equated scale. Applied psychometric equating studies using the Rasch model routinely report the respective fit of the scales to be equated to the Rasch model, often also the fit of the equated test versions to the Rasch model, and typically provide a user-friendly score concordance table that should facilitate score transformations in the applied work field (Chen et al., 2009; Doğanay Erdoğan et al., 2017; Lambert et al., 2015; Latimer et al., 2012).
Aims of the Study
This simulation study hopes to contribute to the methodological literature in the field of true-score equating with the Rasch model and to provide some insights into the impact of characteristics of the scales on score transformations. The general objective of the study is to use simulated data to investigate the precision of score transformations based on Rasch-based equating in a common person design when varying the degree of similarity, the degree of equity, and the targeting of scales.
Concordance tables allow converting individual raw scores from one scale to the other. Data from a common person design, where all test-takers answered all equated scales, permit checking the transformation quality directly. For example, it is possible to directly determine for each simulated test-taker whether a transformation of a raw score on Scale X (

However, the possible values of the RMSE depend on the assessment range, for this reason the normalized RMSE (NRMSE) is reported, that normalizes the RMSE by the score range of the scales:

The bigger the NRMSE, the higher the discrepancy between the score obtained through true-score equating (
In addition to the NRMSE, which is composed of bias and variance together, the percent bias is also reported separately. The percent bias (
Furthermore, the improvement in the quality of the score transformation using the equated model is investigated by comparing it to an identity equating. Identity equating reflects an ideal situation where no equating would be necessary to compare the scores of two tests. Identity equating is based on the strong assumption that a score on a Scale X is equivalent to the same score value on a Scale Y. Identity equating was added to this analysis as a baseline for comparison and to highlight the advantage that Rasch-based true-score equating brings.
The findings of the simulation study are illustrated by means of an empirical example using real data from the World Health Organization’s and World Bank’s Model Disability Survey (MDS) in Afghanistan in 2019 (Sabariego et al., 2022; Shinwar et al., 2020). In this example, the psychometric characteristics of two set of items are related to the closest simulation setting to discuss the observed and expected transformation precision after equating.
Simulation Study
Data Generating Process
This simulation study was carried out with R 4.0.3 (R Core Team, 2020). The data were simulated with the function simdata() from R package mirt for the simulation of uni- and multidimensional data for IRT models (Chalmers, 2012).
Figure 1 summarizes the combinations of the different simulation settings, specifically the parameters that were varied in this study. Only the upper part of the figure is explicitly laid out, but the simulation scheme repeats identically for each started branch. These simulation settings were repeated for sample sizes
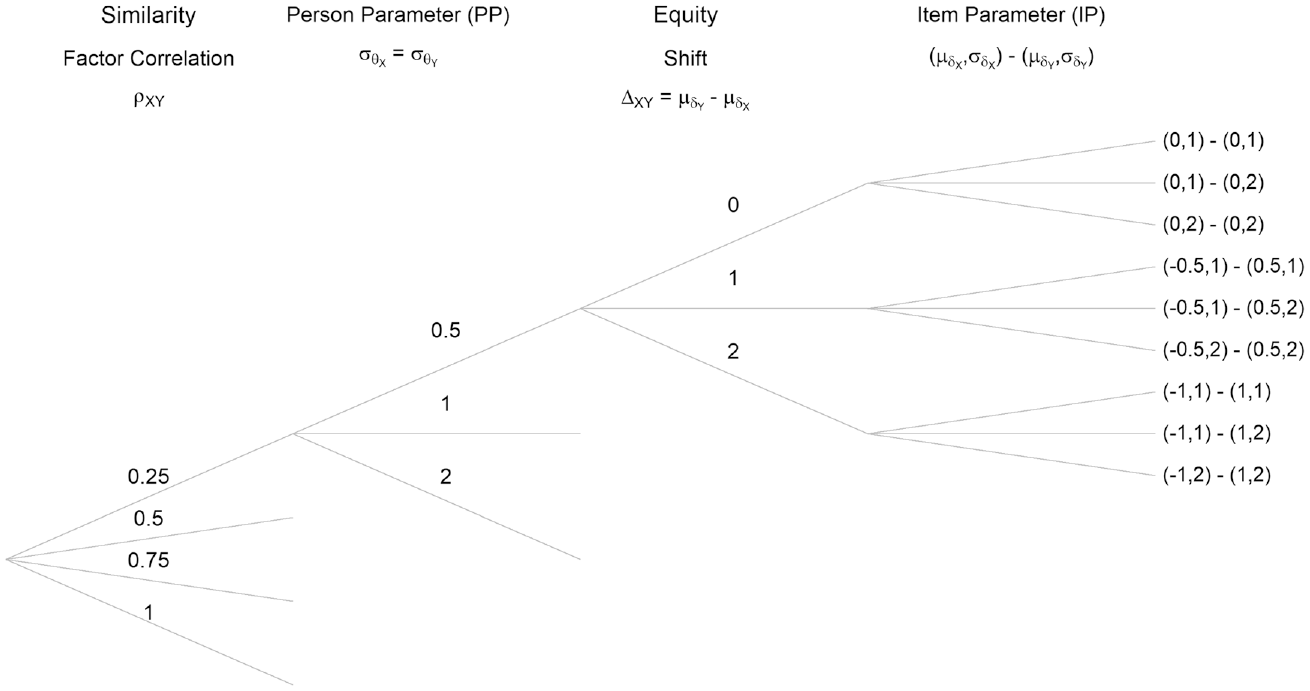
Configuration of the Simulation Parameters, Identically Repeating for All Started Branches, and Repeated for Sample Sizes 500 and 1,000, for 10 and 20 Item Scales.
When simulating data with simdata() it is possible to control for characteristics of the model, including item discrimination (via argument a), item difficulty thresholds (via argument d) as well as their mean difficulty (via argument mu), the sample size (via argument N), and the type of items simulated, e.g., dichotomous or polytomous (via argument itemtype). This study used the itemtype = “gpcm,” that is, a generalized PCM parameterization, but by constraining slope parameters to equal 1, as the generating of multidimensional data is not directly available for Rasch models in mirt.
The different degrees of similarity between scales were operationalized by varying the degree of multidimensionality (more pronounced multidimensionality going along lower degrees of similarity). Unidimensionality across scales indicates perfect similarity. Simulation of the similarity of the scales is closely related to the simulation of the person parameter. The person parameters (

The correlation,
In what follows, the notation

The
The simulation study also challenged the equity assumption and investigated the impact of difficulty differences on the equating of scales in a standardized setting. To do so, item parameters (

the dispersion refers to the standard deviation of the item difficulties:

The dispersion of the difficulties of the items around the mean was set either to
Figure 2 provides a visualization to understand better how the varying interplay of equity and targeting alters the match between
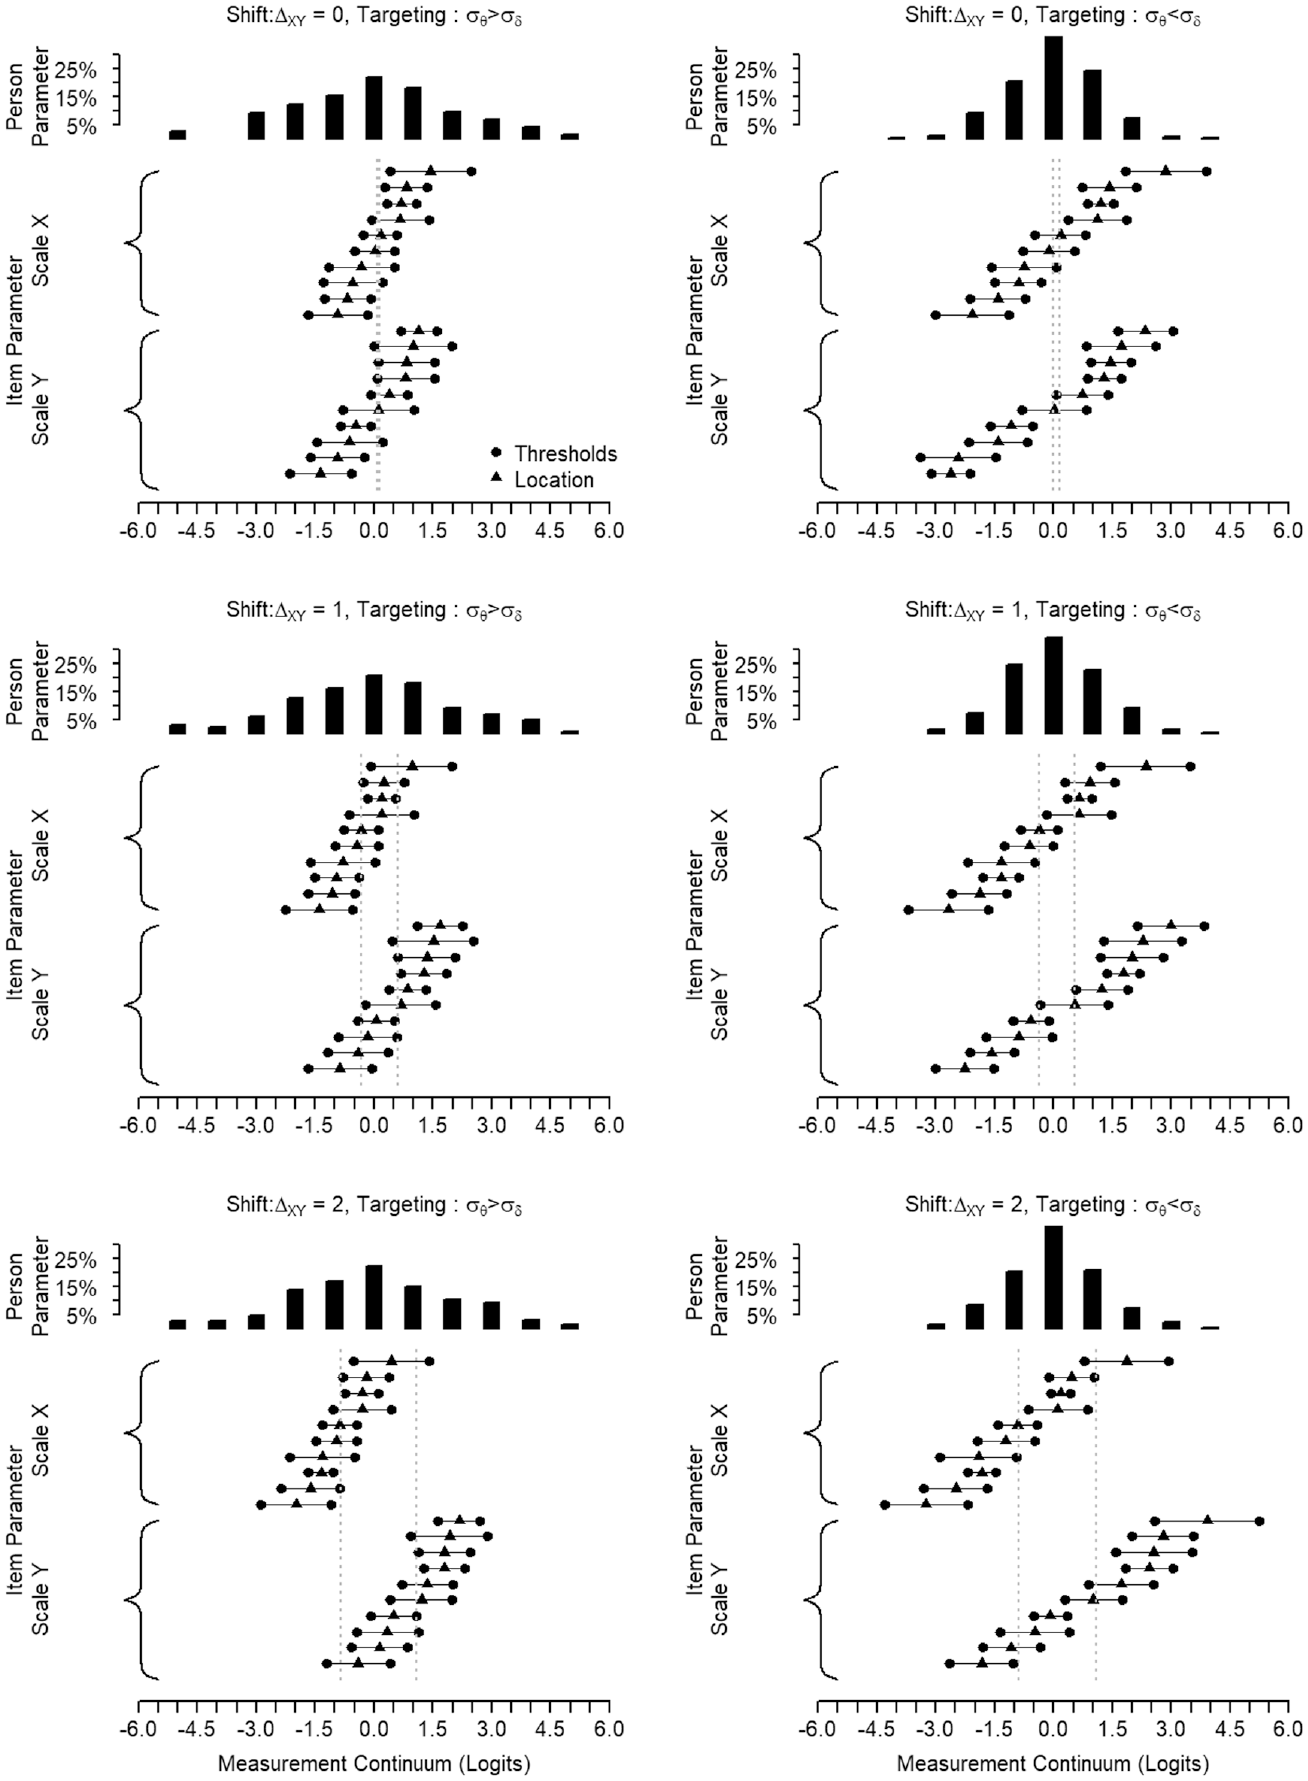
Example to Illustrate Targeting and Shift.
The different steps of the study, from the data-generating process to the final score transformation analysis, are schematically depicted in Figure 3. The most relevant lines of the R-code for the data generation and the true-score equating are provided in Appendix B in the Supplemental Online Materials.
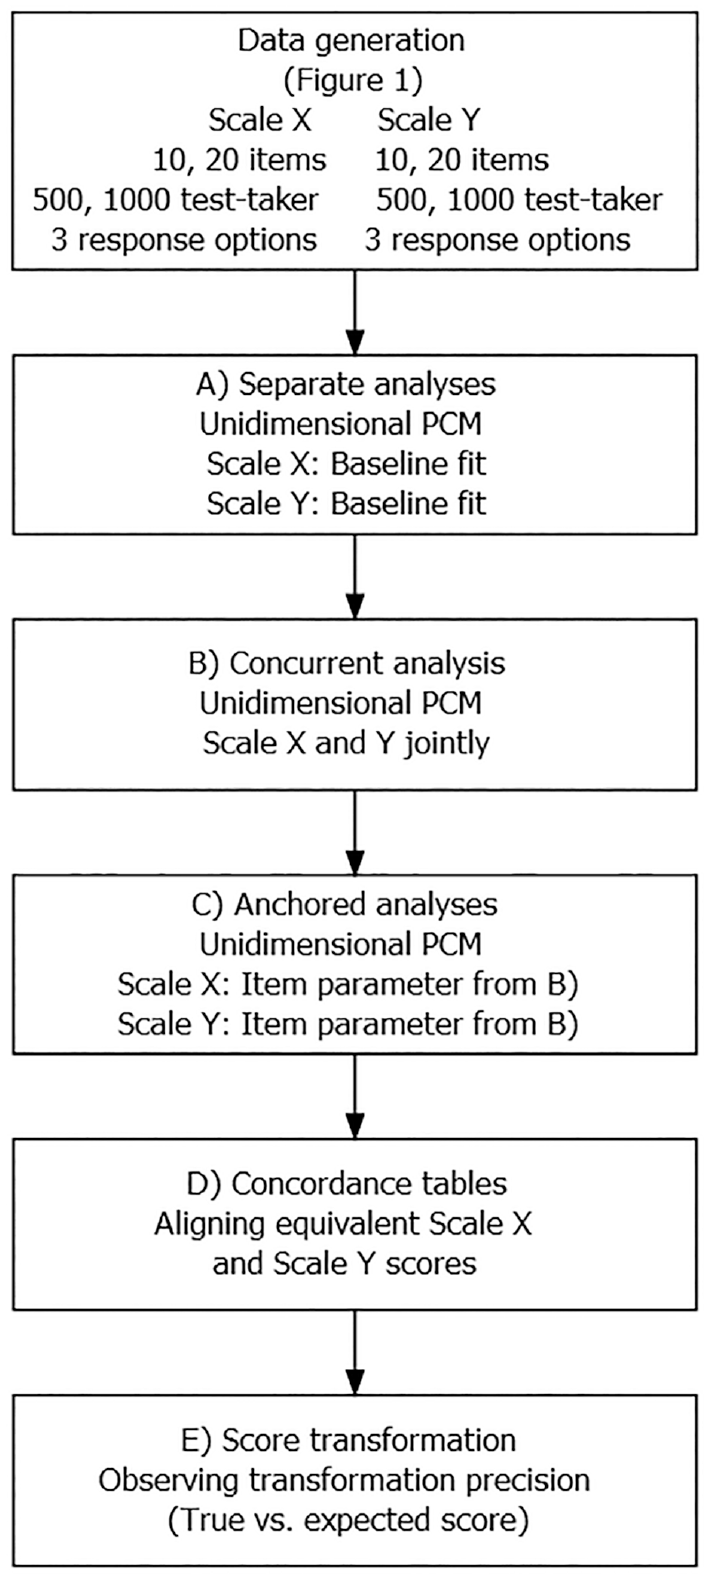
Flowchart for the Analysis Steps in One Simulation Setting.
Results
The percent bias shows the percentage of transformation precision that is not attributable to the variance of the score. The NRMSE is used to evaluate the precision of a score transformation between scales and quantifies the discrepancy between the equated score value and the true score of a scale. The distribution of the percent bias and the NRMSE values obtained across the repetitions of each simulation setting are summarized by means of boxplots in Figures 4 to 7, when transforming from Scale X to Y and reversely. Each Figure summarizes the findings regarding the percent bias and the NRMSE by means of
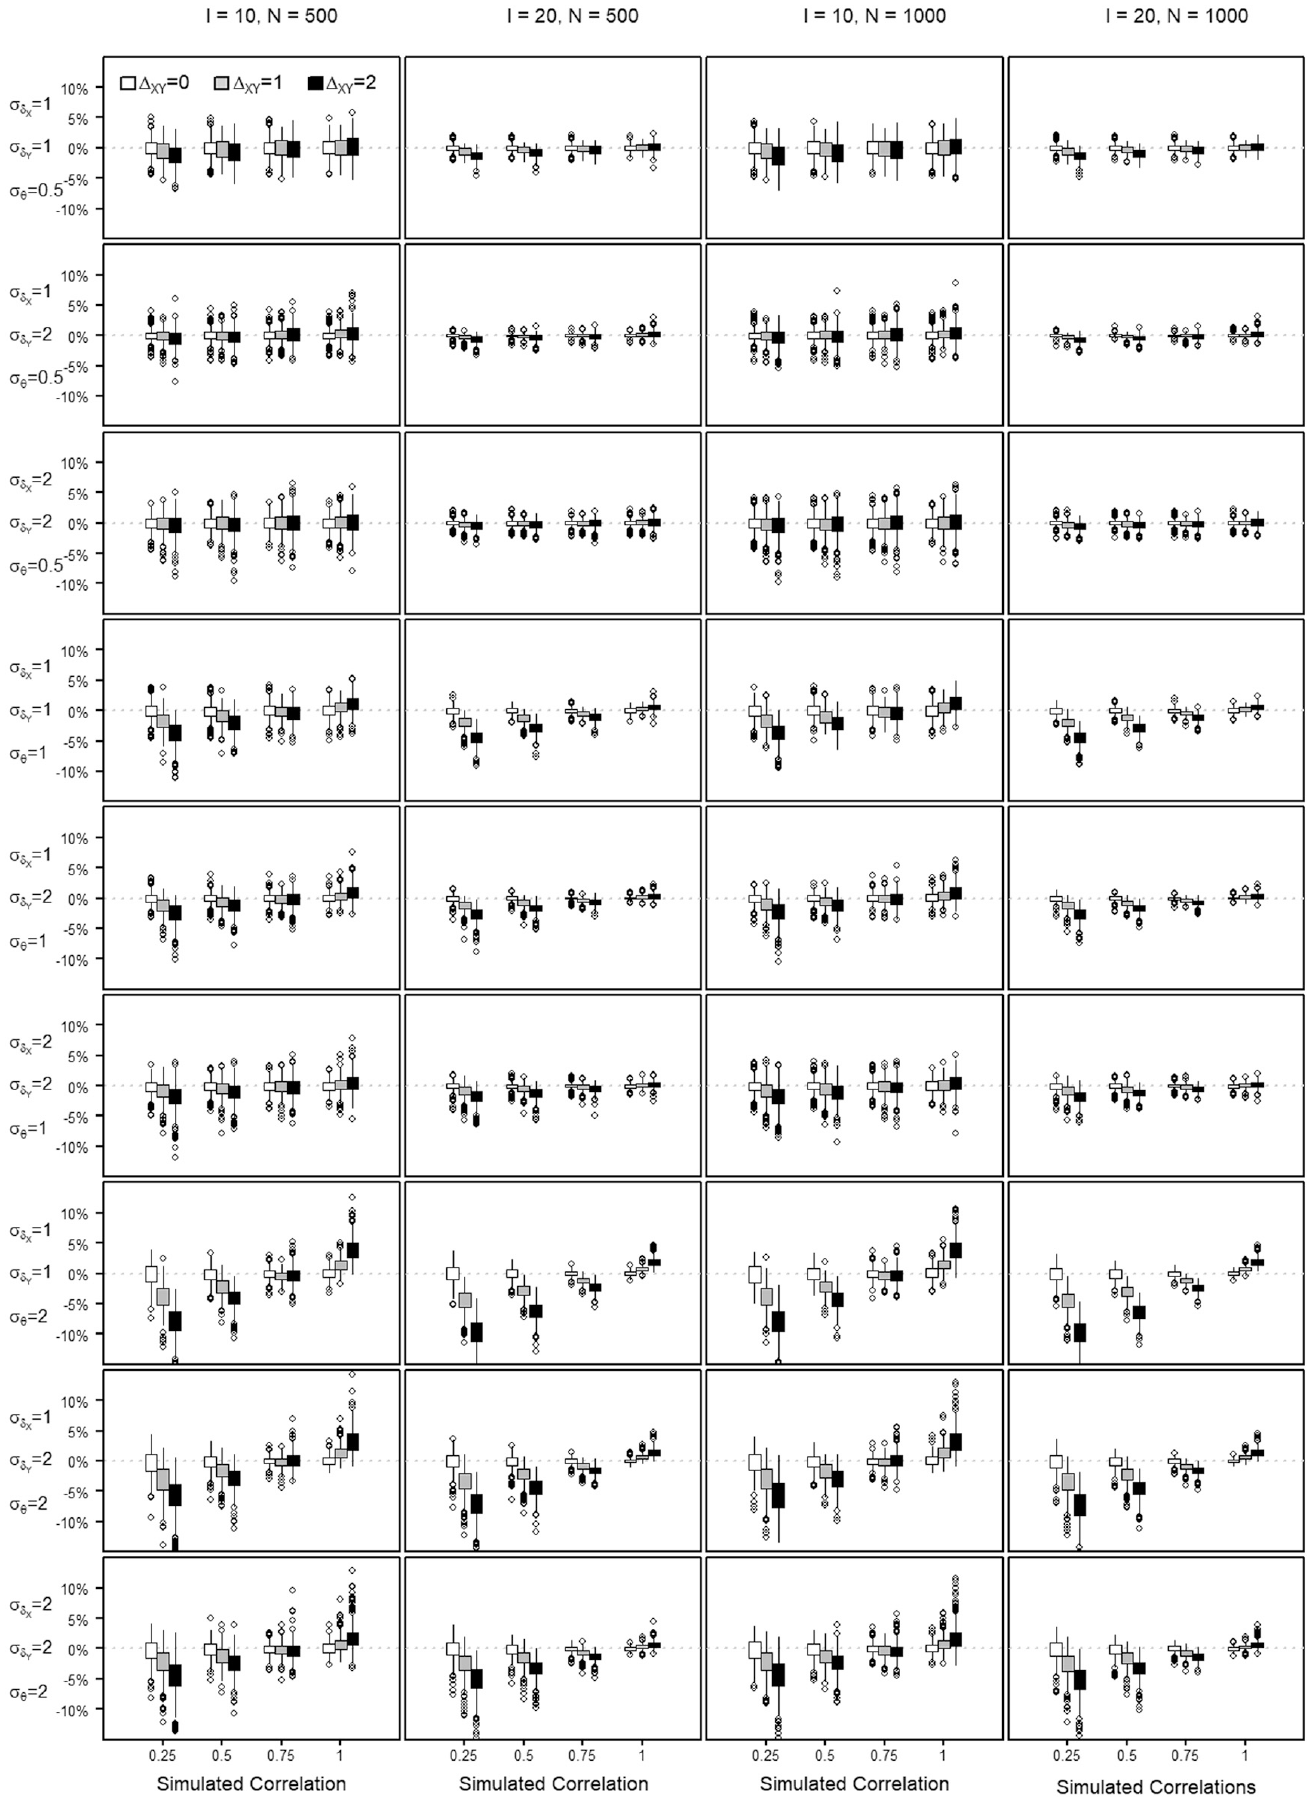
Percent Bias in Estimating the Score Transformation Precision From Scale X to Scale Y Across All Simulated Settings.
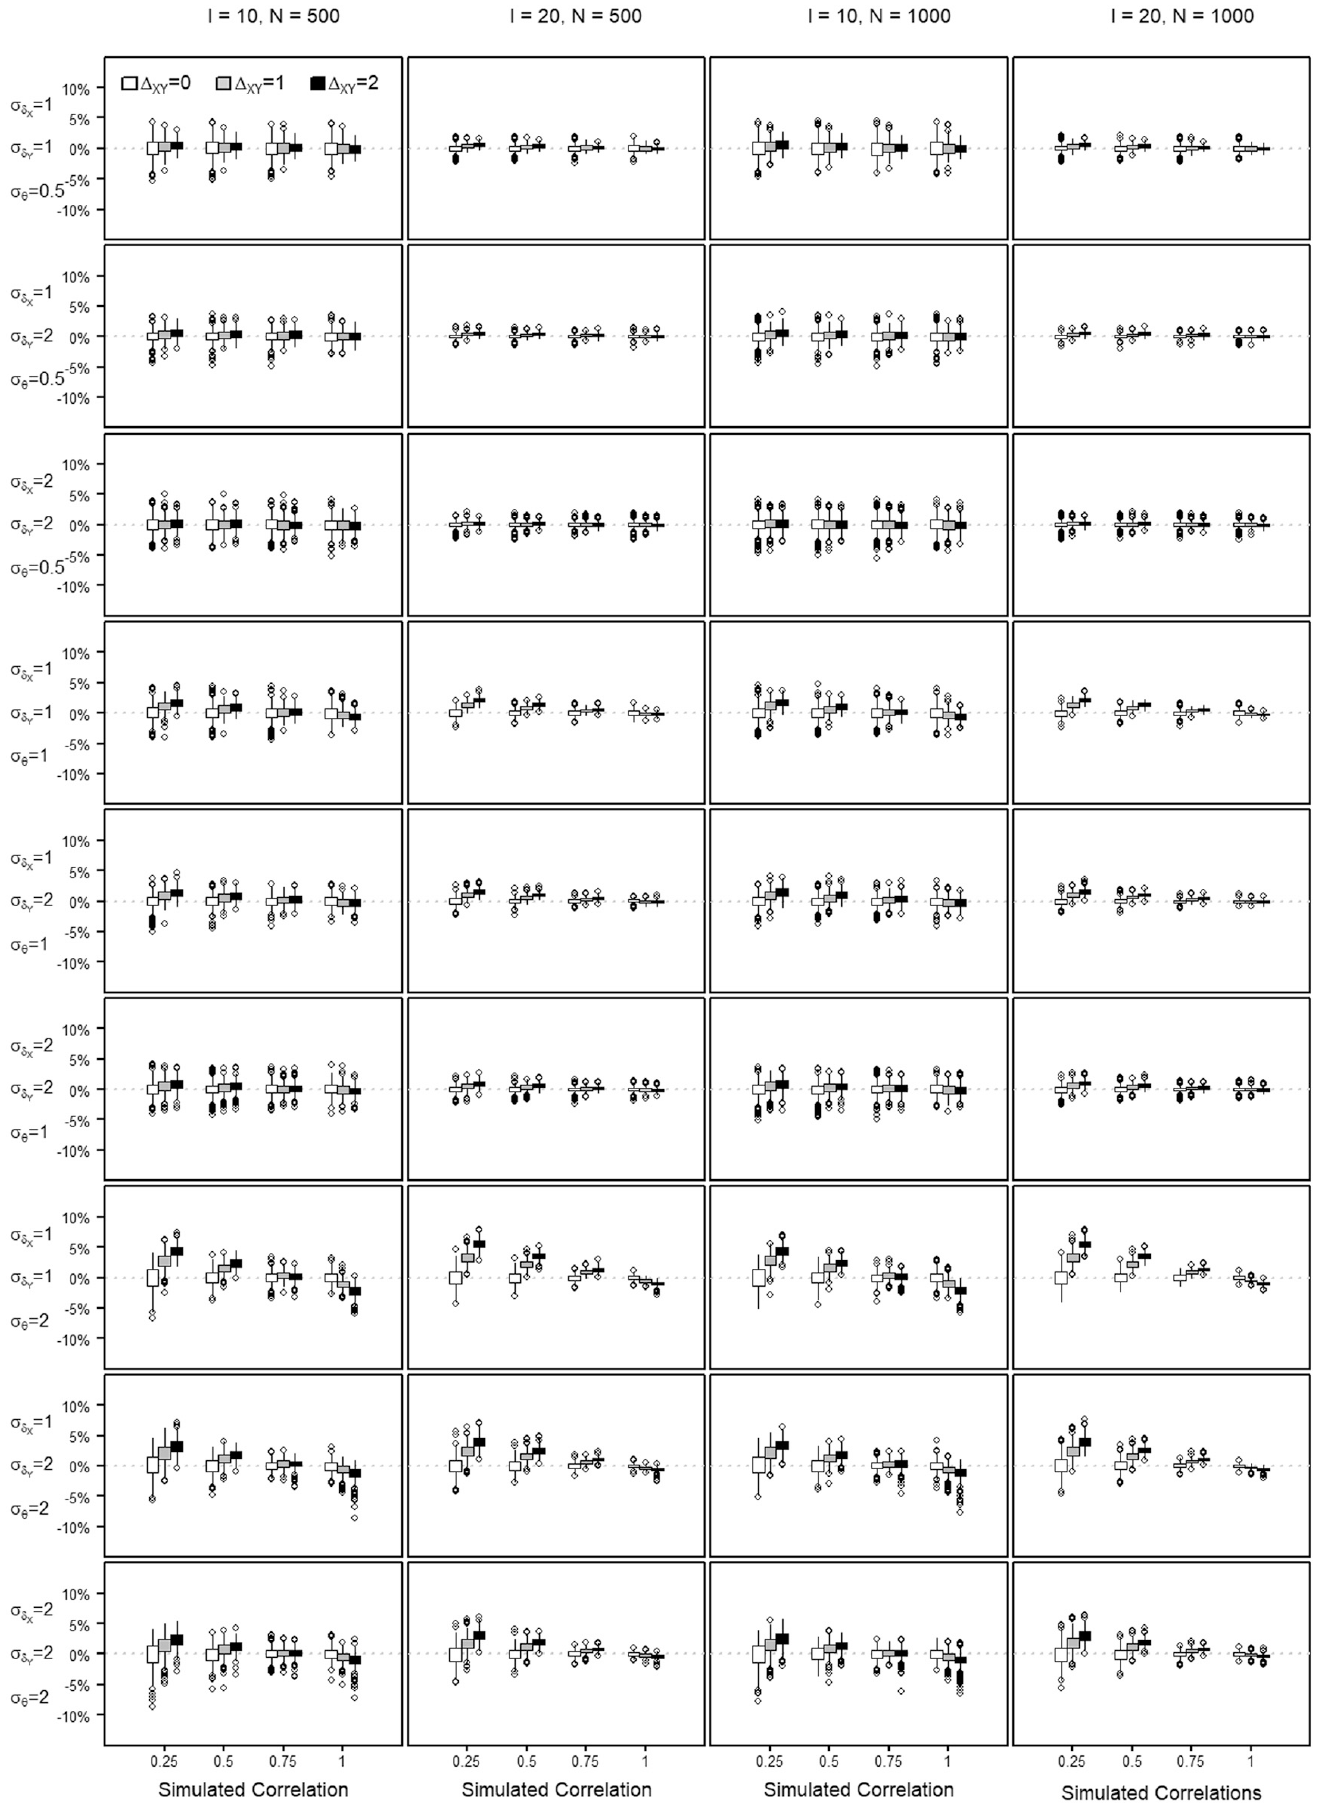
Percent Bias in Estimating the Score Transformation Precision From Scale Y to Scale X Across All Simulated Settings.
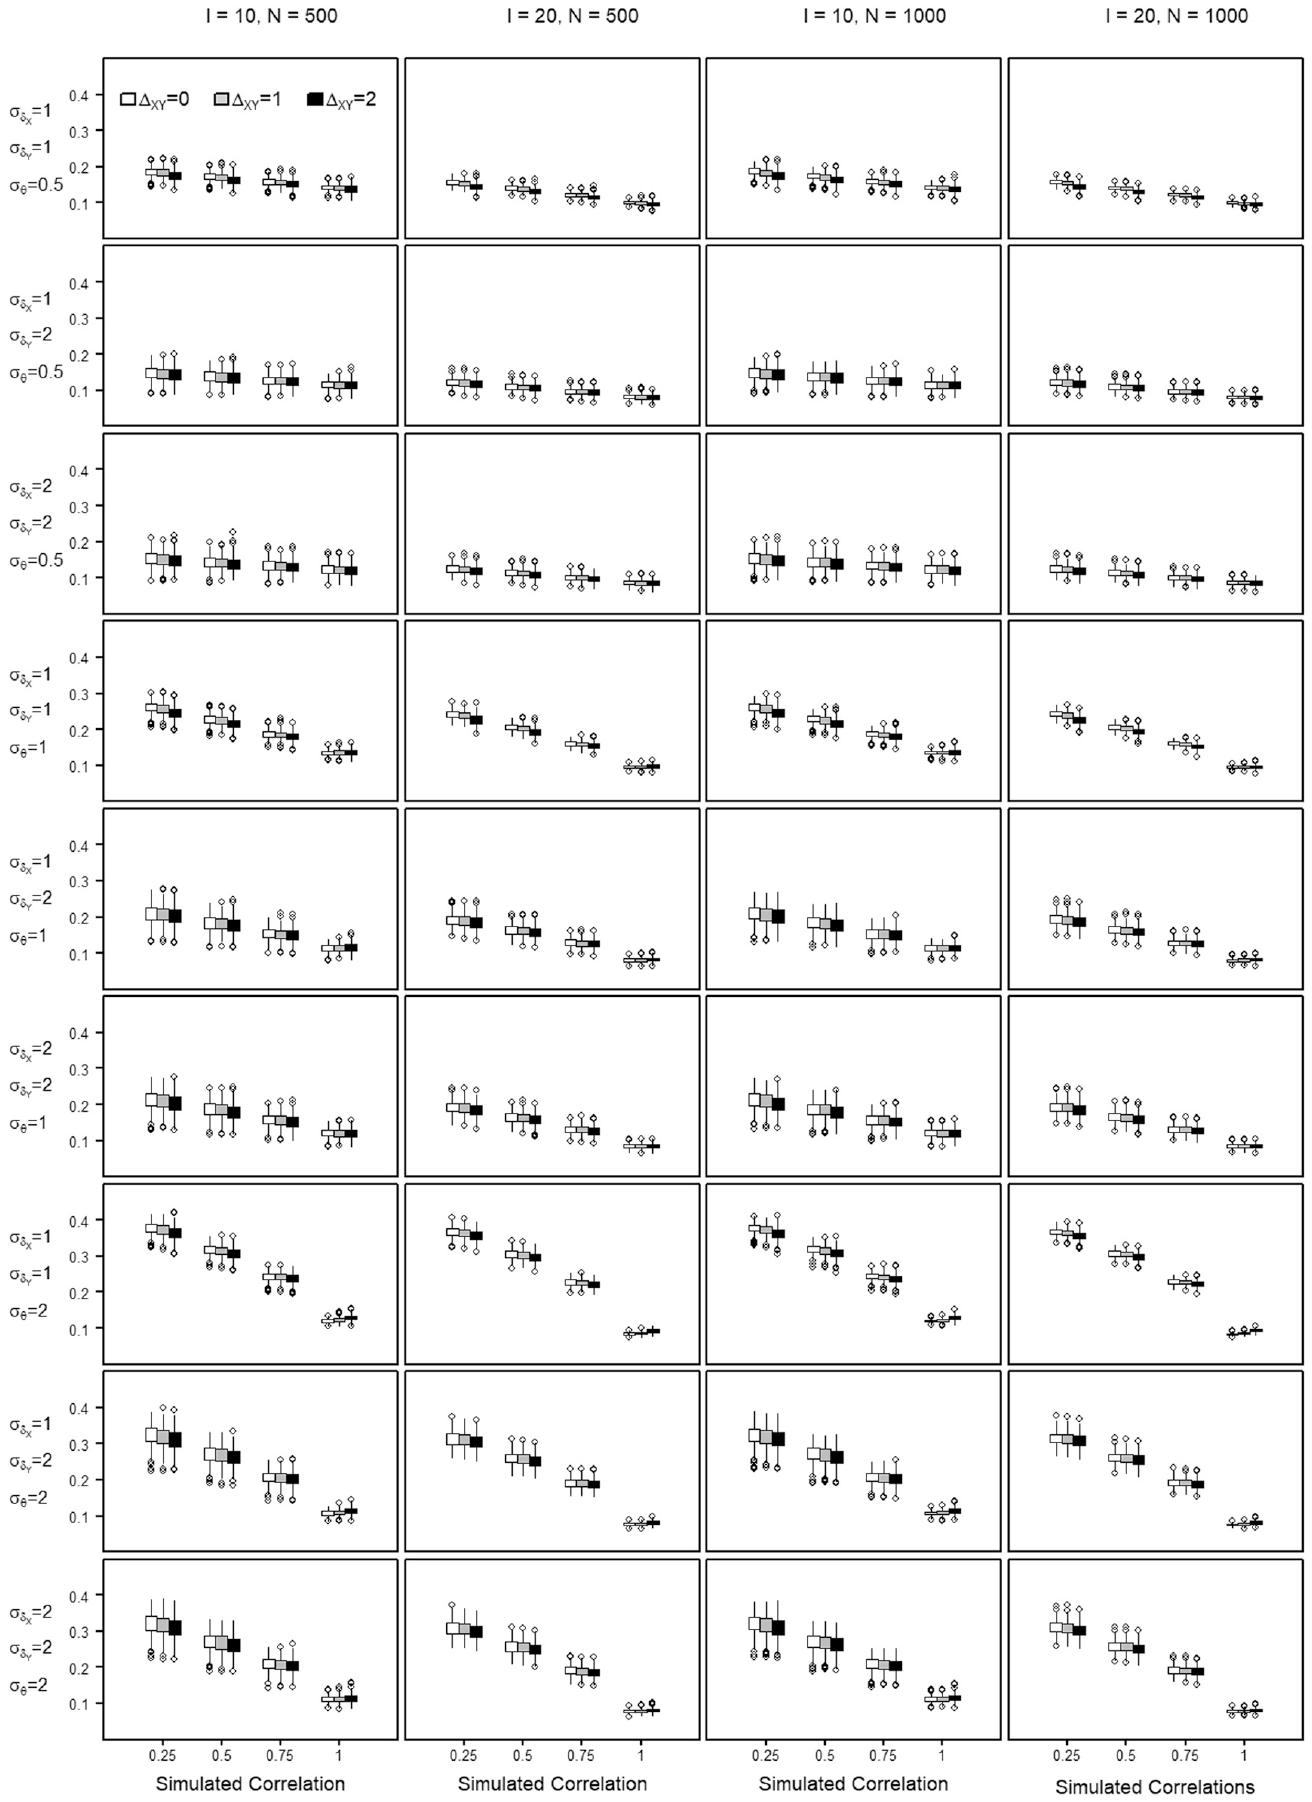
Normative Root Mean Square Error (NRMSE) in Estimating the Score Transformation From Scale X to Scale Y Across All Simulated Settings.
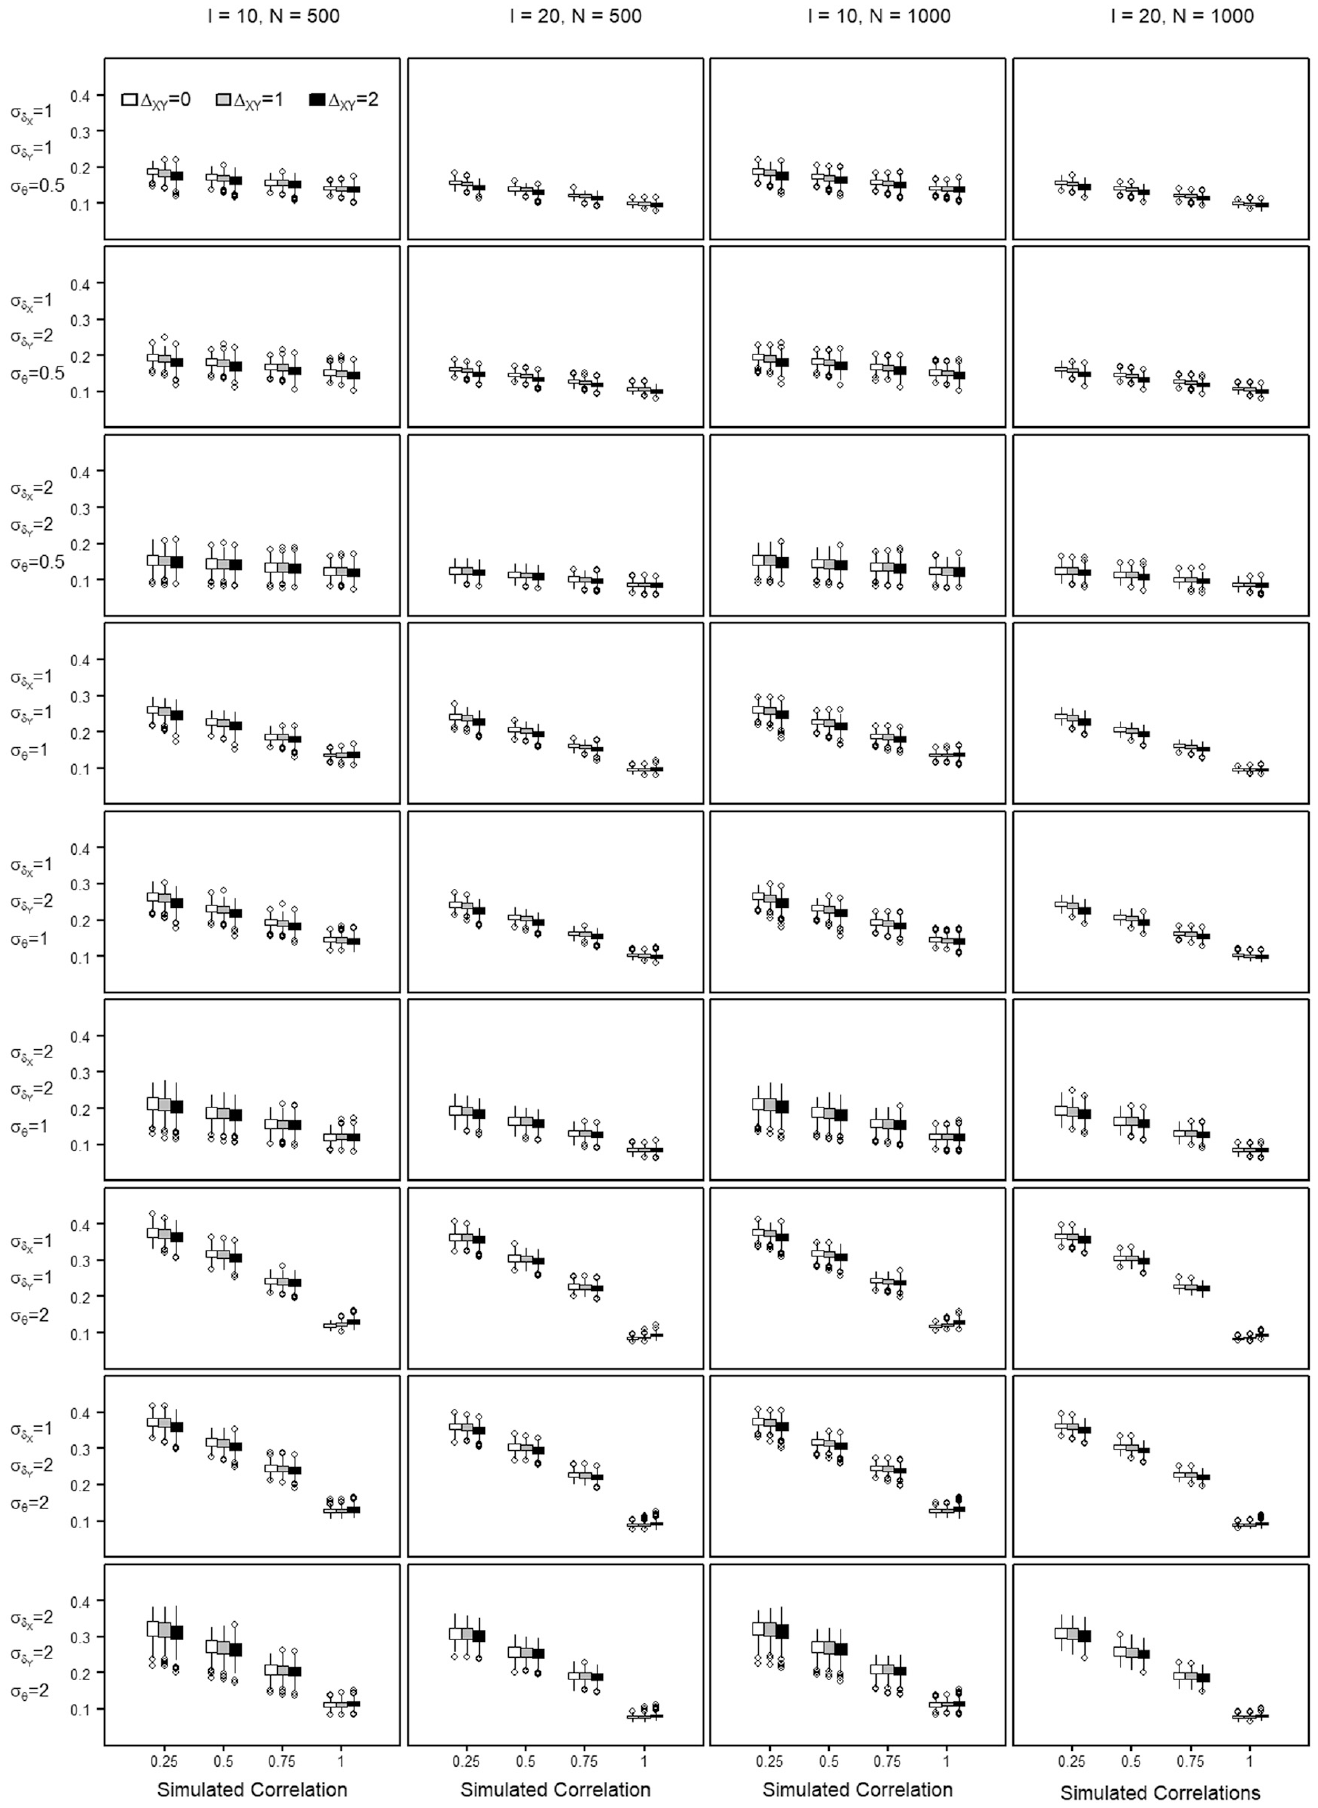
Normative Root Mean Square Error (NRMSE) in Estimating the Score Transformation From Scale Y to Scale X Across All Simulated Settings.
All quantiles for observed percent bias were below 10%, as seen in Figures 4 and 5. The figures show that the estimation bias is larger with less similar scales, especially when the dispersion of the
In what follows, the equating precision when transforming from Scale X to Scale Y is written as
In Figure 6, at
Of course talking about the average departure in the score transformation precision is a rough simplification. It is well known that the precision is not uniformly distributed across the score range of a scale but increases toward the extremes (as will be illustrated in Figures 8 and 9 in this regard).
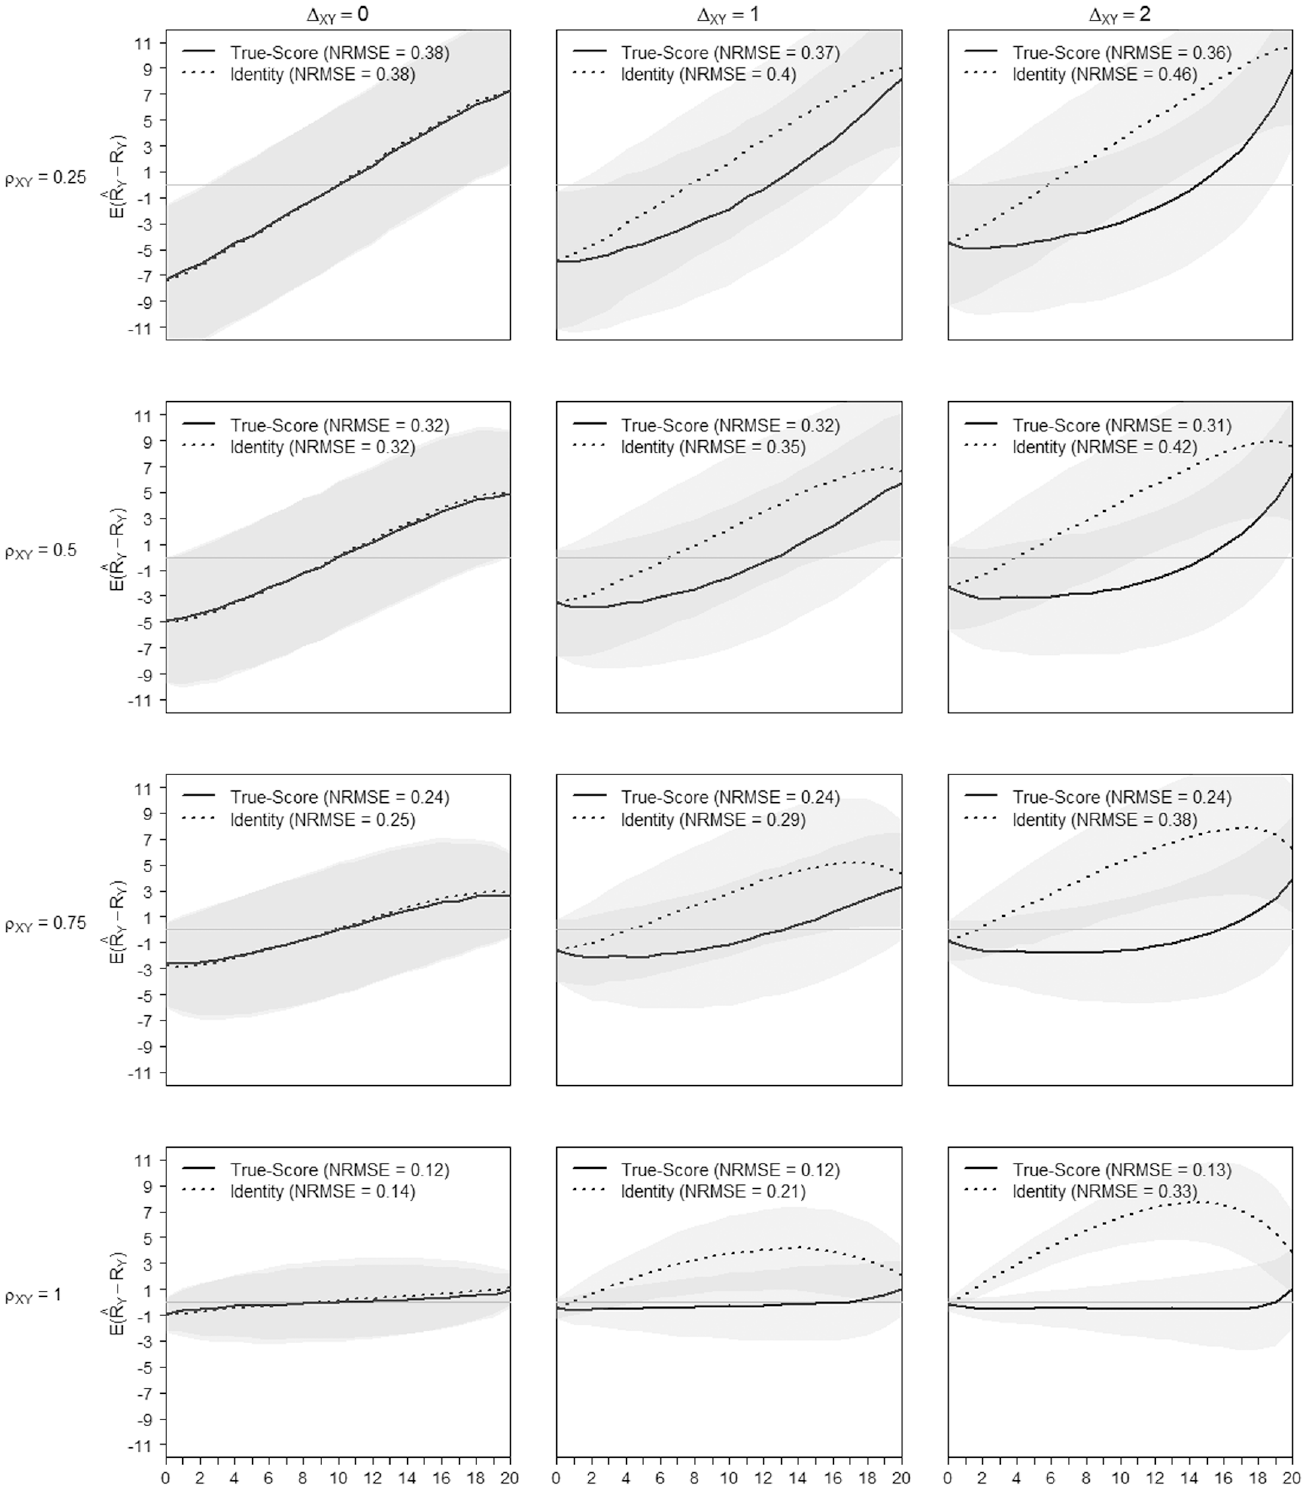
True-Score Versus Identity Equating of Scale X to Scale Y When
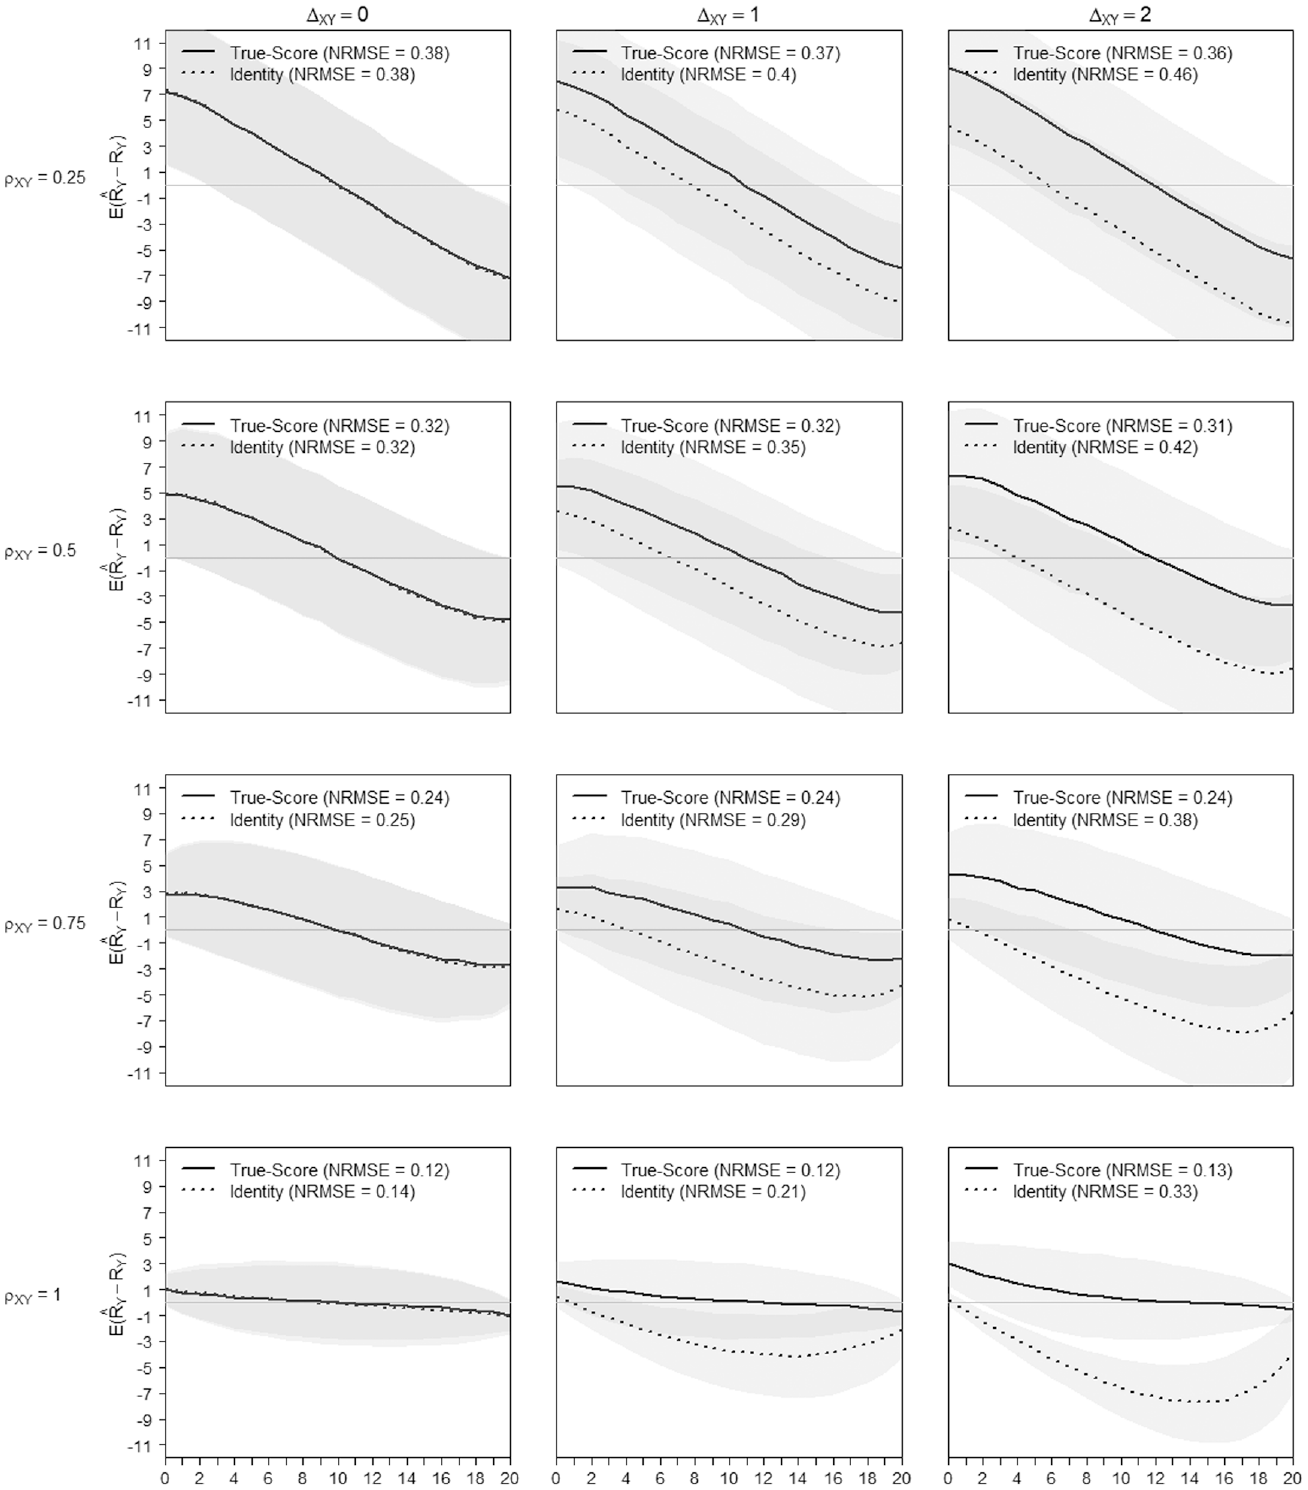
True-Score Versus Identity Equating of Scale Y to Scale X When
The positive effect of the high construct similarity on the precision of the score transformation is somewhat damped when transforming from settings with poor item-to-person targeting, where the
The NRMSE values are generally indicating better transformation precision with ability dispersions
Based on Figures 8 and 9, the difficulty shifts between scales did not impact the transformation precision noticeably (see also Appendix C in the Supplemental Online Materials, Table C.8 to Table C.11). What matters most to the quality of the equating is that scales, measuring a similar construct, encompass the ability spectrum of the test-taker. Figures 8 and 9 illustrate the precision of the score transformation on the score continuum and contrast the (gain of) precision of the true-score equating with an identity equating. The x-axis of Figures 8 and 9 presents the range of possible raw scores
Empirical Example
This example briefly illustrates how insights gained from the simulation study can be helpful for empirical studies where true-score equating with a common person design is conducted. This example will show how the statistical characteristics, especially the psychometric properties, of two test forms can enable researchers to appropriately anticipate the equating precision prior to the equating.
Data, Items, and Sampling
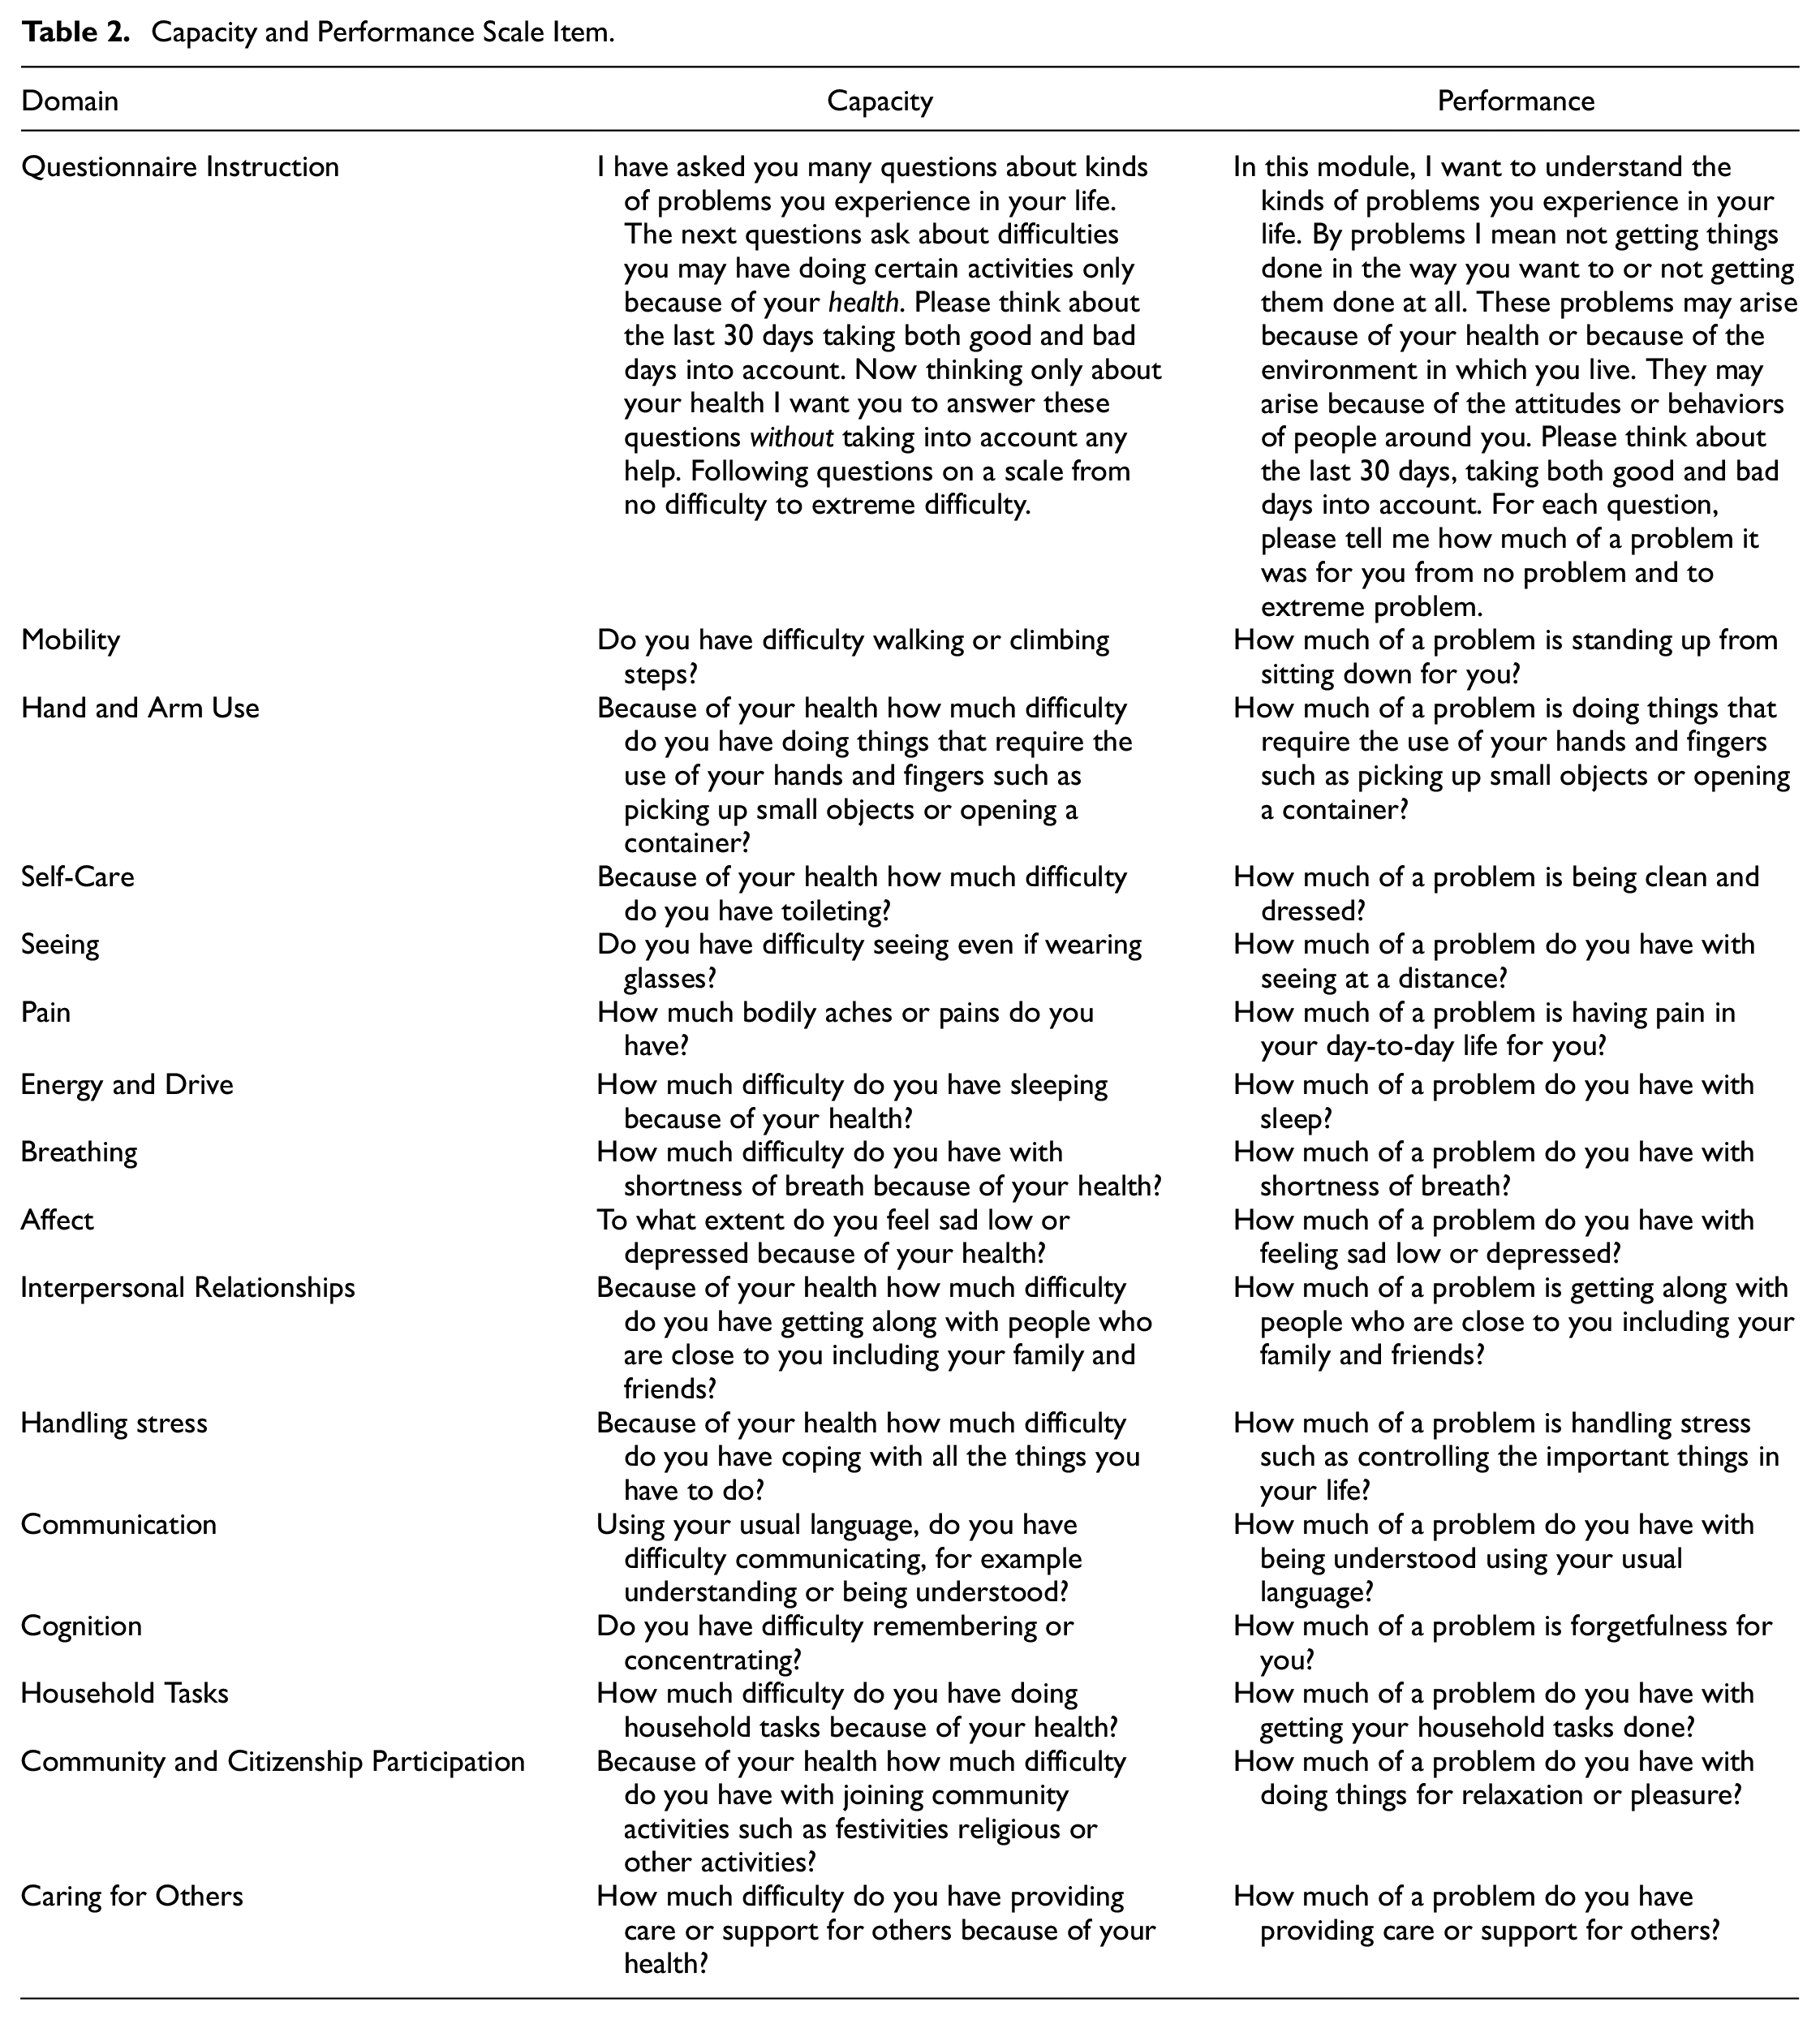
The data were kindly made available by the Asia Foundation, who conducted the World Health Organization’s and World Bank’s MDS in Afghanistan in 2019 in about 14,000 households (Sabariego et al., 2022; Shinwar et al., 2020). The MDS is generally used to collect information about health, functioning and environmental factors in the general population. Items from two MDS Modules were used for this example. One set of items is measuring health from a so-called capacity perspective (Module 5000) and the other set of items is measuring health from a so-called performance perspective (Module 4000). The items for the capacity metric ask about difficulties in daily life because of health problems. The items for the performance metric ask about the extent of problems the person experiences in daily life when also taking into account environmental factors that can be facilitating or hindering. Examples of environmental factors could be the attitudes and support of others, characteristics of the built environment (e.g., ramps), the availability of assistive devices (e.g., crutches) and home adaptations (e.g., wide doorways; World Health Organization, 2001). The response options indicate either increasing levels of difficulty (for the capacity) or increasing levels of problems (for the performance). For this example, the responses were recoded to represent three options—from no or mild difficulties/problems to extreme difficulties/problems—to ensure ordered thresholds.
Two scales of the same length were created for the purpose of this example (Table 2). The Performance Scale items of the MDS can be grouped into 16 functioning domains with one or more items per domain. For this example, the Performance Scale used the first item from each of the 16 functioning domains and 16 items from the MDS Capacity Scale that match the 16 domains of functioning assessed by the Performance Scale. The Capacity Scale presented two highly correlating items; the item assessing hearing and the item assessing communication. For simplicity, the item assessing hearing was removed so that the final Capacity and Performance Scales each counted 15 items respectively.
Capacity and Performance Scale Item.
For this illustrative example, we have selected two different groups of approximately N = 1,000 MDS participants. The first group was intentionally selected from the middle score range of the Capacity Scale and with scores covering the entire measurement continuum. In this first group, there was only a slight difference between the mean Capacity and the mean Performance scores for all participants (Figure 10). The second group, however, was selected to show a larger difference between the Capacity and the Performance mean scores, indicating that the participants in the second group had a more enabling environment, such as more social support, better living conditions, better infrastructures, or assistive devices.
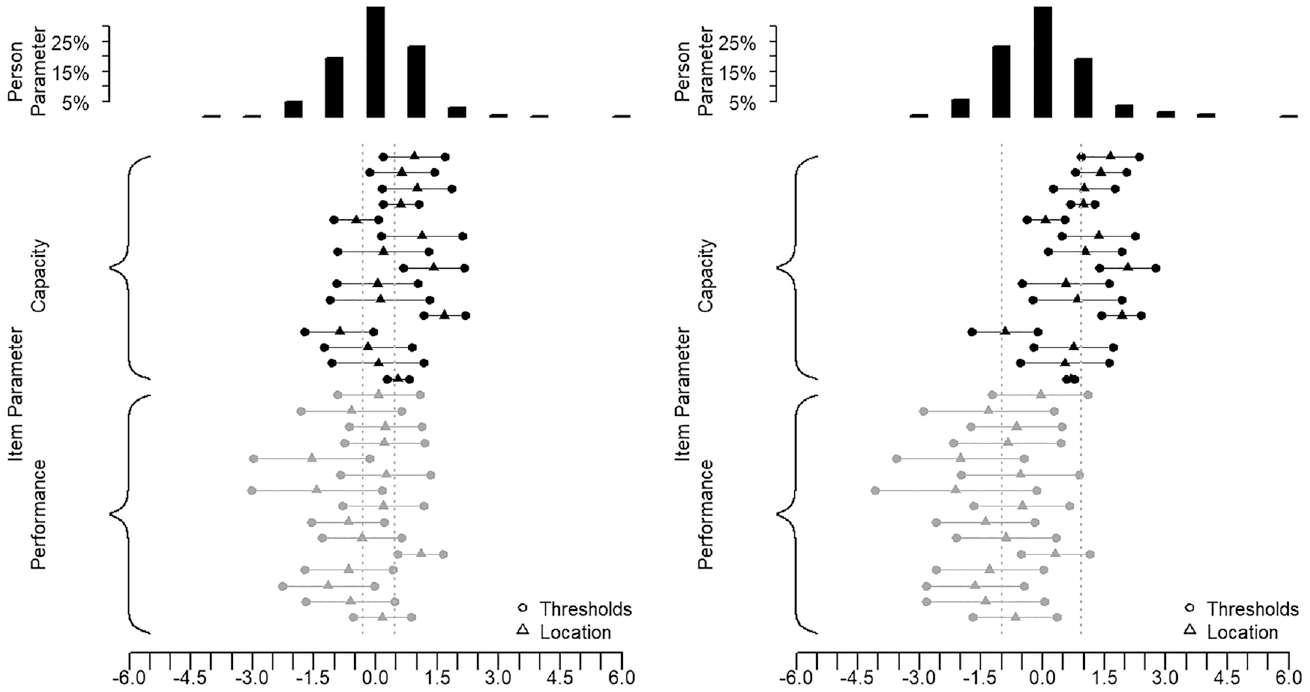
Targeting of Group 1 and Group 2.
Analysis Design
This example runs, for each group, through all the steps described in the simulation study to obtain equated scales by means of true-score equating in a common person design. It is expected that, if the separate analyses in Step A support good fit, the factor correlation (
Results
Table 3 presents the fit statistics for the Capacity and the Performance Scales, once with the group of participants selected from the middle score range and once with the group of participants with a lower Performance score, indicating higher functioning through a more enabling environment. The results of the analysis are interpreted as described in the PCM method section in Appendix A in the Supplemental Online Materials. Table 3 shows that for both groups the separate and anchored analyses of the scales yield items with ordered thresholds, good fit, and unidimensionality. The highest difference between observed and mean residual item correlation was 0.24, indicating a light dependency between a pair of items. In fact, the item about toileting and the item about hand use from the Capacity Scale had a higher residual correlation with
Results by Step for the True-Score Equating.
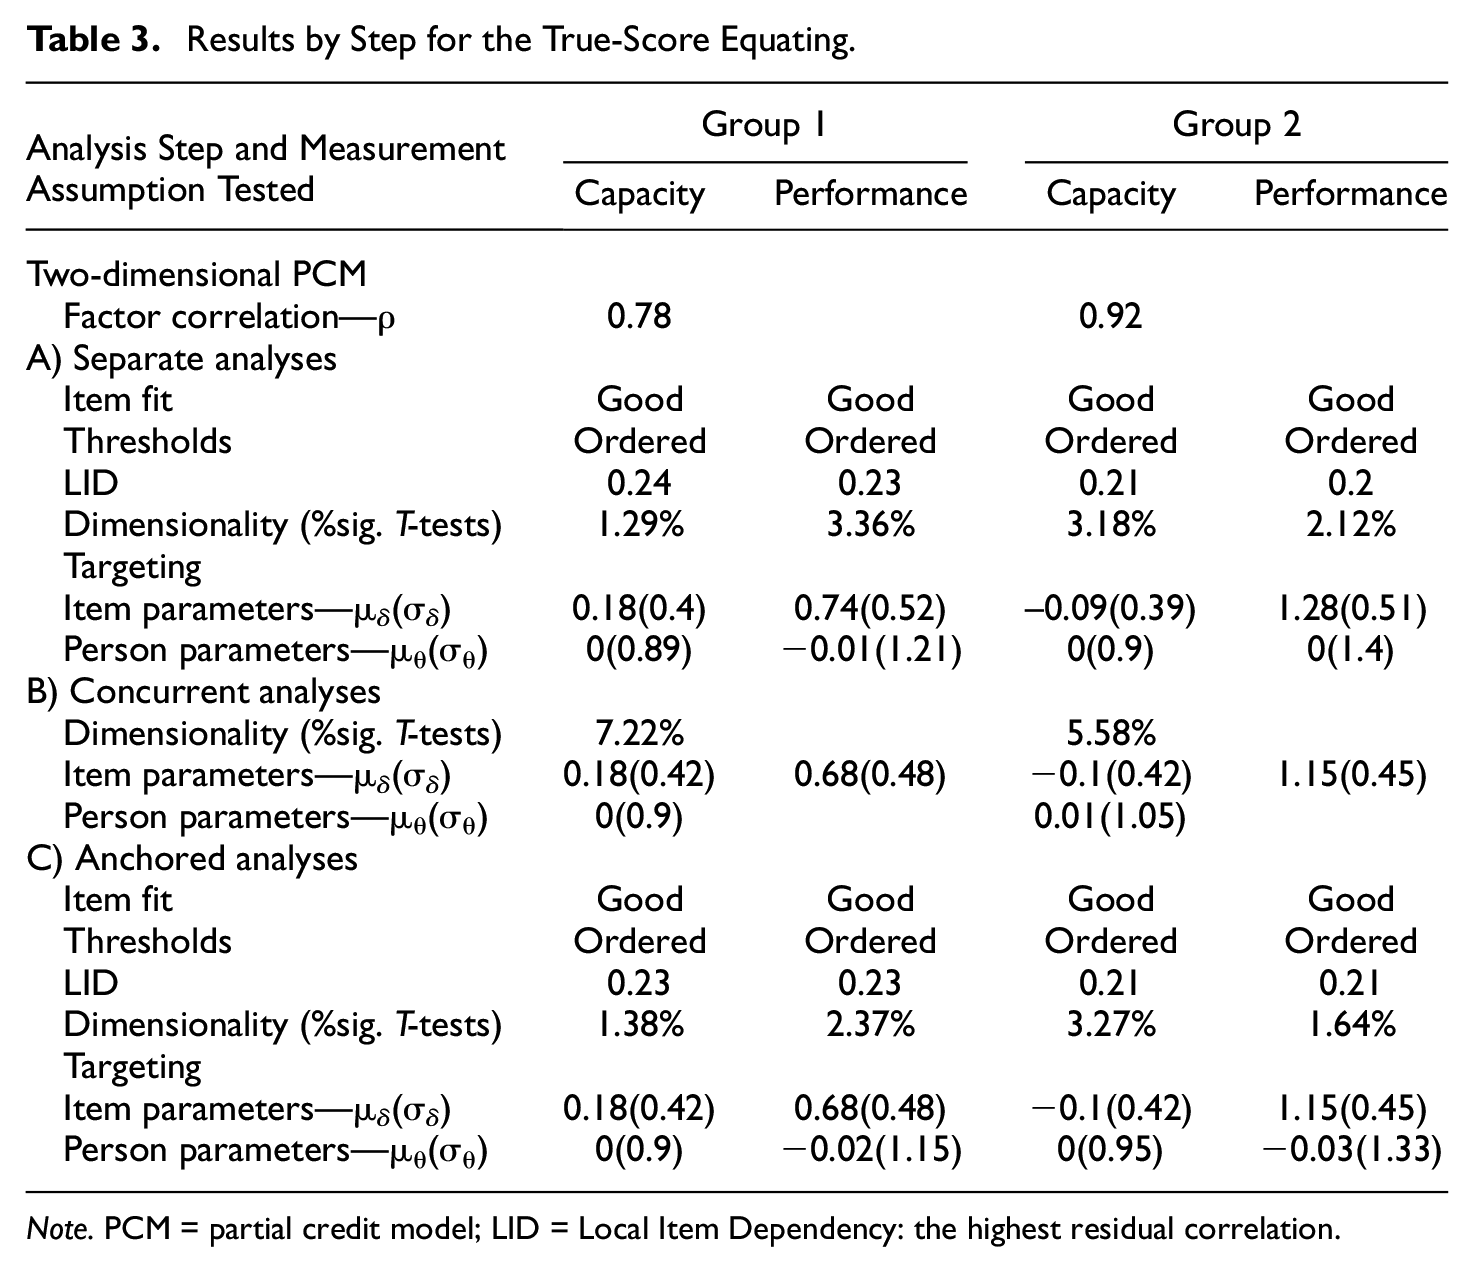
Note. PCM = partial credit model; LID = Local Item Dependency: the highest residual correlation.
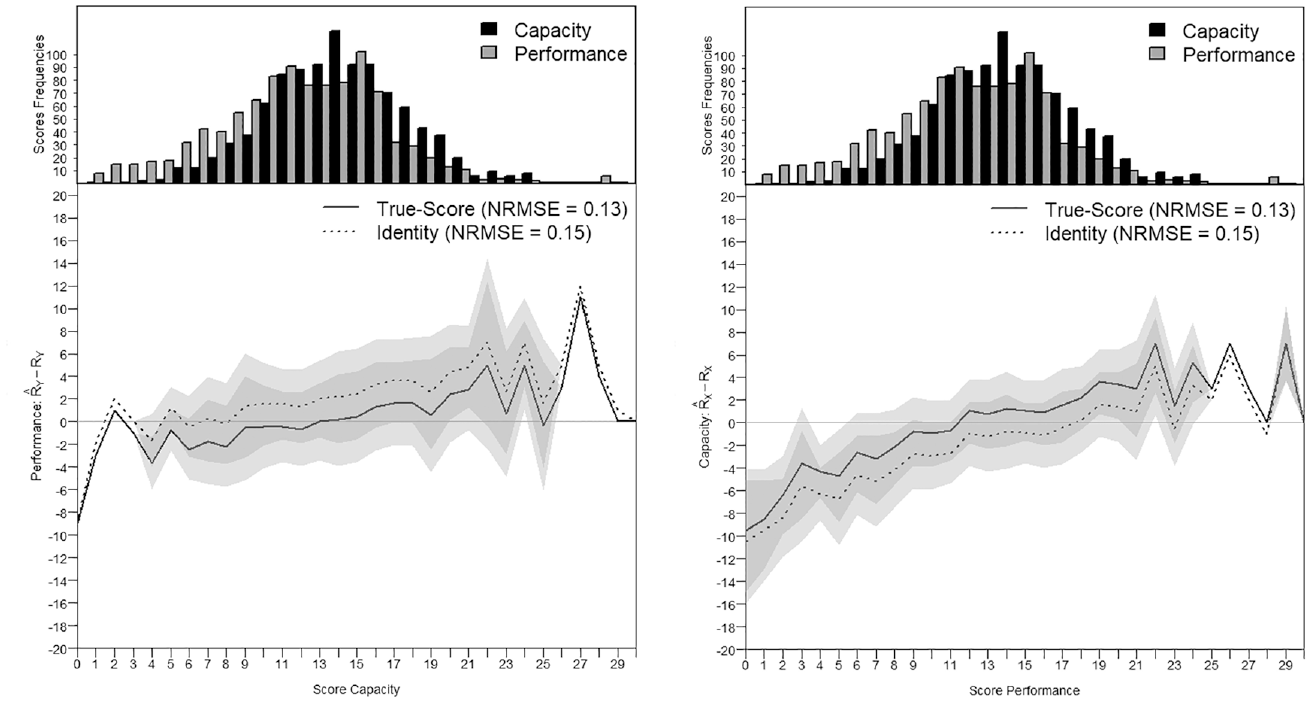
Score Transformation Precision From the Capacity to the Performance Metric and Reversely in Group 1.
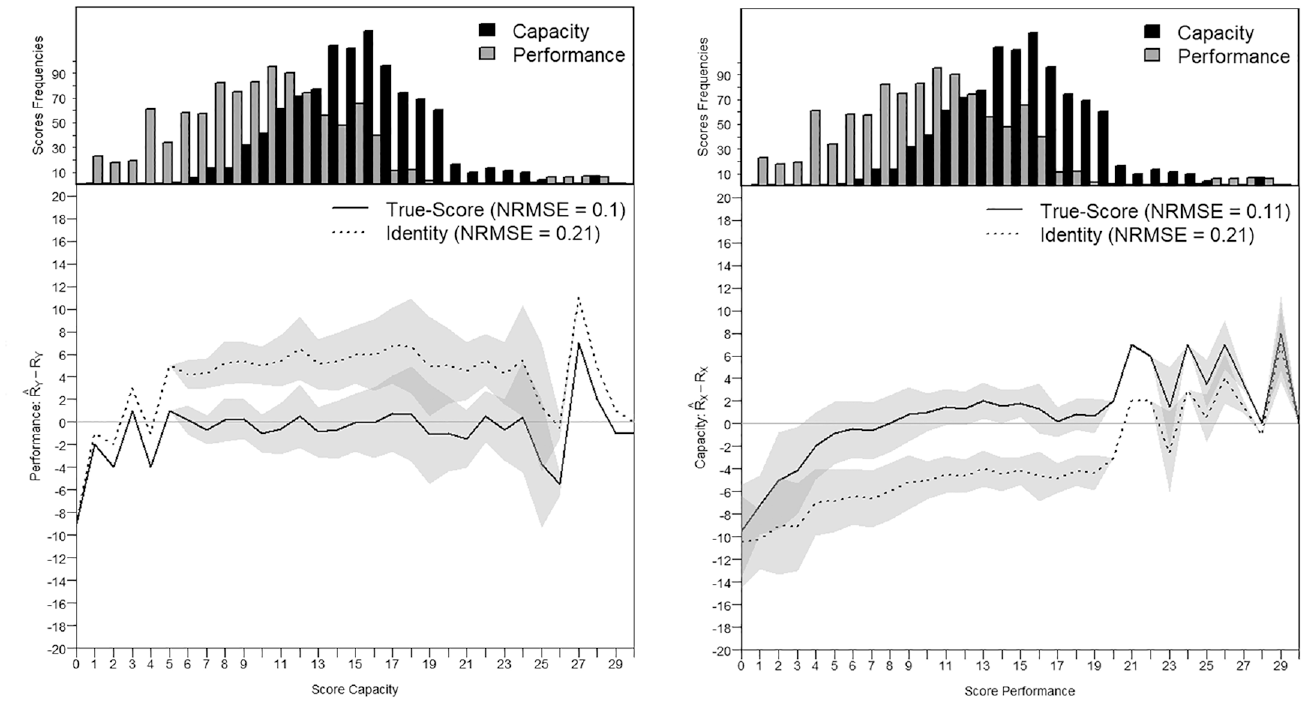
Score Transformation Precision From the Capacity to the Performance Metric and Reversely in Group 2.
In the first group, the factor correlation was
In the second group, the factor correlation was
Discussion
This simulation study supports that, when equating scales, construct similarity is essential for a good score transformation precision. The factor correlation between scales, in other words, their construct similarity, explained to a large extent the score transformation quality. Higher correlation goes along with better transformation precision. The importance of the scale similarity in equating is not surprising, but this study also shows the relevance of the targeting, something few other studies have investigated so far. The precision of the score transformations improves with good targeting, when the scales have a broad measurement scope that embraces the ability spectrum of the test-taker. With highest similarity, the quality of the targeting did not have any notable impact on the transformation quality. With lower similarity of the scales, however, the impact of insufficient targeting was reinforced and further deteriorated the transformation precision. For a given
With diminishing correlation between dimensions, the equated scales become more dissimilar, negatively affecting the score transformation precision. Hart et al. (2006) remarked that strict unidimensionality and local independence are difficult to achieve in practice and that generally scale developers aim for “essential unidimensionality” (Hays et al., 2000). Studies interested in testing the effect of the degree of similarity between scales in scale equating, especially under various equating strategies, can be found in the literature (Bolt, 1999; Brossman & Lee, 2013; Hanson & Beguin, 2002). Studies investigating effects of within-scale dimensionality on equating are also found (Kim et al., 2019; Yen, 1984). Our study only focused on the similarity of the two scales to be equated, that is, the between-scale dimensionality.
When observing equating in practice, similarity of the scales is often an implicit assumption that transfers into practice as a subjective evaluation of what the scales to equate are aiming to assess. Unidimensionality, or sufficient unidimensionality for a robust score transformation is not sufficiently supported by only assuming that scales measure a common latent trait. As mentioned in the introduction, also characteristics of the assessment, such as for example the response options or the general phrasing of the scale items, can strongly affect the degree of similarity of scales.
In practice, the validity of a transformation rule between equated scales is often assumed if the single and equated scales fit the Rasch model but is rarely discussed in terms of transformation precision. We recommend always testing the between-scale dimensionality, for example by means of multidimensional Rasch analysis, which provides a tangible value of the degree of association between two scales. Good psychometric properties of the scales to be equated are not a sufficient guarantee for good score transformation precision. The separate analyses of the scales in this simulation presented generally acceptable to good psychometric properties. But, despite otherwise good psychometric properties, already with factor correlations of 0.75, the quality of a score transformation is negatively impacted, with average score departures up to
Studies reporting the degree of associations are rare, and critical cut-off values for judging the degree of association are missing with no consensus on what is sufficient unidimensionality (Martin et al., 2007). The empirical example showed that the precision of score transformations can be anticipated to some degree by knowing the targeting and similarity of the scales to equate. The NRSME values found in the simulation can be expected to provide estimates on the degree of departure in real data contexts with scales presenting similar psychometric properties as those simulated in the study. The loss of precision that researcher or clinicians are willing to accept also depends very much on the purpose of the assessment. More precise equating would be expected for clinical measurement at individual level than for measurement at population level, for example.
When the unidimensionality between the equated scales does not hold, alternative strategies that could be applied in practice are only marginally discussed in the literature. For example, multidimensional equating procedures exist (Hirsch, 1989; R. D. Gibbons et al., 2014). Also, in the presence of multidimensionality, testlet approaches are often applied. In testlet-based equating, also called score co-calibration, the raw scores of the scales are submitted to a concurrent calibration instead of the items (Surla, 2020). Unidimensional true-score equating was applied here, as the method is commonly applied in practice and probably more accessible when equating with the Rasch model in a common person design. It would be worthwhile to compare the score transformation precision of these alternative procedures with the unidimensional true-score, item-based equating approaches when the construct similarity is challenged.
In the research literature, the effects of targeting are more widely studied in terms of differences in difficulty across equated scales than in terms of differences in the degree of dispersion of the
Drawing strong conclusions based on this simulation with a limited number of settings should be considered with caution, as for any simulation study. Only some assessment characteristics have been varied and observed systematically within a limited range. The sample sizes used in this study are representative for the health research field where equating studies are the most commonly undertaken. However, health assessment can also take place as part of national or international surveys in the general or more specific populations providing larger health data pools. The number of response options and the discrimination of items were kept constant to avoid disordering of thresholds and item misfit, as these were out of the research scope. More than three response options could have been considered. Measurement scales with more than five response options are not uncommon and are known to result in a more refined assessment (Preston & Colman, 2000). To be fair, more response options typically also go along with response threshold ordering issues. In that sense, this simulation only used well-behaved items, producing an uncommonly optimal equating situation. Threshold disordering and item misfit, in practice, would require undertaking actions to improve the metric and its compliance to the Rasch model, for example, through deletion of misfitting items and collapsing of the disordered response categories (Salzberger, 2015; Tennant & Conaghan, 2007). In an extensive simulation, addressing and solving these issues individually for each simulated equating setting was not feasible. Many more aspects that are relevant in applied psychometrics could be varied and would have further increased the generalizability of this simulation study. For example, locally dependent items, items with differential item functioning, within-scale multidimensionality, unequal score ranges across scales, or even smaller sample sizes, can all be expected to moderate the score transformation precision across equated scales and could be investigated in future studies.
This simulation study has also several strengths. Many methodological equating studies use existing data or simulate data that are conditioned on parameters derived from analyses with the existing data instead of generating data following a simulation design. Real data or simulations conditioned on actual parameters describe realistic data collection settings. However, the generalizability of findings of such studies may be diminished and confined to settings with similar characteristics. Artificial data generate and target effects precisely through a standardized setting. Through the R environment (R Core Team, 2020), this study could automatize the simulation of data controlling for the degree of similarity between scales and the characteristics of the distributions of the
Conclusion
This study showed that when observing similarity, equity and targeting of scales, the similarity was the most important determinant of equating precision. Similarity indicates that scales measure a common construct. The targeting of the scales also affected the precision of the equating, with a moderating effect and increasing impact when the similarity of the scales decreased. Differences in difficulty across scales had no notable effect on the precision of score transformations across equated scales for true-score equating. In that sense, the requirement for equity in true-score equating may not be a strong requirement when difficulty shifts are below two logits. This simulation study highlights the effects of scale characteristics and departures from similarity and suggests ways to improve the quality and transparency of the equating procedure, such as the assessment of the factor correlation by means of the multidimensional PCM and an analysis of the transformation precision. According to Andrich (1988), who stated that at some level of precision any construct is undimensional, we sense a danger in a purely subjective or qualitative evaluation of the similarity of constructs to be equated. Beyond fit statistics, equating studies using the true-score equating approach would benefit from reporting the dimensionality of the concurrent calibration of scales and questioning the similarity of the equated scales objectively. Based on the findings of the simulation study and the empirical example, it can be expected that information on the distribution of person and item parameters, and the similarity of the two scales, would allow to appropriately anticipate the equating precision prior to the equating.
Supplemental Material
sj-pdf-1-epm-10.1177_00131644221143051 – Supplemental material for What Affects the Quality of Score Transformations?
Supplemental material, sj-pdf-1-epm-10.1177_00131644221143051 for What Affects the Quality of Score Transformations? by Carolina Fellinghauer, Rudolf Debelak and Carolin Strobl in Educational and Psychological Measurement
Footnotes
Acknowledgements
We are grateful to Tabasum Akseer from the Asia Foundation for releasing the MDS data for our study.
Declaration of Conflicting Interests
The authors declared no potential conflicts of interest with respect to the research, authorship, and/or publication of this article.
Funding
The authors received no financial support for the research, authorship, and/or publication of this article.
Supplemental Material
Supplemental material for this article is available online.
References
Supplementary Material
Please find the following supplemental material available below.
For Open Access articles published under a Creative Commons License, all supplemental material carries the same license as the article it is associated with.
For non-Open Access articles published, all supplemental material carries a non-exclusive license, and permission requests for re-use of supplemental material or any part of supplemental material shall be sent directly to the copyright owner as specified in the copyright notice associated with the article.