
Abstract
Factor score regression has recently received growing interest as an alternative for structural equation modeling. However, many applications are left without guidance because of the focus on normally distributed outcomes in the literature. We perform a simulation study to examine how a selection of factor scoring methods compare when estimating regression coefficients in generalized linear factor score regression. The current study evaluates the regression method and the correlation-preserving method as well as two sum score methods in ordinary, logistic, and Poisson factor score regression. Our results show that scoring method performance can differ notably across the considered regression models. In addition, the results indicate that the choice of scoring method can substantially influence research conclusions. The regression method generally performs the best in terms of coefficient and standard error bias, accuracy, and empirical Type I error rates. Moreover, the regression method and the correlation-preserving method mostly outperform the sum score methods.
Keywords
Introduction
In the social and psychological sciences, interest often lies in modeling relationships that involve factors. Factors are latent variables that can be inferred by the use of manifest variables, for example, questionnaire items. Common examples of factors are the Big Five personality traits, quality of life, and socioeconomic status. Structural equation modeling (SEM) is a popular tool for evaluating factor structures. The strength of SEM is its ability to consistently estimate latent variable relationships. However, because of simultaneous estimation, SEM is sensitive to bias from model misspecification and may require large samples. These drawbacks have motivated the development of alternative approaches. One such alternative is factor score regression (FSR), which has recently seen growing research interest (Hayes & Usami, 2020).
Unlike SEM, FSR is a stepwise approach to estimating factor structures. First, relationships between manifest variables and factors are estimated in a measurement model. Factors are then related to a latent or observed outcome in a regression model. Numerical values that serve as input to the regression model must be assigned to the factors. Factor score estimates are calculated for this purpose, indicating the estimated relative position of an observation on the factors (Grice, 2007). Estimated factor scores can be obtained in mainstream statistical software as they are routinely used in scale construction and as input to other statistical methods.
A sometimes overlooked fact, which is known as factor score indeterminacy, is that theoretical factor scores are not unique. In short, infinitely many sets of factor scores are consistent with a given measurement model because it is algebraically underdetermined. Various factor scoring methods, which handle the indeterminate part of factor scores differently, have been proposed. Unfortunately, recommendations on the choice of scoring method when estimating FSR models are still limited.
Another limitation of the FSR literature is the exclusive consideration of normally distributed outcomes. This is problematic because applications with other outcome types are left without theoretical guidance and justification. The generalized linear modeling framework can account for many outcome types encountered in practice. Results on the performance of scoring methods in generalized linear FSR (GLFSR) have not yet been presented in the literature.
This article compares the performance of four factor scoring methods 1 when estimating GLFSR models. Focus is restricted to the case of normally distributed manifest variables, factor score estimates as independent variables, and an observed outcome that is either continuous (normally distributed), binary, or a count variable. In contrast to previous research, both homogeneous and heterogeneous loading structures as well as different degrees of interfactor correlation are considered. A selection of frequently applied scoring methods are evaluated, 2 namely the regression method (Thomson, 1934; Thurstone, 1935), the correlation-preserving method by Ten Berge et al. (1999), and the total sum method and the weighted sum method described in, for example, Distefano et al. (2009). The performance of the correlation-preserving method and the sum score methods have received only limited attention in the literature on FSR methods, warranting an explicit evaluation in the current study. Evaluations are done by performing a meta-analysis on simulated data.
The rest of the article is organized as follows. First, we define the measurement model, factor scoring methods, and the regression model. Second, the simulation study design is delineated. Third, a presentation of the simulation results is provided. A discussion of the results concludes the article.
Factor Measurement
The Measurement Model
Confirmatory factor analysis can be used to define factors through a set of manifest variables. The measurement model is defined in this article as

where
The matrices

The vector
Factor Score Indeterminacy
The measurement model is underdetermined because the number of factors and measurement errors exceeds the number of manifest variables. To see how this affects the assignment of numerical values to factors, define the block matrix

in line with Rigdon et al. (2019a), and note that

When

Factor scores in this case consist of a determinate part
Higher degrees of factor score indeterminacy allow for larger possible differences among sets of “true” factor scores consistent with Equation 4 (Guttman, 1955). Thus, in settings with highly indeterminate true factor scores, the validity of factor score estimation can be put into question. While factor score indeterminacy, which depends on, for example, overall loading levels (Rigdon et al., 2019a) and interfactor correlations (Rigdon et al., 2019b), does not directly influence the estimation of parameters within the measurement model, high degrees of this phenomenon translate into high degrees of indeterminacy in correlations between factors and variables outside the measurement model (Steiger, 1979). Therefore, factor score indeterminacy can severely affect conclusions about the relationship between factors and an external outcome variable.
Factor Scoring Methods
The Regression Method
Let

Skrondal and Laake (2001) showed that the regression score estimator produces asymptotically unbiased regression coefficient estimates when the outcome variable is observed. However, Devlieger et al. (2016) found that this result is valid only when using a reference-variable approach to assign factor variance scales. The simulations by Lastovicka and Thamodaran (1991), which used the unit-variance approach, support this claim. The authors found biases in estimated regression coefficients, which grew smaller when the overall variance explained in manifest variables grew larger. Thus,
The Correlation-Preserving Method
The correlation-preserving score estimator

Other correlation-preserving score estimators exist in the literature. For example, Anderson and Rubin (1956) developed a score estimator for orthogonal factors, which was generalized to an arbitrary
The literature is mainly focused on
Sum Score Methods
Sum score methods have been understudied in the FSR literature, partly because these methods are less sophisticated approaches and are expected to have poorer performance than other scoring methods. Sum scoring is regularly encountered in practice because of its simplicity, which motivates an explicit comparison of this class of factor scoring methods together with more sophisticated approaches.
The total sum method and the weighted sum method are considered in this article. The total sum score estimator is defined as

A drawback of

Note that one expects the performance of
The Regression Model
Suppose that a set of factors

The link function
Maximum likelihood estimation can be applied to estimate

where

Thus,
Study Design
Simulation Parameters
A simulation study was performed to compare the factor scoring methods in GLFSR. The simulation parameters are presented in Table 1. A total of 1,000 replications were made for each specific condition. A total of 3,780 conditions were considered in this article.
Simulation Parameters.
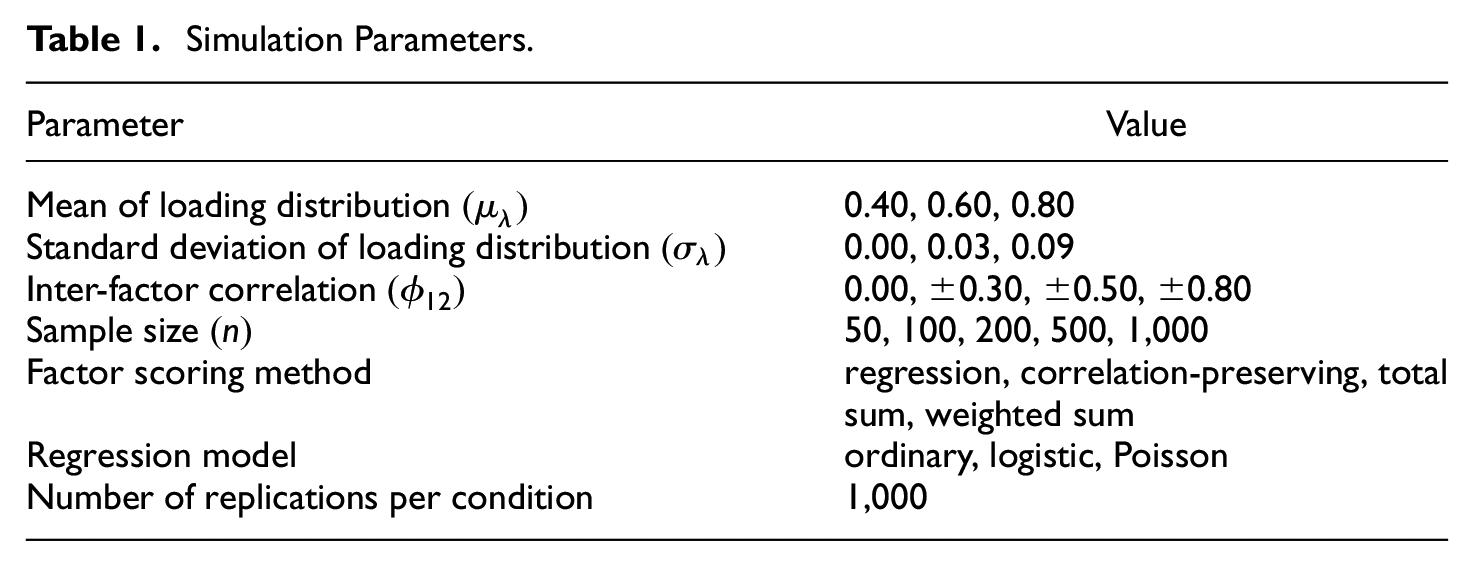
The Loading-Generating Distribution
Loading coefficients are often assumed to be equal in the literature. This assumption is unrealistic in many research settings. We adopted a new approach to defining the loading-generating distribution. Loading coefficients were in each replication drawn from a uniform distribution with endpoints depending on a condition-specific mean and standard deviation.
6
Loading coefficients were ensured to fall into a limited section of the interval
Interfactor Correlation
A two-factor measurement model, which is the simplest multifactor measurement model, was assumed. We considered both uncorrelated
Sample Size
Fifty, 100, 200, 500, and 1,000 observations were analyzed as in Devlieger et al. (2019), reflecting common sample sizes in structural equation modeling.
Factor Scoring Method and Regression Model
The factor scoring methods mentioned in the Introduction were considered. The GLFSR models in the simulation study corresponded to Equation 10. The models had an observed outcome and factor score estimates, based on factors with normally distributed manifest variables, as independent variables.
Data-Generating Process
Figure 1 displays a path diagram of the simulation measurement model. Two factors,
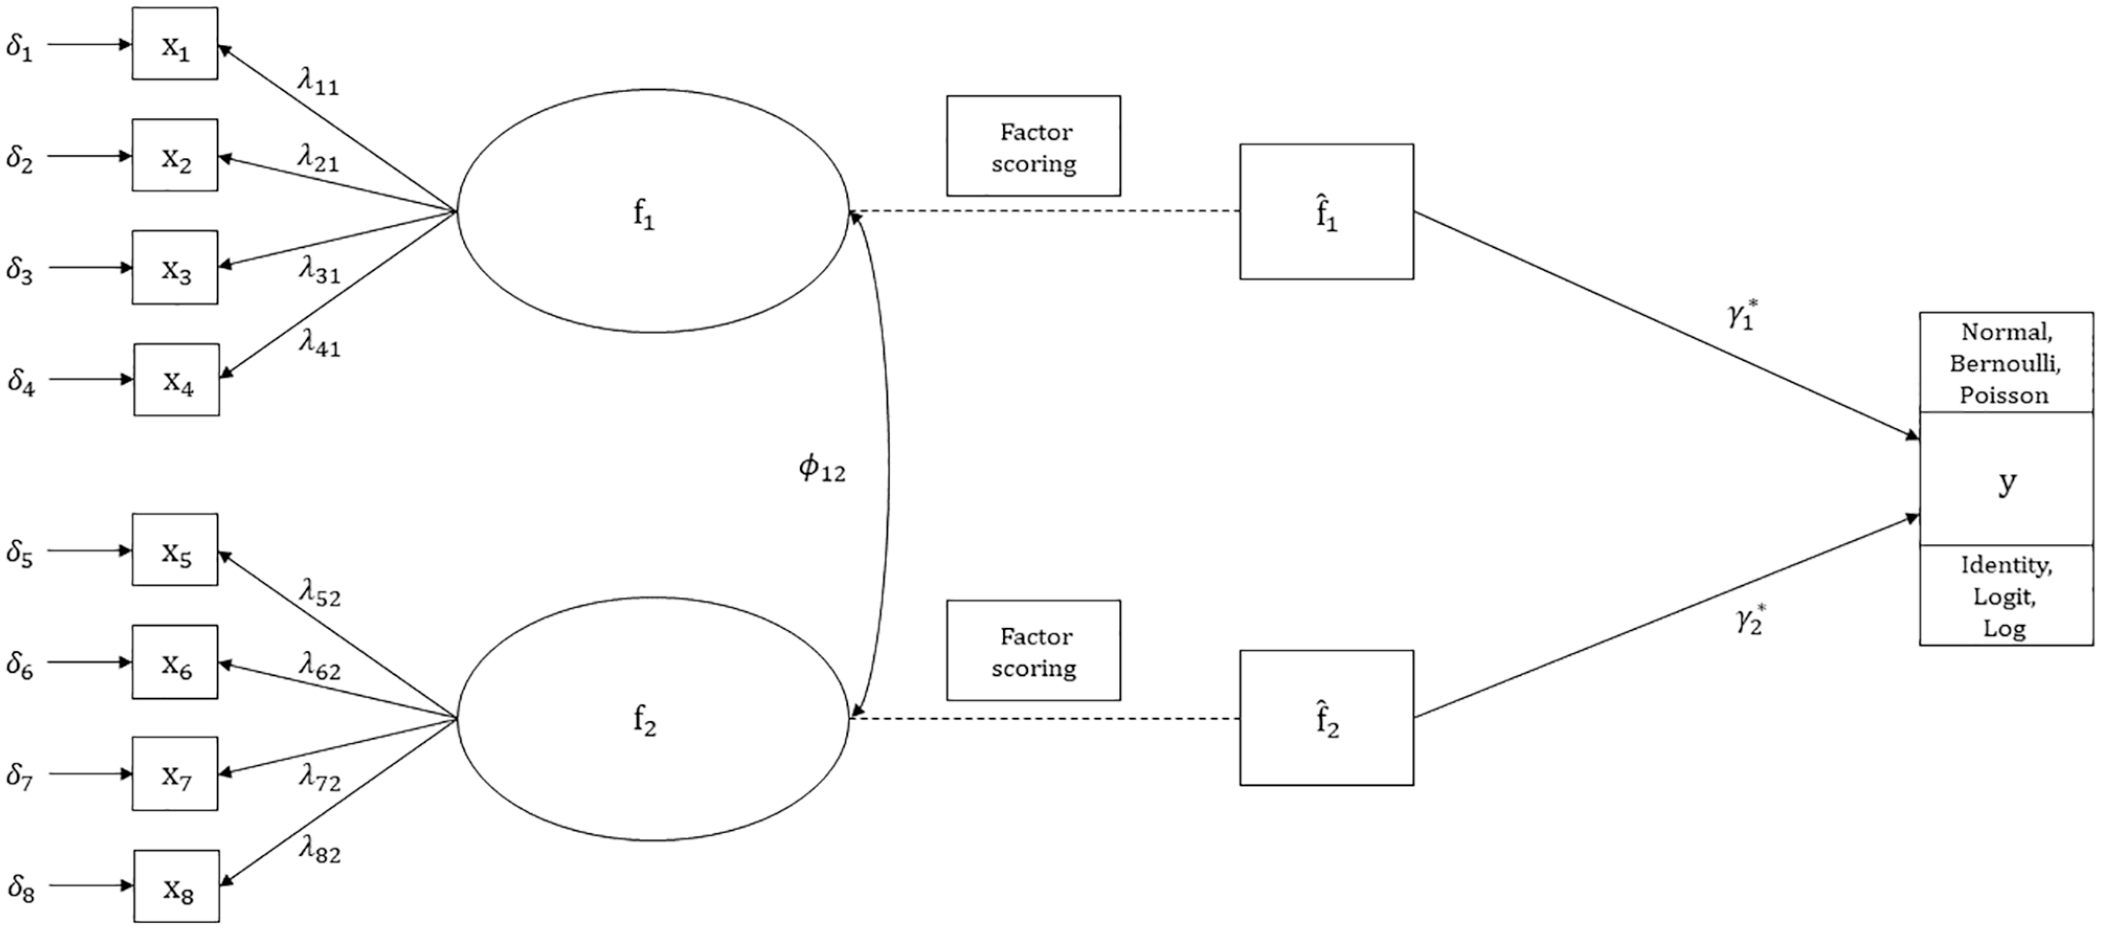
Path diagram of simulation model.
For each unique combination of the simulation parameter values, data were generated in the following steps in R (R Development Core Team, 2019):
True factor scores were generated by drawing
Factor score estimates were calculated. True factor scores were used to generate outcome values, where the true regression model had coefficients
The inverse link of the linear predictor was used to generate outcome values (Carsey & Harden, 2013). Let
Performance Assessment
Data were evaluated by the use of five performance criteria listed in Table 2. There were no evident reasons for results to differ between the factors in Figure 1. Thus, focus was restricted to the first factor. Data were trimmed by discarding cases with the upper and lower 0.50 percent of
Performance Criteria.
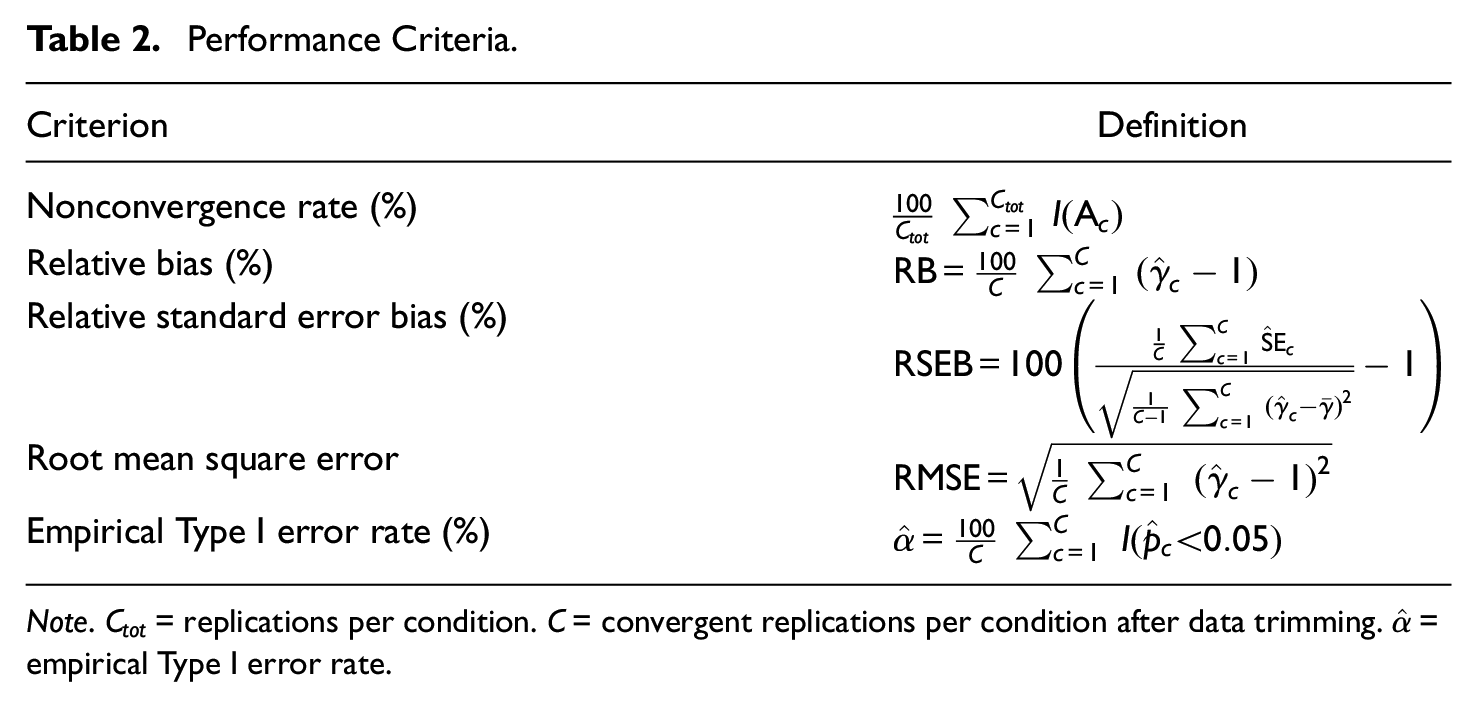
Note.
Given the recommendations by Skrondal (2000), meta-analysis models were formulated to relate the simulation parameters in Table 1 to the criteria. Separate analyses of variance (ANOVA) with first-order interactions were performed in line with Devlieger et al. (2016). In contrast to the majority of previous FSR studies, we examined practical significance in terms of standardized effect size as preferred by Boomsma (2013).
First, Type III sum of squares decompositions were evaluated in terms of effect size. Second, the most informative relationships were analyzed in relation to established guidelines. The partial omega-squared

where
Nonconvergence Rates
The indicator function
Bias
The relative bias compares estimated regression coefficients with the true coefficient value 1. The relative standard error bias compares the mean estimated standard error with the empirical standard deviation acting as an estimate of the theoretical standard error. Regression coefficients and standard errors were expected to mostly be underestimated based on previous simulation studies, for example, Skrondal and Laake (2001) and Devlieger et al. (2016). Moreover, biases were expected to generally decrease when the mean loading level grew higher. The sum score methods were expected to mainly be associated with substantial biases because they utilize little model information. We also expected bias levels for the regression method and the correlation-preserving method to converge and approach zero for higher mean loading levels. Following Hoogland and Boomsma (1998), absolute values of coefficient and standard error biases less than 5% and 10% were considered acceptable.
Root Mean Square Error (RMSE)
The RMSE can be considered an indicator of accuracy because it depends on both estimator bias and variance. A lower RMSE indicates higher accuracy. We expected higher accuracy for higher mean loading levels. In addition, RMSE values for the regression method and the correlation-preserving method were expected to decrease when analyzing larger samples.
Empirical Type I Error Rates
The indicator function
Results
Simulations resulted in 3,780,000 replications, of which about 3.60% were nonconvergent. A total of 3,606,180 replications were available for meta-analysis after the data trimming described in the previous section. Table 3 presents descriptive statistics for the simulated data.
Descriptive Statistics by Regression Model and Factor Scoring Method.
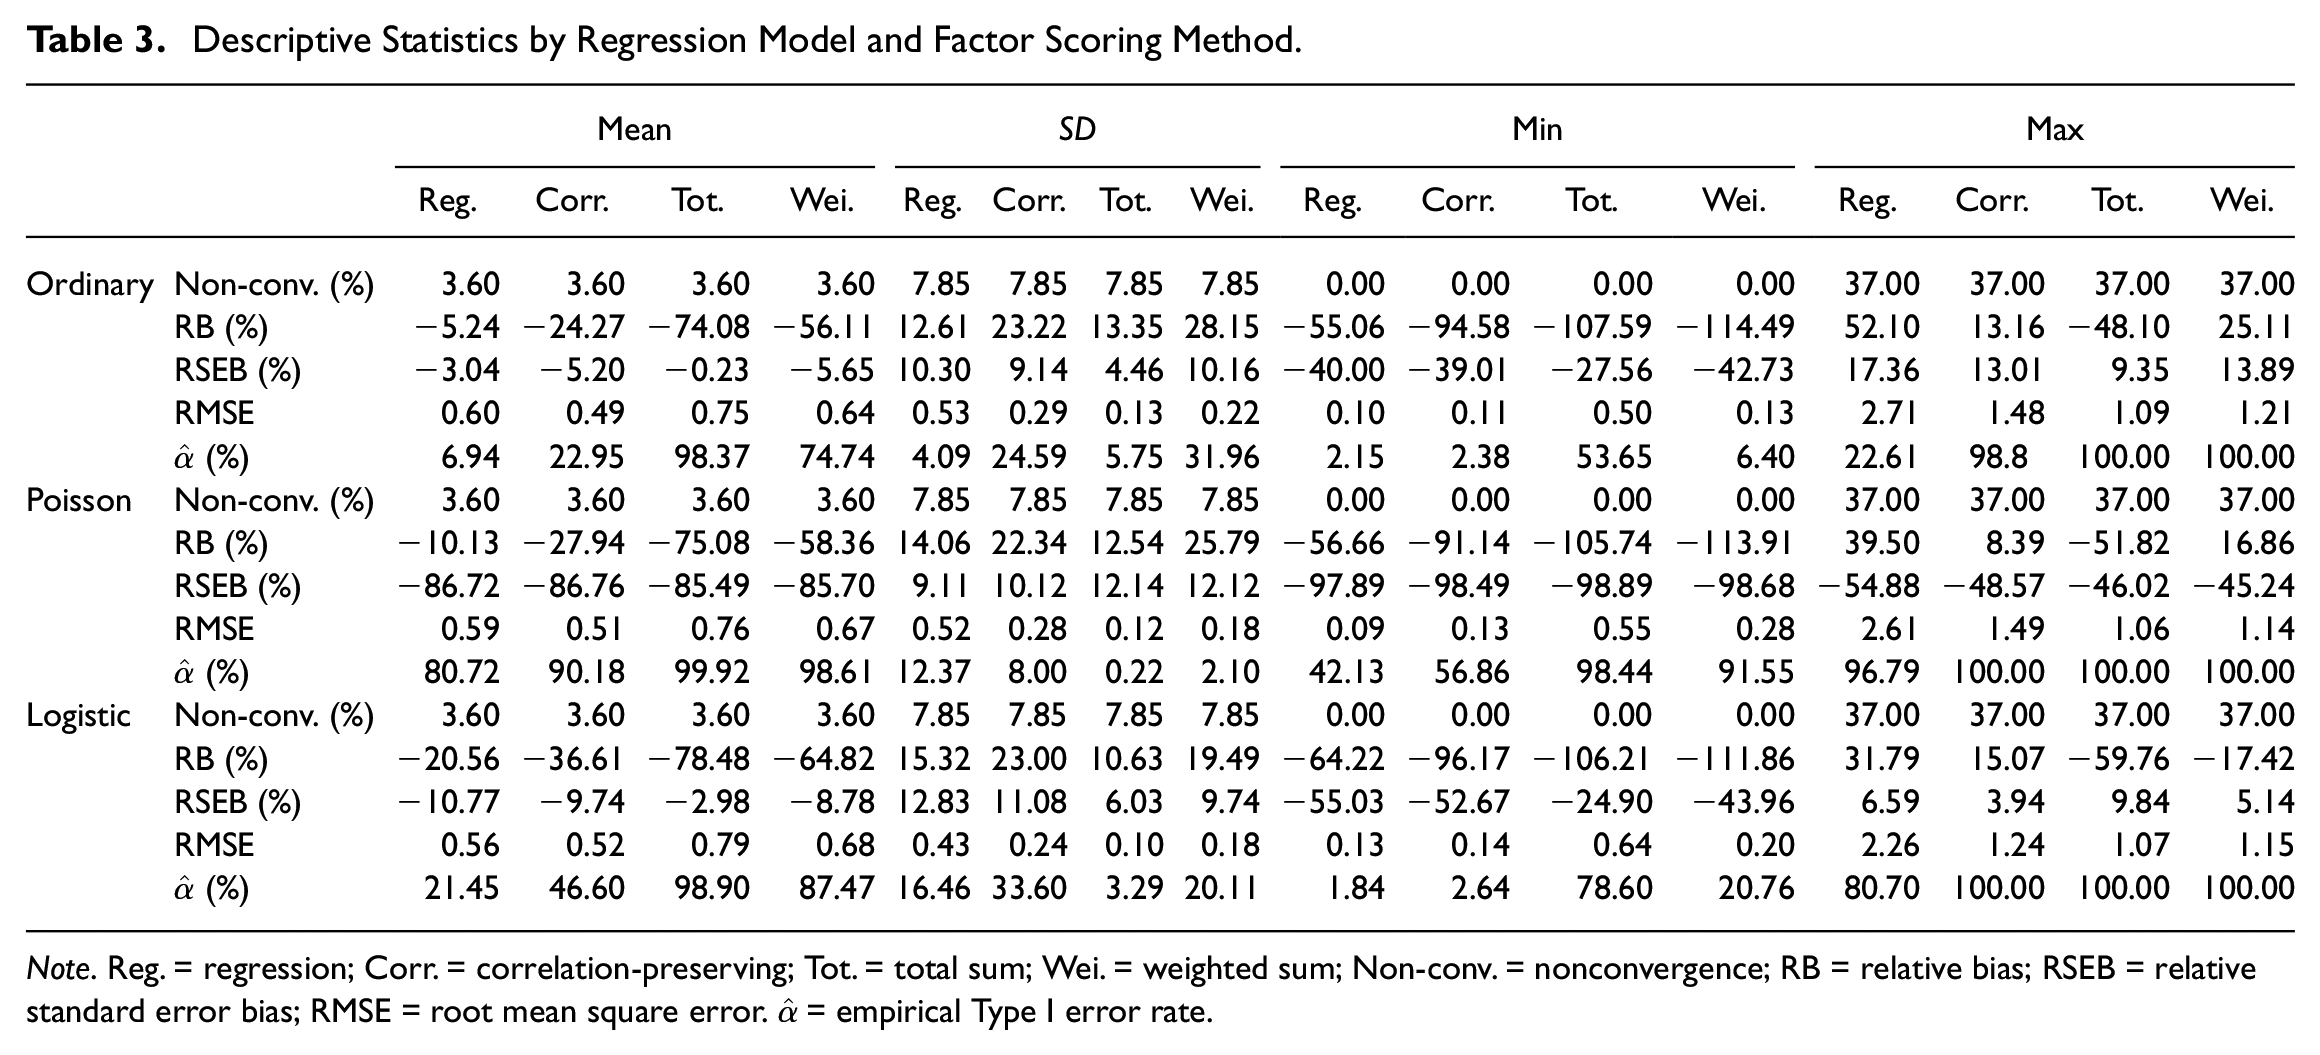
Note. Reg. = regression; Corr. = correlation-preserving; Tot. = total sum; Wei. = weighted sum; Non-conv. = nonconvergence; RB = relative bias; RSEB = relative standard error bias; RMSE = root mean square error.
All regression models were possible to estimate given a properly estimated measurement model. This is in line with the fact that nonconvergence statistics were equal for all regression models and factor scoring methods. Coefficients and standard errors were indicated to be generally underestimated. Root mean square error statistics were similar across the regression models, indicating similar accuracy in ordinary, logistic, and Poisson FSR. In addition, mean empirical Type I error rates generally fell outside of the acceptance interval, suggesting pronounced null hypothesis over-rejections in many cases.
Table 4 displays sum of squares decompositions for the meta-analyses. The volatility of loading coefficients
Sum of Squares Decompositions.
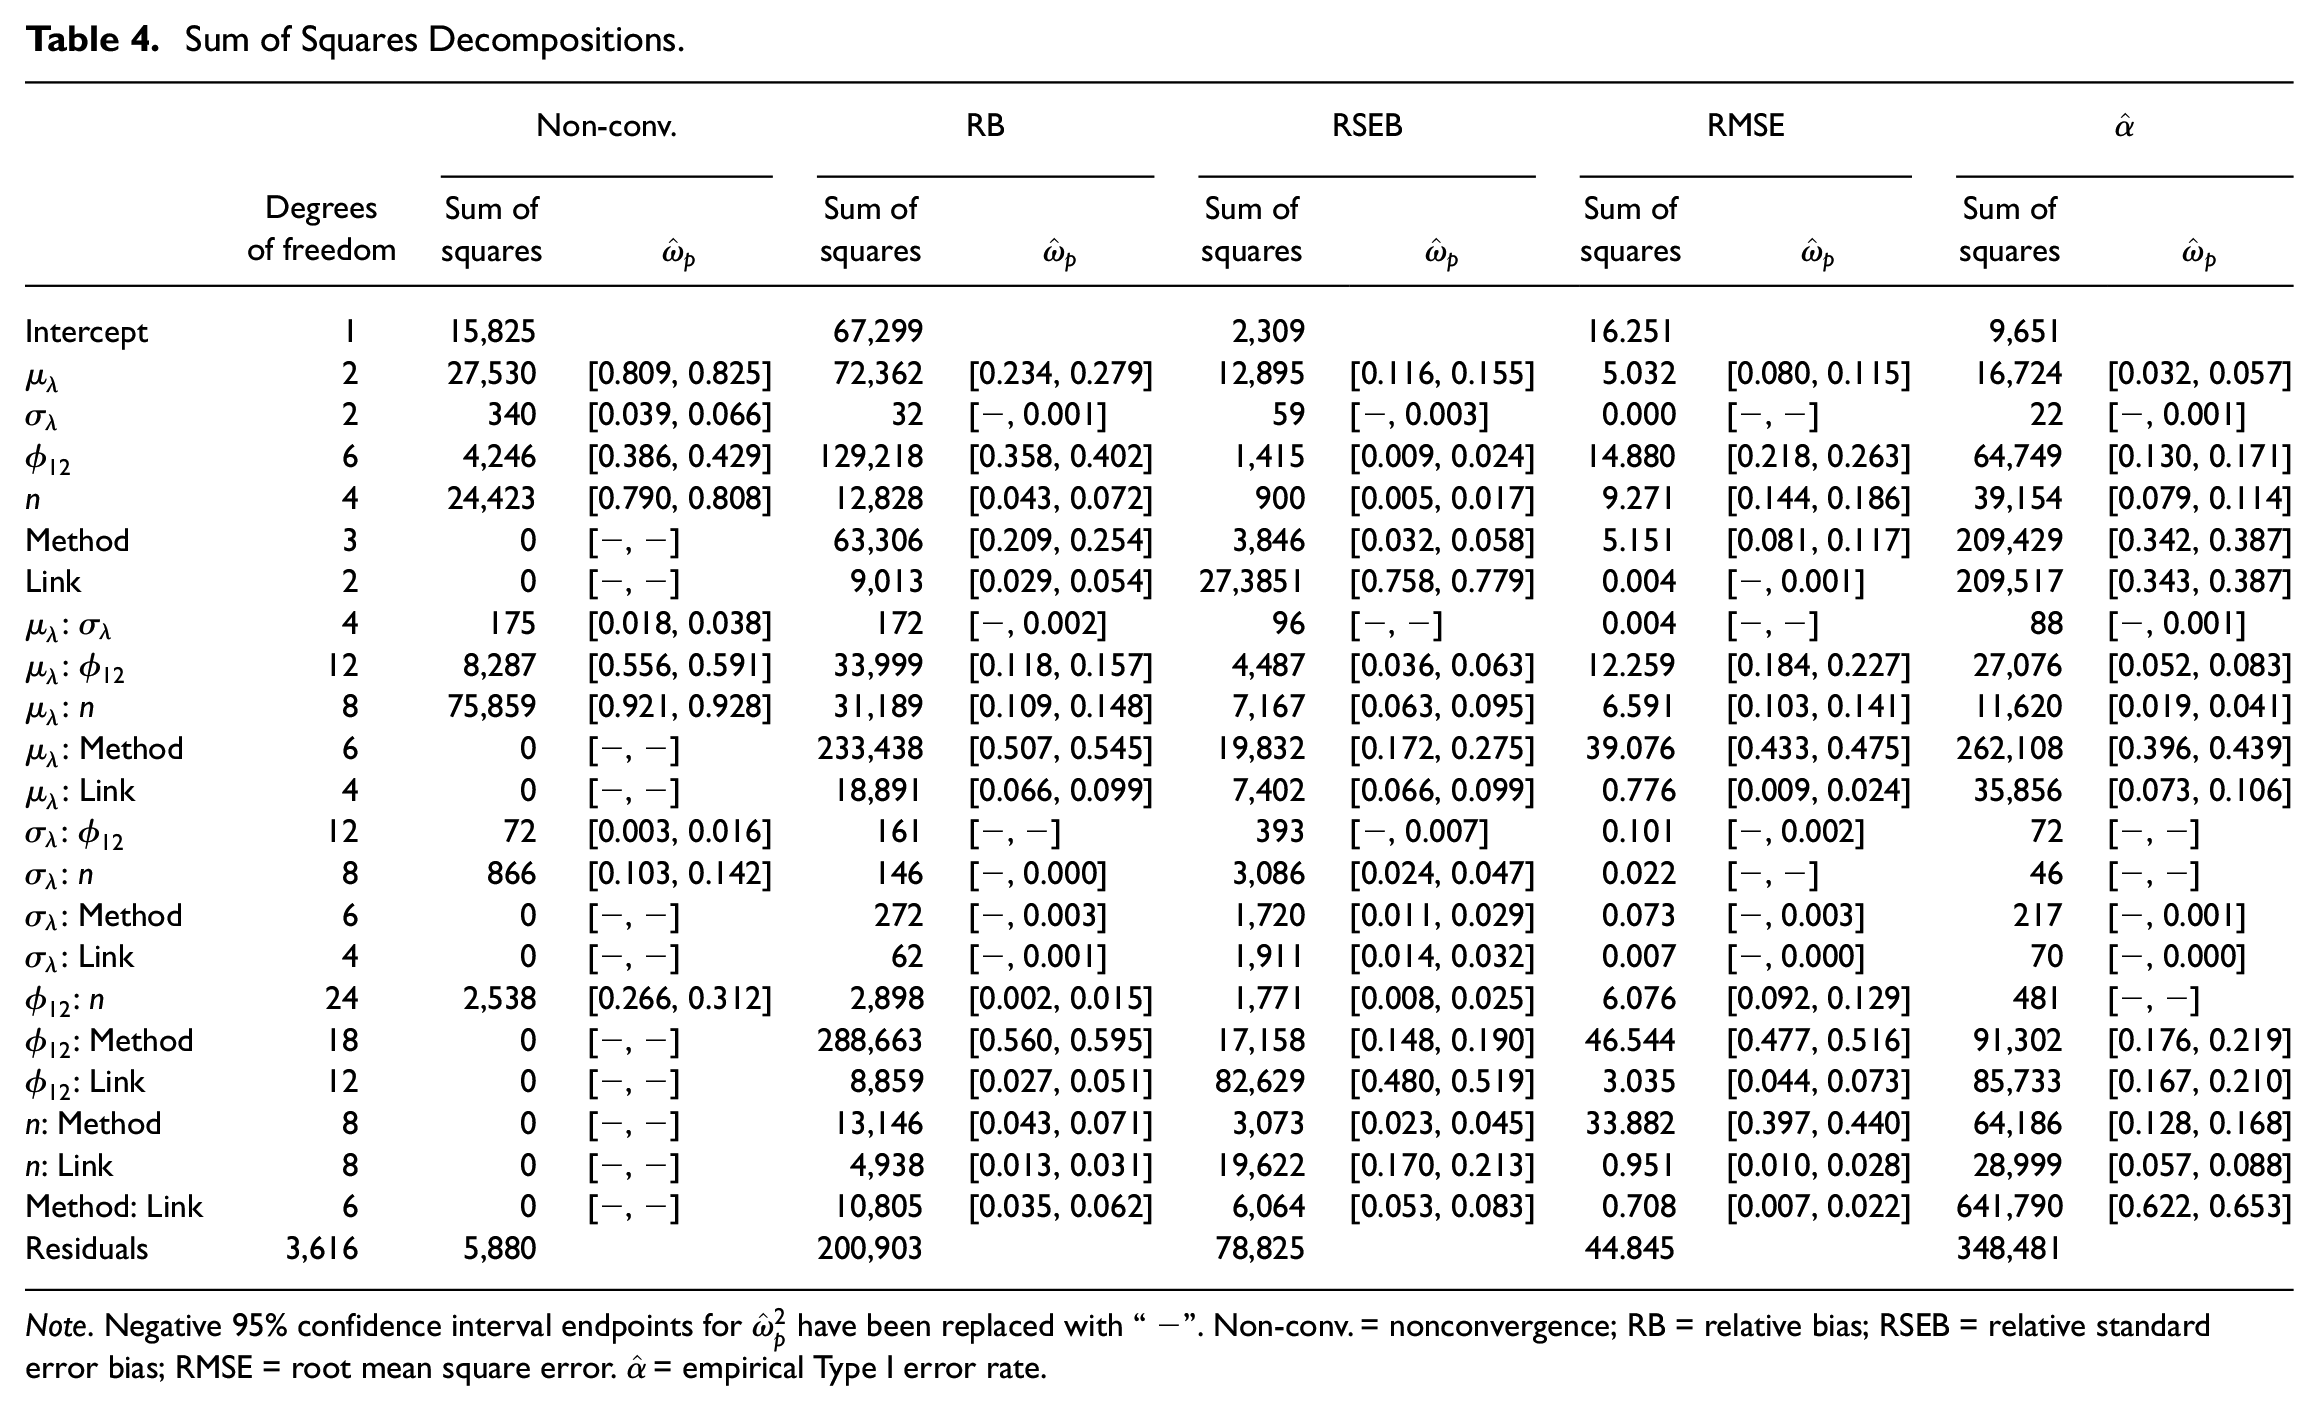
Note. Negative 95% confidence interval endpoints for
Nonconvergence Rates
Only simulation parameters related to the measurement model influenced nonconvergence rates according to the meta-analysis. Nonconvergence rates averaged over loading volatility levels, regression models, and factor scoring methods are displayed in Figure 2, including a horizontal line marking the 10% acceptance threshold.
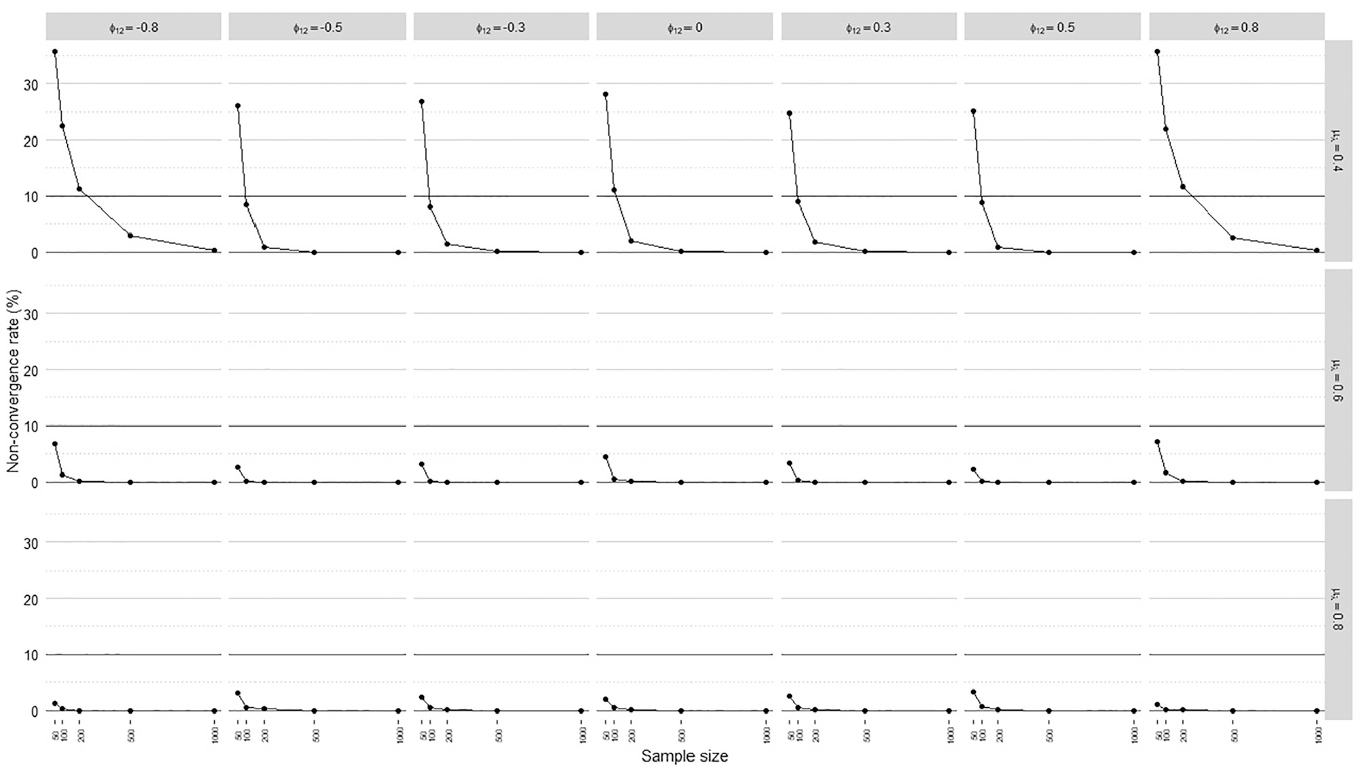
Nonconvergence rates.
The meta-analysis in Table 4 suggested an important interaction between the mean loading level, sample size, and interfactor correlation. In particular, sample size and interfactor correlation had notable impacts only when manifest variables were weakly correlated with factors on average
Nonconvergence rates were the most problematic when manifest variables on average weakly indicated the factors
Relative Bias
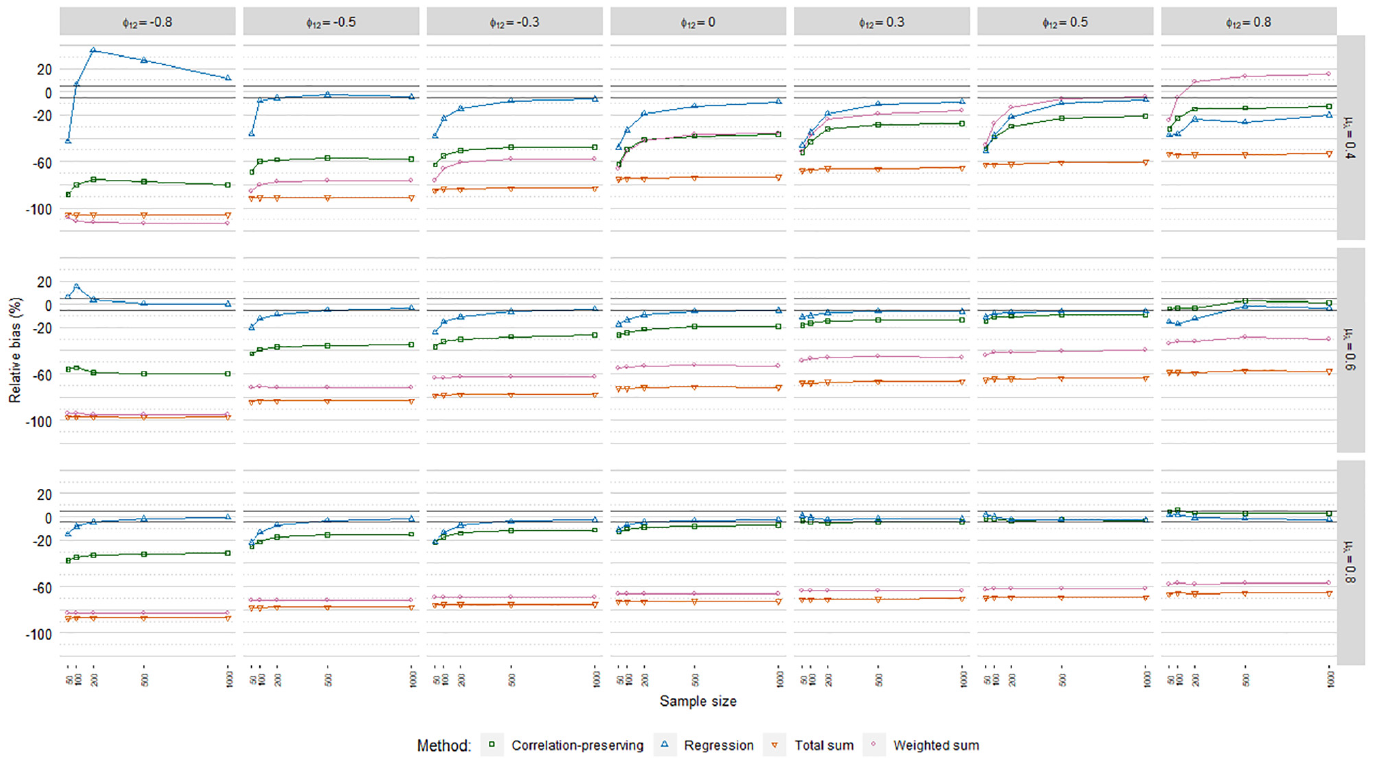
The meta-analysis in Table 4 suggested similar relative bias (RB) levels across the regression models. However, comparing logistic and Poisson to ordinary FSR, RB levels were in some cases shifted downward to an extent that influenced bias acceptability. RB values averaged over loading volatility levels are thus displayed for each regression model in Figures 3, 4, and 5, including 5% acceptance intervals.
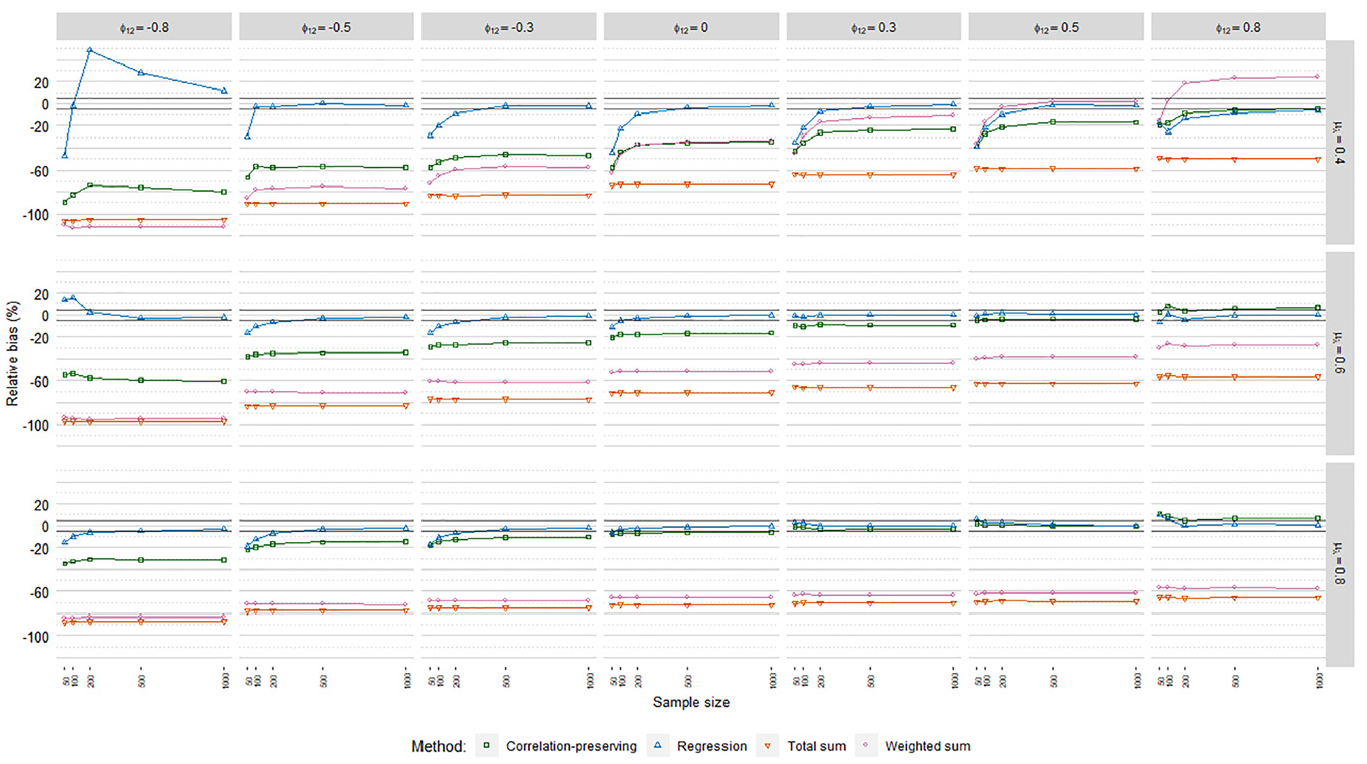
Relative coefficient bias, ordinary factor score regression.
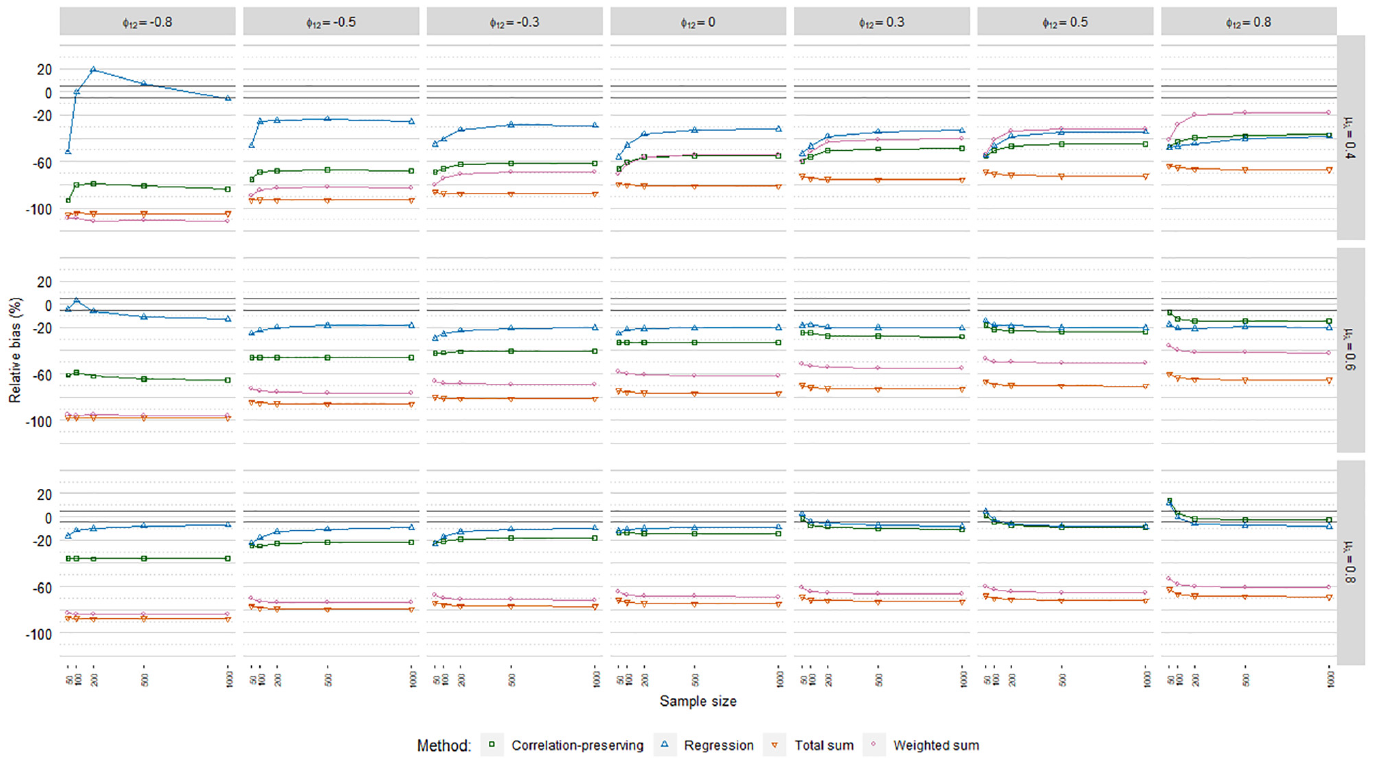
Relative coefficient bias, logistic factor score regression.
Relative coefficient bias, Poisson factor score regression.
In line with our expectations, coefficients were generally underestimated. The mean loading level had an impact on biases according to the meta-analysis in Table 4, but it depended on the specific factor scoring method. RB values for the regression method and the correlation-preserving method converged and approached zero for higher mean loading levels. In contrast, bias decreases were marginal for the total sum method. RB values for the weighted sum method in fact increased for higher mean loading levels. Biases were almost always severe for the sum score methods, which therefore were discarded from further RB analysis.
Coefficients were often less biased with the regression method than the correlation-preserving method. Compared with
The correlation-preserving method was mostly associated with unacceptable RB levels that were less severe when manifest variables had relatively high mean correlations with factors
Relative Standard Error Bias
Figures 6, 7, and 8 display relative standard error bias (RSEB) values averaged over levels of loading variance for each regression model, including 10% acceptance intervals. The meta-analysis in Table 4 suggested that substantial RSEB differences exist across regression models. Estimated standard errors were severely biased in all cases in Poisson FSR. RSEB values were mostly less than −60% in this case. In contrast, absolute RSEB values were mainly acceptable in ordinary and logistic FSR. For these two regression models, problematic RSEB values were found primarily in situations where manifest variables were weakly correlated with factors on average
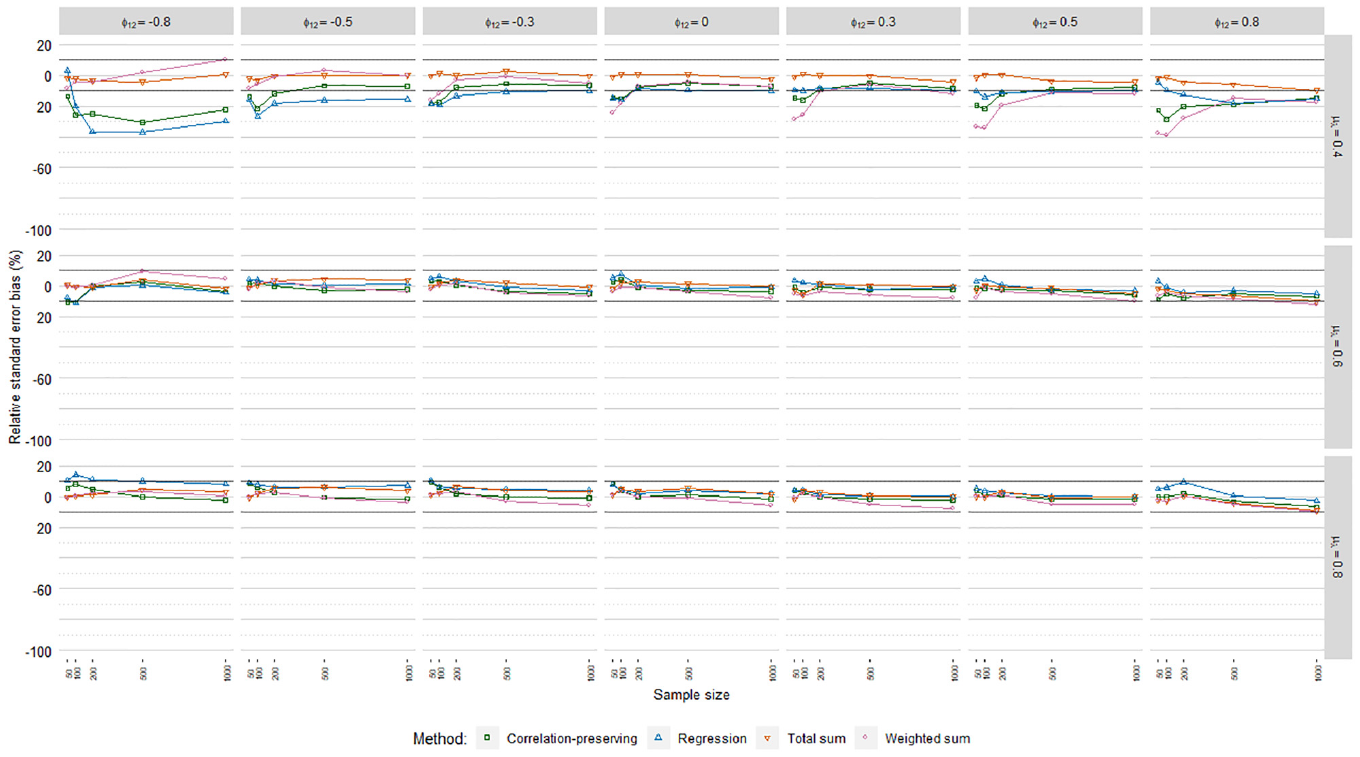
Relative standard error bias, ordinary factor score regression.
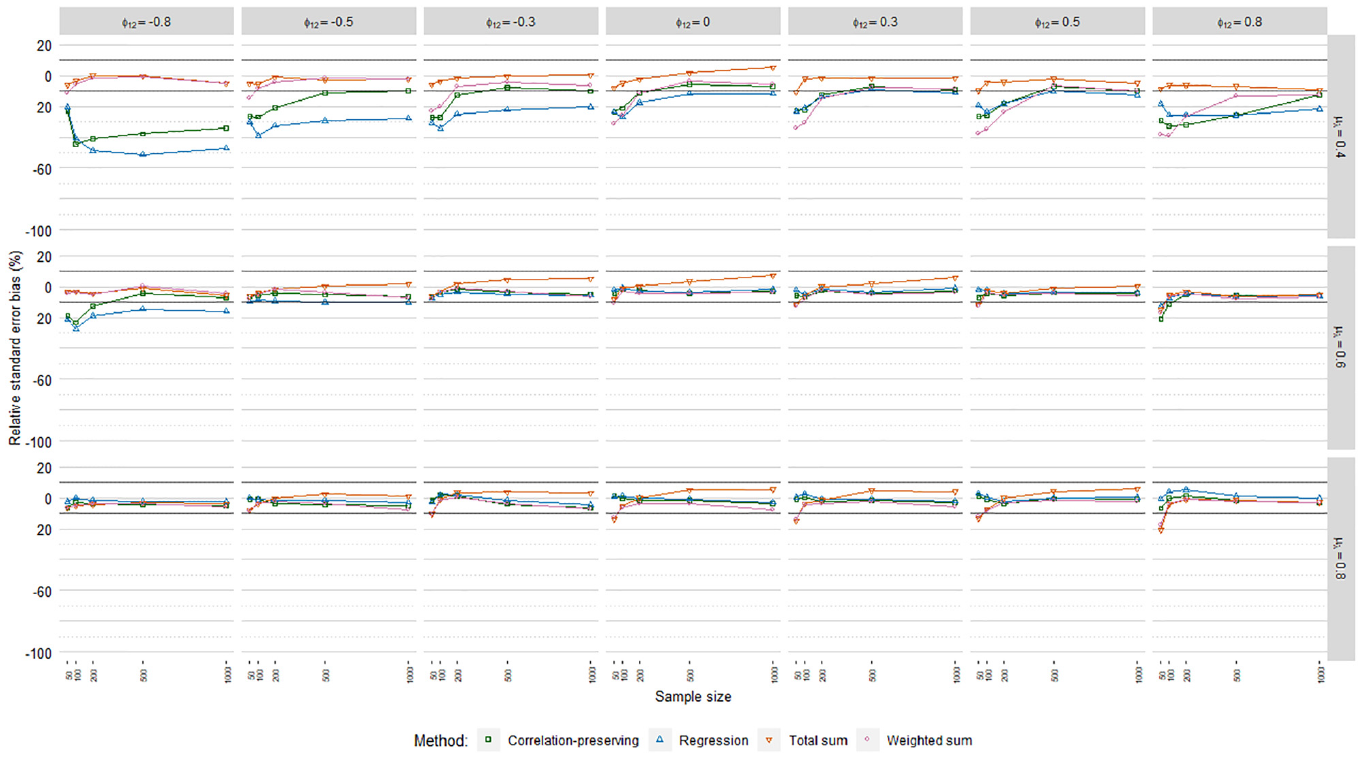
Relative standard error bias, logistic factor score regression.
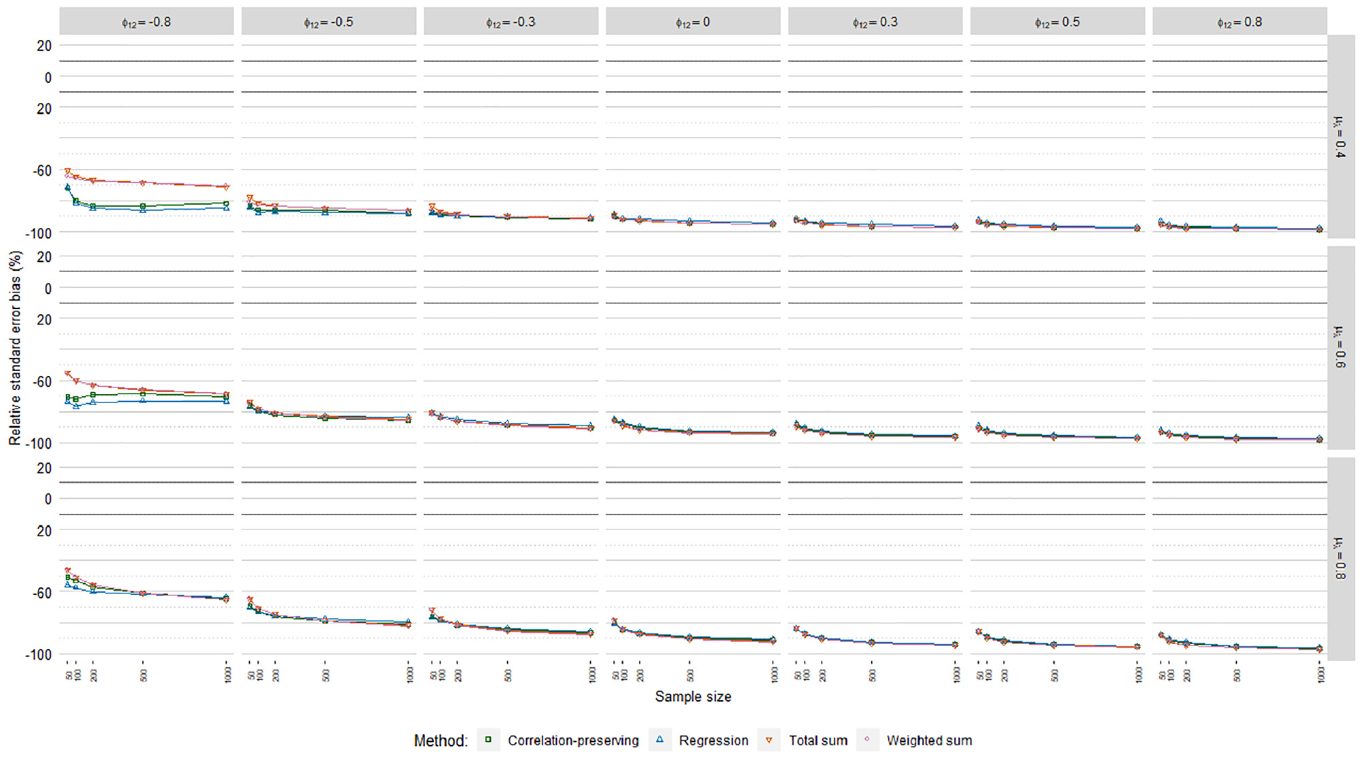
Relative standard error bias, Poisson factor score regression.
Root Mean Square Error
The meta-analysis in Table 4 on root mean square error (RMSE) values indicated no noteworthy differences across the regression models. RMSE values averaged over loading volatility levels and regression models are displayed in Figure 9. As expected, the regression method and the correlation-preserving method displayed higher accuracy in larger samples. In contrast, the sum score methods were, in large, unaffected by sample size.
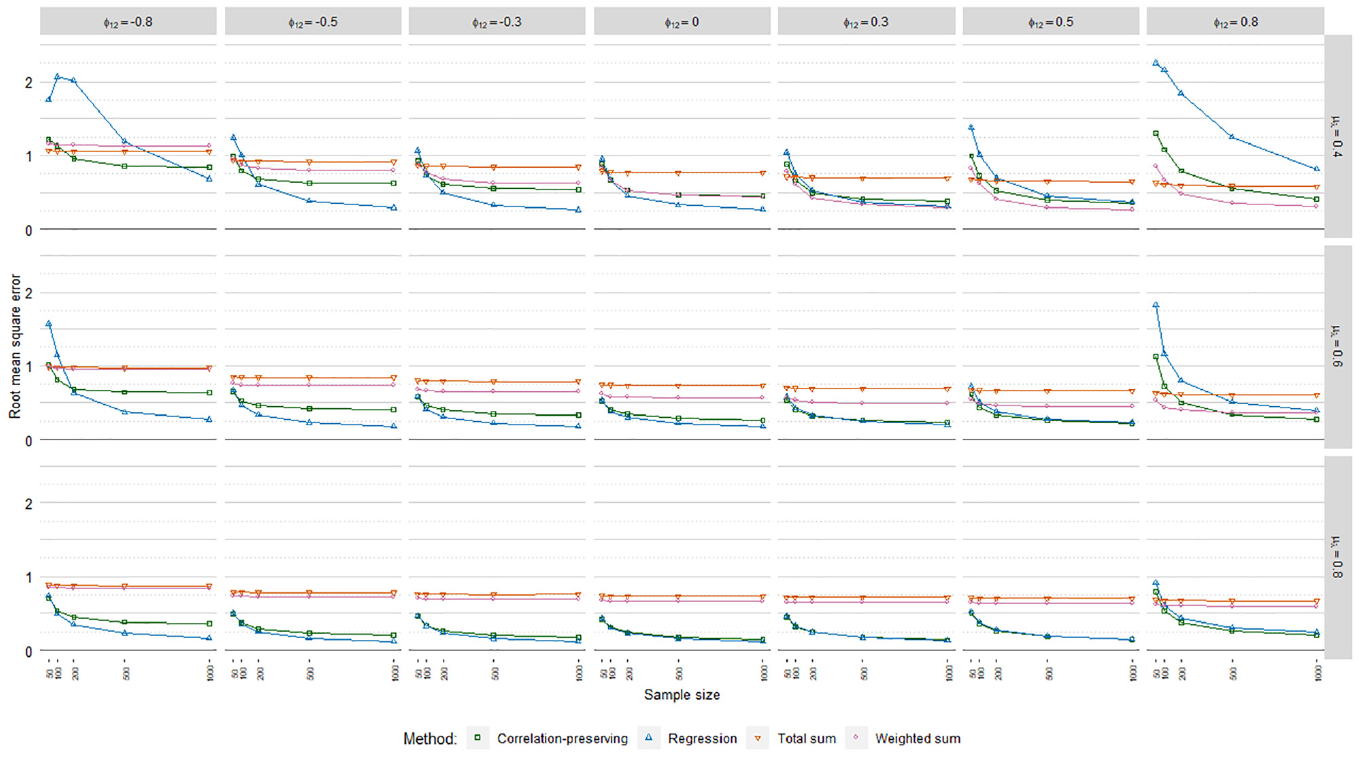
Root mean square error.
The regression method and the correlation-preserving method mostly outperformed the sum score methods in terms of accuracy. In addition, the regression method generally had the highest accuracy. The accuracy of the regression method and the correlation-preserving method increased when the mean loading level grew larger and factors were weakly correlated. Moreover, the negative influence of interfactor correlations on the accuracy of the regression method and the correlation-preserving method decreased notably when the mean loading level increased. Accuracy differences between the regression method and the correlation-preserving method were, in large, negligible when manifest variables had relatively high mean correlations with factors
Empirical Type I Error Rates
Empirical Type I error rates
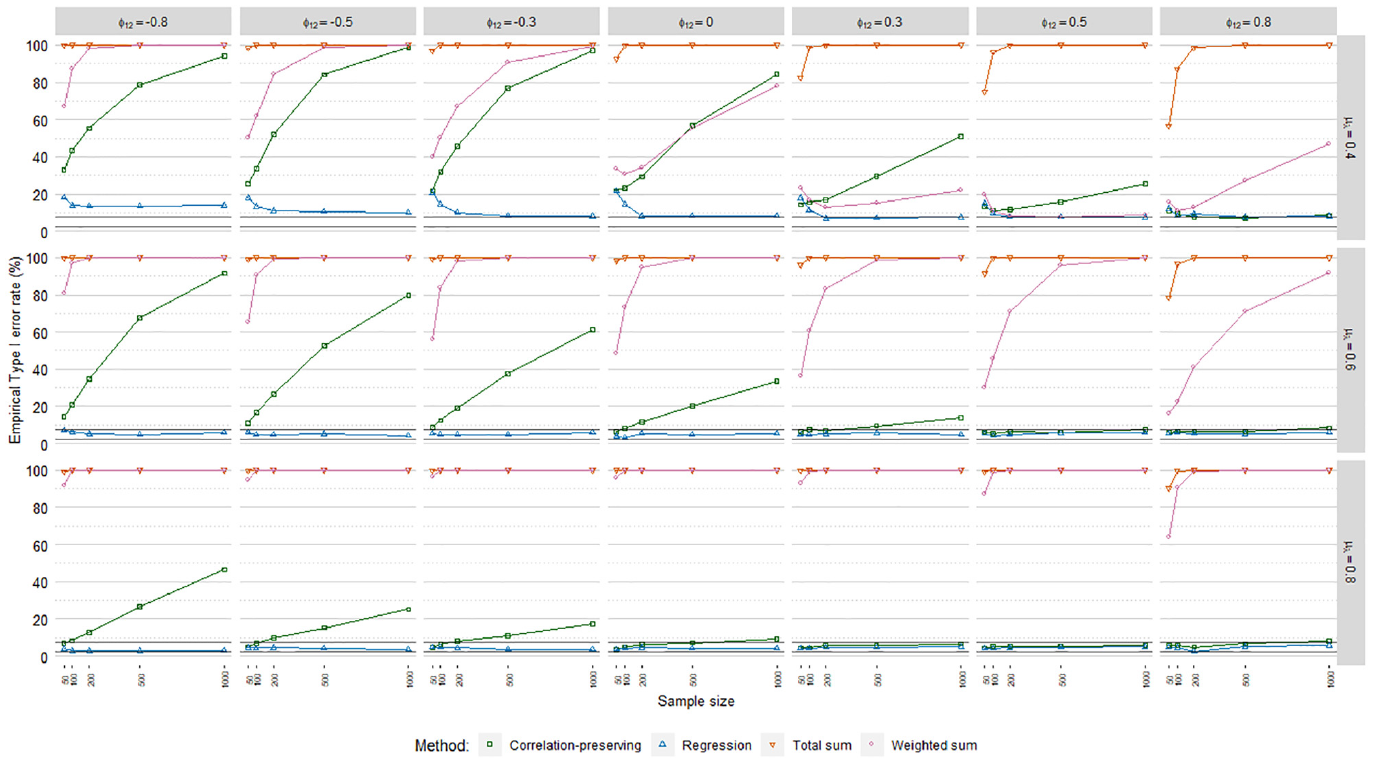
Type I error rates, ordinary factor score regression.
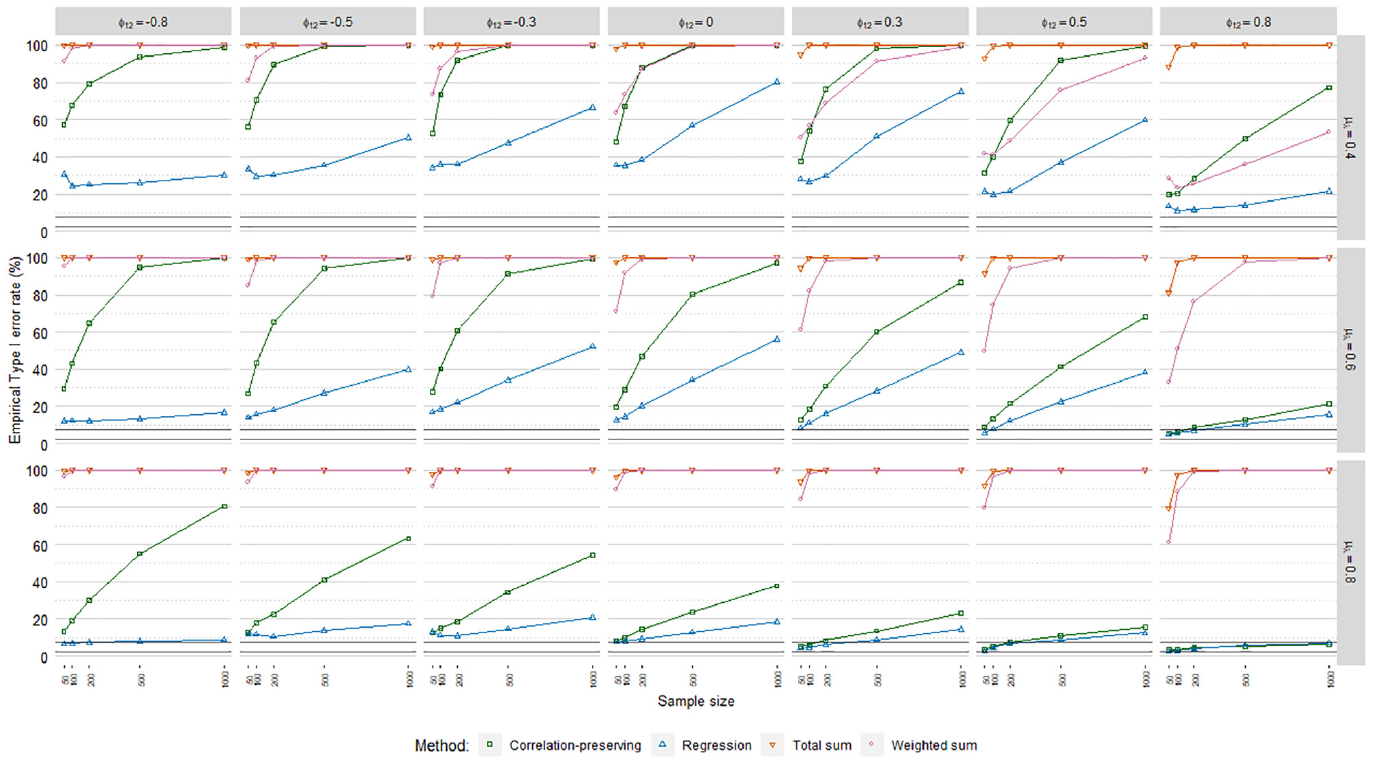
Type I error rates, logistic factor score regression.
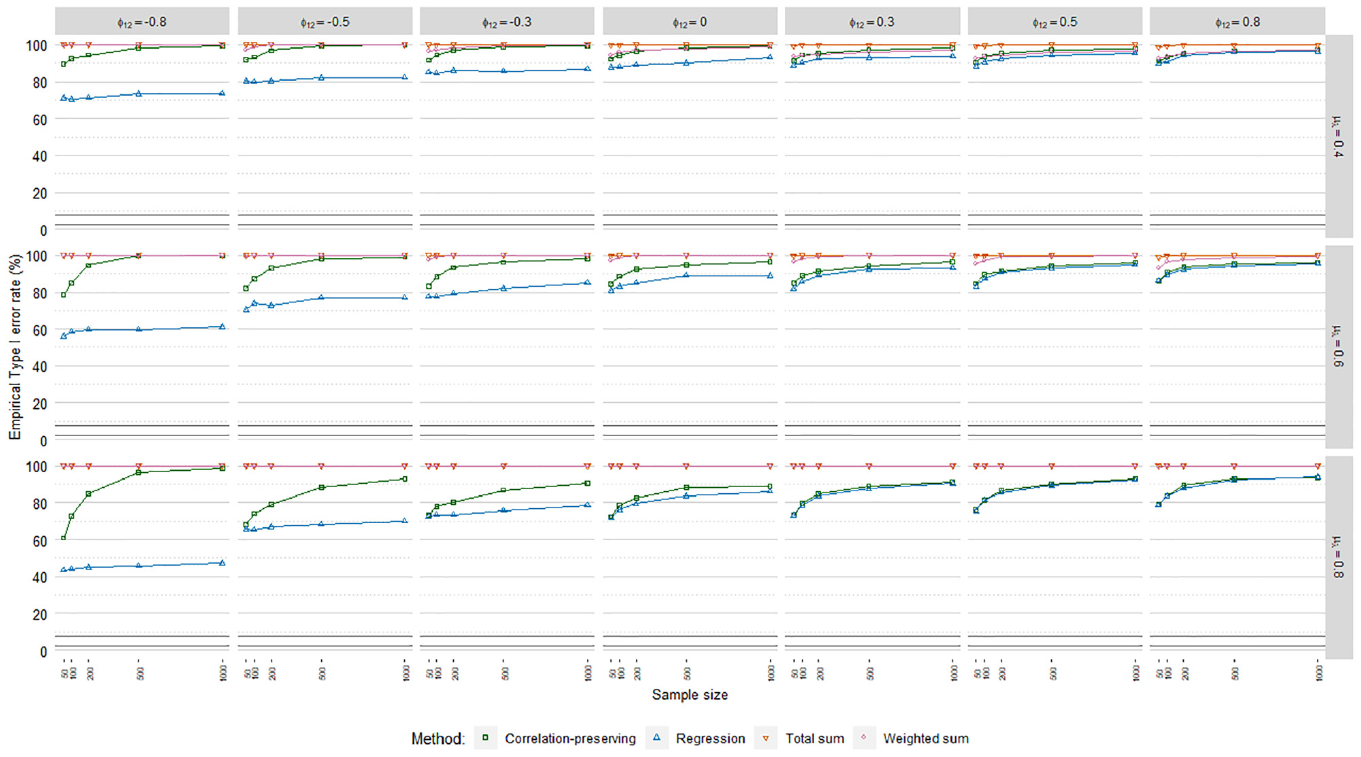
Type I error rates, Poisson factor score regression.
The sum score methods had more problematic
The meta-analysis in Table 4 indicated a noteworthy impact of the mean loading level on empirical Type I error rates. This was reflected in
Discussion
In this article, we examined the performance of a selection of factor scoring methods when estimating regression coefficients in GLFSR. Our simulations indicate that relationships between factors and an observed outcome are recovered with approximately the same accuracy in ordinary, logistic, and Poisson FSR. However, levels of coefficient and standard error bias associated with each factor scoring method differed substantially across regression models in some cases. Therefore, we conclude that ordinary FSR results are not representative for GLFSR as a whole.
Ordinary Factor Score Regression
The results indicate that the regression method has the best performance when analyzing a normally distributed outcome. Given sufficiently large samples, the regression method was associated with mostly acceptable levels of coefficient bias and empirical Type I errors unlike the other factor scoring methods. The lesser bias of the correlation-preserving method in Lastovicka and Thamodaran (1991), compared with the regression method, was consequently not confirmed in most cases. Lastovicka and Thamodaran (1991) used exploratory factor analysis, analyzed correlations with maximum likelihood estimation, and considered other simulation parameters than those in this article, which may in part explain the differing results. We also conclude that standard errors are, in large, acceptably recovered in ordinary FSR. Problematic standard error estimates were found mainly in situations with low mean loading levels and highly correlated factors, which should not reflect the majority of practical settings. Thus, the conclusion by Skrondal and Laake (2001) that standard errors are in general “way off target” could not be supported. Differences in results may partly be due to the analysis of latent outcomes, scaling of factor variances with the reference-variable approach, and consideration of different simulation parameters in Skrondal and Laake (2001) compared with this article.
Logistic Factor Score Regression
We conclude that the regression method is superior in logistic FSR. The regression method generally had the least problematic coefficient biases and empirical Type I error rates. Furthermore, standard errors were mostly estimated with an acceptable level of bias. However, practitioners should be aware that estimated relationships are in most cases negatively biased to a problematic extent in logistic FSR.
Poisson Factor Score Regression
The simulations indicate that the regression method has the best overall performance in Poisson FSR. Given sufficiently large samples and high mean loading levels, the regression method was in many cases uniquely associated with acceptable coefficient bias levels. Nonetheless, standard errors were always severely underestimated. Therefore, significance testing should not be trusted in Poisson FSR even when coefficient biases are negligible.
In summary, the regression method is recommended for factor scoring in GLFSR. Still, the correlation-preserving method can be a viable alternative when factors are positively correlated and manifest variables have strong correlations on average with factors. In this case, one may choose to either maximize correlations between estimated and theoretical factor scores with the regression method or preserve interfactor correlations with the correlation-preserving method. However, we emphasize that the correlation-preserving method should not be used when factors are negatively correlated because of severe coefficient biases.
In almost all cases, the sum score methods produced severe coefficient biases that translated into empirical Type I error rates of 100%. Thus, despite their simplicity, this article strongly argues against the use of sum score methods in GLFSR, including the common special case with normally distributed outcomes.
Similar to Devlieger et al. (2016), the proportion of nonconvergent replications was the same for all factor scoring methods and regression models. In addition, we can conclude that nonconvergence issues are uniquely attributed to the measurement model estimation in GLFSR. Nonconvergence issues were eliminated if one analyzed either a large sample or a factor structure with a relatively high mean loading level. Because nonconvergent replications occurred mostly in situations with small samples and weak manifest variables, these cases should be interpreted with additional care.
In contrast to the majority of previous research, both equal and unequal loading coefficients were considered in this article. An interesting finding was that all previously discussed results held true in both homogeneous and heterogeneous loading structures with regard to the negligible impact of loading volatility on the performance criteria. From the perspective of external validity, we advocate the consideration of unequal loadings to reflect a broader range of loading structures found in practice.
Many aspects of GLFSR are still to be explored. For example, it would be of interest to examine how the results in this article may be influenced by different extents and types of missing data, model misspecification, choosing the reference-variable approach to scaling factors, and analyzing a latent outcome variable that can be either continuous or discrete. Results may differ from our simulation study depending on which scoring method is used for scoring the latent outcome variable and how scoring methods for independent and dependent latent variables are combined, which should be explored in future research. Moreover, it would be of interest to compare GLFSR with recent developments in the structural equation modeling literature to account for manifest and latent variables from exponential dispersion family distributions. However, generalized structural equation modeling is at the moment only available in a limited number of statistical software and with some model and output restrictions still to be addressed, rendering such comparisons difficult to make. In addition, it should be beneficial for practitioners if approaches to potentially offset problematic coefficient and standard error biases in GLFSR were investigated.
Footnotes
Declaration of Conflicting Interests
The author(s) declared no potential conflicts of interest with respect to the research, authorship, and/or publication of this article.
Funding
The author(s) disclosed receipt of the following financial support for the research, authorship, and/or publication of this article: The research reported in this article has been supported by the Swedish Research Council (VR) under the program “New Statistical Methods for Latent Variable Models, 2017-01175”.