
Abstract
Cohen’s kappa coefficient is commonly used for assessing agreement between classifications of two raters on a nominal scale. Three variants of Cohen’s kappa that can handle missing data are presented. Data are considered missing if one or both ratings of a unit are missing. We study how well the variants estimate the kappa value for complete data under two missing data mechanisms—namely, missingness completely at random and a form of missingness not at random. The kappa coefficient considered in Gwet (Handbook of Inter-rater Reliability, 4th ed.) and the kappa coefficient based on listwise deletion of units with missing ratings were found to have virtually no bias and mean squared error if missingness is completely at random, and small bias and mean squared error if missingness is not at random. Furthermore, the kappa coefficient that treats missing ratings as a regular category appears to be rather heavily biased and has a substantial mean squared error in many of the simulations. Because it performs well and is easy to compute, we recommend to use the kappa coefficient that is based on listwise deletion of missing ratings if it can be assumed that missingness is completely at random or not at random.
Keywords
Introduction
In various research domains and applications, the classification of units (persons, individuals, objects) into nominal categories is frequently required. Examples are the assignment of people with mental health problems to classes of mental disorders by a psychologist, the classification of assignments of students to assess their proficiency by their teachers, the allocation of elderly people to classes representing different types of dementia by neurologists, and the classification of fractures from scans. In the first example, persons who have a depressed mood and a decreased interest or pleasure may be diagnosed with a major depressive disorder (American Psychiatric Association, 2013). A diagnosis may provide a person more insight into his or her problems, which is often a prerequisite for finding the right treatment. Classification of persons into categories may also be useful for research purposes. Groupings that were obtained using rater classification can be compared on various outcome variables.
A nominal rating instrument has high reliability if units obtain the same classification under similar conditions. The reliability of ratings may be poor if, for example, the definition of categories is ambiguous or if instructions are not clear. In the latter case, a rater may not fully understand what he or she is asked to interpret, which may lead to a poor diagnosis. To study whether ratings are correct and of high reliability, researchers typically ask two raters to judge the same group of units. The agreement between ratings is then used as an indication of the reliability of the classifications of the raters (Blackman & Koval, 2000; McHugh, 2012; Shiloach et al., 2010; Wing, Leekam, Libby, Gould, & Larcombe, 2002).
A coefficient that is commonly used for measuring the degree of agreement between two raters on a nominal scale is Cohen’s kappa (Andrés & Marzo, 2004; Cohen, 1960; Conger, 2017; Maclure & Willett, 1987; Schouten, 1986; Vanbelle & Albert, 2009; Viera & Garrett, 2005; Warrens, 2015). The coefficient is a standard tool for assessing agreement between nominal classifications in behavioral, social, and medical sciences (Banerjee, Capozzoli, McSweeney, & Sinha, 1999; De Vet, Mokkink, Terwee, Hoekstra, & Knol, 2013; Sim & Wright, 2005). A major advantage of kappa over the raw observed percent agreement is that the coefficient controls for agreement due to chance (Cohen, 1960). Kappa has value 1 if there is perfect agreement between the raters and value 0 if observed percent agreement is equal to the agreement due to chance.
Missing data are quite common in research and can have a notable effect on the conclusions that can be drawn from the data (Baraldi & Enders, 2010; Enders, 2010; Peugh & Enders, 2004). In this article, data are considered missing if one or both ratings of a unit are missing. Missing data may have various causes, such as dropout during a clinical trial (Myers, 2000) or nonresponse on an appointment (Raghunathan, 2004). Furthermore, missing data may be the result of the coding procedure. For instance, in content analysis, one rater may break up a text in more parts than another rater. Data are missing since the second rater does not classify some of the units that are classified by the first rater (Simon, 2006; Strijbos & Stahl, 2007).
Several variants of Cohen’s kappa for dealing with missing data have been proposed in the literature (Gwet, 2012, 2014; Simon, 2006; Strijbos & Stahl, 2007). The kappas are based on two different approaches. In the first approach, units with one or two missing ratings are classified into a separate “missing” category. This first approach is also known as an available-case analysis. The second approach is simply to delete (or ignore) all units with no or only one rating available and apply the ordinary Cohen’s kappa. The latter approach is known as listwise or pairwise deletion in the statistical literature (with two raters’ listwise deletion being equal to pairwise deletion) and is probably the most commonly used approach (Peugh & Enders, 2004). The second approach is also known as a complete-case analysis.
At present, it is unclear how the different kappa coefficients for missing data are related and what the impact of the degree and nature of the missingness is on the degree of reliability. Strijbos and Stahl (2007) presented examples that show that different kappa coefficients may produce quite different values for the same data. Thus, different conclusions about the reliability of a nominal rating instrument may be reached depending on which kappa coefficient is used. Furthermore, it is also unclear which kappa coefficient should be preferred in a particular research context. New insights into the properties of the kappa coefficients for missing data are therefore welcomed.
In this article, we study how the three aforementioned kappa coefficients are affected by different degrees of missing data. The new insights presented in this article may help researchers choose the most appropriate kappa coefficient. It should be noted that the kappa coefficients are based on what are referred to in the literature as traditional methods. For other data-analytic applications, it has been shown that listwise and pairwise deletion methods have certain limitations (cf. Baraldi & Enders, 2010; Enders, 2010; Peugh & Enders, 2004). The deletion methods may perform well if it can be assumed that missingness is completely at random (MCAR). However, if MCAR cannot be assumed, deletion methods may provide distorted parameter estimates. More modern approaches for handling missingness are based on maximum likelihood and multiple imputation methods (Baraldi & Enders, 2010; Enders, 2010; Peugh & Enders, 2004).
The article is structured as follows. Cohen’s kappa is defined in the next section. The three kappa coefficients for dealing with missing data are defined in the “Kappas for Missing Data” section. We are interested in how well the three kappa coefficients estimate the kappa value for complete data in light of missing data. In the “Simulations” section, we use simulated data to get an idea of the extent of the bias and the mean squared error (MSE) if the missingness is completely at random or if the missingness is not at random. The final section contains a discussion.
Cohen’s Kappa
In this section, we consider Cohen’s original kappa coefficient (Cohen, 1960). Suppose we have two raters, A and B, who have classified independently the same group of
Pairwise Classifications of Units Into Three Categories.
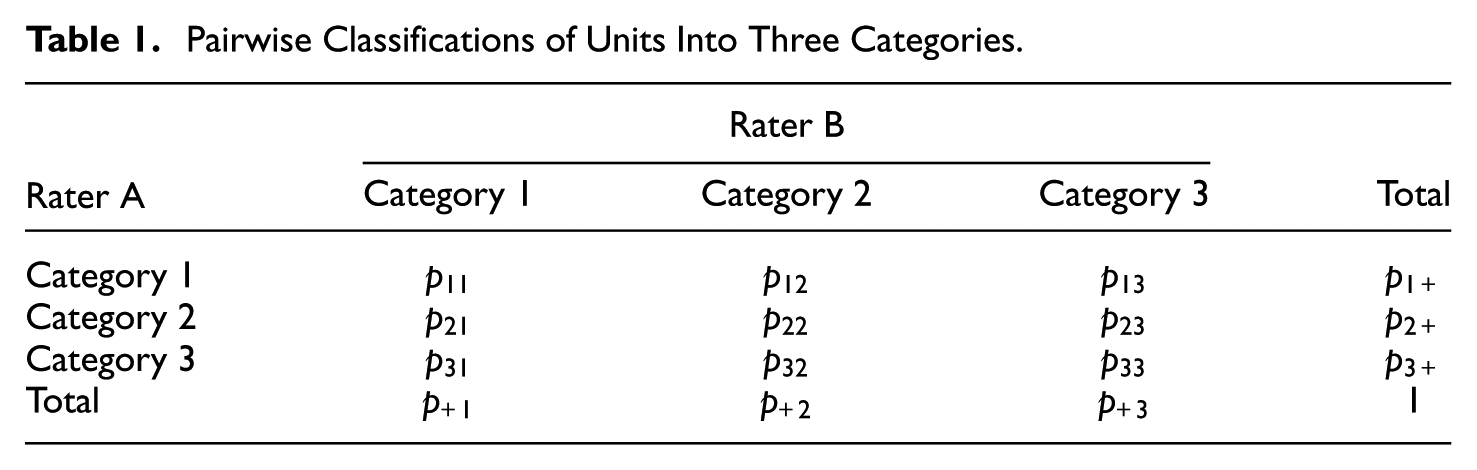
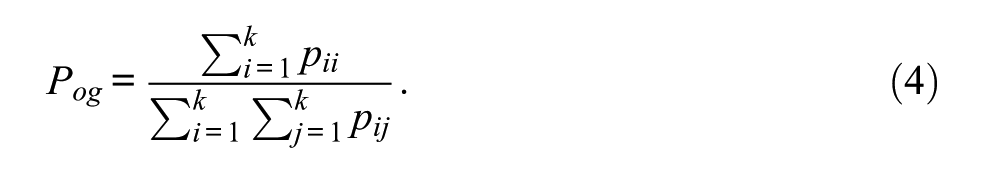
The kappa coefficient is a function of two quantities: the observed percent agreement
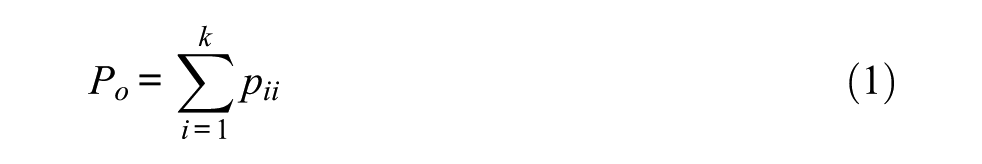
which is the proportion of units on which both raters agree, and the expected percent agreement
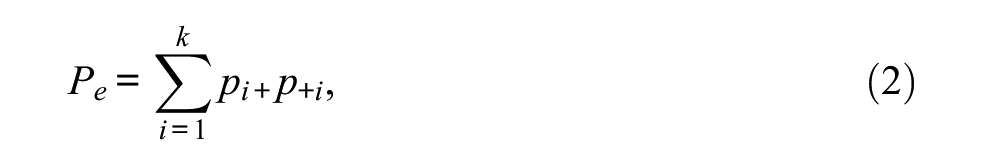
which is the value of the observed percent agreement under statistical independence of the classifications. The observed percent agreement is generally considered artificially high. It is often assumed that it overestimates the actual agreement since some agreement may simply occur due to chance (Bennett, Alpert, & Goldstein, 1954; Cohen, 1960). The kappa coefficient is given by
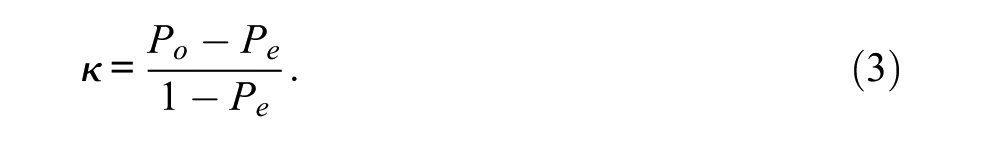
Coefficient (3) corrects for agreement due to chance by subtracting (2) from (1). To ensure that the maximum value of the coefficient is 1, the difference
Landis and Koch (1977) proposed the following guidelines for the interpretation of the kappa value: 0.0 to 0.2 = slight agreement, 0.2 to 0.4 = fair agreement, 0.4 to 0.6 = moderate agreement, 0.6 to 0.8 = substantial agreement, and 0.8 to 1.0 = almost perfect agreement. It should be noted that these guidelines, and any other set of guidelines, are generally considered arbitrary. Except perhaps for 0 and 1, no value of kappa can have the same meaning in all application domains.
Various authors have reported difficulties with kappa’s interpretation. Kappa values depend on the base rates (through
Kappas for Missing Data
In an ideal situation, all units would be rated by both raters. Unfortunately, in real life, missing data can occur. In this article, we consider data missing if a unit was not classified by both raters, or was classified by one rater only. In this section, we consider three variants of Cohen’s kappa that can handle missing data.
Missing Data in a Separate Category
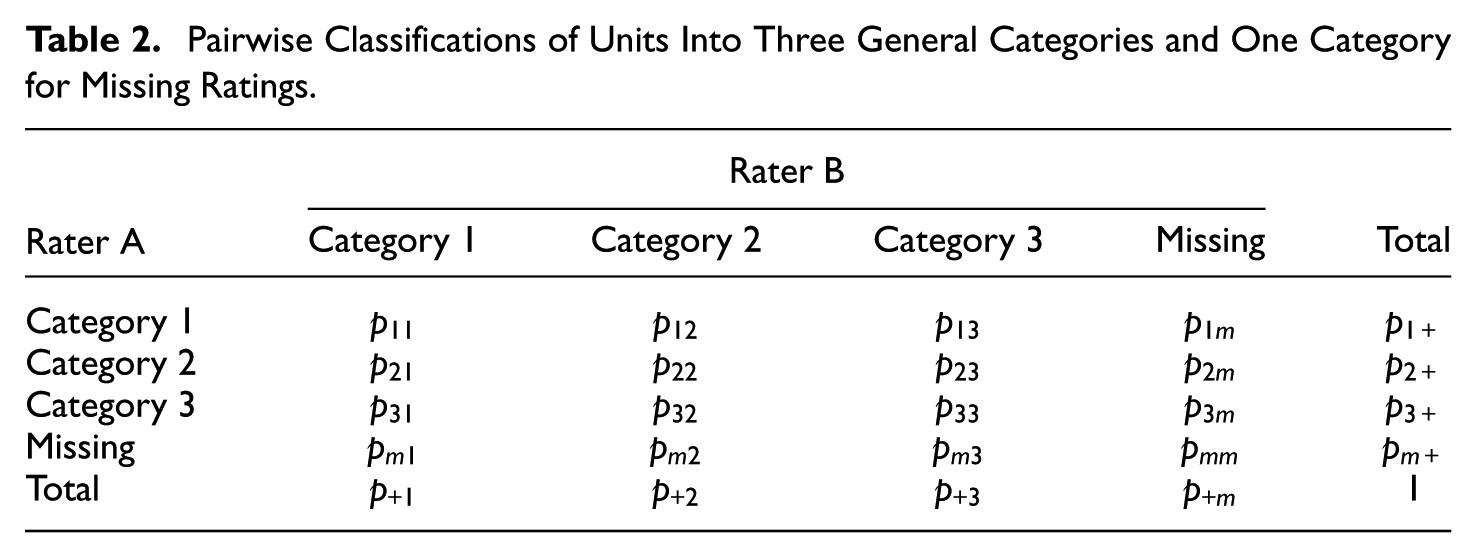
Table 2 is an extended version of Table 1 that includes an extra missing category. This category is denoted by the subscript
Pairwise Classifications of Units Into Three General Categories and One Category for Missing Ratings.
Gwet’s Kappa
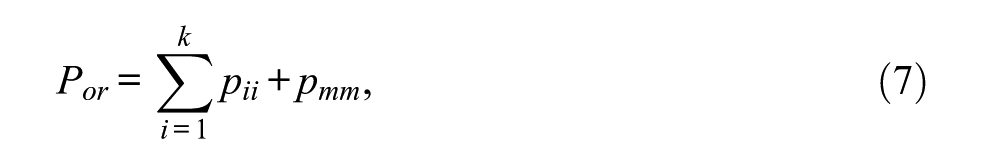
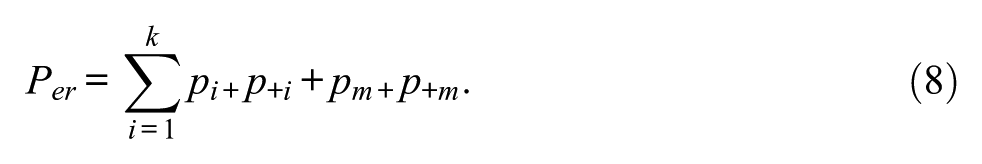
Gwet (2014) proposed a kappa variant that can be explained by means of Table 2. In Gwet’s formulation, only units with two reported ratings are included in the calculation of the observed percent agreement. But units with one reported rating and one missing rating are used in the computation of the expected percent agreement. Units with two missing ratings are excluded from the calculation altogether. The missing data are used to obtain a more precise estimation of the expected percent agreement. The observed percent agreement is defined as
In contrast to the observed percent agreement, the expected percent agreement takes into account (almost) all units in the sample. As illustrated in Table 2, the row totals
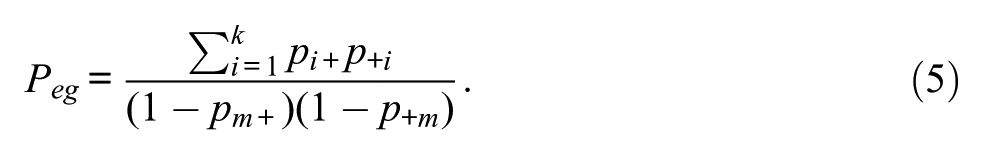
The product in the denominator in (5) only includes units that were classified by Rater A and Rater B, respectively. It is important to note that formula (5) is different from the expected percent agreement presented in Gwet (2012, 2014). Formula (5) can be found on the erratum webpage of the book published in 2014 (www.agreestat.com/book4/errors_4ed.html).
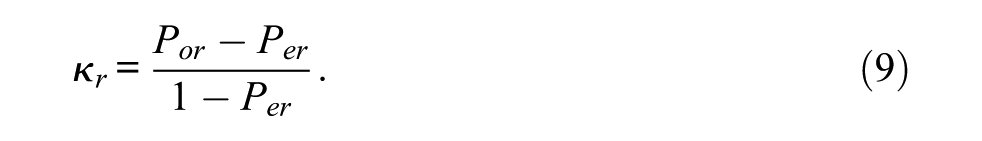
Using (4) and (5), Gwet’s kappa coefficient is given by
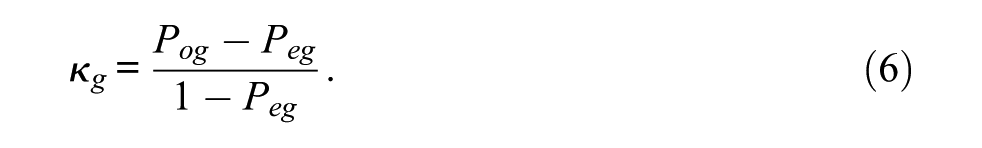
In Gwet’s view, missing ratings by both raters on the same unit do not add to the overall agreement. For this reason, all units associated with the cell
Regular Category Kappa
Another way to deal with missing data is to consider the missing category as a regular category (Strijbos & Stahl, 2007). In this case, units with only one missing rating are considered and treated as disagreements, whereas units with two missing ratings are treated as agreements. In this case, the observed percent agreement is defined as
while the expected percent agreement is defined as
The so-called regular category kappa is then given by
Alternatively, one could define
Listwise Deletion Kappa
A third way to deal with missing data is simply to delete (or ignore) all units that were not classified by both raters and apply the ordinary Cohen’s kappa to the units with two ratings (Strijbos & Stahl, 2007). In statistics, this approach is also known as listwise deletion or a complete-case analysis (Baraldi & Enders, 2010; Enders, 2010; Peugh & Enders, 2004). Therefore, the kappa variant that is based on this approach will be referred to as listwise deletion kappa, and will be denoted by
Simulations
We used simulated data to study how close the values of Gwet’s kappa, regular category kappa, and listwise deletion kappa are to the kappa value for complete data. The latter value will be denoted by
Procedure and Design
We carried out a number of simulations under different conditions, according to the following procedure. We started with an initial agreement table with complete data for
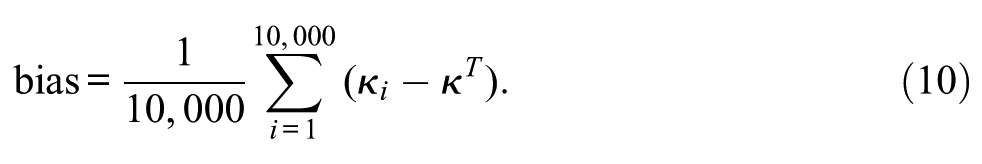
The above steps were repeated 10,000 times. Across the thus constructed 10,000 data sets, we determined the bias for each type of kappa coefficient:
and the mean squared error (MSE)
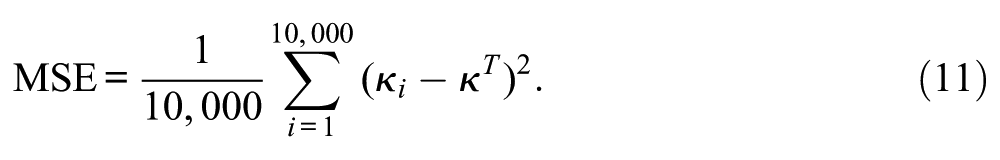
Furthermore, the standard errors of the bias and MSE were also included to get an impression of the fluctuation of bias and MSE across possible repetitions of the simulation.
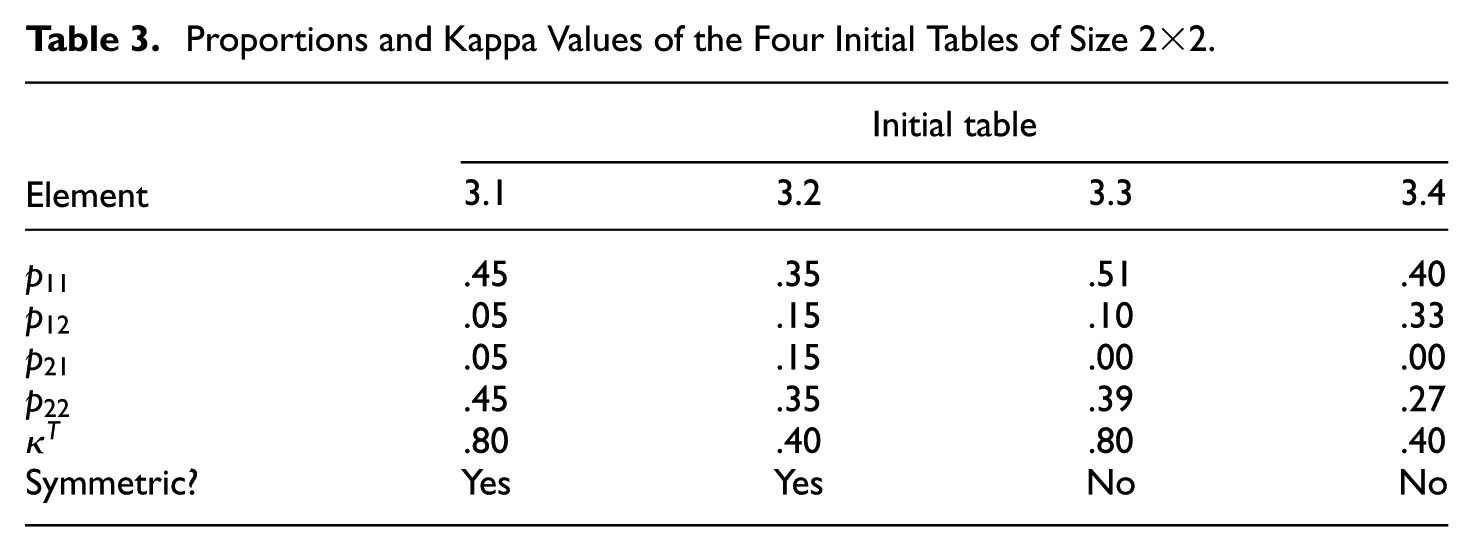
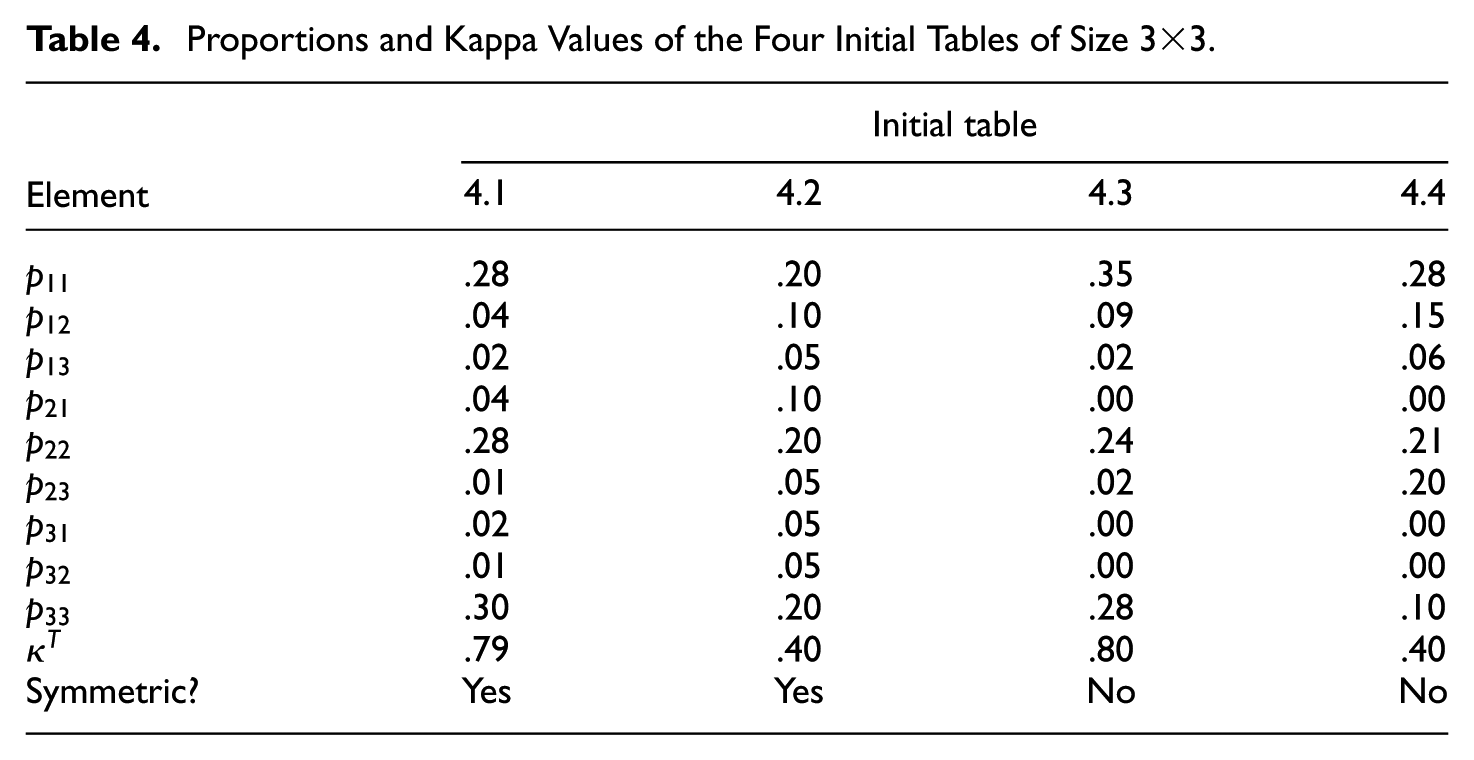
For the simulations, we differentiated between eight initial tables with complete data, four of size
Proportions and Kappa Values of the Four Initial Tables of Size
Proportions and Kappa Values of the Four Initial Tables of Size
We used two different missing data mechanisms—namely, missingness completely at random (MCAR) and a form of missingness not at random (MNAR). With MCAR, each rating has an equal chance to be relabeled as missing, whereas with MNAR, we allowed only ratings associated with the first category to become missing, and each of these has a chance to be relabeled as missing equal to the set modification percentage. So one can expect approximately this percentage of missing within the first category ratings, and no missings elsewhere.
In addition to the two missing data mechanisms, we differentiated between two situations. In the first situation, both raters have missing ratings and each rater had an equal chance that ratings can be relabeled as missing. In the second situation, only Rater A had missing ratings.
In summary, the simulation study design consists of eight initial tables of two different sizes (
Results for
Tables
The results for the initial tables of size
Bias and MSE for 10,000 Simulations With MCAR for Both Raters.
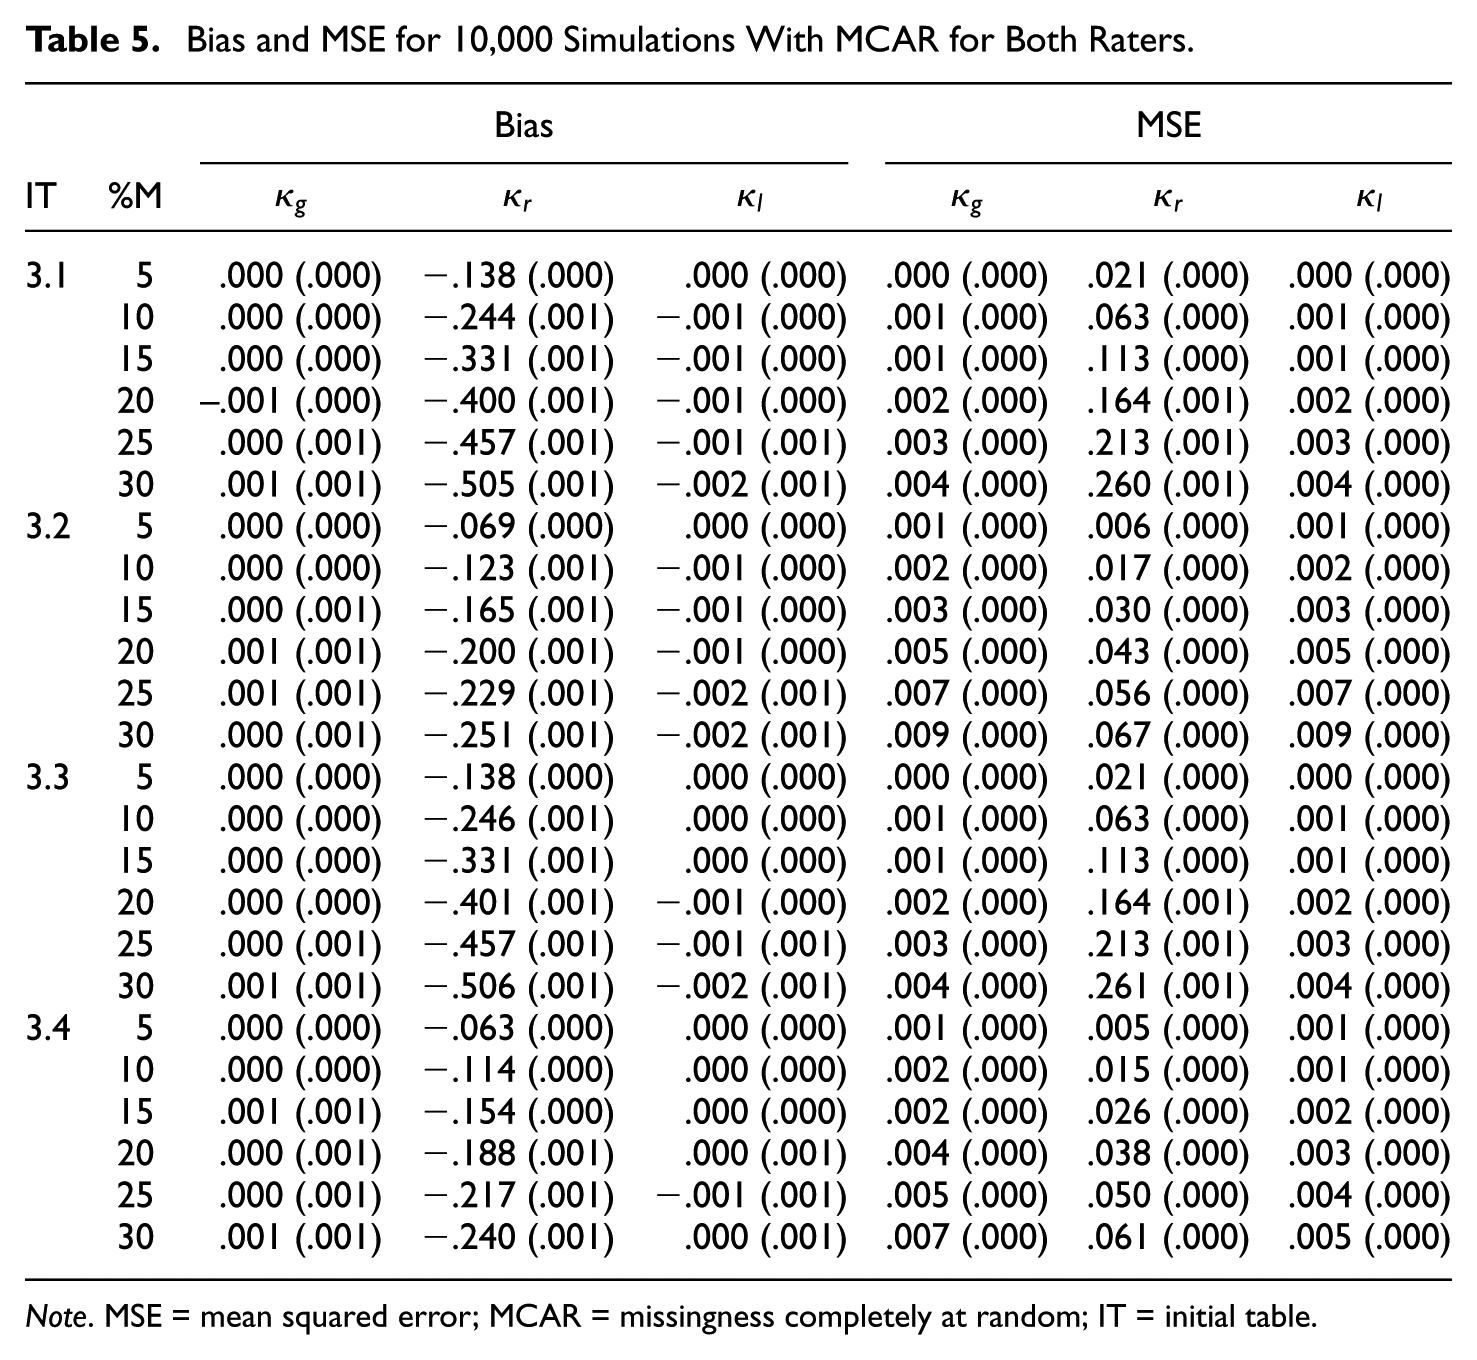
Note. MSE = mean squared error; MCAR = missingness completely at random; IT = initial table.
Bias and MSE for 10,000 Simulations With MNAR for Both Raters.
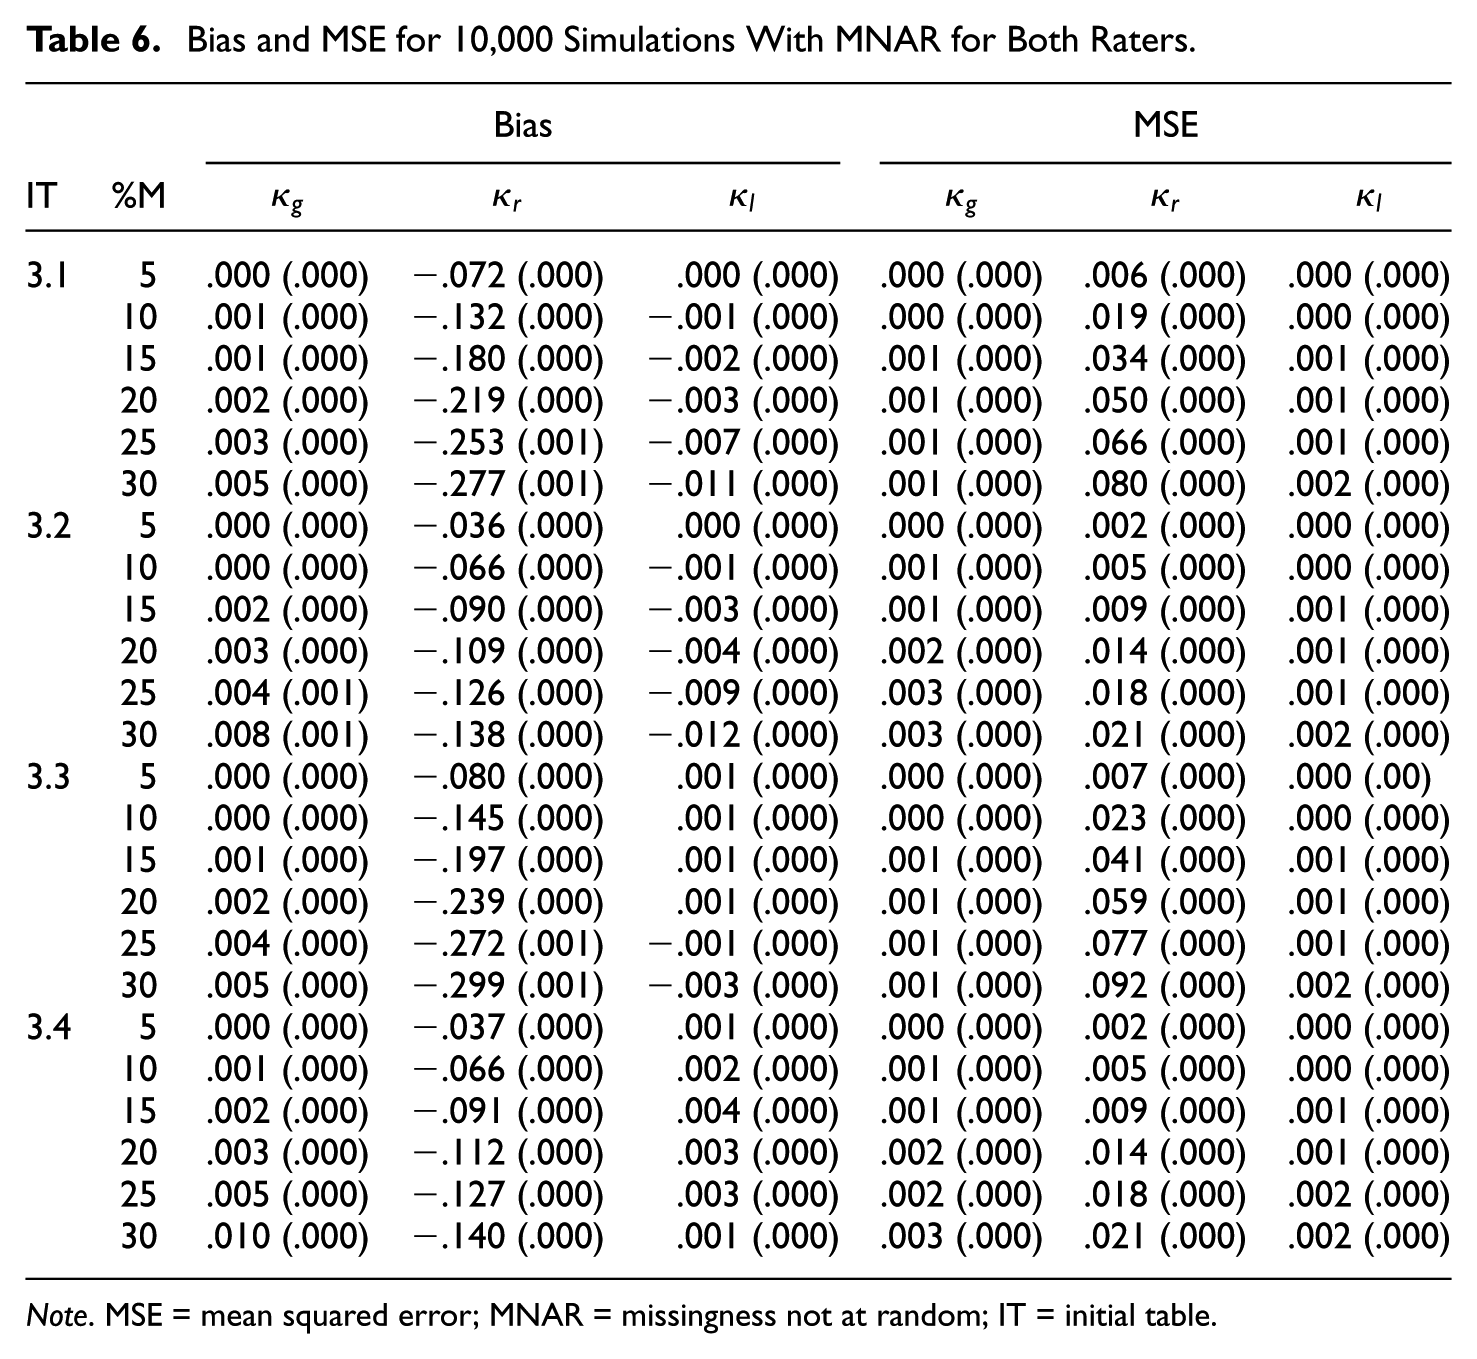
Note. MSE = mean squared error; MNAR = missingness not at random; IT = initial table.
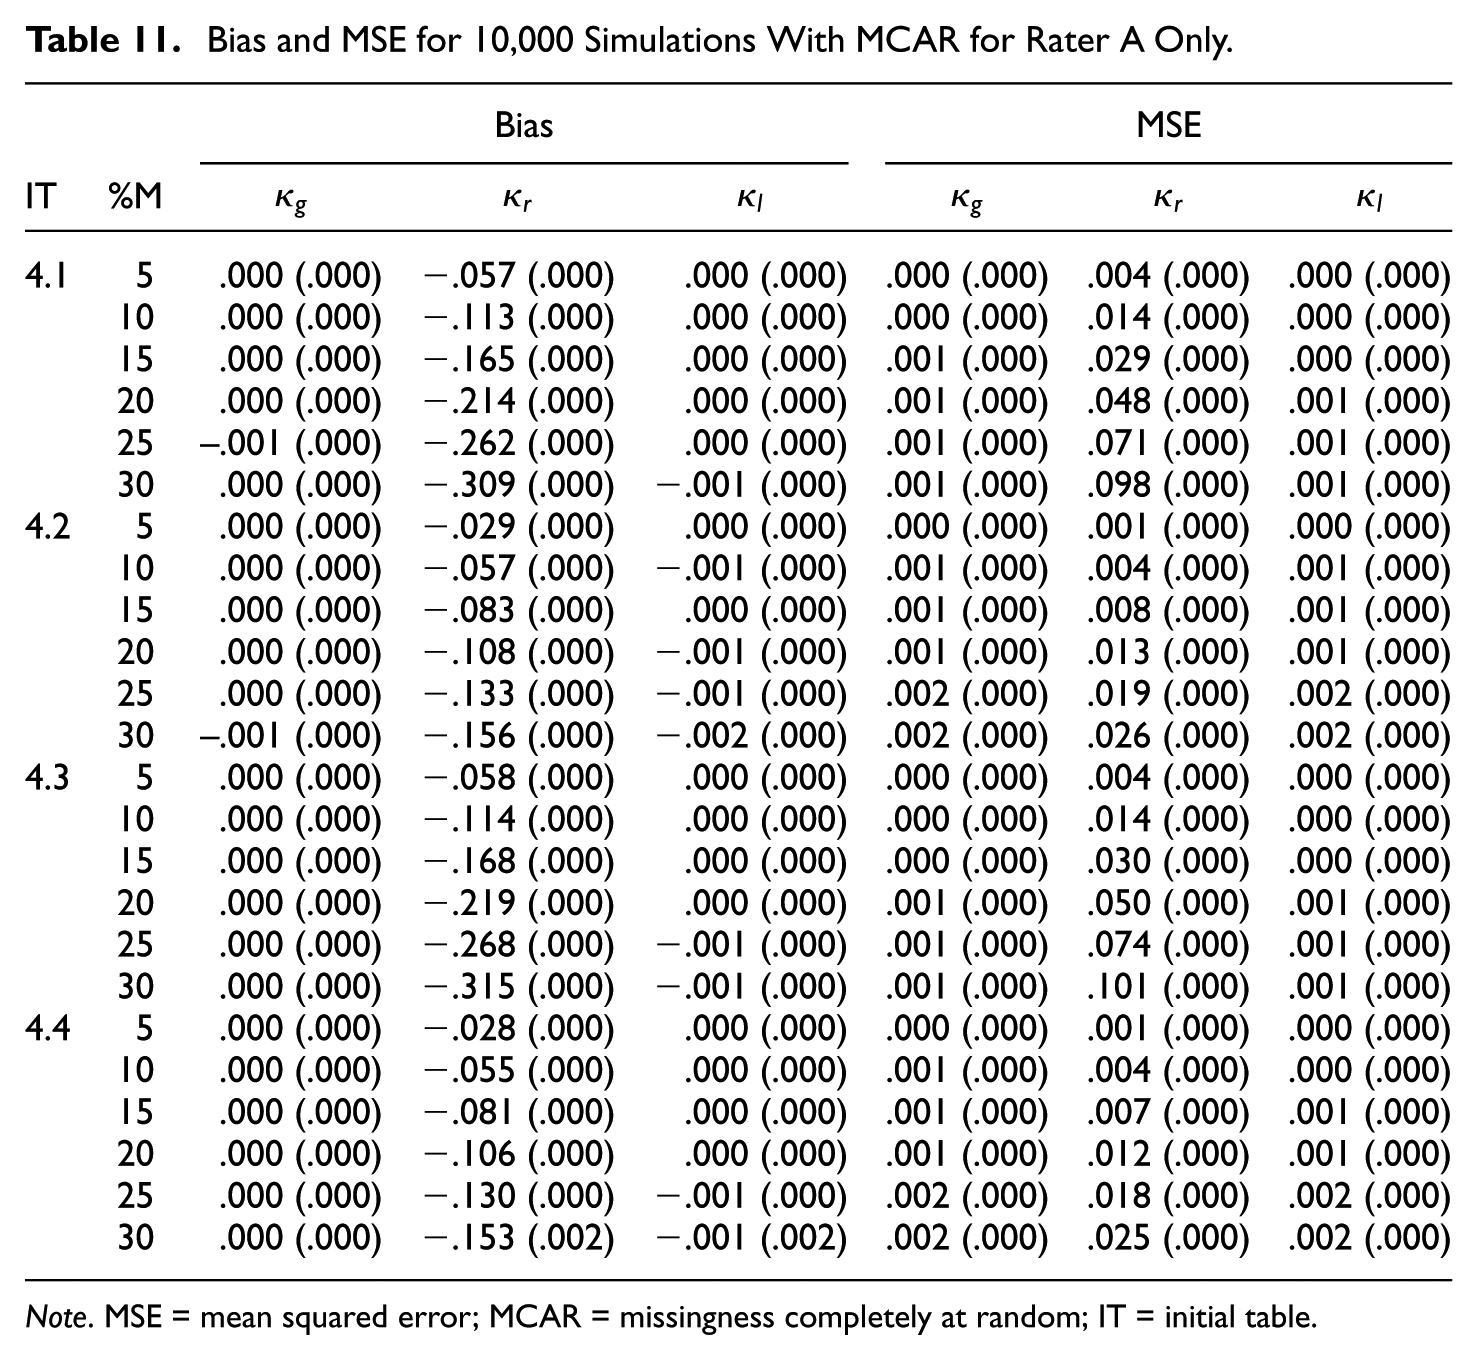
Bias and MSE for 10,000 Simulations With MCAR for Rater A Only.

Note. MSE = mean squared error; MCAR = missingness completely at random; IT = initial table.
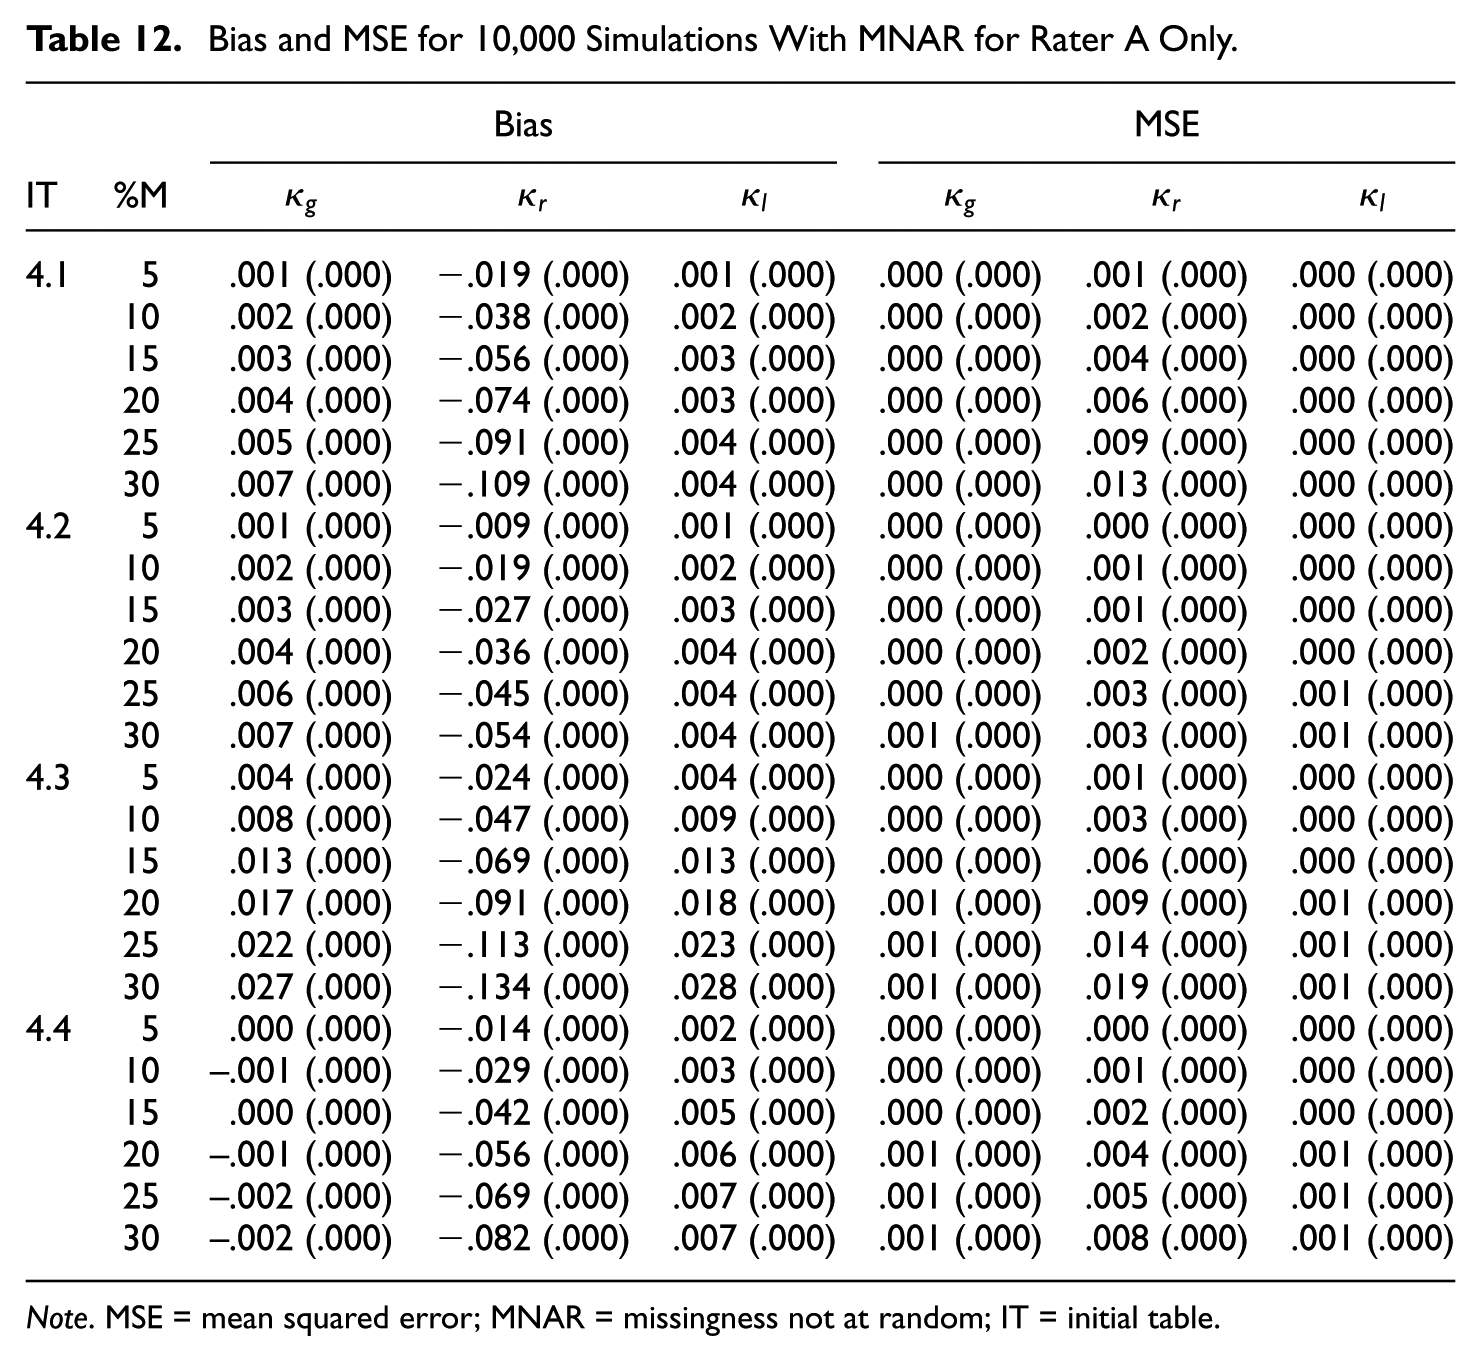
Bias and MSE for 10,000 Simulations With MNAR for Rater A Only.
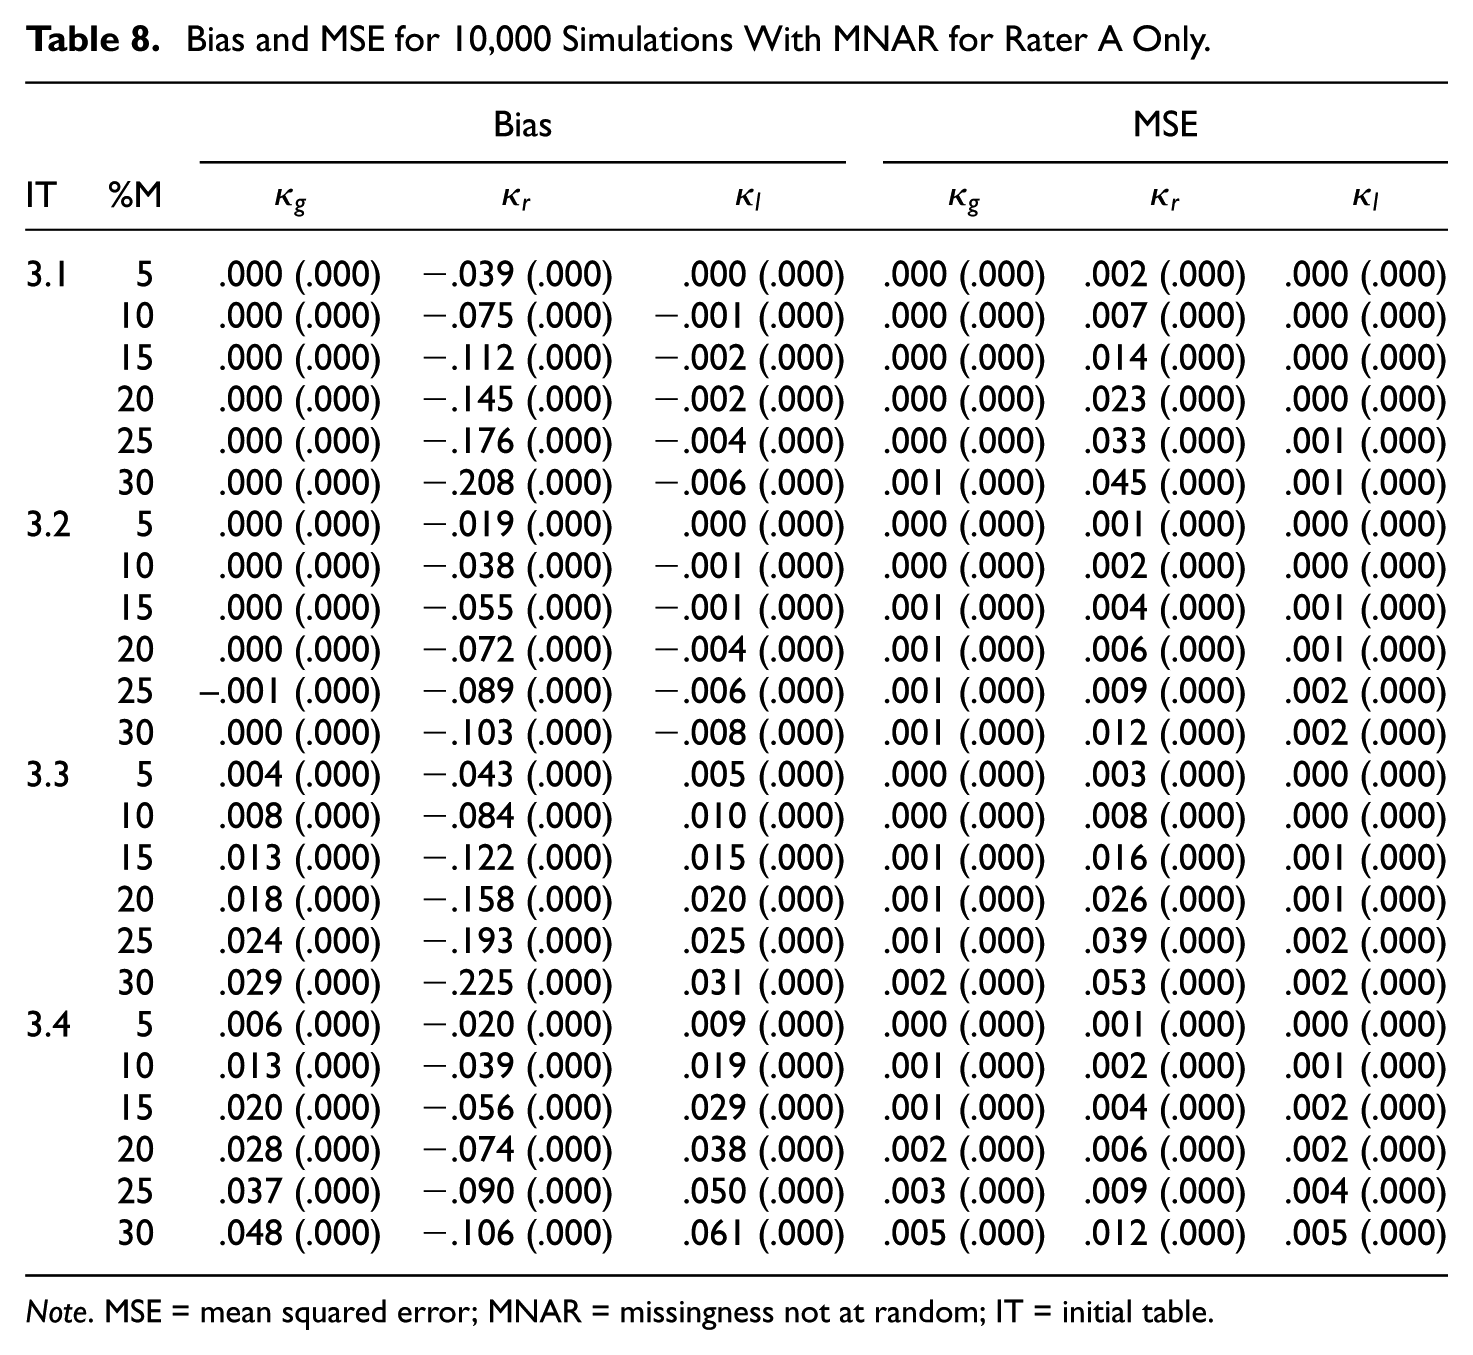
Note. MSE = mean squared error; MNAR = missingness not at random; IT = initial table.
It turns out that regular category kappa is biased downward in all cases of Tables 5 to 8 and that the bias increases with the missingness. Furthermore, the bias of regular category kappa is in almost all simulated cases the most extreme, in the absolute sense, of the three kappa coefficients. If we compare the kappa values of the initial
In virtually all simulated cases, regular category kappa has the highest MSE of the three kappa coefficients. If we compare the kappa values of the initial
In Tables 5 to 8, we see that the results for Gwet’s kappa and listwise deletion kappa are very similar. Both kappa coefficients are virtually unbiased in case of MCAR and only slightly biased in case of MNAR. Furthermore, the associated MSE values are generally very small—that is,
Finally, there are only slight differences between the symmetric and asymmetric cases, whether only one rater or both raters had missing ratings, and between the two missing data mechanisms. An exception is that regular category kappa is more biased in the case of MCAR compared with MNAR. Moreover, all standard errors are smaller than
Results for
Tables
The results for the initial tables of size
Bias and MSE for 10,000 Simulations With MCAR for Both Raters.
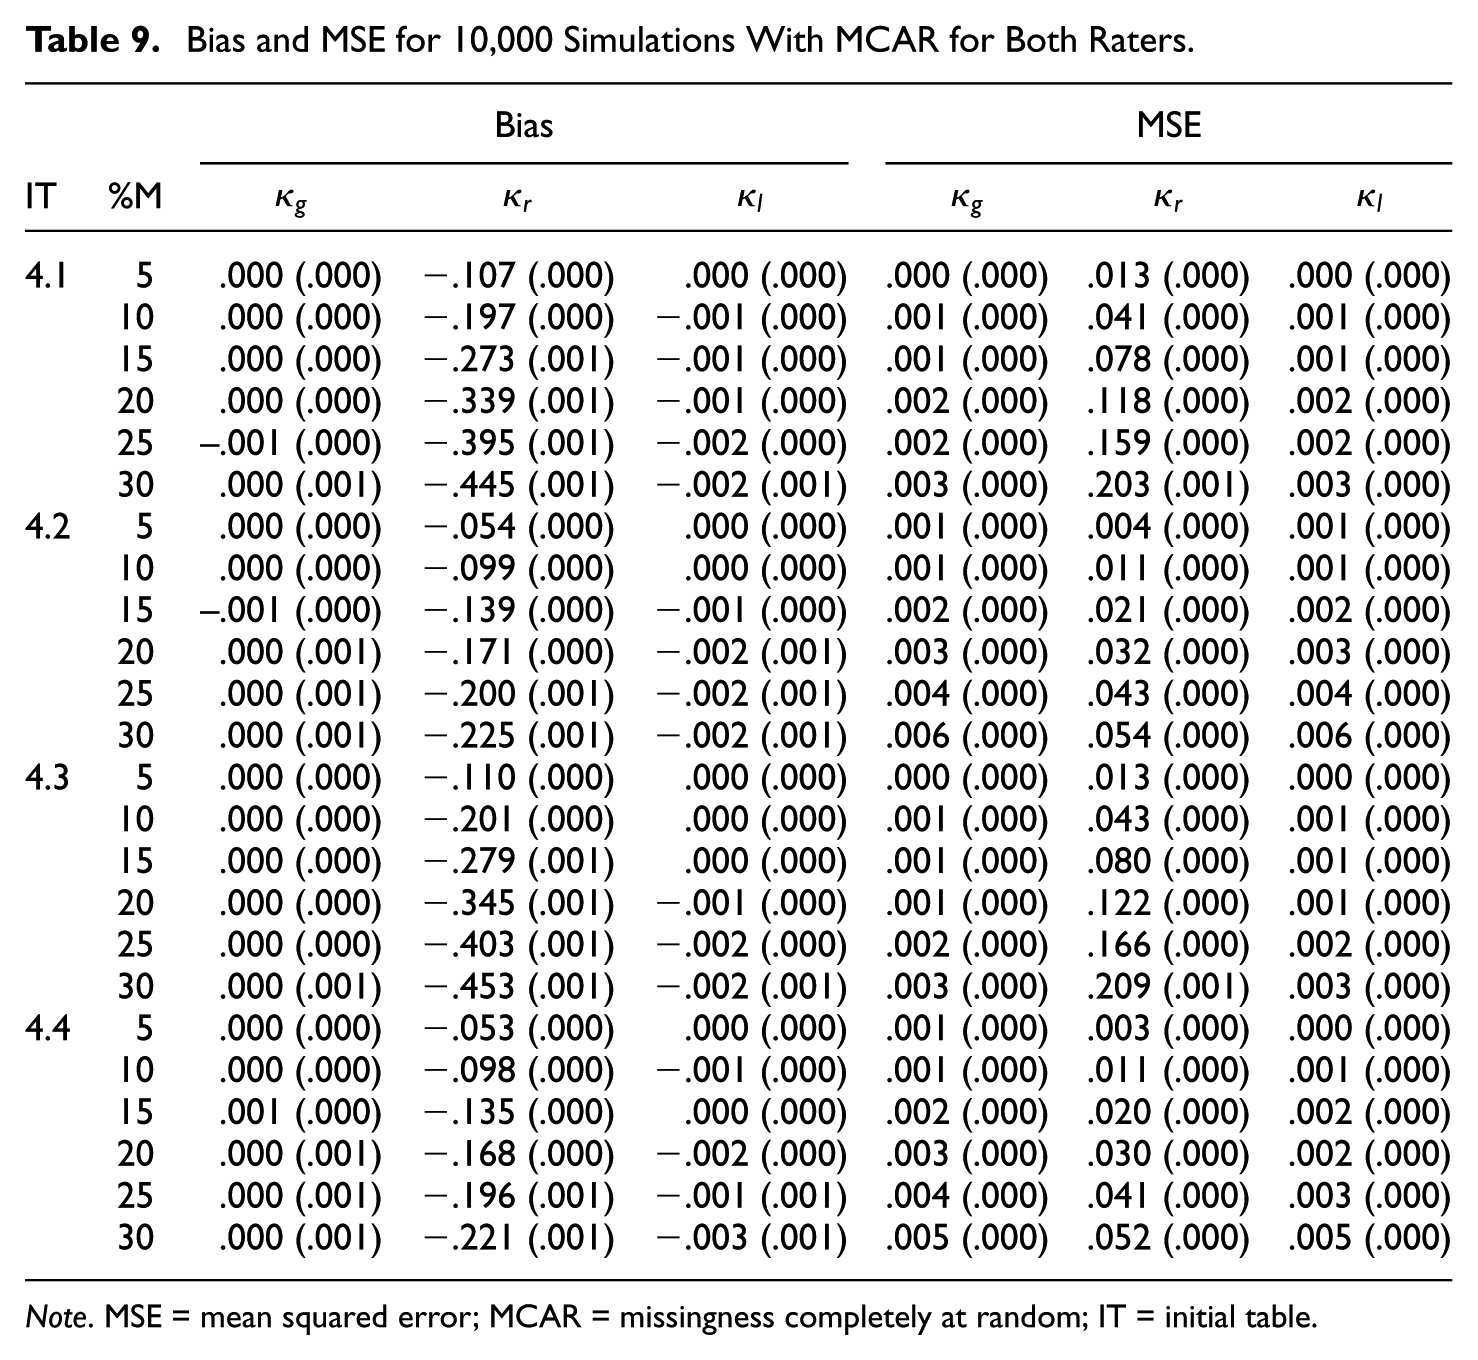
Note. MSE = mean squared error; MCAR = missingness completely at random; IT = initial table.
Bias and MSE for 10,000 Simulations With MNAR for Both Raters.
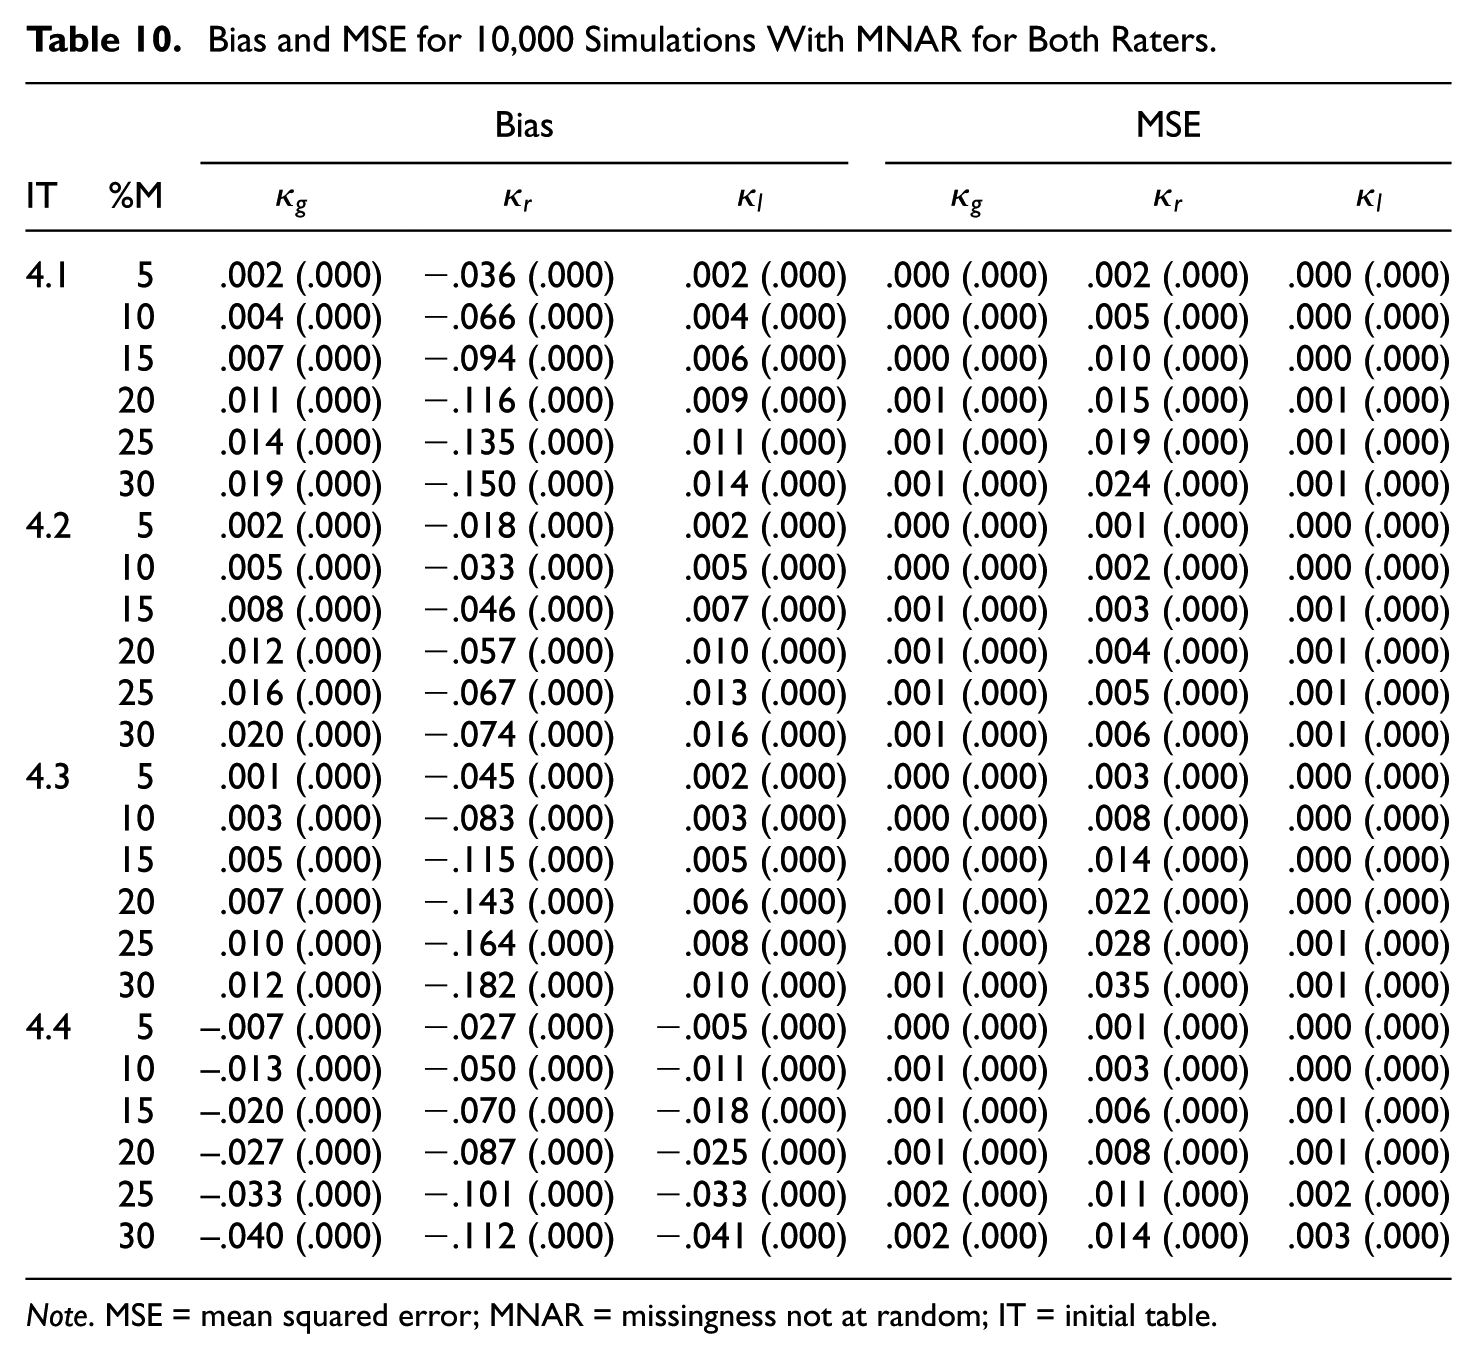
Note. MSE = mean squared error; MNAR = missingness not at random; IT = initial table.
Bias and MSE for 10,000 Simulations With MCAR for Rater A Only.
Note. MSE = mean squared error; MCAR = missingness completely at random; IT = initial table.
Bias and MSE for 10,000 Simulations With MNAR for Rater A Only.
Note. MSE = mean squared error; MNAR = missingness not at random; IT = initial table.
The results in Tables 9 to 12 for the
Regular category kappa is again biased downward in all cases, and the bias increases with the missingness. Furthermore, the bias and MSE are more substantial if the kappa value is high (
In terms of bias and MSE, both Gwet’s kappa and listwise deletion kappa perform quite well in many simulated cases. Both kappa coefficients are virtually unbiased in case of MCAR. However, there is some bias in case of MNAR (see Tables 10 and 12). In general, the MSE values are again very small—that is,
Discussion
In this article, we considered and compared three kappa coefficients for nominal scales that can handle missing data. We referred to these kappas as Gwet’s kappa (Gwet, 2014), regular category kappa, and listwise deletion kappa (Strijbos & Stahl, 2007). Data are considered missing if one or both ratings of a person or object are missing. In Gwet’s kappa, formulation of the missing data are used in the computation of the expected percent agreement to obtain more precise estimates of the marginal totals. Regular category kappa treats the missing category as a regular category. Listwise deletion kappa is only applied to units with two ratings (complete-case analysis).
In this study, we found that both Gwet’s kappa and listwise deletion kappa outperform regular category kappa in all simulated cases in terms of bias and MSE. Overall, both kappa coefficients are virtually unbiased in case of MCAR and only slightly biased in case of MNAR. Furthermore, the MSE of Gwet’s kappa and listwise deletion kappa is generally very small. Therefore, if one of the two missing data models studied in this article can be assumed to hold, both kappa coefficients can be used.
If we have to pick one, we recommend to use listwise deletion kappa, because its value is easier to compute. Listwise deletion kappa can be obtained by performing a complete case analysis with Cohen’s ordinary kappa. Thus, this kappa coefficient for missing data can be computed with any software program that has implemented a routine for Cohen’s kappa. We generally advise against the use of regular category kappa, since the coefficient has unacceptable bias in just too many different situations.
We want to warn readers that they do not use the version of the expected percent agreement of Gwet’s kappa printed in Gwet (2012) and Gwet (2014) but, instead, use the version presented in this article (formula 5) which is the one that can be found on the erratum webpage of the book published in 2014 (www.agreestat.com/book4/errors_4ed.html). In unreported simulation studies, we found that using the kappa as printed in Gwet (2012) and in Gwet (2014) leads to a substantial upward bias in many of the simulated cases. These results are available on request.
This research was limited to two general-purpose missing data mechanisms. Furthermore, the research was limited to complete data tables that have two or three categories. It may be the case that the kappa coefficients perform differently under other missing data mechanisms or for higher numbers of categories. This is a topic for future research. However, we believe that it is likely that the results found in this article also apply to cases with higher numbers of categories, because the pattern of results did not change much when going from two to three categories.
The research presented in this article was limited to three kappa coefficients that have been proposed in the literature for handling missing data (Gwet, 2012; Simon, 2006; Strijbos & Stahl, 2007). The coefficients are based on approaches that are considered traditional methods in the missing data analysis literature (Baraldi & Enders, 2010; Enders, 2010; Peugh & Enders, 2004). Modern approaches to missing data are based on maximum likelihood and multiple imputation (see, e.g., Lang & Wu, 2017). Applying the modern methods to the context of assessing interrater agreement is an important topic for future research.
Footnotes
Declaration of Conflicting Interests
The author(s) declared no potential conflicts of interest with respect to the research, authorship, and/or publication of this article.
Funding
The author(s) received no financial support for the research, authorship, and/or publication of this article.