
Abstract
Tests administered in studies of student achievement often have a certain amount of not-reached items (NRIs). The propensity for NRIs may depend on the proficiency measured by the test and on additional covariates. This article proposes a semiparametric model to study such relationships. Our model extends Glas and Pimentel’s item response theory model for NRIs by (1) including a semiparametric representation of the distribution of the onset of NRIs, (2) modeling the relationships of NRIs with proficiency via a flexible multinomial logit regression, and (3) including additional covariates to predict NRIs. We show that Glas and Pimentel’s and our model have close connections to event history analysis, thereby making it possible to apply tools developed in this context to the analysis of NRIs. Our model was applied to a timed low-stakes test of mathematics achievement. Our model fitted the data better than Glas and Pimentel’s model, and allowed for a more fine-grained assessment of the onset of NRIs. The results of a simulation study showed that our model accurately recovered the relationships of proficiency and covariates with the onset of NRIs, and reduced bias in the estimates of item parameters, proficiency distributions, and covariate effects on proficiency.
Keywords
Within scientific studies of student achievement, tests are typically administered with a time limit. As a consequence, students might not reach the end of a test within the allotted testing time, and this can lead to a special type of missing data, reflected in the number of not-reached items (NRIs). NRIs imply a monotone pattern of missing data; that is, all items located after the first item not reached are missing. Hence, the earlier the onset of NRIs, the more item responses are missing in a test. NRIs have received some attention in the psychometric literature because the onset of NRIs appears to be related to the proficiency measured by the test (Glas & Pimentel, 2008; Köhler, Pohl, & Carstensen, 2015a; Lawrence, 1993; Pohl, Gräfe, & Rose, 2014). As a reaction to the problem, item response theory (IRT; Embretson & Reise, 2000) models that make it possible to estimate the relationships between proficiency and the onset point of NRIs have been developed, with the approach suggested by Glas and Pimentel (2008) being most frequently used (e.g., Pohl et al., 2014). However, the model of Glas and Pimentel (2008), as well as many other approaches (e.g., Hutchison & Yeshanew, 2009), assumes a linear relationship between proficiency and the onset of NRIs: an assumption that might be questioned in many applications.
Linear relationships between NRIs and the proficiency measured by the test appear most plausible in testing situations in which NRIs can be conceived as pure reflections of test speededness (e.g., Evans & Reilly, 1972), such as in the case of high-stakes tests, where test takers invest full effort to respond to all items in the test. Here, students with higher proficiencies might solve the items at a higher pace, which means that they are more likely to reach the end of the test. However, even in situations in which test takers show their maximum performance, nonlinear relationships between proficiency and NRIs could exist because test takers at low proficiency levels might reach the end of the test by applying too simplistic or quick strategies to difficult items. In this case, test takers at an intermediate proficiency level might then show the slowest solution behavior, leading to an earlier onset of NRIs. Relationships between proficiency and the onset point of NRIs appear likely to be complex in situations in which students are not motivated to show their maximum performance. In low-stakes assessments, test-taking behavior has been found to be related to test-taking motivation (Wise & DeMars, 2005), which means that NRIs could be affected by motivational reactions to the test. Therefore, students with low proficiencies might either have an early onset of NRIs because they become frustrated with the test, or they might complete the test without investing much effort. Hence, the distribution of NRI onsets could be multimodal for certain levels of proficiency.
In addition, the amount of NRIs could also depend on person characteristics as well as on the proficiency being measured by the test (e.g., Dorans, Schmitt, & Bleistein, 1992; Evans & Reilly, 1972; Köhler et al., 2015a; Schmitt, Dorans, Crone, & Maneckshana, 1991). In principle, person variables could be related to the students’ proficiencies and to the onset of NRIs. Hence, the question arises of whether NRIs can be fully predicted by the proficiency variable, or whether the person covariates have an additional impact on NRIs when proficiency is held constant. This question has some similarity with the concept of differential test functioning (Shealy & Stout, 1993) that refers to the question of whether a test works differently for examinees with the same proficiency but taken from different groups. Therefore, a finding that a covariate has an effect on NRIs while conditioning on proficiency indicates a differential onset of NRIs in examinees of the same proficiency, implying a systematic difference in the amount of information provided (i.e., the number of item responses preceding NRIs) to measure proficiency at the different levels of the covariate. Such differences could be due to different mechanisms, such as mastery in the test language or test-taking motivation, among others. Native speakers have been found to respond to more items in the allotted testing time (Schmitt & Bleistein, 1987; Sireci, Han, & Wells, 2008), and higher test-taking motivation has been found to be related to more time being spent on tasks (Scherer, Greiff, & Hautamäki, 2015), which could lead to an earlier onset of NRIs. However, as the background characteristics examined could be related to proficiency, in both examples, a rigorous test of the effects of students’ background characteristics on NRIs requires the impact of proficiency on NRIs to be accounted for.
The aim of the present article is to provide a flexible and easy-to-use IRT approach for modeling the onset of NRIs as a possibly nonlinear function of the proficiency measured by the test, as well as of additional person covariates. Our model combines a two-parameter logistic (2PL) IRT model (Birnbaum, 1968), applied to the item responses, with a latent class model (LCM; Formann, 1985), applied to the indicators of NRIs. Our LCM can be conceived as a semiparametric version of the continuous steps model for assessing the onset of NRIs suggested by Glas and Pimentel (2008). In our approach, the relationships of the onset of NRIs with the proficiency variable and the additional covariates were modeled via a multinomial logit regression, thereby allowing for nonlinear relationships. The newly proposed model was applied to a timed low-stakes test of mathematics achievement in order to demonstrate its utility in applied settings. In a small simulation study, we further investigated whether the model correctly recovers the relationships of NRIs with proficiency and covariates, and whether our approach reduces biases in the estimates of item parameters, proficiency distributions, and covariate effects on proficiency that are often found in IRT models that disregard missing responses (e.g., Rose, von Davier, & Xu, 2010).
Relationships of NRIs With Proficiency and Covariates
Several studies have documented relationships between the onset of NRIs and the characteristics of test takers. Results suggest that the amount of NRIs is higher in ethnic minority groups (Dorans et al., 1992; Schmitt & Bleistein, 1987; Schmitt et al., 1991) but does not appear to differ between gender groups (Evans & Reilly, 1972; Schmitt et al., 1991; Wild, Durso, & Rubin, 1982). Some more recent studies have examined the relationships between NRIs and the proficiency measured by the test by adopting the IRT approach suggested by Glas and Pimentel (2008). These studies provide evidence for statistically significant relationships between proficiency and the onset of NRIs, but the pattern of results differed between tests and samples (Glas & Pimentel, 2008; Pohl et al., 2014). Most recently, Köhler et al. (2015a) studied the predictors of NRIs in reading tests implemented in several age groups. Their analyses revealed reading speed to be a strong and consistent predictor of NRIs, in that faster readers had a later onset of NRIs. Köhler et al. (2015a) employed the number of NRIs as a dependent variable in linear regression analyses. Similarly, researchers employing the model of Glas and Pimentel (2008) also did not investigate the nonlinear relationships that, as we have described above, appear plausible in the case of NRIs.
Investigating the effects of covariates on NRIs while simultaneously controlling for latent proficiency might be of interest for two reasons. First, in studies aiming to describe the distribution of student proficiencies in different subpopulations, the differential onset of NRIs indicates a threat to the validity of group comparisons as it means that groups differ in their test-taking behavior. Thus, group differences in proficiency might be different if respondents of the same proficiency level show the same test-taking behavior. Second, the effect of covariates on the onset of NRIs, while controlling for proficiency, could be a key research question in some applications. For example, researchers might hypothesize that a specific curricular intervention raises students’ proficiencies and, in addition, enhances the pace at which students work on the test, thereby reducing the number of NRIs. To provide support for this hypothesis, a result indicating a differential onset of NRIs would be required.
Taken together, the differential onset of NRIs indicates that proficiency does not provide a sufficient explanation for differences in the onset of NRIs across different levels of a covariate. Therefore, differential onsets of NRIs indicate that test takers that differ with respect to the covariate’s value, but not to the level of proficiency, show different test-taking behavior. The differential onset of NRIs could indicate that the equivalence of measuring the proficiency variable across groups is violated. However, whether such a finding is considered as a threat to the validity clearly depends of the aims of the investigation.
IRT Models for Missing Responses and the Onsets of NRIs
Missing item responses in tests are regarded as problematic because they are likely to be related to the proficiencies being measured. As such, the missing data are nonignorable (NMAR; Little & Rubin, 2002), which means that missing data mechanisms need to be included in the model in order to prevent biased parameter estimates. To accomplish this task within the framework of the IRT, the full data likelihood that includes the vector of item scores
Pattern mixture IRT models (Little, 1994) aim to stratify the sample according to distinct missing-data patterns. They provide indications of NMAR patterns when the proficiency variable (e.g., its mean) differs between strata. Practically, these models can be implemented either by means of multigroup IRT models, in which the groups are defined by distinct patterns of missingness, or by regressing the proficiency variables on indicators of the missing-data patterns, as well as on the covariates (e.g., Rose, von Davier, & Nagengast, 2017). In the context of NRIs, Rose et al. (2010) suggested regressing the continuous proficiency variable on the number of the individuals’ NRIs. The model can be extended to include
A second type of models assumes that additional latent variables underlie the missing-data indicators
Selection models (Little & Rubin, 2002) refer to the third type of models that can be applied to account for NMAR patterns. Here, the full data likelihood

Because
NRIs reflect a special kind of missing data, because once an item response is missing in the sequence of test items, all responses that follow the first missing response are also missing. Hence, this pattern of missing data can be regarded as being irreversible. Such situations are often at the core of longitudinal investigations that focus their attention on the risk (or hazard) that some irreversible events occur over time by employing methods known as event history analysis or survival analysis (Allison, 2014; Singer & Willett, 1993). Hence, the occurrence of NRIs over the sequence of test items, as represented by
Glas and Pimentel’s (2008) Model for NRIs in Speeded Tests
Glas and Pimentel (2008) considered NRIs and proposed a two-dimensional IRT model that includes a latent proficiency dimension and a second dimension indicating the number of items attempted by the examinees (i.e., a steps variable). The indicators of the proficiency variable are the actual item responses. In the case of dichotomous item responses, the proficiency variable is defined according to the 2PL model such that:

which means that the logit of the probability of a correct item response of individual i (i = 1, 2,. . ., N) to item j (j = 1,2, . . ., J),
The latent variable that assesses the onset of NRIs is measured by means of response indicators that are defined as follows: For each examinee, the vector of response indicators consists of a series of “1” for all items to which the examinee responds, followed by, at most, one “0” for the first NRI, and missing flags for all subsequent NRIs. For example, in a hypothetical seven-item test, an examinee who does not reach the last three items receives a vector of response indicators of
The steps variable underlying response indicators is defined by the steps model (Verhelst, Glas, & de Vries, 1997), which expresses the probability that a response is observed in a particular item position, given that all former item responses were observed. Glas and Pimentel (2008) presented applications in which the steps model included only a difficulty parameter, similar to the Rasch model (Rasch, 1960), such that

where
The proficiency variable
Relationships to Discrete-Time Event History Analysis
As previously mentioned,

with

showing that the model implies the same effect of the proficiency variable on the logit of each response indicator irrespective of its position.
Equation (5) has direct connections to discrete-time event history analysis, which models the effect of a variable on the probability that an irreversible event will occur, given that the event has not occurred before. If the ideas of event history analysis are applied to the phenomenon of NRIs, the focus is on

Hence, the model of Glas and Pimentel (2008) can be reformulated as a kind of discrete-time event history model that is applied to the sequence of test items instead of to the sequence of time points, which means that the model can be understood as a discrete (item) sequence event model (DSEM). In Equation (6),
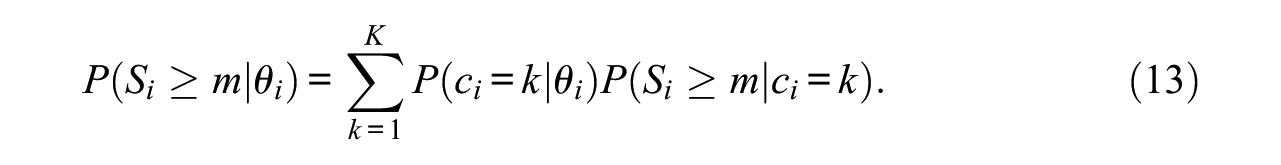
The DSEM formulation of Glas and Pimentel’s (2008) model makes it possible to apply the graphical tools developed in the context of event history analysis to the onset of NRIs. Here, we focus on the survival function, which depicts the probability of “surviving” over a sequence of m (m≤J) items as a function of the explanatory variable
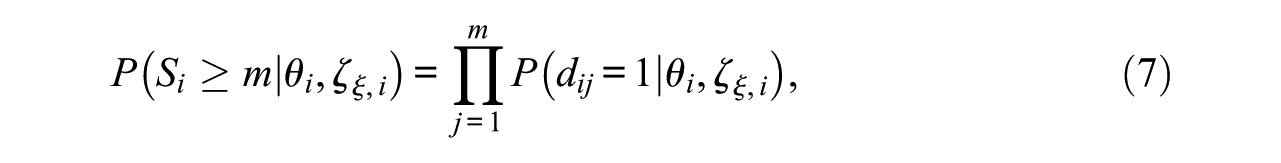
where
To sum up, the model suggested by Glas and Pimentel (2008) can be reformulated as a DSEM. This shows that Glas and Pimentel’s (2008) model builds upon the proportional hazards assumption, that is, it specifies that
A Semiparametric Model for the Onset of NRIs
In this section, we present a semiparametric version of the model of Glas and Pimentel (2008), which makes less strong assumptions about the distribution of the steps variable (i.e., the

In Equation (8),
In our semiparametric version of the steps model, we specify

As shown in Equation (9),
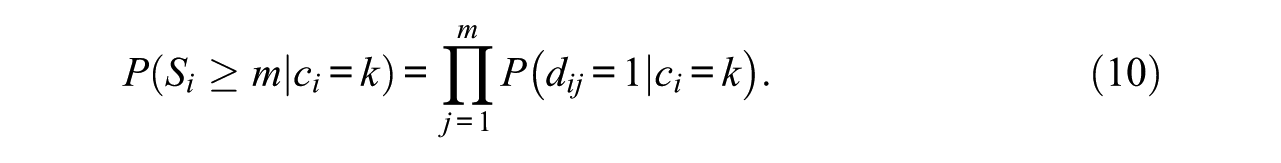
The model for response indicators has connections to mixture discrete-time event history analysis (B. Muthén & Masyn, 2005). As the pattern of probabilities of response indicators is constant within each latent class, each class provides one survival function:
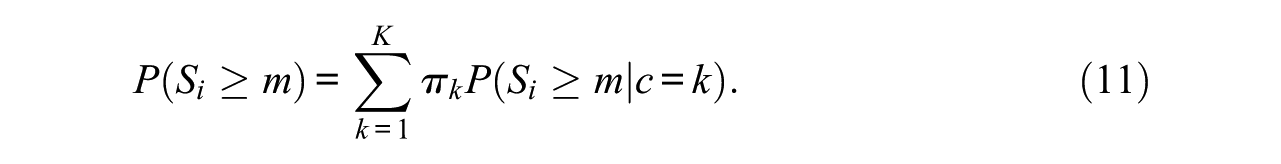
Furthermore, the marginal survival function can be derived by summing over the class-specific survival functions (Equation 10) weighted by their class proportions:
The semiparametric approach allows for heterogeneity in the latent steps variable
The main motivation behind our semiparametric approach was to relax the proportional hazards assumption implicitly made in the model of Glas and Pimentel (2008; see Equation 6). Here, we estimate the impact of
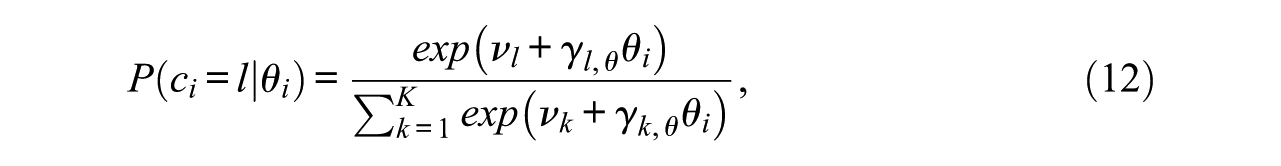
where
By using the multinomial regression (Equation 12), the proportional hazards assumption is relaxed. Since, for each latent class c, a regression coefficient is estimated, an overall nonlinear relationship between proficiency and the onset of NRIs is modeled. For example, the analysis could uncover that
The model described in Equations (9) and (12) fits into the framework of mixture discrete-time event history models (B. Muthén & Masyn, 2005). Therefore, we refer to this model as mixture discrete (item) sequence event model (MDSEM). In the MDSEM, the survival function that depends on
The MDSEM provides a flexible and easy-to-use framework for deriving the survival functions at fixed values of
Introducing Additional Covariates
We now address the case of introducing covariates into the model. To keep the presentation simple, we focus on the case with a single covariate x, but note that multiple covariates could be included simultaneously. We begin by using x for predicting θ. Here, we assume a linear relationship, such that

where
The relationship between latent classes and predictors θ and x is now given as
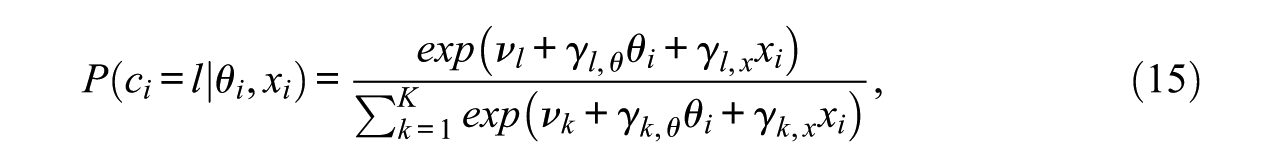
where the parameters are as defined as before (Equation 12) and subjected to the same identification constraints. The only difference is that the multinomial regression part is extended by the covariate x and its class-specific multinomial regression weight
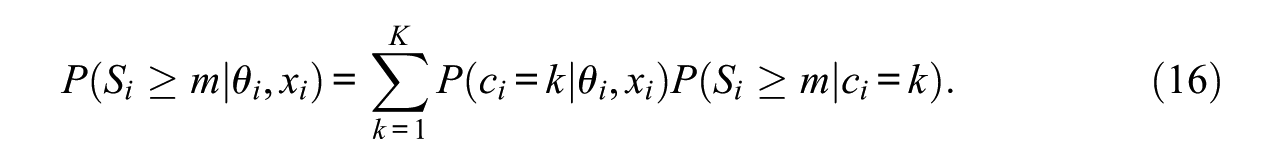
Equation (15) is of key importance to the suggested model. More specifically, the hypothesis that missing data caused by NRIs do not depend on the covariate x (or on a set of covariates
If the covariate x is found to predict latent class membership, its impact can be visualized by using the survival function, evaluated with selected combinations of
Model Estimation and Implementation
The MDSEM can be estimated by maximum likelihood estimation. Indeed, Guo, Wall, and Amemiya (2006) have outlined the estimation of a general class of models, of which the MDSEM is a special case. The joint distribution of the item responses
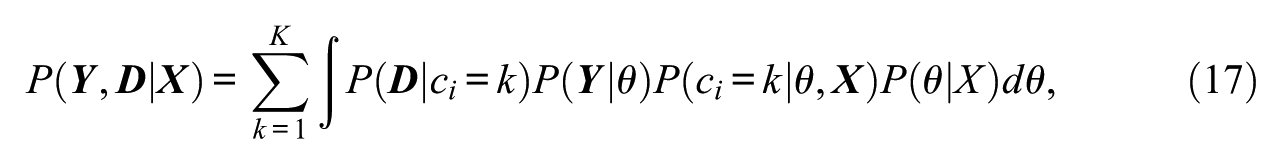
with the full data likelihood function L given by
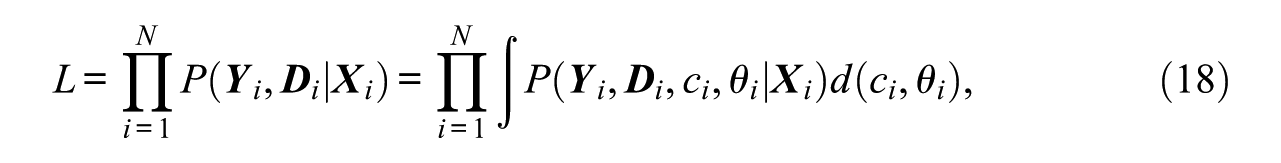
whereby the integral includes the continuous integral over
Guo et al. (2006) have shown that the model parameters can be estimated by means of the expectation maximization (EM) algorithm, as well as by a Gaussian quadrature with a quasi-Newton algorithm. Hence, the MDSEM can be estimated with different computer programs, including Latent Gold (Vermunt & Magidson, 2005) and Mplus (L. K. Muthén & Muthén, 1998-2012). In the present article, we used Mplus, which combines the aforementioned algorithms to a so-called accelerated EM algorithm (EMA). Model estimation starts with the EM algorithm but changes to the quasi-Newton algorithm if EM becomes slow.
There are several issues that need to be considered in practice. The first issue is how to define the metric of the proficiency variable. In most IRT applications, this issue is resolved by standardizing the distribution of
The second issue is that NRIs might not exist in the first positions of a test. As a consequence, all response indicators gathered before the first onset of NRIs have a constant value across all respondents, which means that they should be disregarded in the process of model estimation.
The third issue pertains to the optimal number of latent classes. In applications of latent class analysis, the decision concerning the number of classes to use is typically based on measures of goodness of fit, such as Schwarz’s (1978) Bayesian information criterion (BIC; Nylund, Asparouhov, & Muthen, 2007). Users need to be aware that the optimal number of latent classes could also depend on the covariates used for predicting latent class membership (Lubke & B. Muthén, 2005). We suggest basing the decision about the number of classes K on the full MDSEM and keeping K constant across different versions of the model (e.g., models where the covariates are excluded) to make sure that results are not affected by the use of different numbers of classes. Some researchers have suggested identifying the number of latent classes prior to the inclusion of covariates (Kim, Vermunt, Bakk, Jaki, & Van Horn, 2016; Nylund-Gibson & Masyn, 2016). This approach is useful in direct applications of the LCM (Bauer, 2005) that require the categorical latent variable to exist independent of the covariates included because individuals’ class membership is substantively interpreted. However, the MDSEM is based on an indirect application of the LCM that does not aim to categorize individuals, but only to relax parametric assumptions.
Finally, one problem with maximum likelihood estimation for mixture IRT models is that the solution can converge to a local rather than the global maximum (Finch & French, 2012). Therefore, the usage of multiple random starting values is recommended to ensure replication of the best likelihood value (Lubke & B. Muthén, 2005).
Empirical Illustration
In the next sections, we report on our application of the proposed MDSEM to a timed low-stakes mathematics test taken from a typical large-scale study. This application served three purposes. First, we compared the MDSEM to the model suggested by Glas and Pimentel (2008), thereby demonstrating the flexibility gained by implementing their model in a semiparametric framework. Second, we exemplify how to use the MDSEM to evaluate a test for the differential onset of NRIs while holding the proficiency variable constant. Third, we exemplify the use of graphical procedures to aid the interpretation of model results, while focusing on the survival function.
The models were implemented in Mplus 7.4 (L. K. Muthén & Muthén, 1998-2012) by using the EMA algorithm using standard integration with 15 integration points for the proficiency variable. All models were estimated using multiple sets of random starts. In all cases, the best log-likelihood was replicated. In order to determine the number of classes, we estimated a series of models ranging from 3 to 8 latent classes. The decision concerning the number of classes was based on the BIC.
Sample and Procedure
The sample was taken from the study “Mathematics and Science Competence in Vocational Education and Training” (ManKobE; e.g., Retelsdorf, Lindner, Nickolaus, Winther, & Köller, 2013). It encompassed apprentices in their first year of vocational education and training (VET) in mathematics and science-related occupations, namely, industrial clerks and different technical professions (e.g. industrial and laboratory technicians; further referred to as technicians). The test was designed to assess mathematical skills at the core of VET for industrial clerks. The test contained only tasks that could, in principle, be solved with the mathematical knowledge acquired in regular schooling, but the problems presented were embedded in an organizational context typical for industrial clerks. Hence, in this analysis, we expected that industrial clerks would have higher proficiency, and we hypothesized that they would show a later onset of NRIs than technicians because the context in which the items were presented was more familiar to clerks.
We considered the data of N = 967 apprentices at the beginning of their VET (average time in VET of about 3 months); cases with less than three valid responses in the whole test and those with missing information on the covariate considered were excluded. From all test takers, n = 214 cases were in VET for industrial clerks; the remaining apprentices were in VET for technicians (n = 753). On average, apprentices were 18.70 years old (SD = 2.88). The test considered consists of 20 dichotomously scored items and it was administered with a time limit of approximately 15 minutes. NRIs were first observed in item position j = 5. Therefore, response indicators for the first four items were not included in the analysis.
Results
Descriptive Results
Only 28% of the sample completed the first three quarters of the test and only 16% reached the last item. The sample-based baseline hazard function of the onsets of NRIs is depicted in Figure 1. It appeared that the hazard rates for NRIs did not constantly increase across item positions but rather reached a maximum after the first three quarters of the test (i.e., in position 15). In addition, the hazard function given in Figure 1 appeared to be constituted of several peaks. This led us to expect that the semiparametric steps model was likely to identify several latent classes that are sharply separated from each other.
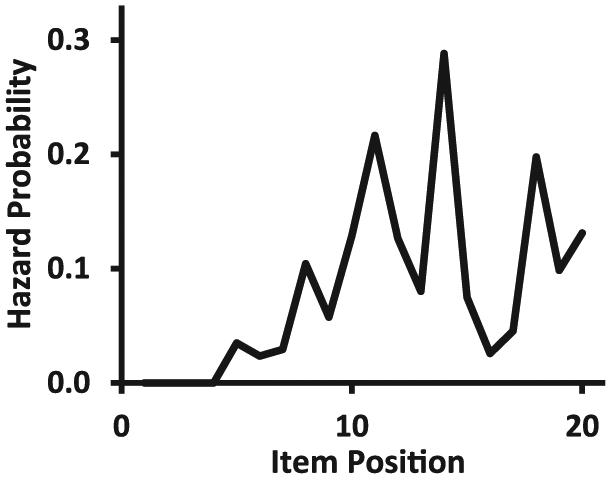
Sample-estimated hazard probabilities of onsets of not-reached items (NRIs).
Nonparametric Representation of the Distribution of Steps Variable
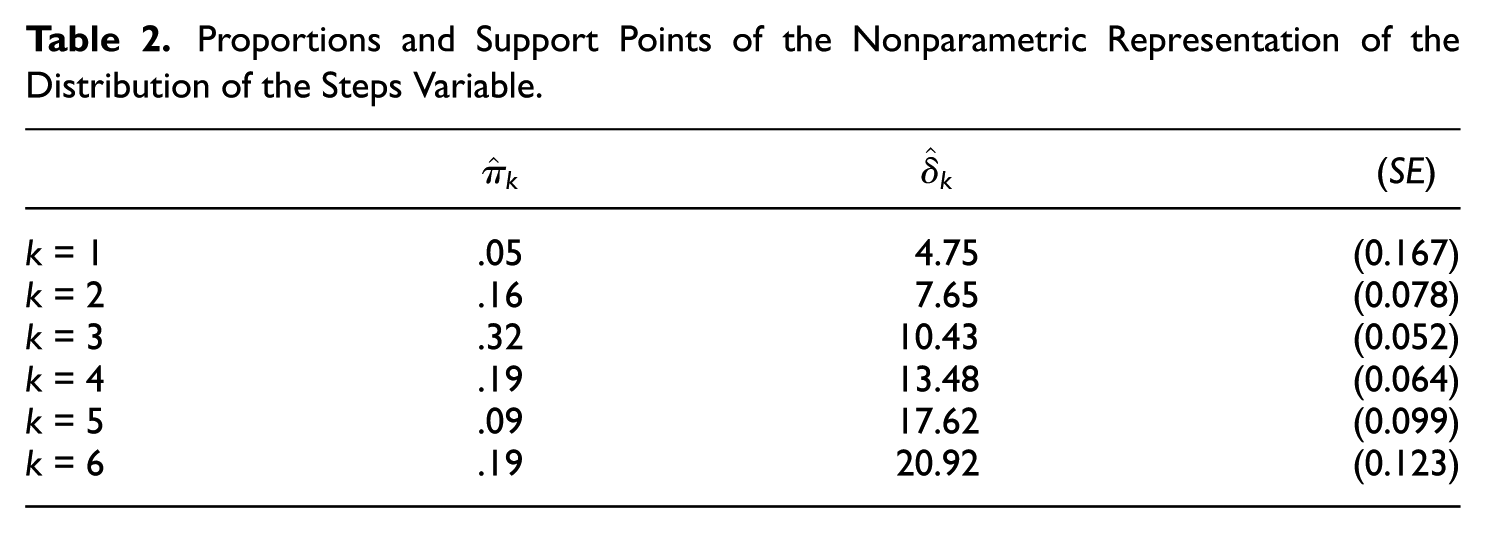
As shown in Table 1, the model with K = 6 classes achieved the best fit in terms of the BIC, and we therefore decided on six classes. In this model, the discrimination parameter of response indicators was estimated to be
Fit Statistics for Mixture Discrete (Item) Sequence Event Model With Different Numbers of Latent Classes (K).
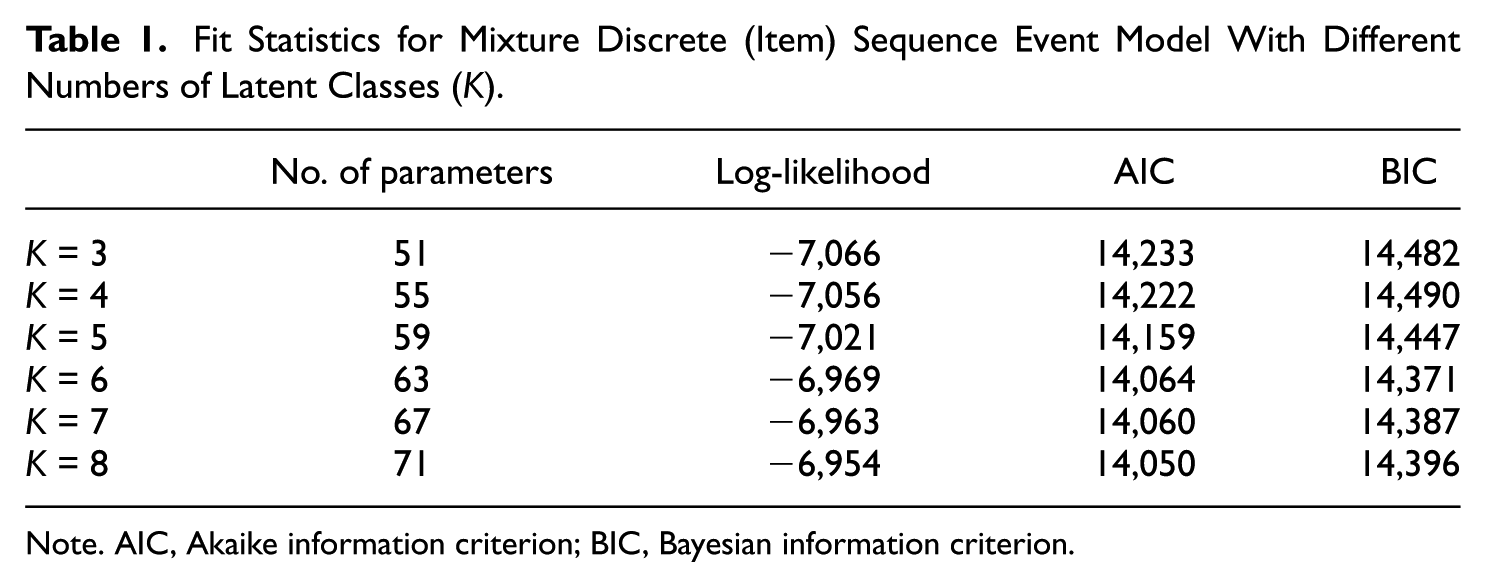
Note. AIC, Akaike information criterion; BIC, Bayesian information criterion.
Proportions and Support Points of the Nonparametric Representation of the Distribution of the Steps Variable.
Comparison With the Model of Glas and Pimentel (2008)
We now turn to the comparison of the MDSEM, in which the indicator of group membership was discarded, with the model for NRIs proposed by Glas and Pimentel (2008). The first step was to estimate the MDSEM without considering group membership and to estimate Glas and Pimentel’s model. The MDSEM contained 57 free parameters and achieved a log-likelihood value of LL = −6,994 (AIC = 14,103, BIC = 14,381). The model of Glas and Pimentel (2008) contained fewer parameters (44) and achieved a lower log-likelihood value of LL = −7,172 (AIC = 14,432, BIC = 14,647). In addition, the information indices were clearly in favor of the MDSEM.
Despite the difference in model-data fit, both models provided nearly identical estimates for the measurement part of the proficiency variable. The estimates of item discriminations showed only minor deviations between the models (mean absolute deviation [MAD] = 0.030), and the same was true for item difficulties (MAD = 0.080). Furthermore, the variance of the latent proficiency variable was estimated by the model of Glas and Pimentel (2008) as
The multinomial logit coefficients determined by the MDSEM are reported in Table 3. The intercept parameters mirrored the latent class proportions (Table 2). The regression weights represent the change in the log-odds of belonging to class c = l relative to the reference class c = 6 for one-unit increase in
Multinomial Logit Coefficients of the Regression of Latent Class on the Proficiency Variable (
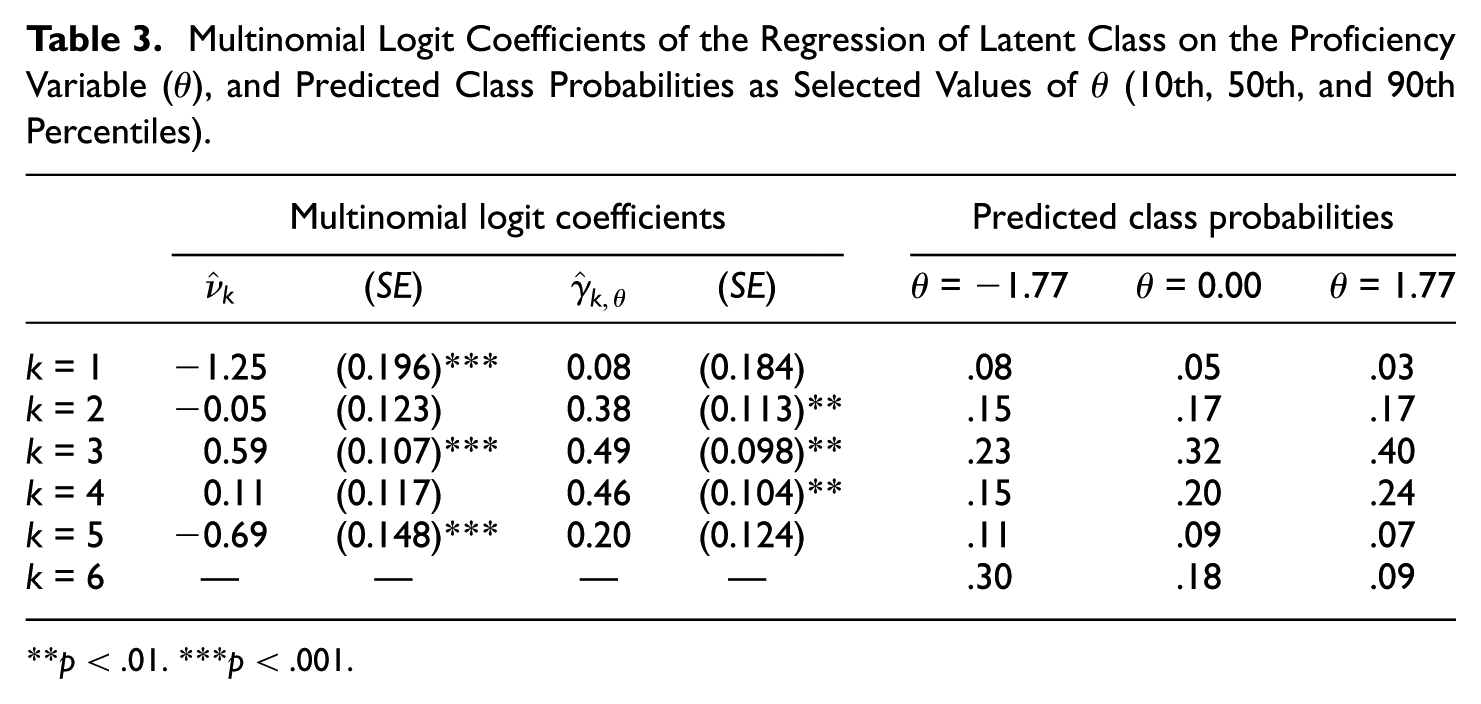
p < .01. ***p < .001.
To facilitate a better comparison of the predictions made by the two models, Figure 2 provides the survival curves derived at the 10th, 50th, and 90th percentiles of the (normal) proficiency distribution. The survival functions were markedly different. More specifically, Glas and Pimentel’s (2008) model predicted that the survival curves were already different at the onset of the first NRIs (i.e., starting from j = 5). In contrast, the MDSEM revealed that the onset of NRIs, and hence the survival curves, started to be affected by proficiency from the middle position (around j = 10) on, which means that the occurrence of NRIs in the second quarter of the test (between the 5th and 10th item position) was not related to proficiency. In addition, the MDSEM indicated larger differences in the survival probabilities in the last quarter of the test, compared to the model of Glas and Pimentel (2008). Moreover, the survival curves provided by the MDSEM were not as smooth as the curves provided by the model of Glas and Pimentel (2008), which were close to a linear function. The survival curves of the MDSEM appeared to reflect the peaked nature of the hazard functions (Figure 1).
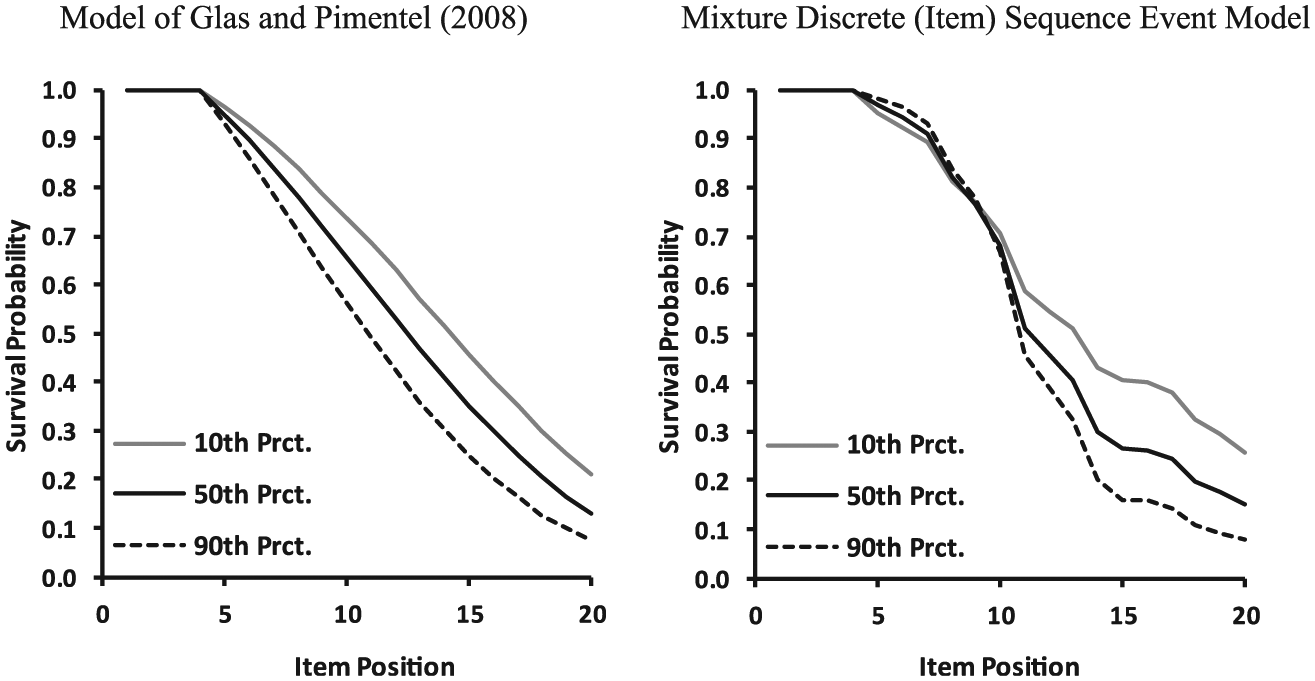
Survival functions determined for the 10th, 50th, and 90th percentile (Prct.) of the proficiency distribution determined on basis of the model of Glas and Pimentel (2008) and the Mixture Discrete (Item) Sequence Event Model (MDSEM).
Differential Onset of NRIs
The last issue considered here concerns the question of whether membership in the two VET fields was related to the onset of NRIs. Hence, we now turn to the full MDSEM, in which the group membership was included (0 = technicians, 1 = clerks). The goodness of fit of the full MDSEM is reported in Table 1. In order to find out whether group membership was related to the onset of NRIs over and above proficiency, we estimated a more constrained version of the MDSEM, in which the multinomial weights of group membership were fixed to zero. The fit of the models was compared via an LRT and provided a statistically significant result, χ2(df = 5) = 24.9 (p < .001), indicating that group membership was related to the onset of NRIs over and above the proficiency variable.
The analysis provided the expected results. Clerks were found to have a higher proficiency level (
Multinomial Logit Coefficients of the Regression of Latent Class on the Proficiency Variable (
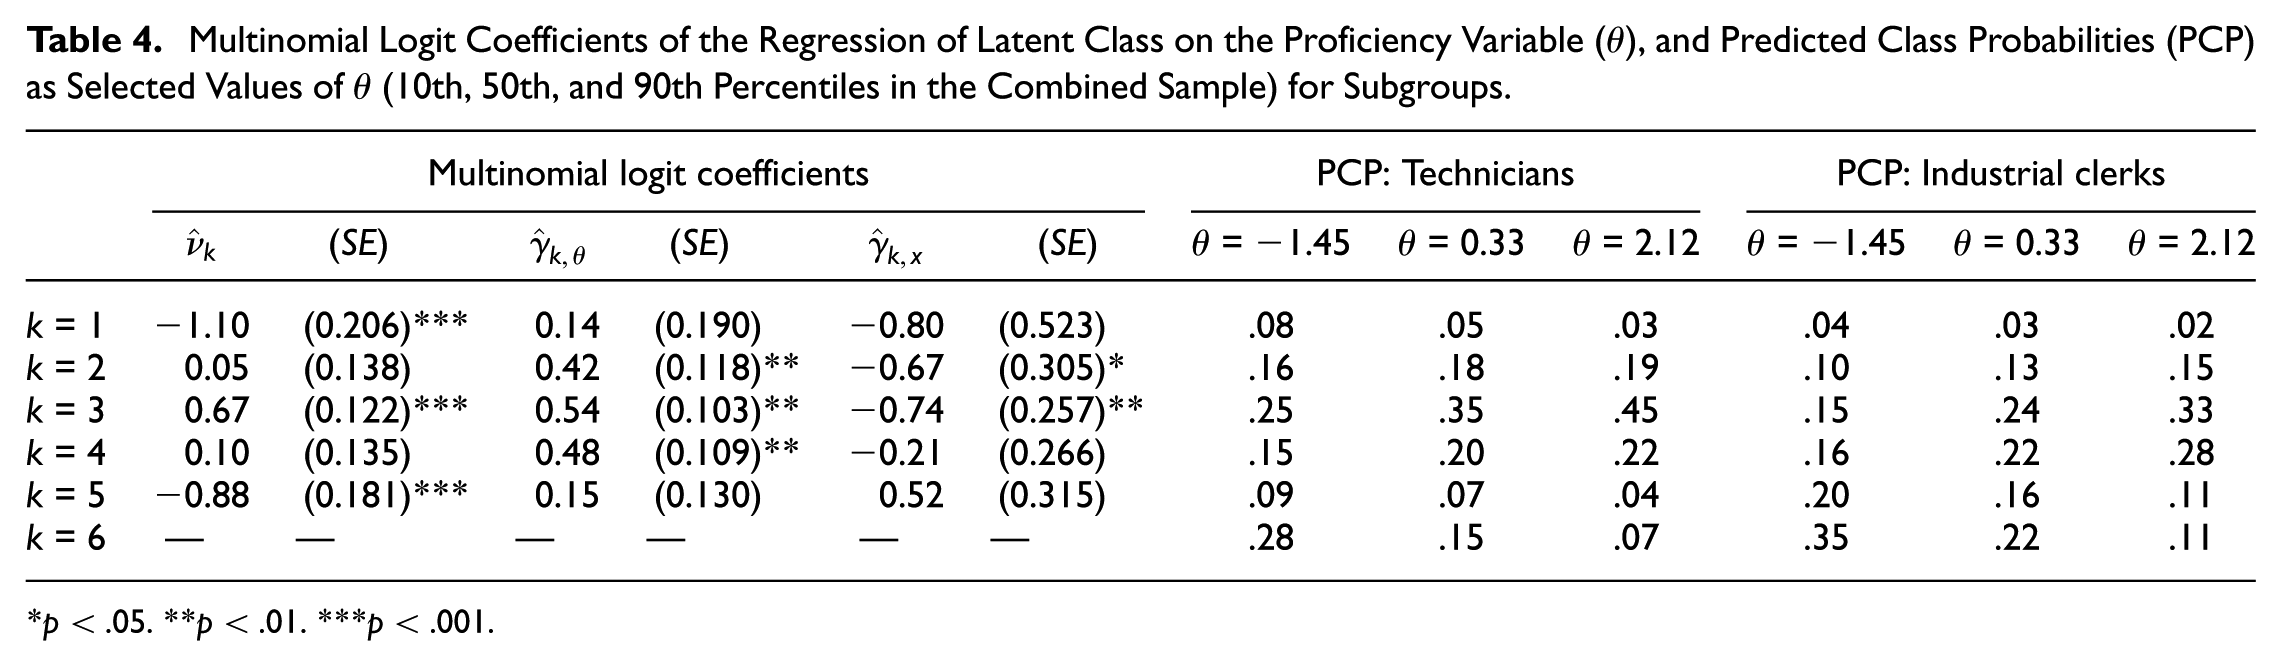
p < .05. **p < .01. ***p < .001.
The regression weights for the proficiency variable predicting class membership were very similar to the results provided in Table 3. Table 4 also reports the class probabilities predicted by proficiency and group membership. The corresponding probabilities were evaluated at the 10th, 50th, and 90th percentiles of the combined proficiency distribution with equally weighted groups. Clerks of the same proficiency level were more likely to belong to the latent classes associated with a later onset of NRIs. This finding is visualized by the survival functions in Figure 3. The survival function already differed between groups right after the first onset of NRIs (at j = 5). In this region, survival did not depend on proficiency. The most pronounced group differences were determined for the third quarter of the test, where the survival function showed a steeper decrease at all levels of proficiency in the group of technicians. In the fourth quarter of the test, the survival curve was flatter for technicians, but the survival probability was still lower compared to the group of industrial clerks.
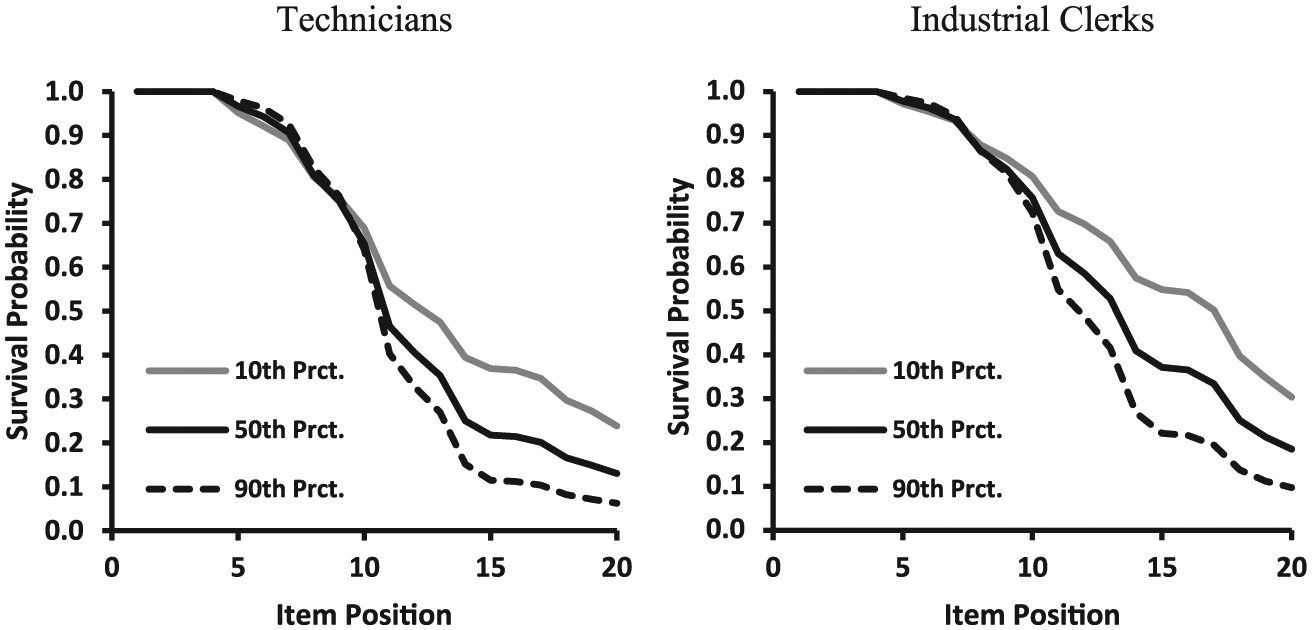
Survival functions determined for the 10th, 50th, and 90th percentiles (Prct.) of the joint proficiency distribution, determined for subgroups on the basis of the Mixture Discrete (Item) Sequence Event Model (MDSEM).
Summary
With this application, we intended to provide an example for an application of the proposed MDSEM in a low-stakes test characterized by a high prevalence of NRIs. As we have shown, the MDSEM provides a method for detecting nonlinear patterns of the onset points of NRIs by using a semiparametric parameterization of the steps model. Compared with the parametric NRI model provided by Glas and Pimentel (2008), the MDSEM allows for a more flexible representation of the test survival function. In the present case, the MDSEM provided a survival curve that better reflected the peaked nature of the hazard function. In addition, the MDSEM does not rely on the proportional hazard assumption and was therefore able to identify regions where the onset of NRIs depended on person variables, and regions where NRIs did not depend on the variables considered. Finally, as we have demonstrated, the MDSEM allows for a simple test of the differential onset of NRIs as a function of the covariates, while simultaneously controlling for the proficiency variable.
Simulation Study
In this section, we report the results of a simulation study that was conducted in order to study the behavior of the MDSEM in the presence of a high amount of NRIs. We examined the MDSEM’s capability of uncovering (1) item parameters (i.e., discriminations,
The probabilities of NRI onsets were generated via a nonnormally distributed steps variable,
The discrimination parameters for item responses
In each condition, the data were analyzed via the MDSEM with K = 6 classes, and a 2PL model in which the response indicators were ignored. In both models,
Results
Table 5 provides the bias (i.e., the difference between average estimates and population values) of the parameters
Population Values, Parameter Bias, and Coverage Rates for Structural Parameters Provided by the 2PL Ignoring NRIs, and the MDSEM Separated by Conditions (Condition 1: NRIs Affected by x; Condition 2: NRIs Affected by
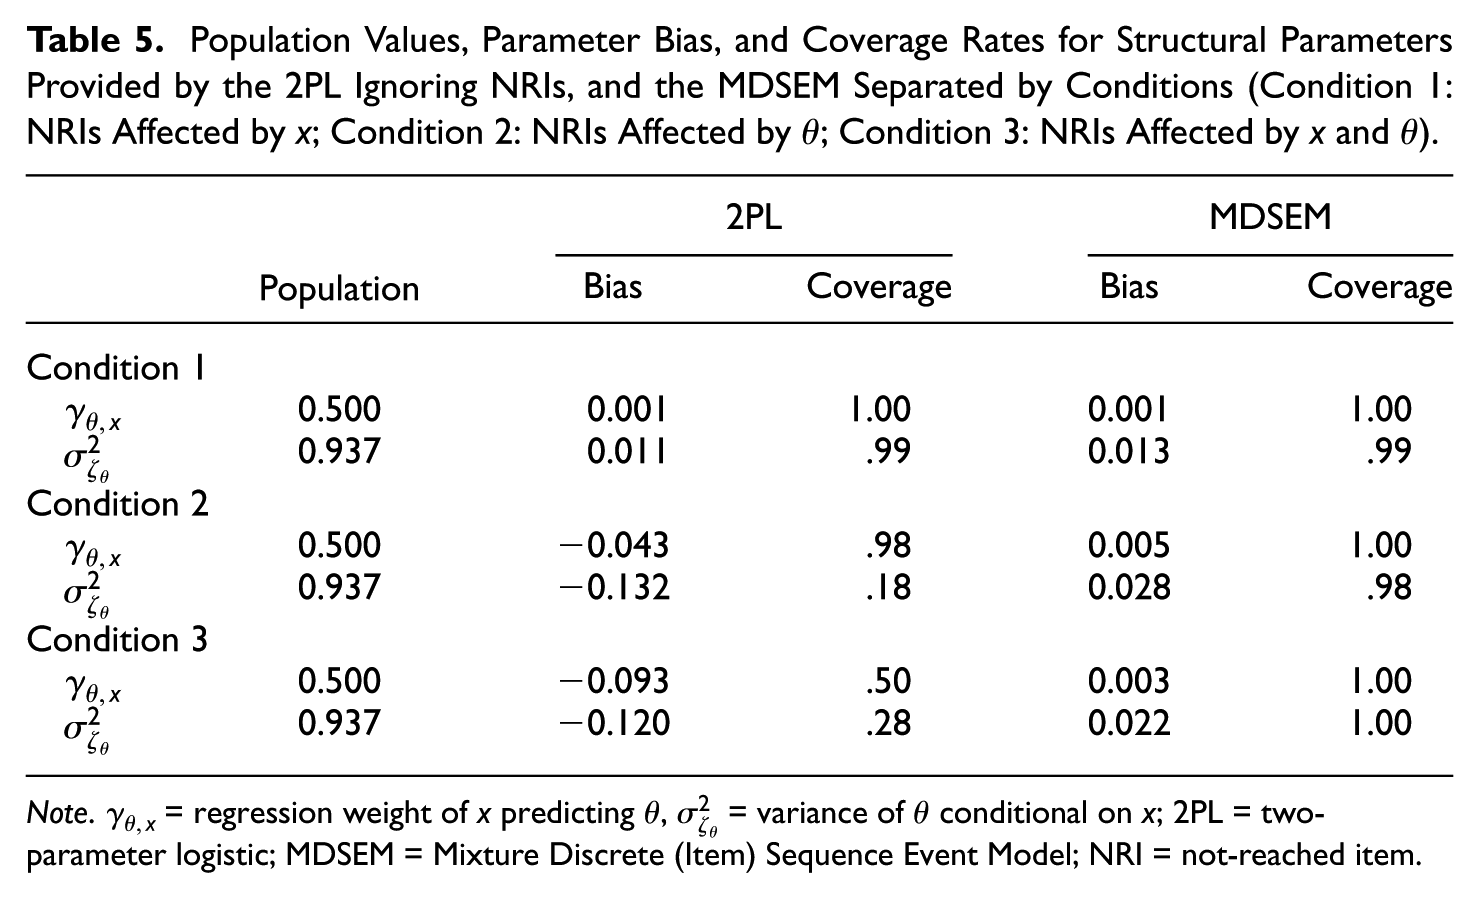
Note.
Figure 4 provides scatter plots of the population values and the average item parameter estimates. Both models provided almost identical estimates that were virtually unbiased in the first condition. In the second and third conditions, where NRIs depended on
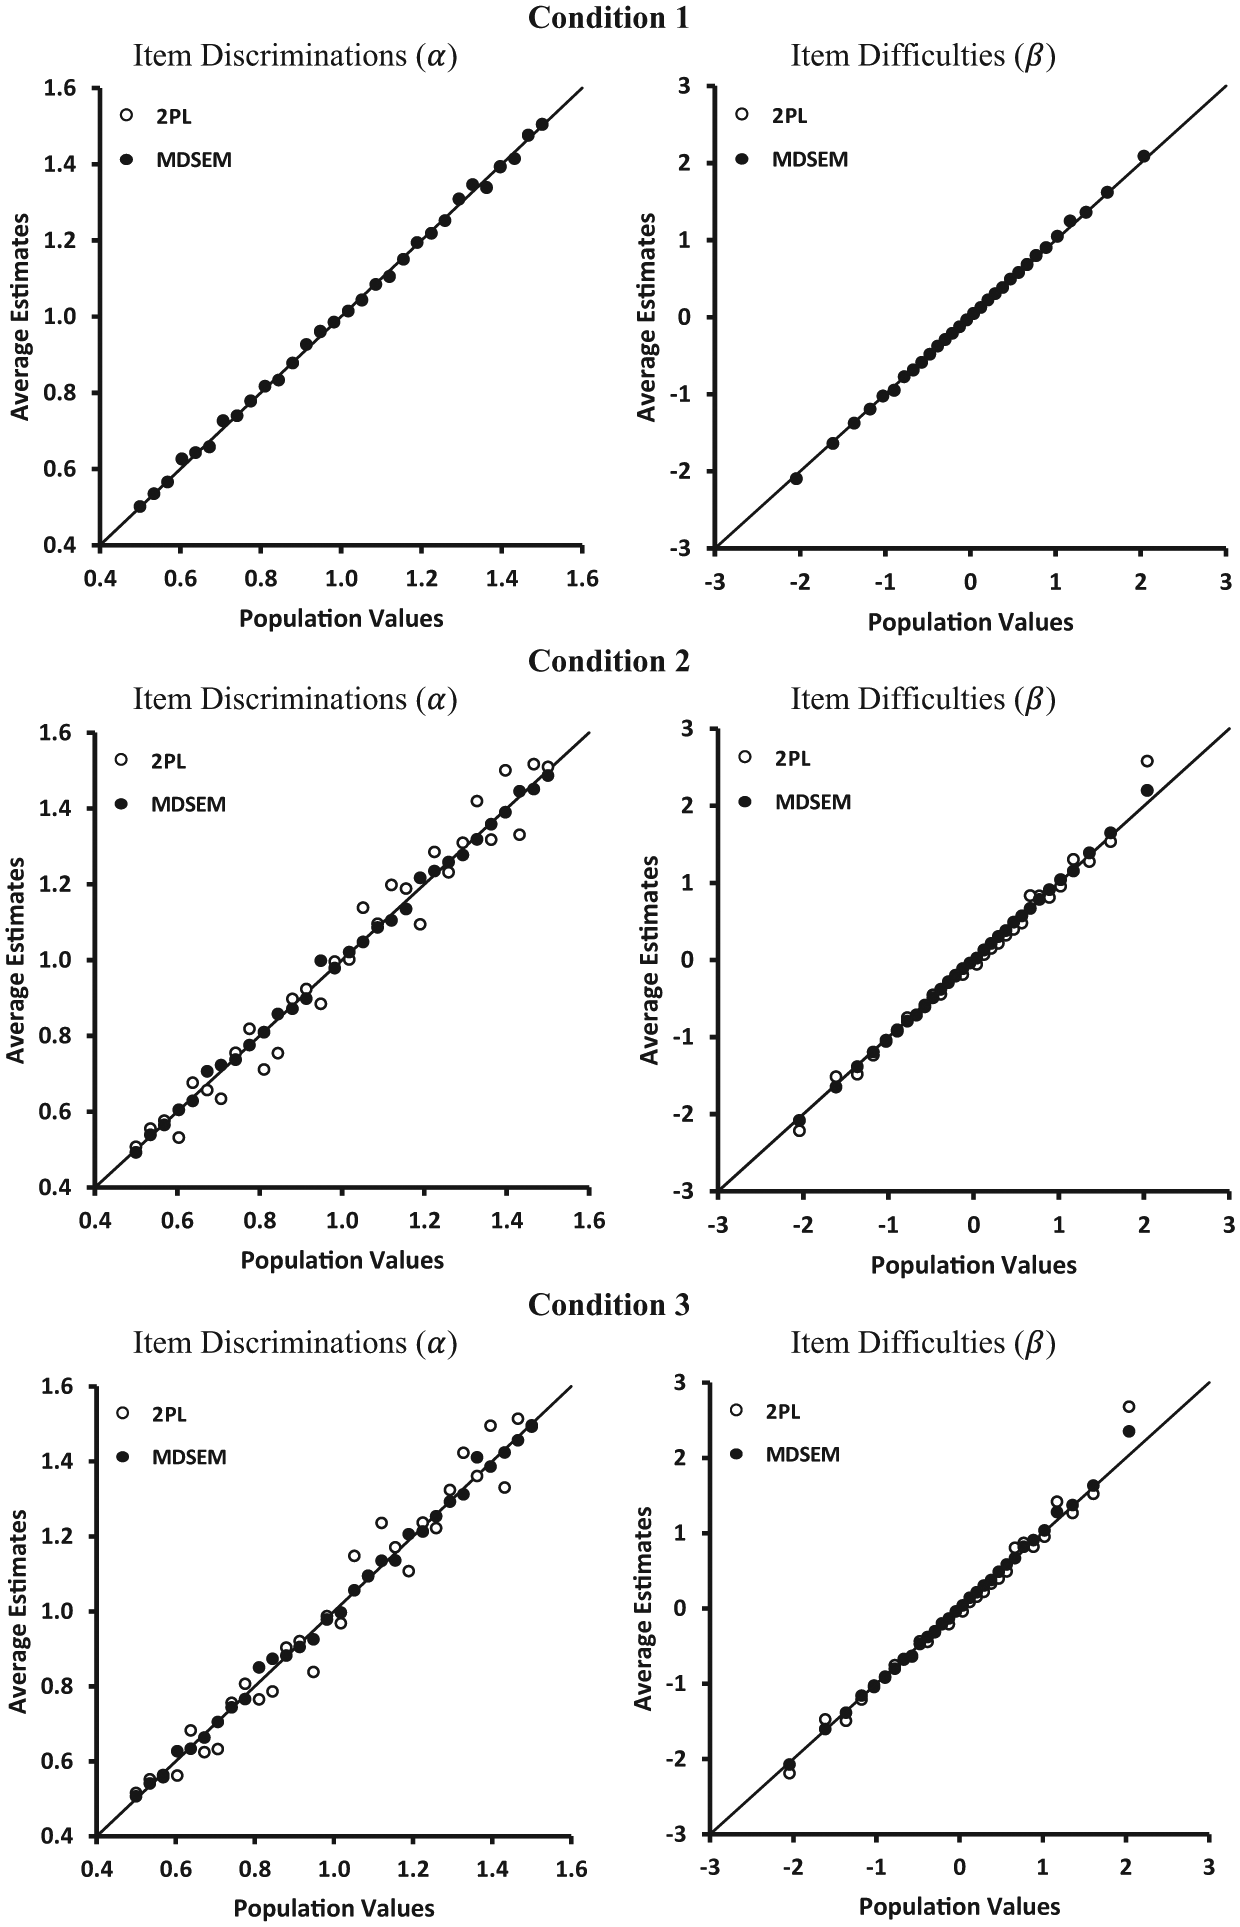
Estimated item parameters by corresponding population values for the 2PL ignoring NRIs and the MDSEM separated by conditions (Condition 1: NRIs affected by x; Condition 2: NRIs affected by
The last issue approached was the recovery of survival functions. The MDSEM correctly identified the variables not related to the onset of NRIs. Type I error rates for the multinomial logistic regression weights of
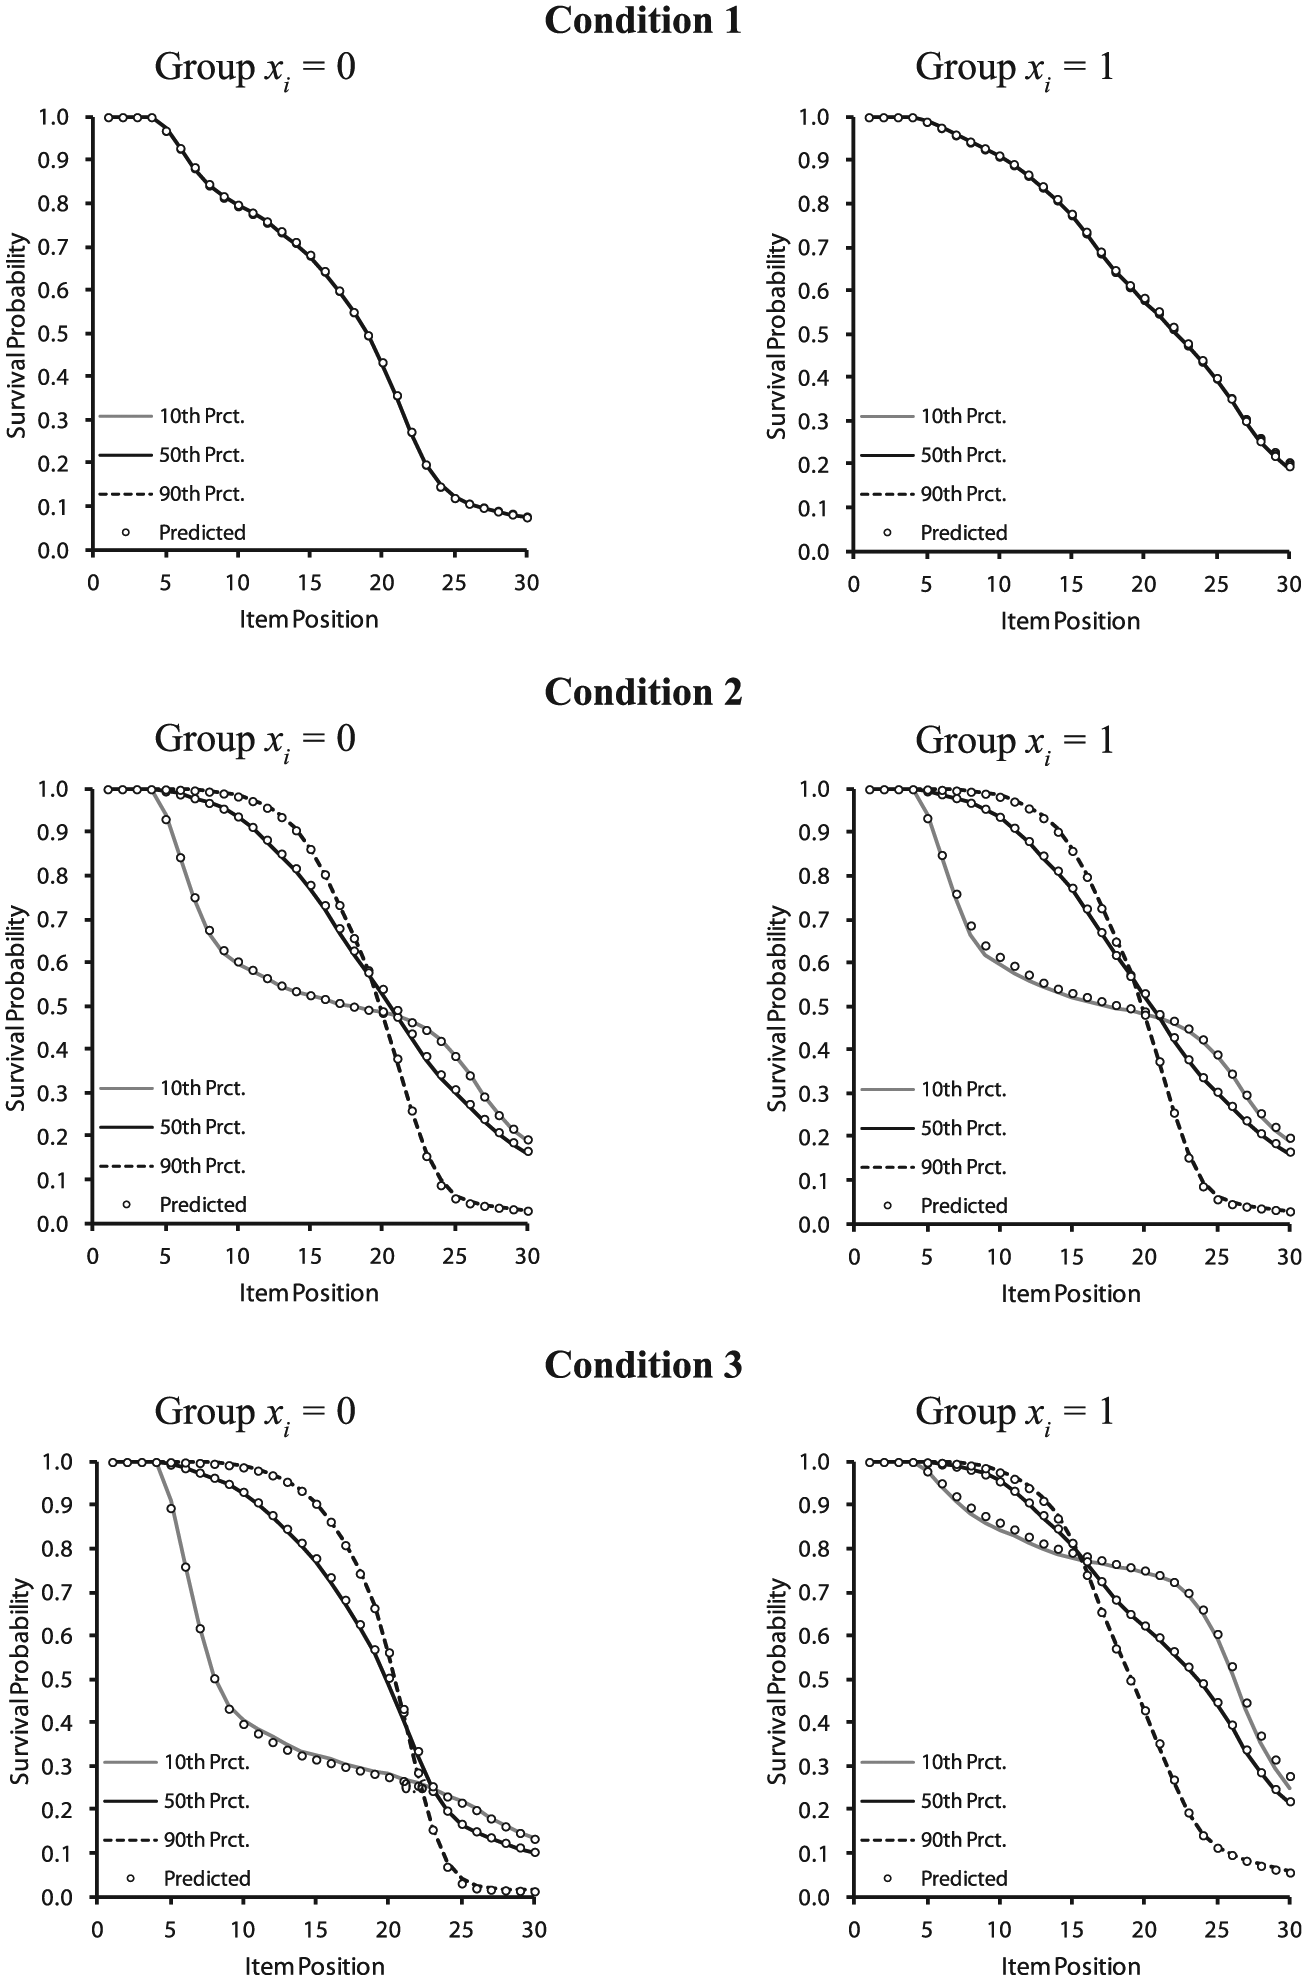
Population and estimated survival functions for the MDSEM separated by conditions (Condition 1: NRIs affected by x; Condition 2: NRIs affected by
Summary
The results clearly show the advantages of the MDSEM. The model accurately estimated the survival functions in each condition studied, thereby underscoring the MDSEM’s utility for examining the determinants of test takers’ onset points of NRIs. In addition, our results show that the MDSEM reduced biases in parameters caused by nonignorable missing data. The MDSEM provided parameter estimates identical to the 2PL in a situation in which the missing-data process was accurately modeled by the inclusion of the covariate (i.e., Condition 1; Glas et al., 2015). In the conditions in which the onset of NRIs also depended on proficiency, the MDSEM provided unbiased estimates of the structural parameters, whereas the standard 2PL did not. In these conditions, the MDSEM produced more accurate item parameters, although the bias was also relatively low in the case of the conventional 2PL model that ignored NRIs.
Discussion
In educational assessments, one concern is whether the amount of NRIs is related to the proficiency being measured. Such relationships are considered to be indicative of NMAR patterns, which means that not accounting for such relationships could induce bias in the estimates of item parameters and students’ proficiencies (Ludlow & O’Leary, 1999; for a review, see Pohl & Carstensen, 2013). However, an often-overlooked point is the possible relationship between NRIs and the student characteristics that are at the core of comparative studies. As we have argued in this article, situations in which such relationships cannot be accounted for by the students’ proficiencies indicate a differential onset of NRIs that can be regarded as a threat to the validity of group comparisons. However, whether the differential onset of NRIs is treated as an indication of a threat to the validity of group comparisons, or whether it is treated as a key outcome in its own right, depends on the goals of the study.
Following this line of reasoning, we have presented the MDSEM as a flexible semiparametric approach that can be used for examining the differential onset of NRIs. Our model stands in close relationship with the approach suggested by Glas and Pimentel (2008) but relaxes some of its implicit assumptions, including the parametric distribution of the steps variable that assesses the onset point of NRIs, and the proportional hazards assumptions used for assessing the relationships of NRIs with the proficiency variable. The MDSEM proved valuable for determining the regions in which the NRIs were related to the explanatory variables, whereas this is not possible in the model proposed by Glas and Pimentel (2008).
The MDSEM has some similarities with the GDM suggested by Köhler et al. (2015b) for modeling the possibly nonnormal distribution of proficiency and the tendency to omit item responses. In contrast to the GDM, in the MDSEM, only the distributional assumptions for the steps variable are relaxed, while the proficiency variable is still assumed to be normally distributed. Furthermore, in our model, the categorization of
In summary, the MDSEM is easy to implement with conventional software packages, and it provided a better description of the datasets considered in this article than the model of Glas and Pimentel (2008). The MDSEM facilitates a straightforward test of the differential onset of NRIs by means of the LRT, and enables the presentation of these effects in a manner that can be easily understood by using the survival function borrowed from discrete-time event history analysis (Allison, 2014). As such, we believe that the method will prove useful in real applications concerned with the phenomenon of the differential onset of NRIs.
Furthermore, as we have shown in the simulation study, the MDSEM proved valuable for optimizing parameter estimates in the presence of NMAR patterns that were caused by NRIs. Compared with the 2PL model that ignored NRIs, the MDSEM clearly reduced biases in the variability of the proficiency variable and in group differences. As such, the MDSEM appears to be not only a valuable tool for examining whether NRIs are a threat to the validity of group comparisons, but also a model that helps to prevent such biases. However, this issue warrants further investigation. In particular, further studies should examine whether the MDSEM proves a viable alternative to existing models (e.g., Glas & Pimentel, 2008), as we think it does.
Future Developments
Although the MDSEM is highly flexible, it still includes assumptions, some of which can be easily relaxed. First, our hypothesis about the differential onset of NRIs was restricted to uniform effects, which means that the model assumed that respondents at all levels of proficiency were equally affected by this effect. Such a specification is common in other areas, for example, in studies investigating differential item functioning (DIF; Holland & Wainer, 1993). Following the DIF literature, the MDSEM could be extended to consider nonuniform effects by allowing the covariates to interact with the proficiency variable. Such models can be implemented in the case of categorical covariates by means of multigroup MDSEMs. Such an approach would make it possible to examine whether the effects of proficiency on the onset of NRIs differ between groups. In our opinion, evidence for an absence of the differential onset of NRIs would require group-invariant relationships between the proficiency variable and NRIs, as well as an absence of effects of the covariates on the onset of NRIs. Therefore, we decided to focus on uniform effects that can be interpreted more easily. However, extensions of the MDSEM that include interactions between the proficiency variable and covariates may be an interesting topic for further investigations.
A further restriction of the MDSEM is that it assumes the proficiency variable to be normally distributed and linearly related to the covariates. Given that these are standard assumptions in continuous latent variable models, we do not consider them to be a general shortcoming of the MDSEM. However, similar to the GDM proposed by Köhler et al. (2015b), in the case of omitted items, the distributional assumptions regarding the proficiency variable could be relaxed. The merits of relaxing the MDSEM should be clearly examined.
In addition, the MDSEM assumes an invariance of the measurement model applied to the item responses across groups and across patterns of NRIs. The first restriction can be easily relaxed in the context of multigroup models. We decided not to pursue this point, mainly for pragmatic reasons and to enhance the ease of presentation. Relaxing the invariance assumption across patterns of NRIs, however, requires other types of models, such as the pattern mixture models suggested in the context of the missing-data literature (Little, 1993). In this context, our proposed semiparametric approach for assessing the steps variable could be used to stratify the sample according to the relevant patterns of NRIs (see Rose et al., 2010). In a next step, by drawing on the stratified sample, the invariance assumption could be relaxed. Further studies could consider this issue.
Conclusion
NRIs reflect a type of test-taking behavior that could be of interest in substantive research. As we have argued in this article, NRIs can either be regarded as a key outcome variable or can perhaps be treated as a threat to the validity of group comparisons of proficiency levels. In this article, we present the MDSEM as a flexible and easy-to-use approach for studying the onset of NRIs. As we have demonstrated, the MDSEM can be analyzed using standard software, which might make this approach appealing for applied researchers.
Footnotes
Declaration of Conflicting Interests
The author(s) declared no potential conflicts of interest with respect to the research, authorship, and/or publication of this article.
Funding
The author(s) received no financial support for the research, authorship, and/or publication of this article.