
Abstract
Despite substantial legal and policy debates, whether immigrant arrest rates changed during the Trump presidency remains surprisingly understudied. This is partially because immigration status is rarely available in crime data. We address this gap by applying difference-in-differences (DD) and difference-in-difference-in-differences (DDD) estimations to detailed arrest data from Texas and California from 2015 to 2018. We find little evidence, descriptive or otherwise, to suggest that the transition from the Obama to the Trump administration had a meaningful impact on immigrant arrests, whether measured as violence, property, drug, or traffic offenses. These results suggest that the immigration enforcement initiatives under President Trump did not deliver on their crime reduction pledges, but they also provide little evidence of over-policing of immigrants in discretionary actions such as traffic arrests.
Introduction
The politics of immigration enforcement and their criminological implications have drawn increased interest in recent years (Martínez et al., 2018). This is particularly true following the election of Donald Trump, who made the reduction of immigrant criminality through the strict enforcement of immigration laws a centerpiece of his policy agenda (Capps et al., 2018). To this end, in his first year in office, President Trump rescinded prosecutorial guidelines aimed at protecting non-criminal immigrants from arrest and deportation, increased the number of interior arrests and removals, and re-implemented the controversial Secure Communities (S-Comm) program—a program designed to ensure that every person arrested for a crime in the U.S. would have their information screened by federal authorities for immigration violation (Miles & Cox, 2014; Pierce et al., 2018).
Most of these initiatives involved collaborations between local law enforcement and immigration officials. Indeed, using Executive Orders, in 2017 President Trump encouraged maximum participation of local law enforcement agencies in the 287(g) program, which involve agreements between ICE and state/local jurisdictions designed to delegate immigration authority to local police (Kubrin & Ousey, 2023). Texas, perhaps more than any other state, was and continues to be an enthusiastic partner in many of these initiatives. Indeed, the number of arrests made by Immigration and Customs Enforcement (ICE) in Texas increased by 21% between 2016 and 2017, the majority of which were made while the individual was already in local custody (TRAC, 2018). 1 However, President Trump’s immigration agenda was hampered by other states actively refusing to collaborate with immigration authorities. In 2018 the Justice Department sued California for their “deliberate effort to obstruct the United States’ enforcement of federal immigration law” (Benner & Medina, 2018). The differential embrace of heightened immigration enforcement between California and Texas provides a useful research setting to understand the effectiveness of the Trump administration’s policies to reduce crime among immigrants. This is important because, to date, we know virtually nothing about whether the policy shift at the Department of Homeland Security under the Trump administration to deem every unauthorized immigrant a candidate for arrest and removal decreased immigrant crime.
This is largely due to data constraints. Despite the central role of local police in contemporary immigration enforcement (Motomura, 2011), information on immigration status is remarkably scarce in most crime databases. Among the most widely utilized crime data sources, neither the Uniform Crime Reports (UCR), the National Crime Victimization Survey (NCVS), nor the National Incident-Based Reporting System (NIBRS) record information about immigration status. Cognizant of these limitations, this article draws on data from the California Criminal Offender Record Information (CORI) program and the Texas Computerized Criminal History System (CCH) to study immigrant arrests between 2015 and 2018. Critical for our purposes, these data include information on nativity for all felony and misdemeanor arrestees over this period. With these data, we use a difference-in-differences (DD) and a difference-in-difference-in-differences (DDD) analytical strategy to examine a central research question: how did immigrant and non-immigrant arrest rates change between the 2 years prior to the Trump administration (2015 and 2016) and 2 years post-President Trump’s inauguration (2017 and 2018)?
A comprehensive answer to this question is critical as debates around the criminogenic consequences of immigration enforcement continue. For example, Texas Attorney General Ken Paxton has repeatedly sued the Biden administration over their immigration policies, arguing that their comparatively lax enforcement rules jeopardize public safety (Attorney General of Texas, 2023). Moreover, our inquiry informs ongoing theoretical discussions on the criminological implications of immigrant-protective policies like those implemented in California. On the one hand, critics of immigrant-protective policies, often called “sanctuary” laws, contend that they increase crime by removing deportation as a potential deterrent, attracting more crime-prone immigrants, and inhibiting the government’s ability to remove dangerous individuals (Martínez et al., 2018). On the other hand, proponents of “sanctuary” policies argue that they decrease crime by making it easier for immigrants to integrate into society, strengthening police-community relations, and enhancing social organization and collective efficacy, both of which are critical components to the informal regulation of crime (Graif & Sampson, 2009; Lyons et al., 2013).
In the following section we detail the utility of comparing Texas and California for informing this debate, as well as the shifts in immigration policy that now place local law enforcement at the center of immigration enforcement efforts.
Immigration Enforcement and Immigration Federalism
Contemporary immigration enforcement in the United States is defined by three salient developments. First, the traditional distinctions between immigration law and criminal law have blurred as the tools of the criminal justice system such as the police, prosecutors, and prisons, have become core components of immigration enforcement—a process commonly referred to as “crimmigration” (J. Stumpf, 2006).
Second, with the growing interdependence between the immigration and criminal justice systems, local criminal justice authorities have become the foundation of interior immigration enforcement. Indeed, immigration authorities are often physically present in local jails (Armenta, 2017), citizenship inquiries are now a standard part of the jail booking process (Chacón, 2012), the Department of Homeland Security (DHS) screens arrestees’ information for immigration violations (Miles & Cox, 2014), and the majority of interior immigration arrests are made with the help of local law enforcement (TRAC, 2018).
Third, despite the assumption of national uniformity in federal immigration policy, the devolution of immigration enforcement to local criminal justice authorities has created a “multijurisdictional patchwork of enforcement policies and practices” (Provine et al., 2016, p. 3). Under this form of immigration federalism, the substance and intensity of the integration between the immigration and criminal justice systems varies markedly, with some states explicitly incorporating immigration consequences into criminal case processing, and others rejecting collaborations with immigration authorities (Spiro, 1997). 2
Perhaps nowhere is this contrast better displayed than in California and Texas. While both states are home to large numbers of diverse immigrant groups, 3 they have taken distinctly different policy stances in response to the increased role of immigration enforcement in local and state criminal justice practices. California, for example, has gone to great lengths to try and decouple its criminal justice system from immigration enforcement. For instance, in reaction to the initial implementation of the Secure Communities program, California passed the TRUST Act in 2013, which prohibited local law enforcement from honoring ICE detainment requests except in cases involving serious crimes. Then in 2015, the California legislature changed the statutory maximum for a misdemeanor so that immigration consequences only accompanied state felony convictions. This was followed by Assembly Bill 1343 in 2016, which mandated prosecutors to avert undue immigration consequences in their charging decisions.
Texas, on the other hand, with few exceptions has embraced partnerships between criminal justice and immigration authorities over this same period (Eagly, 2013). Following the election of Donald Trump to the presidency, the policy differences between California and Texas only widened further. In 2017, California passed SB 54 declaring itself a “sanctuary state” by limiting cooperation with federal immigration authorities and preventing state and local police from holding people for immigration violations (Ulloa, 2017). That same year, Texas signed Senate Bill 4 into law which abolished sanctuary cities by “making local officials who refuse to accommodate the federal government’s requests to help enforce immigration law criminally liable, and even subject to removal from office” (Hing, 2017). Comparing California and Texas thus provides powerful insights into the efficacy of immigration enforcement policies under President Trump to reduce immigrant criminality. That is, if the immigration enforcement priorities under the Trump administration were effective at increasing public safety, we should observe these effects much more in Texas, where such policies were actively embraced, than in California, where they were actively thwarted.
Against this backdrop, in the next section we draw from the criminological research on “sanctuary” policies to motivate the theoretical mechanisms potentially linking immigration enforcement policies and crime pre- and post-Trump (see Ousey & Kubrin, 2018 for a summary of immigration-crime research generally).
Immigration Policy and Crime
Extant research provides conflicting theoretical logic on the criminological consequences of “sanctuary” policies, and by extension, strict immigration enforcement practices. One view suggests that immigrant crime may go up in “sanctuaries” like California for three interrelated reasons. First, immigrant protective policies may increase crime by limiting the threat of deportation as a deterrent and by hampering authorities’ ability to remove crime-prone individuals. Indeed, this latter reason played a central role in the federal government’s lawsuit against California, where in June of 2020 the US solicitor general argued before the Supreme Court that California’s “sanctuary” policies should be invalidated because “[w]hen officers are unable to arrest aliens—often criminal aliens—who are in removal proceedings or have been ordered removed from the United States, those aliens instead return to the community, where criminal aliens are disproportionately likely to commit crimes” (US v. California 2020). Thus, in Texas, immigrant criminality may decrease during the Trump presidency due to a) an increased deterrent from criminal behavior and/or b) greater collaboration with ICE officials to expedite the removal of immigrant offenders.
Second, the embrace of stringent immigration enforcement policies in Texas juxtaposed with immigrant protective policies in California may result in compositional shifts that increase crime. That is, the limited cooperation policies in California could attract immigrants who are more likely to engage in crime in the post-Trump era. But even if the composition of crime-prone immigrants were unchanged, a rapid increase in the immigrant population could increase crime by burdening local institutions, heightening tensions between immigrant and native communities, and fraying social cohesion. This third view adjoins classic criminological arguments on the social disorganizing effects of immigration (Shaw & McKay, 1942), by which immigration was thought to increase crime by undermining social networks and institutions necessary for regulating behavior.
Taken together, there are multiple reasons to anticipate that immigrant crime may increase in California during the Trump presidency. But there are equally plausible reasons to predict the opposite hypothesis. For one, the sanctuary policies in California may decrease crime by strengthening ties between police and community residents, especially within undocumented communities (Martínez-Schuldt & Martínez, 2019). In other words, if residents do not feel at risk of removal when interacting with the police, immigrant communities may be more willing to cooperate with criminal investigations. Legal scholar J. P. Stumpf (2023) recently applied insights from psychological jurisprudence to crimmigration policies to explicate this view. According to J. P. Stumpf (2023), the procedural deficiencies that are introduced when immigration and criminal law intersect can undermine perceptions of the legitimacy of law, breeding legal cynicism and resulting in individuals and institutions less likely to trust or cooperate with immigration authorities or criminal law enforcement. In a similar vein, Lyons et al. (2013) suggest that localities with more open political opportunities for immigrants, such as “sanctuary” policies, can foster a “spiral of trust” that 1) strengthens communication between legal officials and immigrants, 2) reduces social isolation and cynicism of the legal and political system, and 3) buttresses social organization, each of which are key elements in the public and informal social control of crime.
But even in the absence of any change in immigrant criminality, it is possible that immigrant arrests may have changed in recent years. Here again, though, the direction of these changes is not intuitive. On the one hand, we might expect an increase in immigrant arrests in Texas if immigration enforcement policies provide an incentive to locate and arrest those perceived to be immigrants, especially for highly discretionary offenses like traffic violations. On this point, there is some evidence that local authorities have altered their policing practices to trigger immigration consequences for arrestees (Provine et al., 2016). According to Gardner and Kohli (2009), the implementation of the Criminal Alien Program—another initiative involving local authorities in immigration enforcement—led to a substantial increase in discretionary arrests of Hispanics in Irving, Texas. 4 And one of the chief criticisms of President Trump’s “tough on immigration” stance was that it would lead to police harassment within immigrant communities (Romero, 2016).
On the other hand, immigrant arrests may decrease in Texas if those in immigrant communities are hesitant to report victimizations or cooperate with police to avoid detection from legal officials. In support of this view, Gutierrez and Kirk’s (2017) analysis using the National Crime Victimization Survey suggests that the likelihood of reporting a crime to the police decreases in metropolitan areas as the concentration of immigrants increases.
An Alternative Hypothesis
Although the directional hypotheses spelled out above rest on solid theoretical footing, there are also theoretical and empirical reasons to anticipate little change in immigrant arrests in either California or Texas following shifts in immigration enforcement under the Trump administration. Theoretically, given the complex interplay between competing federal and state enforcement priorities, it seems unlikely that immigrants understand the legal nuances of limited cooperation policies. This is particularly true given that virtually all “sanctuary” policies, including those in California, make exceptions for violent and serious offenses. Thus, the deterrent effects of both punishment and deportation likely changed little following Trump’s inauguration, even in California.
Empirically, the current evidence on “sanctuary” policies and crime is also informative. Although there is some cross-sectional evidence that sanctuary policies may improve public safety (Wong, 2017), these findings are balanced by largely null results in more rigorous longitudinal analyses. For instance, O’Brien et al. (2019) examined sanctuaries as a policy experiment by comparing crime rates in cities in the year preceding the implementation of a sanctuary policy to the crime rates in the year following implementation, finding that approximately half of all jurisdictions experienced an increase in violent crime rates while the other half exhibited a decrease in violence. This overall null finding suggests that the causes of violent crime operate orthogonal to “sanctuary” policies. Martínez-Schuldt and Martínez (2019) reach a similar conclusion in their analysis of city-level homicide rates between 1990 and 2010.
Further evidence for anticipating limited change during the Trump administration comes from the research on immigration enforcement and crime. Even though the Secure Communities program was designed specifically as a crime-fighting initiative to identify and deport criminal aliens through state and local collaboration with federal immigration authorities, two independent, comprehensive analyses revealed no impact of S-Comm on arrest rates (Miles & Cox, 2014; Treyger et al., 2014). It is important to note the dual implications of these findings. While S-Comm did not deliver on its crime reduction promises, as its advocates hoped, it also did not trigger an unwarranted increase in discretionary arrests, as its critics feared.
Combined, although none of the research on “sanctuaries” examined immigrant crime specifically, there are still strong reasons for expecting that the Trump Presidency had no effect on immigrant arrest patterns. We turn to the data used to adjudicate these conflicting predictions.
Data
The primary data sources for this analysis are the Texas Computerized Criminal History (CCH) database provided by the Texas Department of Public Safety and the California Criminal Offender Record Information (CORI) program provided by the California Office of the Attorney General for years 2015 through 2018. Unlike the voluntary nature of the Uniform Crime Reports collected by the FBI, the CCH and CORI reporting systems are statutorily mandated for every jurisdiction throughout Texas and California. 5 By law, every arresting agency must report all arrests for a jailable offense, inclusive of several key variables, including the criminal statute, the level of the offense, the date of arrest, the arresting agency, and demographic information for the individual. These strict reporting requirements yield an impressive level of data coverage. In the CORI data, place of birth is reported in 99% of cases. In the CCH data, the comparable figure is 96%.
In both the CCH and CORI datasets, we focus on multiple measures of crime: violent, property, drugs, and traffic offenses. 6 These categories comprise 69% of all arrests in California and 78% in Texas during this period. The rest of the cases consist mostly of disorderly conduct and probation violations as well as primarily minor offenses. In calculating the number of crimes, we count each arrest charge as a separate crime incident, a practice known as incident-based reporting. This approach provides a more complete story of public safety in both states compared to alternative methods, which often document only the most serious crime. For example, if someone was murdered during a robbery, only the murder would be reflected in the FBI’s Summary Reporting System (SRS). Our approach records both offenses. This level of scope and granularity is precisely why the Department of Justice moved away from the previous SRS to record multiple incidents in the National Incident-Based Reporting System (NIBRS). 7 That said, we replicate our analysis using only the most serious arrest offense in Table A1 to ensure that our results are not dependent on this single methodological specification.
To harmonize the crime definitions across states, we use the National Crime Information Center (NCIC) offense classifications. 8 We classify felony and misdemeanor arrests with offense codes listed as “violent crime” as our measure of violence (this includes homicide, kidnapping, sexual assault, robbery, simple and aggravated assault, terroristic threat, and extortion with human injury). “Property” crimes include arson, burglary, larceny, property crimes, stolen vehicles, damaged property, embezzlement, forgery, and fraudulent activities. “Drugs” include manufacturing, distributing, sale, possession, and smuggling of drugs, and “traffic” offenses include the following NCIC classifications: hit and run, transporting dangerous materials, driving under the influence (DUI), and “other” traffic offenses. These measures serve as the numerators for our arrest rate calculations, and we aggregate up to the county-month for each offense type.
Population figures come from the U.S. Census American Community Survey (ACS) 5-year estimates (Manson et al., 2022), 9 which serve as our denominators. For example, the 2013 to 2017 ACS is used for our 2015 population data, and the 2014 to 2018 ACS is used for the 2016 counts, etc. We get county population counts from the ACS and linearly interpolate the monthly population data between the annual estimates. The unit of analysis is the county-month. We have 58 counties in California and 254 counties in Texas that span 48 months, for a total of 14,796 county-months [(58 × 48) + (254 × 48)]. In our analyses comparing immigrant and non-immigrant arrests, the N increases to 29,952 because we calculate two arrest rates per county (i.e. each county has two observations, one arrest rate for immigrants and one for non-immigrants).
Focal Variables
Crime rates—Crime rates are measured as the number of arrest charges (variously defined by offense type) per 100,000 individuals in each county-month.
Trump—We define the Trump presidency from January 2017 through the end of December 2018.
Immigrant—We define immigrants with a binary measure of whether the arrestee was born outside the U.S. Consistent with census designations, we classify individuals as non-immigrants if they were born in the U.S. or were born abroad to American parents. Naturalized and non-U.S. citizens are both classified as immigrants in our study. 10 This approach helps assuage concerns about undercounts because foreign-born noncitizens may be misreported as naturalized citizens in government-sponsored surveys (Van Hook & Bachmeier, 2013). Because we are focused on the immigrant population, as opposed to the noncitizen population specifically, this concern is lessened.
Control Variables
It is important to consider that there may be systematic, unmeasured differences between Texas and California counties that are totally unrelated to the Trump presidency and its policies. For this reason, we draw from prior research (Light & Harris, 2012) to include multiple covariates in our regression framework that are likely to affect crime (each measured at the county-month)
Income inequality—Defined as the Gini coefficient where 0 indicates perfect income equality and 1 indicates perfect inequality.
Percent White—Defined as the total non-Hispanic White population divided by the total population according to the ACS.
Structural Disadvantage—Measured as a principal component factor that combines the following variables: the percent with less than a high school degree, the unemployment rate, the percent of single parents, and the poverty rate by the county according to the ACS.
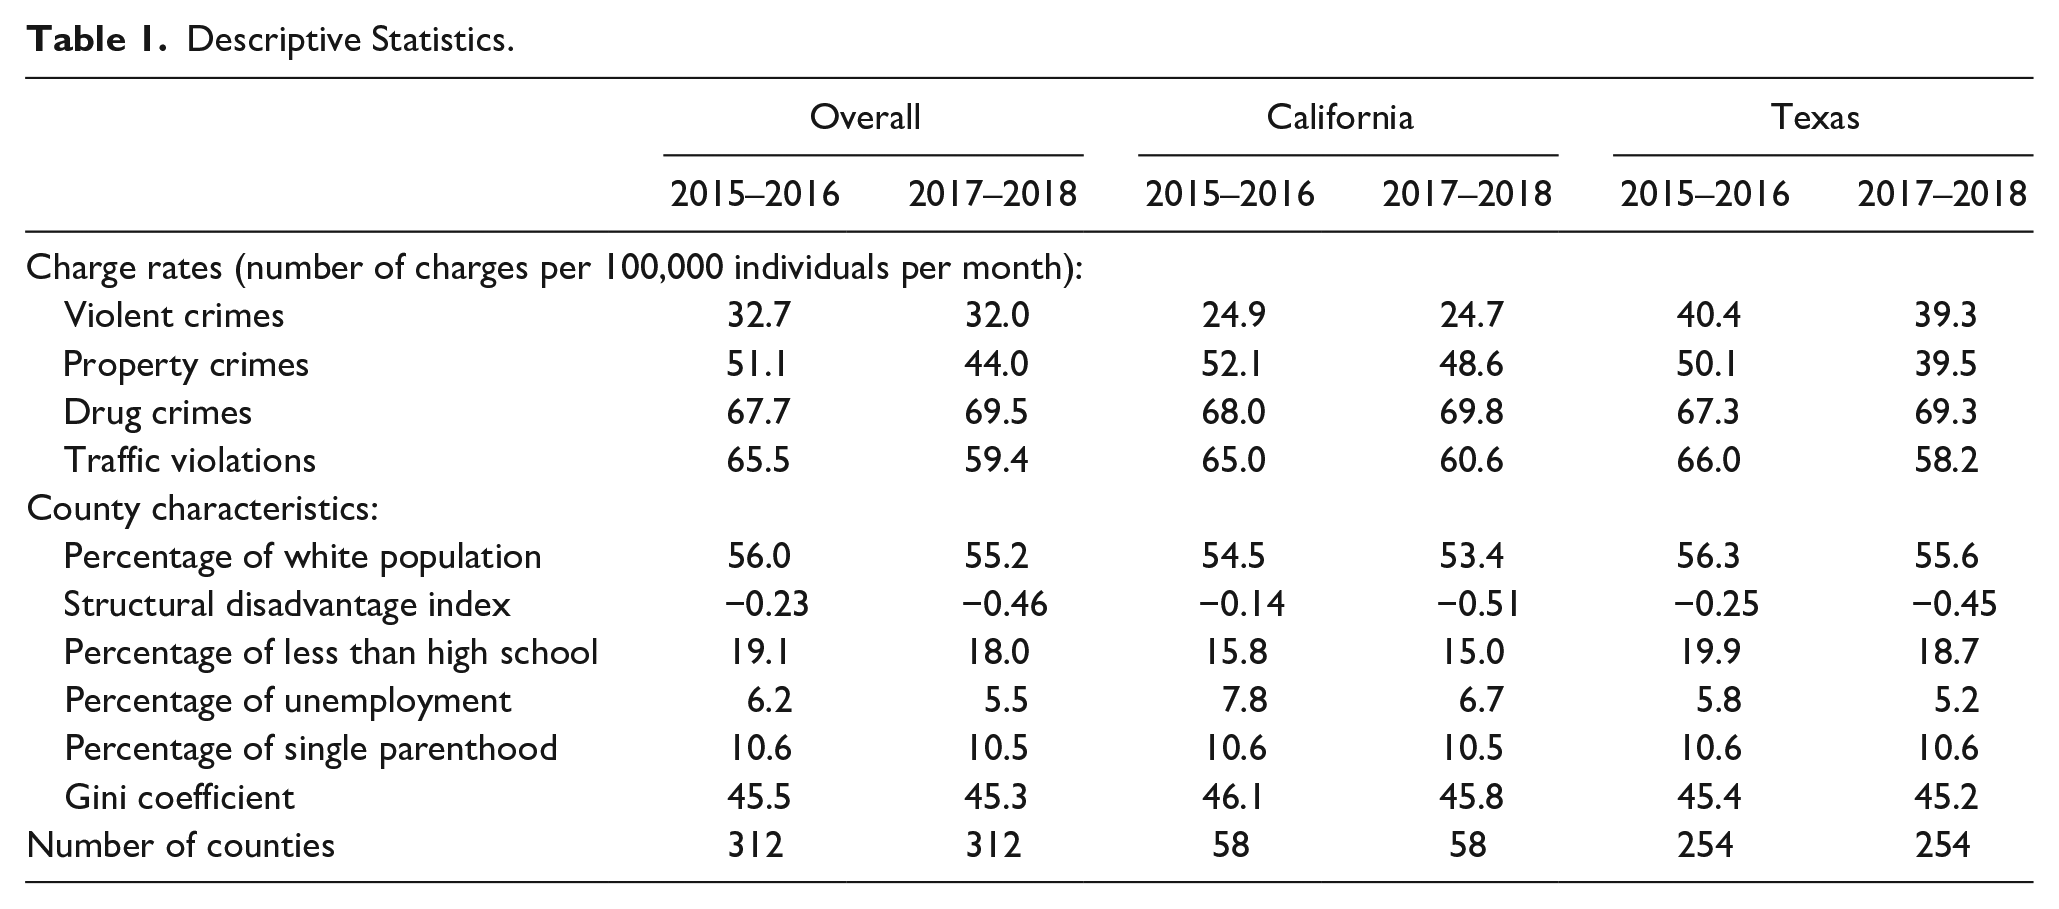
Table 1 shows the descriptive statistics for all measures used in our analysis.
Descriptive Statistics.
Analytical Strategy
We examine the efficacy of the Trump administration’s immigration policies to reduce immigrant criminality using a difference-in-differences (DD) strategy. The most straightforward DD setup involves two groups in two time periods, which can be thought of as pre- and post-treatment (Wooldridge, 2010). In our framework, Texas counties and California counties represent the two groups, and post-inauguration is the “treatment.” This basic setup can be written as follows:

where y is the outcome of interest (e.g., the immigrant violent arrest rate) and δ0 is a dummy variable for the post-Trump time period. The coefficient β1 captures the differences between Texas and California counties prior to Trump, and the coefficient of interest, δ1, represents the difference-in-differences estimate by interacting Texas with the post-Trump group. That is, how did the immigrant arrest rates in Texas counties change after Trump, relative to California counties? The key identifying assumption in this framework is that changes in immigrant arrests between Texas and California would have followed a common path were it not for Trump. To try and isolate this effect, we include our time-varying controls and month dummies to capture any seasonal changes in crime throughout the year (both sets of measures are captured by βX). 11
An alternative way to isolate the impact of increased immigration enforcement under President Trump is to incorporate a third comparison group. In our case, we incorporate immigrant and non-immigrant arrests into equation (1). This expanded version of equation (1) can be written as:
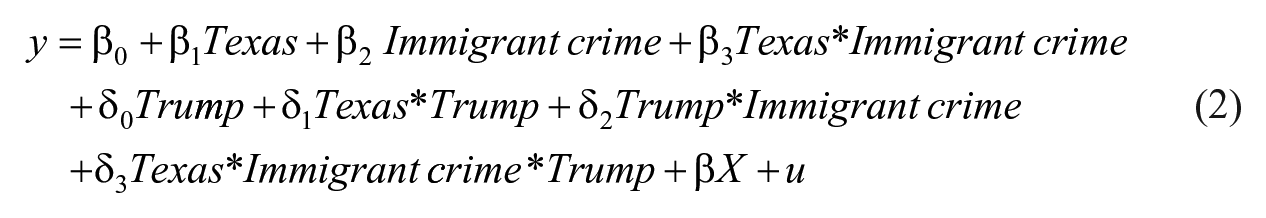
The coefficient of interest now is δ3. This triple interaction term represents the difference-in-difference-in-differences (DDD) estimate. Conceptually, this interaction examines whether the arrest rate among immigrants changed relative to non-immigrants in Texas after Trump assumed in office, after we net out the changes in immigrant arrests relative to non-immigrants after Trump in California. In this scenario, the identifying assumption is that the relative difference between immigrant and non-immigrant crime in Texas would have followed a common trend to the gap in immigrant and non-immigrant crime observed in California were it not for Trump. This triple differencing approach is particularly apt for this inquiry because there is ample reason to predict that crime among immigrants could be influenced by increased immigrant enforcement, but little reason to anticipate such policies to affect non-immigrant crime (i.e., why would ICE detainers influence crime among native-born individuals?).
We use population weights in all regressions to ensure that counties with few or no immigrants do not unduly influence the results. For the DD analysis, each county is weighted by the resident immigrant population and these weights are specific to the state. 12 Thus, counties with no foreign-born residents have no effect on the results. For the DDD analysis, immigrant arrest rates are weighted by the immigrant population, whereas the non-immigrant arrest rates are weighted by the non-immigrant population.
Results
We begin by examining the overall trends in arrest rates for different offense types over our study period, regardless of immigration status. As shown in Figure 1, violent and drug arrest rates are fairly stable between 2015 and 2018 in both states. Property and traffic offenses, on the other hand, show greater change, but little of this variation appears to coincide with the Trump presidency. For example, both property and traffic offenses fell over this period, but in both states, these decreases preceded January 2017. These overall patterns, however, may mask heterogeneity by immigration status if only immigrant crime changed markedly over this period. To address this possibility, we turn to Figures 2 to 5 where we examine immigrant and non-immigrant arrests separately for each offense type.
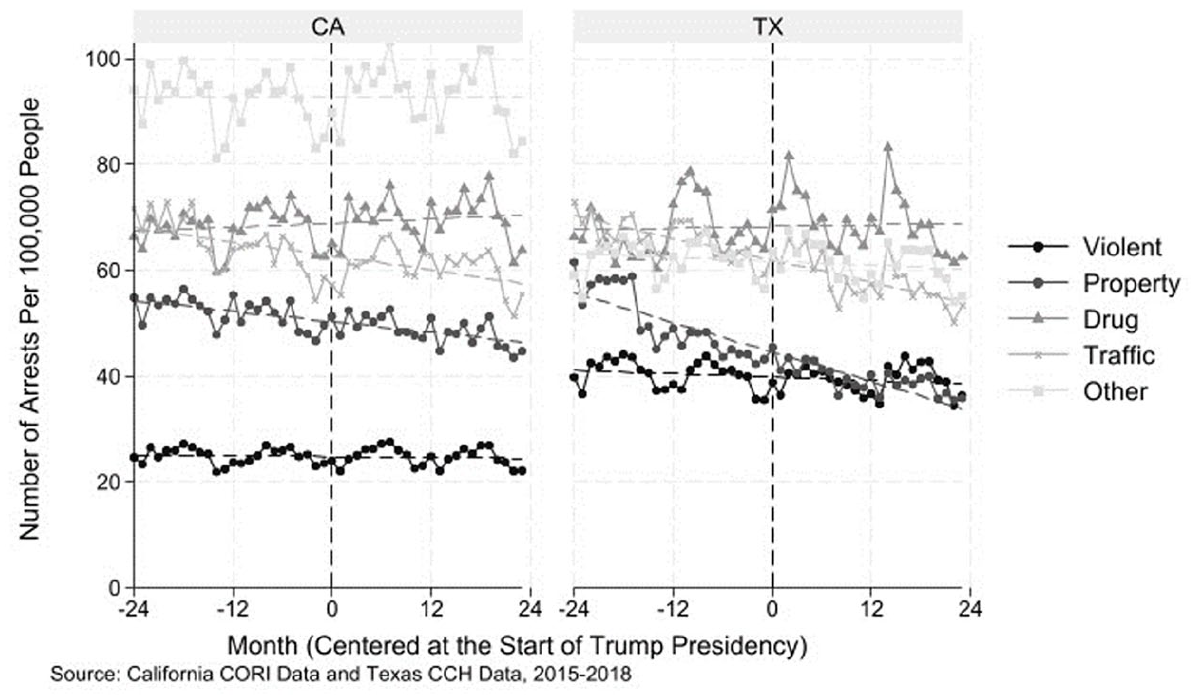
Arrest rates in California and Texas, 2015 to 2018.
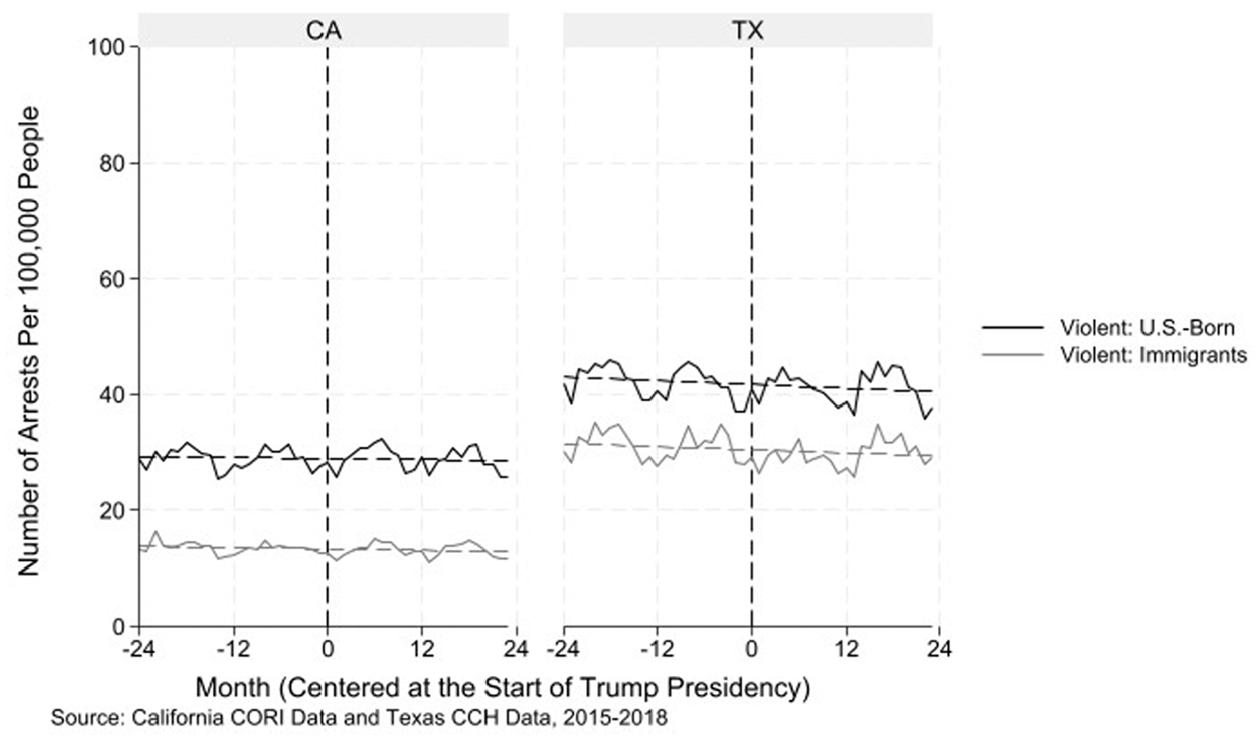
Violent arrest rates by immigrant status in California and Texas, 2015 to 2018.
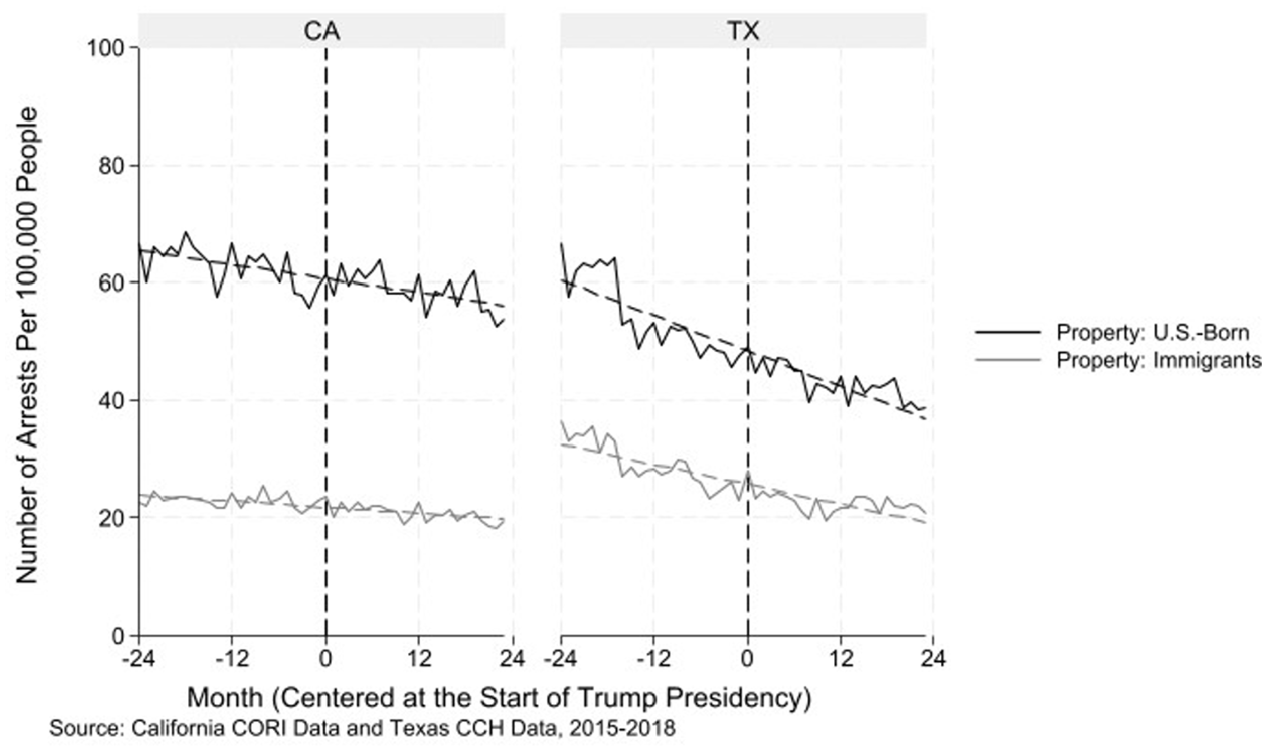
Property arrest rates by immigrant status in California and Texas, 2015 to 2018.
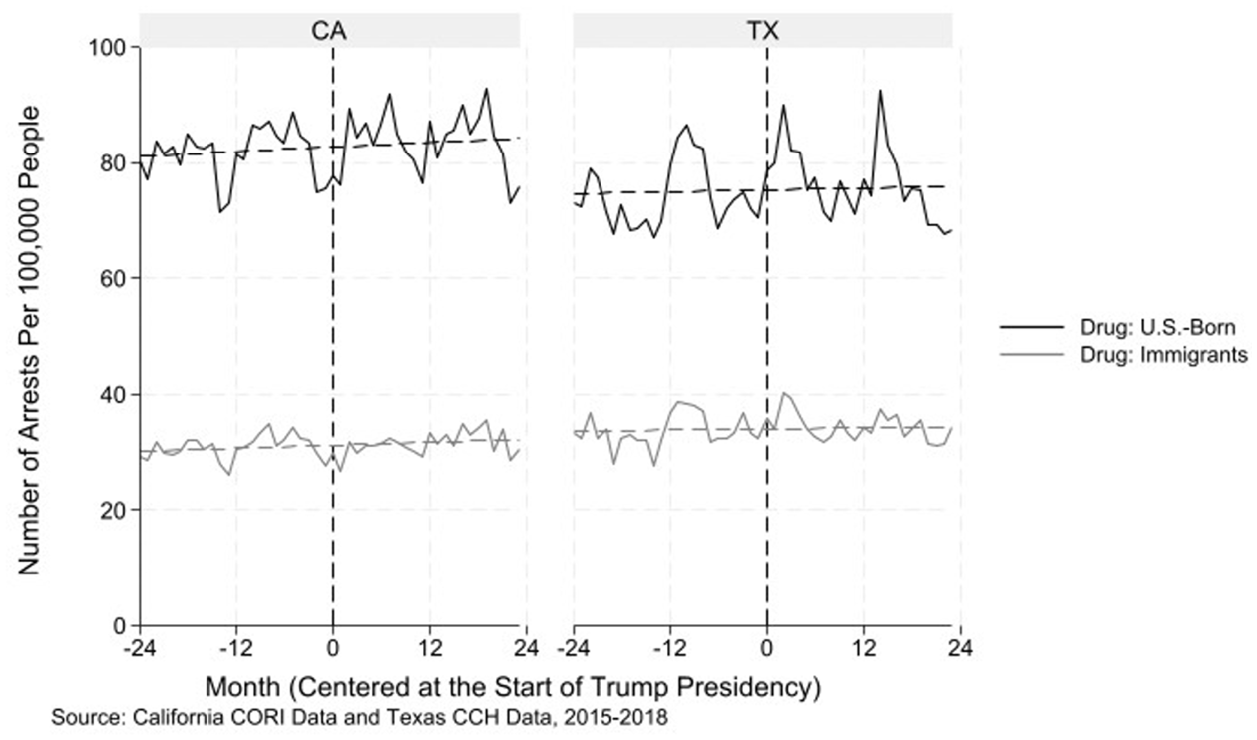
Drug arrest rates by immigrant status in California and Texas, 2015 to 2018.
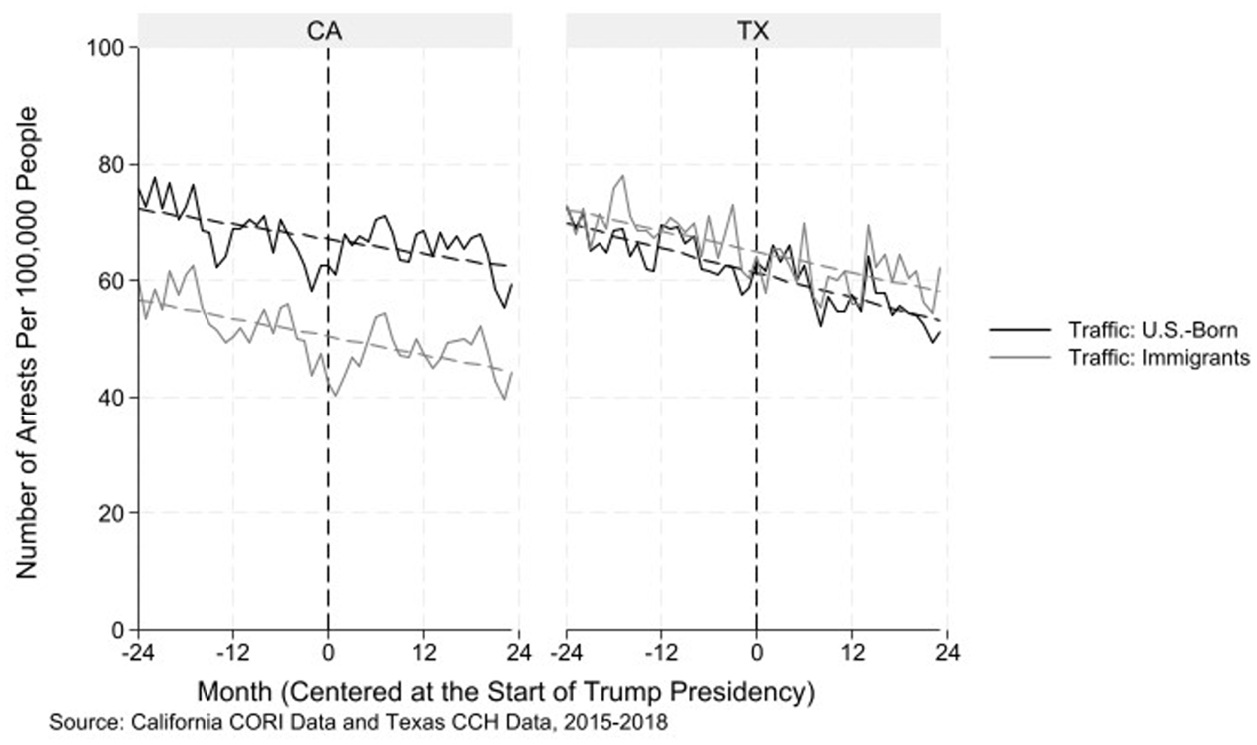
Traffic arrest rates by immigrant status in California and Texas, 2015 to 2018.
Starting with violent crime in Figure 2, two points are noteworthy. First, consistent with much of the prior immigration-crime research (R. Sampson, 2008), in both states we find that violent crime rates among immigrants are lower than among the native-born. Second, although we observe some seasonal changes in crime, there is no visible change in the violent arrest rate for immigrants relative to non-immigrants in either state. Put simply, immigrant and non-immigrant violent arrests changed little following the Trump inauguration.
Figure 3 focuses on property crime. The pattern clearly shows that the arrest rates for both the U.S.-born population and immigrants decreased over time, more noticeably in Texas than California. Furthermore, the slopes of the estimated linear trends in property crimes for immigrants and non-immigrants appear very similar in both Texas and California. Despite some differences depending on the month, the decrease in arrests between 2015 and 2018 is around 10% in California and 30% in Texas. But in neither state do we observe noticeable changes in immigrant or native-born arrests during the Trump presidency.
This is generally true for drug arrests (Figure 4) and traffic arrests (Figure 5) as well, though it is worth noting that unlike other offense types, we observe slightly higher traffic arrest rates for immigrants than non-immigrants in Texas. Taken together, Figures 2 to 5 suggest that the trends in immigrant arrests changed little in the first 2 years of the Trump presidency, and to the extent that they did change, these trends largely track those of non-immigrant criminality. These results undermine claims that the stepped-up border enforcement initiatives under Trump resulted in less immigrant criminality, but such descriptive findings are hardly conclusive. We thus turn to our difference-in-differences models to apply greater empirical scrutiny to this question.
Table 2 presents a series of four linear regressions to examine whether, and the extent to which, immigrant arrests changed during the Trump administration. Here, the dependent variable is the immigrant arrest rate for different offense types. To account for nonindependence in the underlying error variance–covariance matrix, we use robust standard errors clustered by county. Before discussing our main results, we note that the percent White in the county moderately, but significantly predicts each type of immigrant arrest. This is an interesting pattern given that crime generally tends to be inversely correlated with the percent White. These results, however, suggest that immigrant arrest rates tend to be higher in counties with larger shares of non-Hispanic Whites. Perhaps more notable is that disadvantage significantly predicts higher levels of immigrant crime, regardless of offense type. These findings align with a wealth of criminological research suggesting that entrenched structural disadvantage is a key macro-level predictor of crime and violence (Light & Ulmer, 2016; R. J. Sampson & Wilson, 1995).
Estimating Immigrant Arrest Rates in California and Texas using Difference-in-Differences, 2015 to 2018.
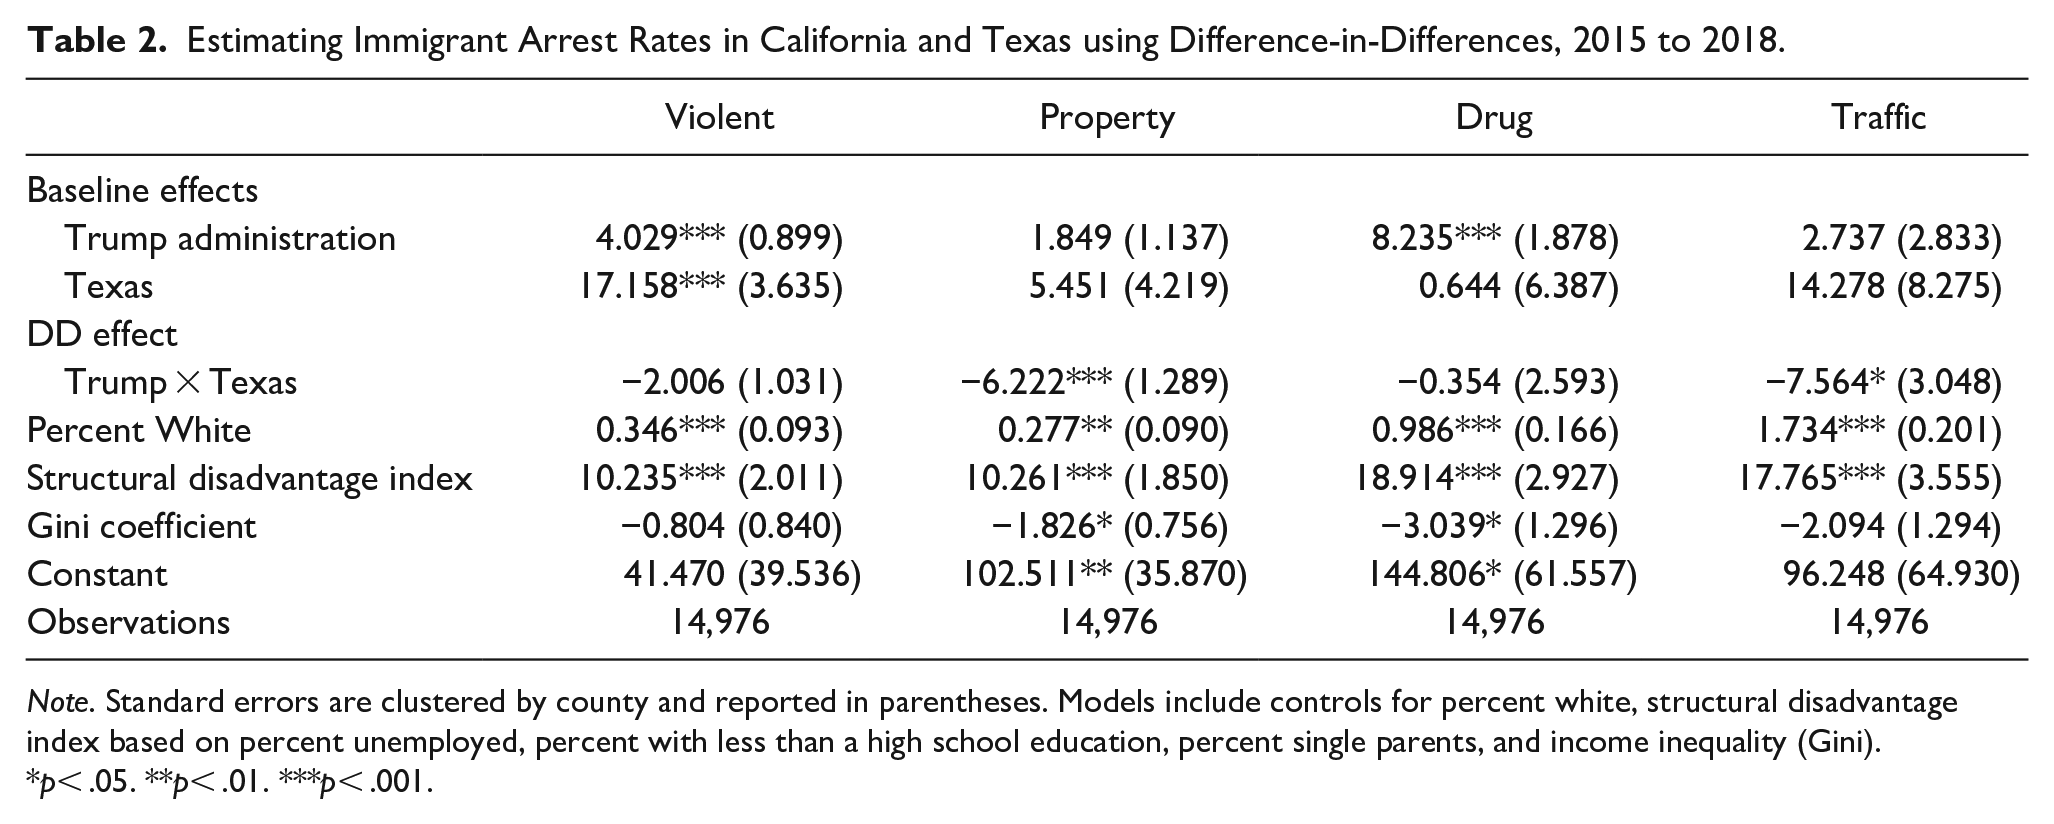
Note. Standard errors are clustered by county and reported in parentheses. Models include controls for percent white, structural disadvantage index based on percent unemployed, percent with less than a high school education, percent single parents, and income inequality (Gini).
p< .05. **p< .01. ***p< .001.
Turning to our central research question, the focal independent variables in Table 2 are the post-Trump period (the treatment), Texas (where the Trump administration’s policies were more readily implemented), and the interaction between the two. Starting with the baseline associations, the interaction changes the interpretation of these coefficients, such that the “Trump Administration” captures the post-Trump period in California and the “Texas” coefficients represent the mean differences between Texas and California in the pre-Trump period. Thus, we see that immigrant arrest rates were higher in Texas than California in the pre-Trump period, but only significantly so for violent crime. Focusing on the interactions, the results for violence and drugs align with the descriptive trends: we find no evidence that immigrant arrests for violent or drug crime shifted after Trump in Texas relative to California, as shown by the substantively small and statistically insignificant interaction effects. For property and traffic crimes, however, we do observe statistically significant decreases in immigrant arrests in Texas relative to California. As discussed in the theoretical framing, there are multiple interpretations of these findings, such as compositional changes or deterrent and/or incapacitation effects resulting from increased ICE arrests in Texas over this period. An alternative view, which is alluded to in the figures, is that these changes in immigrant arrests mirror those of non-immigrants.
Table 3 probes this latter possibility by adding additional interactions to examine immigrant criminality relative to non-immigrant crime. The baseline results are comparable to those observed in Table 2, as are coefficients for the control measures. The addition of the “Immigrant” measure reports results consistent with a wealth of criminological research showing that immigrant arrest rates tend to be significantly lower than those observed for non-immigrants (Kubrin & Ousey, 2023). 13
Estimating Immigrant and Non-Immigrant Arrest Rates in California and Texas Using Difference-in-Difference-in-Differences, 2015 to 2018.
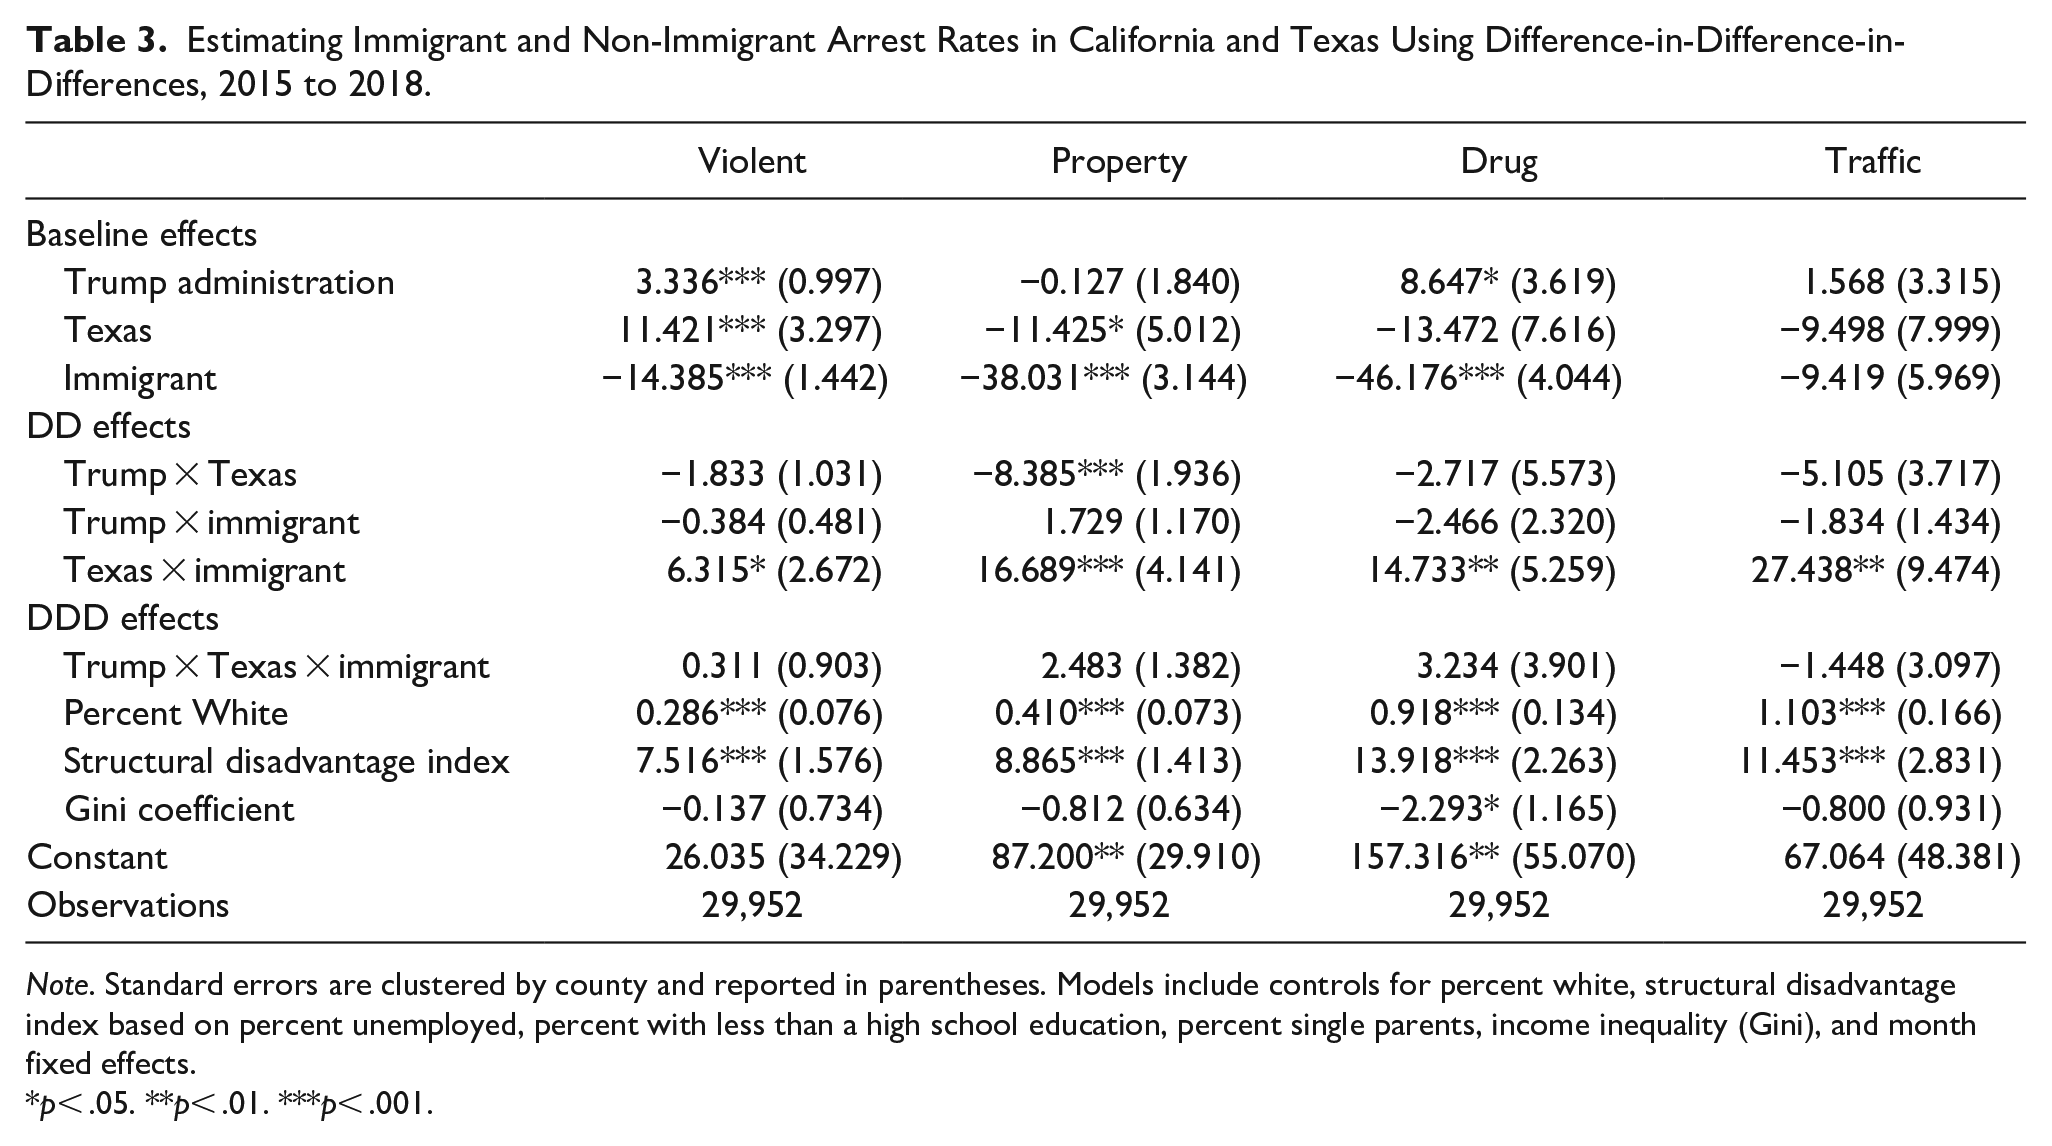
Note. Standard errors are clustered by county and reported in parentheses. Models include controls for percent white, structural disadvantage index based on percent unemployed, percent with less than a high school education, percent single parents, income inequality (Gini), and month fixed effects.
p< .05. **p< .01. ***p< .001.
In these models, the focal variable is the difference-in-difference-in-differences (DDD) interactions, which estimates whether immigrant arrests changed relative to non-immigrant arrests in Texas following Trump, adjusting for any changes in the immigrant-nonimmigrant arrest gap in California over this same period. Although structural disadvantage remains a strong predictor of each measure of crime, none of the focal interactions are significant in Table 3. This suggests that the decreases in property and traffic arrests in Texas observed in Table 2 are not unique to immigrants. Rather, the DDD results suggest that the trends in immigrant arrests in Texas track those of non-immigrants, and these gaps are essentially the same in Texas and California. When taken together with the descriptive figures, the evidence presented here shows that the transition from the Obama administration to the Trump administration had little meaningful effect on immigrant arrests relative to non-immigrants, at least in California and Texas.
Robustness Checks
Although our incident-based arrest rate calculations provide considerable detail about the scope of known crimes, it is also common to use the most serious arrest offense for classification purposes (i.e., an arrest where an individual was charged with homicide and resisting arrest would be classified as a homicide). Table A1 in the appendix replicates our core results using this alternative classification strategy to calculate arrest rates. In Texas, we measure severity in two ways. First, whichever charge had the highest felony or misdemeanor level (Capital felony, 1st-degree felony, etc.) is considered the arrest offense. Among the small proportion of cases that had multiple charges of the same level, the most severe charge was determined by the highest average sentence length. In the CORI data, the severity of the charges was determined by the average sentence length due to the lack of such categorical measures of severity found in the CCH data.
For parsimony, we focus on the difference-in-difference-in-differences (DDD) results throughout this section. Apart from the offense classifications, all other specifications are identical to our main analyses in Table 3. The results in Table A1 are virtually indistinguishable, both substantive and statistically, from our main analysis, suggesting that our key findings are robust to different approaches to calculating arrest rates.
Differences across counties are also important to consider given that counties vary substantially along key social, economic, political, and criminal justice dimensions. Cognizant of this fact, in Table A2 we include county-fixed effects, thus focusing on within-county changes over this period. Fixed effects have several benefits. First, they remove the effects of all time-invariant causes of crime (Firebaugh, 2008). Second, they eliminate the effects of between-county variation in reporting, charging, and data collection methods. Finally, they help address issues of measurement error in both the independent and dependent variables, so long as any measurement error is stable over time.
The inclusion of county effects, however, does slightly alter our model specifications. This is because the state in which a county is located does not change over time. For this reason, the main effect of Texas is omitted from the models in Table A2. The rest of the model specification is the same, and the focal DDD interactions can still be interpreted as the change in immigrant arrests relative to non-immigrant arrests in Texas following Trump, net of changes in the immigrant-nonimmigrant arrest gap in California during this time. The results show that, while few of the controls remain significant with the inclusion of county fixed effects, we observe no substantive changes in our key interactions. Taken together, these results buttress the overall conclusion that little changed with respect to immigrant arrests in Texas and California during the first 2 years of the Trump presidency.
Discussion
Despite speculation regarding the efficacy of the Trump presidency, which promised stricter immigration enforcement targeting alleged criminal immigrants and the decrease in crime rates among immigrants, surprisingly little research has directly investigated these speculations. This is an important gap given that the purported public safety benefits of immigration enforcement continue to influence public policy today. Texas Governor Greg Abbott, for example, ordered the Texas Department of Public Safety to launch “Operation Lone Star” to “combat the smuggling of people and drugs into Texas,” blaming the allegedly lax immigration policies of the Biden Administration that “invite illegal immigration” and “endanger the lives of Texans” (Office of Texas Governor, 2021).
Against this backdrop, our study informs these policy debates by providing little evidence to suggest that immigrant arrests changed markedly during the Trump administration’s first 2 years. In this regard, our results align with research that suggests that even the most aggressive immigration enforcement programs, such as Secure Communities, have had little impact on crime (Miles & Cox, 2014; Treyger et al., 2014). However, our study goes considerably beyond prior research by examining immigrant arrest rates specifically. In doing so, we answer recent calls for longitudinal immigration-crime research that uses more precise measures of crime, including minor forms of crime (Martínez et al., 2018). Even with this more fine-grained analysis, we see little change before and after the Trump policies and to the extent that immigrant arrest rates did change, these trends largely mirrored those of non-immigrants.
These novel findings should be interpreted within the context of several limitations in our study. First, a long-standing concern in criminology is that official crime data reflect a mixture of criminal behavior and the discretionary decisions made by police (O’Brien, 1996). In other words, our arrest measures may be imperfect proxies for the actual level of immigrant criminality in Texas and California. Although this concern is lessened when examining more reliably reported crimes such as violence, it is nonetheless important to keep in mind when considering our largely null findings.
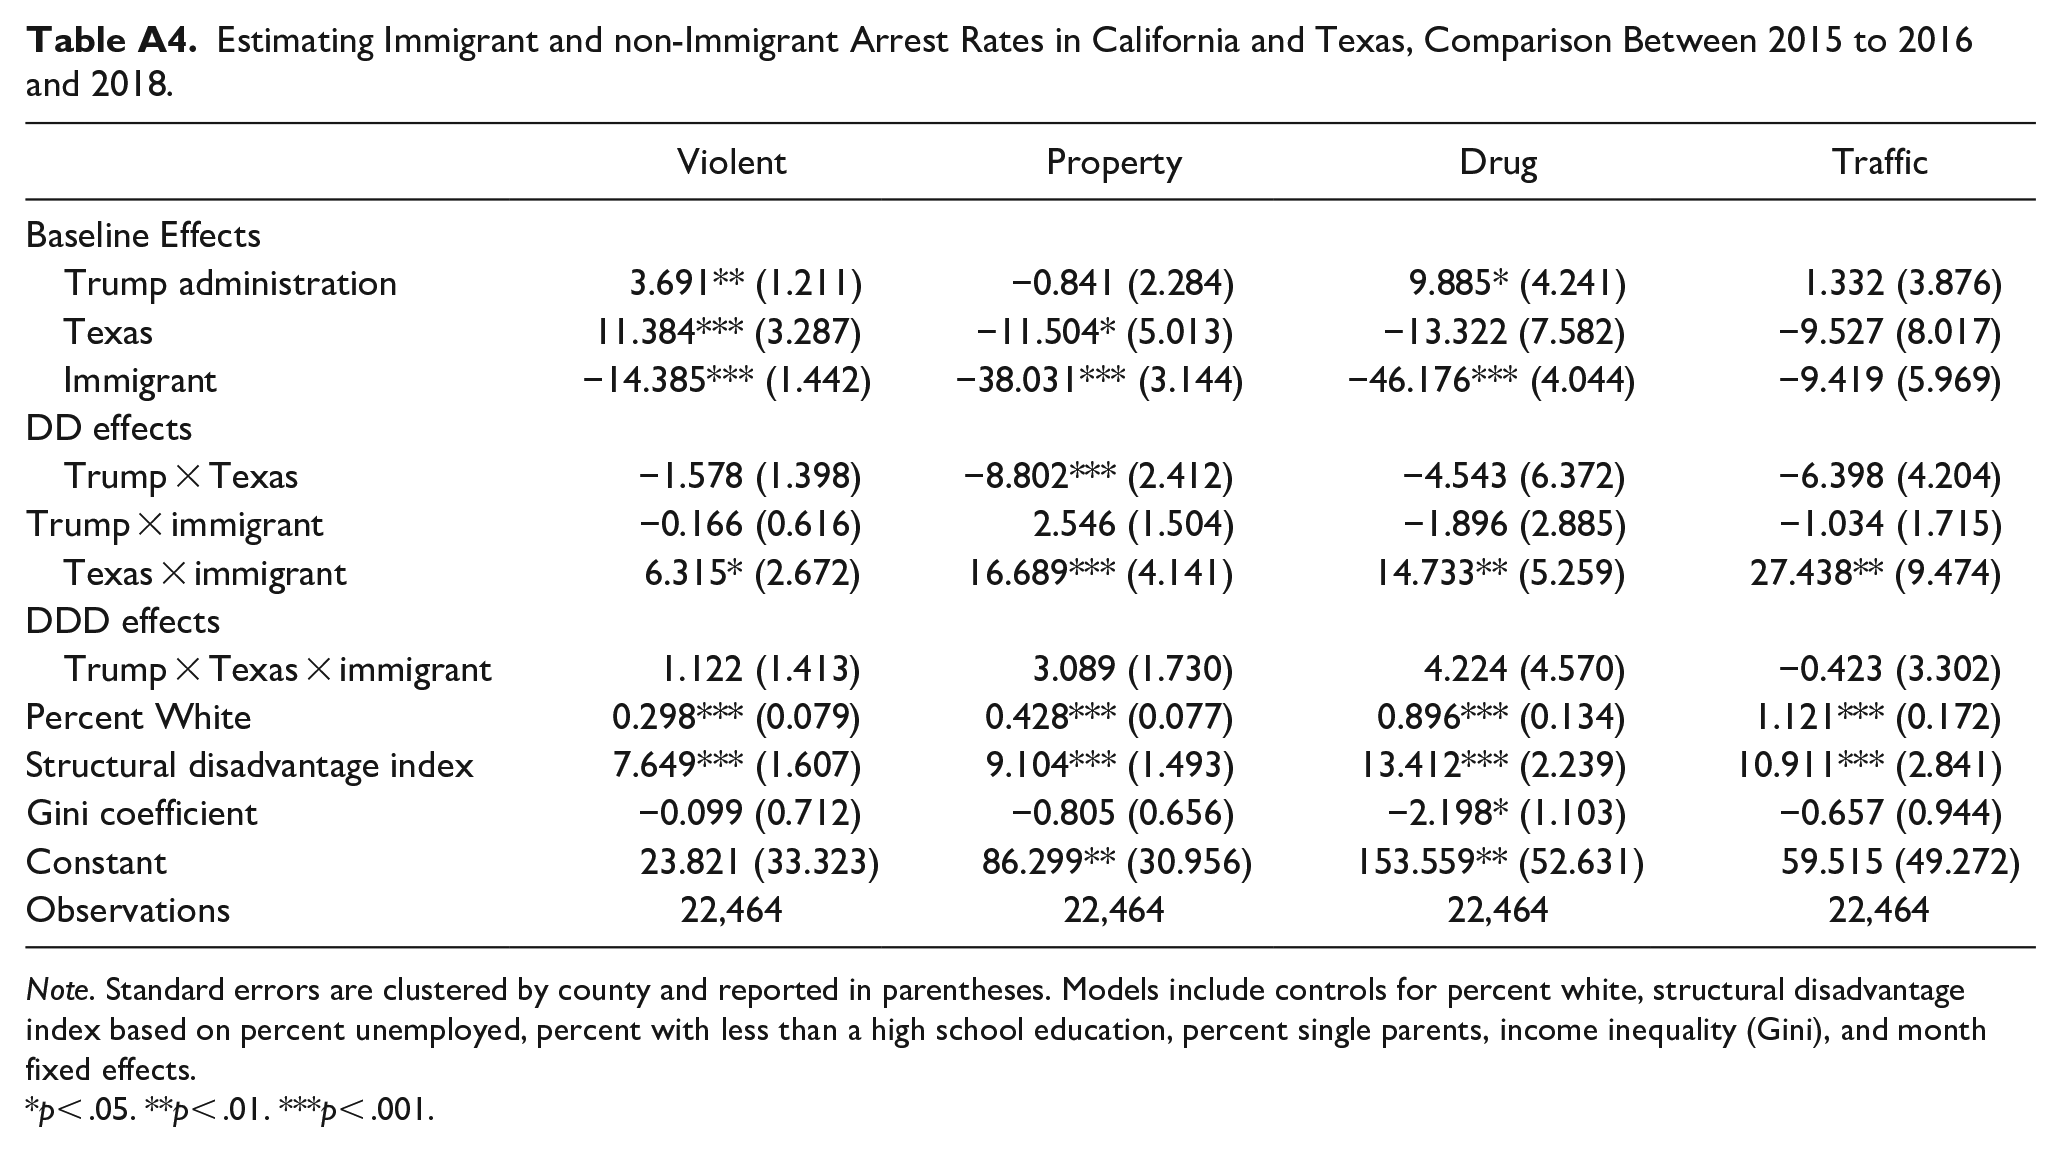
Second, our analysis was limited to a relatively narrow timeframe. While one potential benefit of our approach is the ability to focus on crime before the upheaval of the COVID-19 pandemic, it remains possible that immigrant arrest rates changed more in the latter half of the Trump administration, demonstrating a lagged effect of the Trump presidency. To partially address this concern, we compared 2015 to 2016 with 2017 and 2018 separately in Tables A3 and A4 in the appendix. There we find no evidence of changes in immigrant arrests in either year. Our data, however, do not go beyond 2018 and thus future research should continue to monitor the trends in immigrant arrests, especially as the policies surrounding immigrant enforcement have once again shifted with the Biden administration.
Third, measurement error in our population estimates warrants consideration. For instance, Nagaraja and McElroy (2015) suggest that 1-year ACS estimates may be preferable over 5-year estimates due to measurement error in the latter data. The drawback of 1-year estimates, however, is the substantial reduction in cases because only a fraction of counties have enough data for reliable estimates in any given year. Still, to help assuage this concern, we compared our immigrant arrest rates for counties that had both 5-year and 1-year estimates in our sample. The correlations between the arrest rates using the 1- and 5-year population estimates are above .98 for all offense types. A related concern is the introduction of measurement error from our interpolation of population estimates for each month (see Simpson et al., 2023 for a detailed discussion of interpolation in the ACS). In both cases, our use of county-fixed effects helps address this concern, as long as any measurement error does not change within counties over time.
Fourth, because much of the policy prescriptions of the Trump administration were directed at unauthorized migration, it is reasonable to speculate that arrest patterns involving undocumented immigrants were most affected over this period, not immigrant arrests generally. Although information on documentation status is not available in the CORI data from California, it is available over this period in Texas. This is because the Texas Department of Public Safety is unique in that it fully cooperates with the Department of Homeland Security (DHS) to check and record the immigration status of all arrestees throughout the state, including their legal status (reported as either “legal” or “illegal”). Following the procedures of Light et al. (2020), any individual deemed “illegal’ by the DHS is coded as an undocumented immigrant and our underlying population data comes from the Center for Migration Studies (CMS). Unfortunately, these population estimates are only available at the state level over time, rather than the county level. Although we cannot compare undocumented arrests in Texas to those in California (for lack of comparable data), we can examine if there were any notable changes in the arrest patterns in Texas involving undocumented immigrants during our study period. Those results are shown in Appendix Figures A1 to A4. There, readers can see that while undocumented arrest rates fluctuate over this period, there is little evidence of meaningful shifts in arrest patterns for any of the offense types.
Mindful of these caveats and calls for further research, our study has several notable implications. The fact that we see little effect on traffic offenses warrants attention, especially in Texas. Traffic offenses involve a considerable amount of discretion and critics of the move toward “crimmigration” policies have feared that immigration enforcement leads to police using their discretion to disproportionately profile and arrest ethnic minorities and immigrants (Johnson, 2016). Our results are not consistent with these fears, as we observe no discernable shift in traffic arrests for immigrants relative to non-immigrants in Texas, compared to California.
Regarding research on the impacts of “sanctuary” policies, our results are consistent with research suggestive of a largely null relationship between immigrant protective policies and crime. That is, in states with markedly different responses to the Trump administration’s immigration policies, we observe virtually no change in immigrant arrests relative to non-immigrants. These results have implications for both proponents and opponents of immigrant protective policies.
For opponents of “sanctuary” policies, we find no evidence to suggest that the immigrant protective policies in California led to an increase in arrests across any crime category relative to the trends in Texas. This suggests that the most ambitious expectations of increasing public safety through immigration enforcement in Texas did not materialize, at least in the first 2 years of the Trump administration. There are several potential explanations for these findings. It could be that immigrant criminal behavior is not responsive to the level of coordination between local criminal justice officials and federal immigration authorities. Rather, as the data trends suggest, immigrant criminality appears to ebb and flow along with non-immigrant criminality. In other words, both immigrant and non-immigrant crime respond to similar factors and processes. Another possibility is that because immigrants tend to have lower crime rates than non-immigrants, removing them (or increasing the chances of removal through collaborations with ICE), is unlikely to yield appreciable public safety benefits. Another possibility is that, even in California, the threat of deportation remains a significant deterrent to immigrant criminality. For example, between 2015 and 2018, ICE arrested over 71,000 immigrants in California, 47%of which were through collaborations with local jails, state prisons, or other contacts with the criminal justice system (TRAC, 2018). Thus, even with immigrant protective policies among state and local authorities, the shadow of immigration enforcement still looms large in California. Taken together, our empirical findings largely echo the conclusion that “little is to be gained in terms of crime control by adopting devolution policies and punishing sanctuary jurisdiction specifically, or more broadly, by enacting harsh, restrictive, and exclusionary policies aimed at immigrants and immigration” (Kubrin & Ousey, 2023, p. 91).
For proponents of “sanctuary” policies, however, we find little evidence to suggest that California benefitted from these laws and practices, at least in terms of crime reduction. Thus, while there may be other benefits to these programs such as keeping families intact, reducing stress, and signaling inclusion (Jiménez et al., 2021), crime reduction does not appear to be among them.
Lastly, though not the focus of our inquiry, we note that our disadvantage findings have theoretical implications as well. The “racial invariance thesis” represents perhaps the most prominent theoretical explanation for group-level disparities in crime. Developed by R. J. Sampson and Wilson (1995), the core argument is that group differences in crime stem from macrosocial patterns of inequality and the differential exposure of some groups to criminogenic conditions, such as poverty, unemployment, and single-parent households. Despite prominent calls to examine extensions of this argument to immigrant groups (Peterson & Krivo, 2005), data limitations have largely hampered these efforts. Our study fills this gap by demonstrating that immigrant arrests are also responsive to the level of structural disadvantage within their communities. In doing so, our analysis provides suggestive evidence that the central tenets of the “racial invariance thesis” may be applicable to immigrant groups as well.
Footnotes
Appendix
Estimating Immigrant and non-Immigrant Arrest Rates in California and Texas, Comparison Between 2015 to 2016 and 2018.
| Violent | Property | Drug | Traffic | |
|---|---|---|---|---|
| Baseline Effects | ||||
| Trump administration | 3.691** (1.211) | −0.841 (2.284) | 9.885* (4.241) | 1.332 (3.876) |
| Texas | 11.384*** (3.287) | −11.504* (5.013) | −13.322 (7.582) | −9.527 (8.017) |
| Immigrant | −14.385*** (1.442) | −38.031*** (3.144) | −46.176*** (4.044) | −9.419 (5.969) |
| DD effects | ||||
| Trump × Texas | −1.578 (1.398) | −8.802*** (2.412) | −4.543 (6.372) | −6.398 (4.204) |
| Trump × immigrant | −0.166 (0.616) | 2.546 (1.504) | −1.896 (2.885) | −1.034 (1.715) |
| Texas × immigrant | 6.315* (2.672) | 16.689*** (4.141) | 14.733** (5.259) | 27.438** (9.474) |
| DDD effects | ||||
| Trump × Texas × immigrant | 1.122 (1.413) | 3.089 (1.730) | 4.224 (4.570) | −0.423 (3.302) |
| Percent White | 0.298*** (0.079) | 0.428*** (0.077) | 0.896*** (0.134) | 1.121*** (0.172) |
| Structural disadvantage index | 7.649*** (1.607) | 9.104*** (1.493) | 13.412*** (2.239) | 10.911*** (2.841) |
| Gini coefficient | −0.099 (0.712) | −0.805 (0.656) | −2.198* (1.103) | −0.657 (0.944) |
| Constant | 23.821 (33.323) | 86.299** (30.956) | 153.559** (52.631) | 59.515 (49.272) |
| Observations | 22,464 | 22,464 | 22,464 | 22,464 |
Note. Standard errors are clustered by county and reported in parentheses. Models include controls for percent white, structural disadvantage index based on percent unemployed, percent with less than a high school education, percent single parents, income inequality (Gini), and month fixed effects.
p< .05. **p< .01. ***p< .001.
Declaration of Conflicting Interests
The author(s) declared no potential conflicts of interest with respect to the research, authorship, and/or publication of this article.
Funding
This research was supported by grants from the National Science Foundation (Award # 1849297) and the National Institute of Justice (Award # 2019-R2-CX-0058).