
Abstract
This study tested whether bias motivation is an aggravating element of bullying victimization, such that victims of bullying involving bias experience lower wellbeing than victims of nonbiased bullying and nonvictims. Using nationally representative data from the 2009/2010 United States Health Behavior in School-aged Children (HBSC) survey (n = 11,335), I use coarsened exact matching (CEM) to compare wellbeing for youth in exposure and control groups who are similar on the measured covariates. Results reveal that biased bullying is positively associated with unwellness, implying that greater research and policy attention to this form of bullying is warranted.
School bullying victimization has demonstrable negative impacts on youths’ health and wellbeing (e.g., loneliness, Kim et al., 2018)—impacts that can linger well into adulthood (Wolke & Lereya, 2015). Nevertheless, not all children who are bullied experience these impacts, and not all bullying incidents are equally impactful. Certain incident characteristics are “aggravating” (Turner et al., 2015), or associated with an increased likelihood of victim harm. For example, victimizations involving injury have a higher likelihood of trauma symptoms than victimizations not involving injury (Turner et al., 2015). It is critical that research uncover the aggravating elements of victimization so that intervention and prevention efforts can prioritize the types of incidents that exhibit the greatest risk of impacting students.
One potentially aggravating element of bullying victimization is bias. Incidents motivated by hostility or prejudice against the victim’s actual or perceived characteristics—such as race, ethnicity, religion, gender, sexual orientation, or disability—may impact victims more than other types of incidents due to the harmful effects of discrimination. Criminologists have argued that “hate hurts more” (Iganski, 2001), and research examining the impacts of biased (versus nonbiased) crime victimization has found this to be the case (Malcom & Lantz, 2021; McDevitt et al., 2001). Yet, relatively little research has examined whether this pattern extends to non-criminal victimization among youth at school (see Hunter et al., 2010; Mulvey et al., 2018; Russell et al., 2012 for exceptions), particularly using nationally representative data. Further, some previous work has examined only one type of bias (e.g., racial bias), and other studies do not provide a comparison to nonbiased victimization (e.g., Price-Feeney et al., 2018).
In addition, the vast majority of prior research has used regression-based methods, without an attempt to improve causal inference through limiting comparisons to only observations that are similar on measured covariates (see Lehmann, 2023 for a similar observation). As youth who are likely to be victimized by biased bullying may differ from youth who are not likely to be victimized by biased bullying in ways that could influence wellbeing, research comparing wellbeing across types of victims should account for these potentially confounding influences.
This study advances the literature on biased bullying by using coarsened exact matching (CEM), which reduces statistical bias in estimates by matching youth on measured covariates and restricting analyses to the matched groups (Blackwell et al., 2009). Using the United States Health Behavior in School-aged Children data (HBSC) (n = 11,335) from 2009/2010, I compare wellbeing in the past week for victims of biased bullying in the past couple of months, victims of nonbiased bullying in the past couple of months, and nonvictims, using CEM matching to compare youth who are similar on potentially confounding variables.
Background
Scholars have proposed that prejudicial violence inflicts greater harm on victims because the perpetrator of biased incidents communicates a message of group subordination on the basis of immutable traits. For example, Perry (2001) argues that biased crimes seek to preserve the social hierarchy, as individuals with a privileged identity use biased crime to establish their difference from and superiority over victims. Malcolm and Lantz (2021) suggest that hate crimes dehumanize their victims, such that offenders “strip victims of their human qualities and assign them to a subhuman status” (Malcolm & Lantz, 2021, p. 1159). This latter position holds that, because the perpetrators of biased crime view their victims as representing a social group rather than as individuals, perpetrators can morally disengage from the crime and commit more severe violence (Malcolm & Lantz, 2021). It is likely that this implication of dehumanization is extraordinarily taxing on victims.
The hate crime offender typology put forth by Levin and McDevitt (1993) suggests that many biased victimizations are committed by “thrill-seekers,” or juveniles who seek out victims in groups to garner excitement from displaying power and normativity in front of peers. The greater thrill obtained from biased (versus nonbiased) offending is derived from the social acceptance expected as a result. Thus, biased incidents may cause heightened harm to victims because they often involve public denigration. Given that peer approval is highly valued among adolescents (LaFontana & Cillessen, 2010), it is reasonable to expect that school bullying incidents involving bias are tremendously damaging to students’ wellbeing.
The substantial body of work demonstrating the harmful effects of discrimination on mental and physical health (e.g., Benner et al., 2018) also implies that biased victimization relates to worse impacts than nonbiased victimization. Moreover, the results of a meta-analytic study emphasize that perceived discrimination is particularly impactful, suggesting that a victims’ subjective understanding of incident motivation is important (Schmitt et al., 2014). The authors of this study suggest that pervasive discrimination entails deprivation of the basic need for social acceptance, and that targets experience psychological damage because they feel like they have no control over their life outcomes (see also Verkuyten, 1998). Victims of biased bullying may also harbor greater fear of victimization than other types of victims, as they may perceive that because their immutable personal characteristics put them at risk for victimization, there is little they can do to prevent future victimization (McDevitt et al., 2001).
Many previous school-based studies on biased victimization have focused on only one type of bias, most commonly racial/ethnic or sexual orientation bias (e.g., Bayram Özdemir et al., 2020). Unquestionably, racist bullying and victimization can have serious impacts on youths’ health and wellbeing, including increased likelihood of suicide ideation (Cardoso et al., 2018) and depression (Arens & Visser, 2020). A separate—and rapidly expanding—body of research consistently finds that sexual minority youth are bullied more often than non-sexual minority youth (Toomey & Russell, 2016) and that these experiences are highly distressing for young victims (e.g., Tucker et al., 2016). At the same time, research from the adult hate crime literature has found that crimes which are motivated by sexual orientation bias tend to be more violent (Malcom & Lantz, 2021) and more likely to involve victim injury (Lantz & Kim, 2019) than other types of bias crimes.
However, while these specific forms of biased victimization are clearly associated with negative outcomes for students, it is likely than any form of biased bullying victimization is more impactful than nonbiased bullying victimization, regardless of the bias type. For instance, research on adults has found that crimes committed on the basis of gender are likely to lead to psychological victim impacts (Mellgren et al., 2021; Williams & Tregidga, 2014), and theoretical explanations for both crime and biased crime emphasize the use of aggression to exhibit normative masculine identity and dominance (Allison & Klein, 2021; Messerschmidt, 1997). Though past research on biased victimization among youth has not generally focused on religion, studies that do include religious bias in their analyses find that it is associated with depressive symptomatology similarly to the other bias types (Price-Feeney et al., 2018).
In short, the evidence suggests that any form of biased victimization is more influential for student wellbeing than nonbiased victimization. However, relatively little past research has examined the impacts of biased versus nonbiased bullying victimization for multiple bias types. The current study builds on prior work by examining the impacts of biased victimization related to race or color, religion, and sexuality, which, as measured in the HBSC, likely encompasses victimization targeting females as well as individuals presenting minoritized gender and sexual orientation identities (e.g., homosexuality, transgender).
The Current Study
The goal of the current study was to test whether adolescent victims of biased bullying have lower wellbeing than victims of nonbiased bullying and nonvictims using a more rigorous analytic approach than what has been used in previous studies to ensure that the inference of the outcomes likely being a consequence of the bullying—and not other experiences—is persuasive. To the author’s knowledge, prior work comparing biased and nonbiased victimization among youth has not attempted to improve the internal validity of estimates through matching techniques. Further, this study includes multiple bias types in the analyses.
The analyses conducted to pursue this goal were split into two sections. First, I compared (un)wellness for biased bullying victims (exposed group) to nonvictims (control group). Second, I compared biased bullying victims (exposed group) to nonbiased bullying victims (control group). Before analyzing each association, I matched students on pre-exposure covariates to increase similarity across groups (aside from bullying victimization exposure). I hypothesized that youth who have been victims of biased bullying in the past few months will report greater unwellness in the past week than youth who have been victims of nonbiased bullying and youth who have not been bullied in the past few months.
Data
The Health Behavior in School-aged Children (HBSC) is a cross-national study sponsored by the World Health Organization (WHO) that began in 1983. The HBSC was designed with the goal of examining health-related behaviors and attitudes among youth in relation to their background characteristics. Another goal was to assess how health-related behaviors and attitudes as they develop throughout adolescent development. Over 40 nations (mostly in Europe and North America) distribute these surveys every 4 years. Each national survey is administered independently, and some questions differ across nations. The current study uses data from the United States survey.
Each HBSC study sample is nationally representative and collected through a three-stage stratified design. Census divisions and grades are strata and school districts are the primary sampling units. The United States HBSC was collected by the CDM Group, Inc., through on-cite (i.e., in school) questionnaires (roughly 60% online and 40% using paper surveys). The survey was administered to youth in public and private secondary schools (grades 5–10). The 2009 to 2010 U.S. version of the survey contains responses from students from 314 schools. I use HBSC years 2009 to 2010 because these survey years contain measures of biased bullying victimization in addition to wellbeing indicators.
Measures
Independent Variables
Bullying victimization in the HBSC survey is measured with the following introduction and indicator: “Here are some questions about bullying. We say a student is BEING BULLIED when another student, or a group of students, say or do nasty and unpleasant things to him or her. It is also bullying when a student is teased repeatedly in a way he or she does not like or when he or she is deliberately left out of things. But it is NOT BULLYING when two students of about the same strength or power argue or fight. It is also not bullying when a student is teased in a friendly and playful way” followed by the question: “How often have you been bullied at school in the past couple of months?” Although this indicator asks the students if they have ever been bullied in the past couple of months, I do not use this variable to measure any bullying victimization. Instead, bullying victimization is measured by the more specific questions about types of bullying (to follow) because prior research shows that using behavior-specific indicators is a more valid way to measure bullying (Huang & Cornell, 2015).
After this definition and question about general bullying, the HBSC asks the students “How often have you been bullied at school in the past couple of months in the ways listed below?” with options “I was called mean names, was made fun of, or teased in a hurtful way,” “Other students left me out of things on purpose, excluded me from their group of friends, or completely ignored me,” “ I was hit, kicked, pushed, shoved around, or locked indoors,” “Other students told lies or spread false rumors about me and tried to make others dislike me,” “I was bullied with mean names and comments about my race or color,” “I was bullied with mean names and comments about my religion,” “other students made sexual jokes, comments, or gestures to me,” “I was bullied using a computer or mail messages or pictures,” “I was bullied using a cell phone,” “I was bullied outside of school using a computer or e-mail messages or pictures,” and “I was bullied outside of school using a cell phone.” The student can respond “I have not been bullied in this way in the past couple of months,” “only once or twice,” “2 or 3 times a month,” “about once a week,” or “several times a week.” I dichotomized each type of bullying to equal 1 (yes) if the student reported experiencing that type of bullying at least once in the past couple of months because my research question focuses on the type of bullying victimization rather than its frequency. However, in supplementary analyses, I re-estimated all models where bullying only equals 1 if students report being bullied at least 2 or 3 times a month to assess whether including the less frequent victims affects the findings.
Youth were categorized as either nonvictims (i.e., not a victim of any type of bullying), biased bullying victims (i.e., experienced any bullying involving bias, which included mean names and comments about race or color, religion, or sexual jokes/comments/gestures), or nonbiased bullying victims (experienced only bullying that was not related to bias or did not specify that the bullying involved bias). Youth were categorized this way because nearly all victims who experienced biased bullying also experienced nonbiased bullying (i.e., only 3% of the full sample experienced only biased bullying). Consequently, excluding youth who experienced both biased and nonbiased bullying from the biased bullying victims group would fail to capture the majority of youth who experienced biased bullying.
Dependent Variables
The dependent measure was a wellbeing scale, which consisted of the following questions: “thinking about the last week . . .” with indicators: “have you felt fit and well,” “have you felt full of energy,” “have you felt sad,” “have you felt lonely,” “have you had enough time for yourself,” “have you been able to do the things that you want to do in your free time,” “have your parent(s) treated you fairly,” “have you had fun with your friends,” “have you got on well at school,” “Have you been able to pay attention,” with response options “never,” “seldom,” “quite often,” “very often,” or “always.” The indicators “felt lonely” and “felt sad” were reverse-coded for consistency with the other measures. This set of variables was used because they specify in the last week, so it is very likely that at least some bullying occurred before these outcomes. These outcomes were analyzed as numeric variables (always = 1 to never = 5) and were used to create an “unwellness” scale (i.e., mean of all measures; reliability coefficient = .82). Unwellness was the dependent variable (rather than wellness) for a more intuitive interpretation of the results.
Analytic Strategy
To compare the wellbeing of youth in the exposed versus control groups and infer that the difference across groups is likely attributable to the type of victimization, it is ideal to have two groups of students who are roughly equal each other on all predictors aside from victimization. Because this equality on covariates cannot be achieved through randomization of treatment in observational data (as would be the case in randomized control trials), use of a matching strategy can help reduce the problematic covariate imbalance. The matching strategy used in this study, coarsened exact matching (“CEM”), reduces imbalance across treatment and control groups in observational, nonexperimental data by dividing or “coarsening” variable responses into substantively meaningful groups and then matching treatment and control groups on the “coarsened” variables (Blackwell et al., 2009). The covariates are then “un-coarsened” (i.e., original response options retained) in subsequent regression analyses.
A benefit of coarsened exact matching over other matching techniques is that it does not require that treated observations have an exact match in the control group, only that treated observations have a match based on these broadened categories. For instance, matching treatment and control groups on school grades using an exact matching procedure would require that a treated youth with a response of “mostly A’s” be compared to a youth who also responded with “mostly A’s.” This relatively stringent requirement reduces the possibility that observations will find a match. Yet, if most of the important variation in school grades is between youth who get A’s or B’s versus youth who get C’s, D’s, or F’s, we can coarsen the “grades” variables to two responses for matching purposes (A’s and B’s vs. C’s, D’s, and F’s). Thus, coarsened exact matching requires only that youth in the treated group with A’s get matched to kids in the control group who have either A’s or B’s, which increases the likelihood of successful matching. The cut points for variable matching are user-defined (i.e., the user decides to create a cut point between B’s and C’s, for example), so the amount of imbalance in the matching solution is controlled by the user.
This approach is preferable to methods like propensity score matching, which require that the user check for balance after the groups have been matched and (possibly) re-estimate the matching algorithm if balance has not been achieved. Furthermore, CEM restricts the matched data to areas of common empirical support and is computationally efficient (Blackwell et al., 2009). Balance on covariates through CEM increases our confidence that other measured factors do not confound differences in the wellbeing outcomes across groups. However, the cross-sectional nature of the data limits my ability to test for strict causal effects because I cannot temporally isolate the treatment variable from the other potential confounders.
The CEM strategy is only effective if covariates that are matched occurred prior to exposure or, in the wording of statisticians, “treatment” (i.e., before the bullying). I therefore matched on demographic variables (i.e., gender, race/ethnicity, and age), residence classification (rural, urban, suburban, unclassified), and whether the student reports unmet material needs at home, measured using a proxy variable tapping into how often the student reports being hungry when going to bed or school. This variable was measured with the following indicator: “some young people go to bed or school hungry because there is not enough food at home. How often does this happen to you?” With response options “always” “often” “sometimes” and “never.” Finally, I matched on native-born U.S. citizenship, measured as whether the student was born in the U.S.
Following the recommendation of methodologists (Blackwell et al., 2009) and recent work in criminological research (e.g., Lehmann, 2023), I executed CEM matching multiple times (i.e., once for each comparison). The first comparison was restricted to biased bullying victims and nonvictims. The second comparison was restricted to biased bullying victims and nonbiased bullying victims. First, I estimated unadjusted and covariate-adjusted OLS regression models on the unmatched sample to examine the associations between biased bullying victimization and unwellness prior to matching. Second, I assessed covariate imbalance across exposure and controls groups prior to matching. I then executed coarsened exact matching and re-assessed covariate imbalance after matching. Third, I estimated OLS regressions on the matched sample (with “cem_weights” in STATA; hereafter referred to as “CEM” models) to predict unwellness across the exposure and control groups, not adjusting and then adjusting for the uncoarsened covariates. These models do not use the SVYSET commands because “cem_weights” were used instead. Missing data in both cases were handled using listwise deletion. Because matching strategies involve dropping unmatched cases, sample sizes were reduced on the matched samples from the full analytic sample (see Table A3 for exact reductions).
Results
Summary Statistics
Summary statistics for the pre-match analytic sample are presented in Table 1. Regarding bullying victimziation in the past couple of months, 27% experienced any biased bullying, 26% experienced only nonbiased bullying, and 47% were not victims of bullying. Of the measured bias types, sexually biased bullying was the most common (experienced by about 21% of the full sample) and biased bullying related to religion was the least common (experienced by about 9% of the full sample). The mean score for unwellness was 2.15 (SD = 0.74) on a 1 to 5 scale. The sample contained slightly more males than females (51 vs. 49%) and was more than half Non-Hispanic White (55%; hereafter “White”). Approximately 14% of students were Non-Hispanic Black (hereafter “Black”) and 13% were Hispanic. Students identifying as Asian, two or more ethnicities, and as another race/ethnicity (hereafter “Other race/ethnicity”) were each less than 10% of the sample. The average age of students was 13.01 (SD = 1.74). About a quarter of the sample attended school in an urban area (26%), and just under half attended school in a suburban area (42%). A total of 27% of students have gone to bed or school hungry either sometimes, often, or always. Finally, 8% of the sample was born outside of the United States.
Summary Statistics for Full Analytic Sample, HBSC 2009–2010 (n = 11,335).
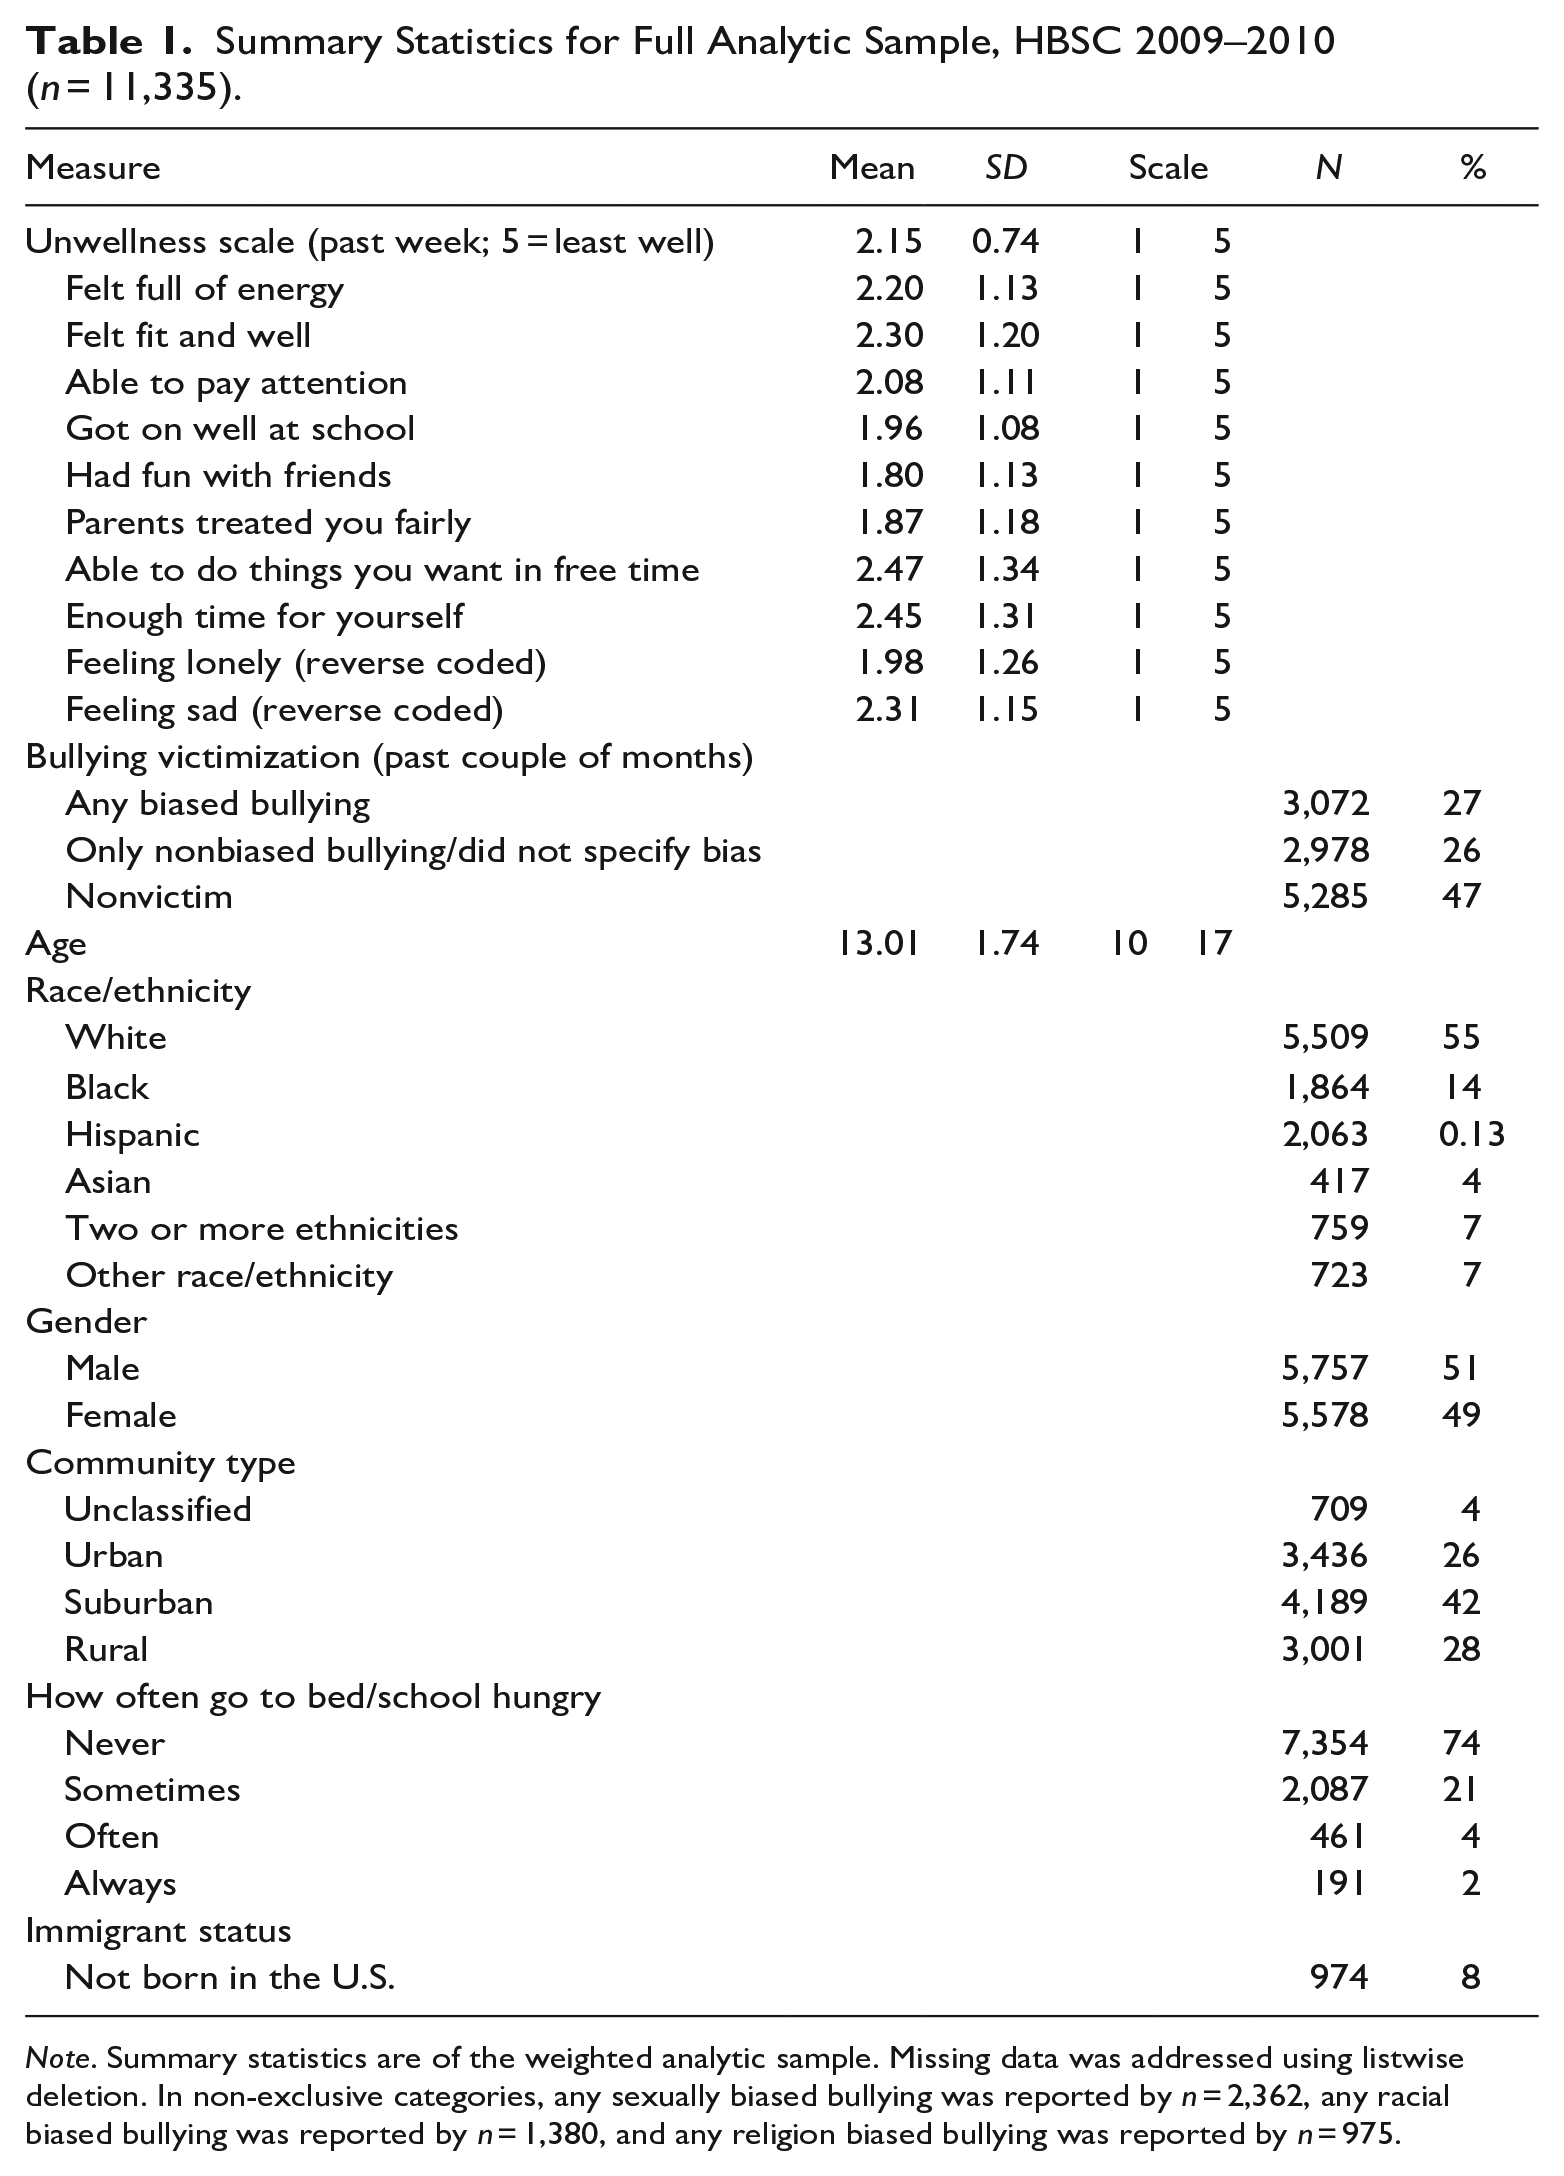
Note. Summary statistics are of the weighted analytic sample. Missing data was addressed using listwise deletion. In non-exclusive categories, any sexually biased bullying was reported by n = 2,362, any racial biased bullying was reported by n = 1,380, and any religion biased bullying was reported by n = 975.
Biased Bullying Victims Versus Nonvictims Comparison
The first match involved only nonvictims and victims of biased bullying. Accordingly, I examined covariate imbalance for these two groups before and after matching (see Table 2). In the unmatched sample, being female, two or more ethnicities, gone to school/bed hungry, and not being born in the U.S. all significantly differed between biased bullying victims and nonvictims. These differences were reduced to effectively zero after matching (see Panel B in Table 2). Specifically, CEM matching reduced the multiple unbalance indicator score (L1) from .224 to nearly 0 (4.161E-15; see Table A1). For this first match, 17 youth from the control group (i.e., nonvictims) and 41 youth from the exposed group (i.e., biased bullying victims) were not matched and were therefore dropped from the analytic sample.
Differences Between Youth Who Experienced No Bullying (Control Group) and Biased Bullying Victimization (Exposure Group): Covariate Balance Pre- and Post-Match.
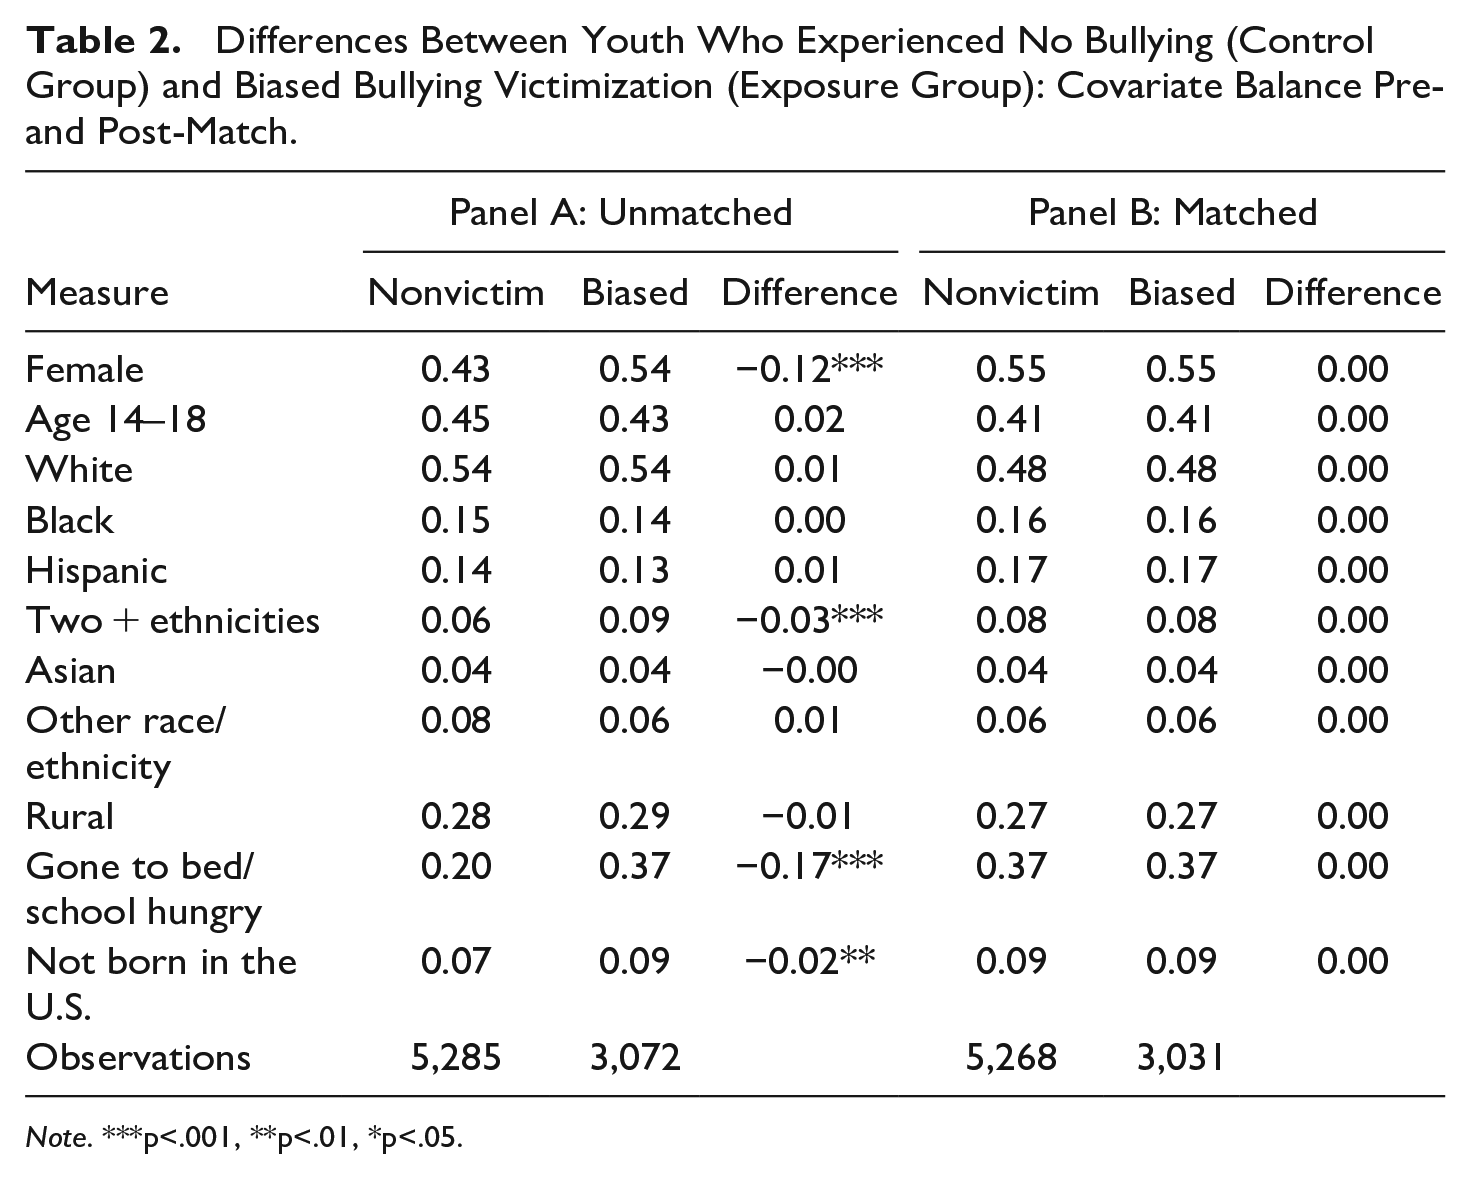
Note. ***p<.001, **p<.01, *p<.05.
Next, I estimated two sets of OLS regressions—one on the CEM matched sample and one on the unmatched sample—to assess the associations between unwellness and being a biased bullying victim versus a nonvictim. Table 3 presents the unadjusted (Model 1) and adjusted for controls (Model 2) regression estimates on the unmatched (“OLS”) and exactly matched (“CEM”) samples of biased bullying victims and nonvictims. As shown in Panel A (unmatched OLS), biased bullying victimization was associated with a .54 increase in unwellness in the unadjusted model and a .44 increase in unwellness after adjustment (b = .54, p < .001; b = .44, p < .001). After CEM matching (Panel B), biased bullying victimization was associated with a .44 unit increase in unwellness unadjusted for covariates (b = .44, p < .001) and a .42 unit increase in unwellness adjusting for the remaining covariate imbalance (b = .43, p < .001). In this adjusted, CEM-matched model (Panel B Model 2), each year of age was associated with a .08 unit increase in unwellness (p < .001) and being female (relative to being male) was associated with a .18 unit increase in unwellness (p < .001). Belonging to the two or more ethnicities racial/ethnic group was associated with a .11 unit increase in unwellness relative to being White (p < .001). Finally, having gone to bed or school hungry sometimes, often, or always (versus never) were associated with increases on the unwellness scale (b ranging from .33 for sometimes to .81 for always, p < .001).
OLS and CEM Regression Models Predicting Unwellness for Biased Bullying Victims and Nonvictims.
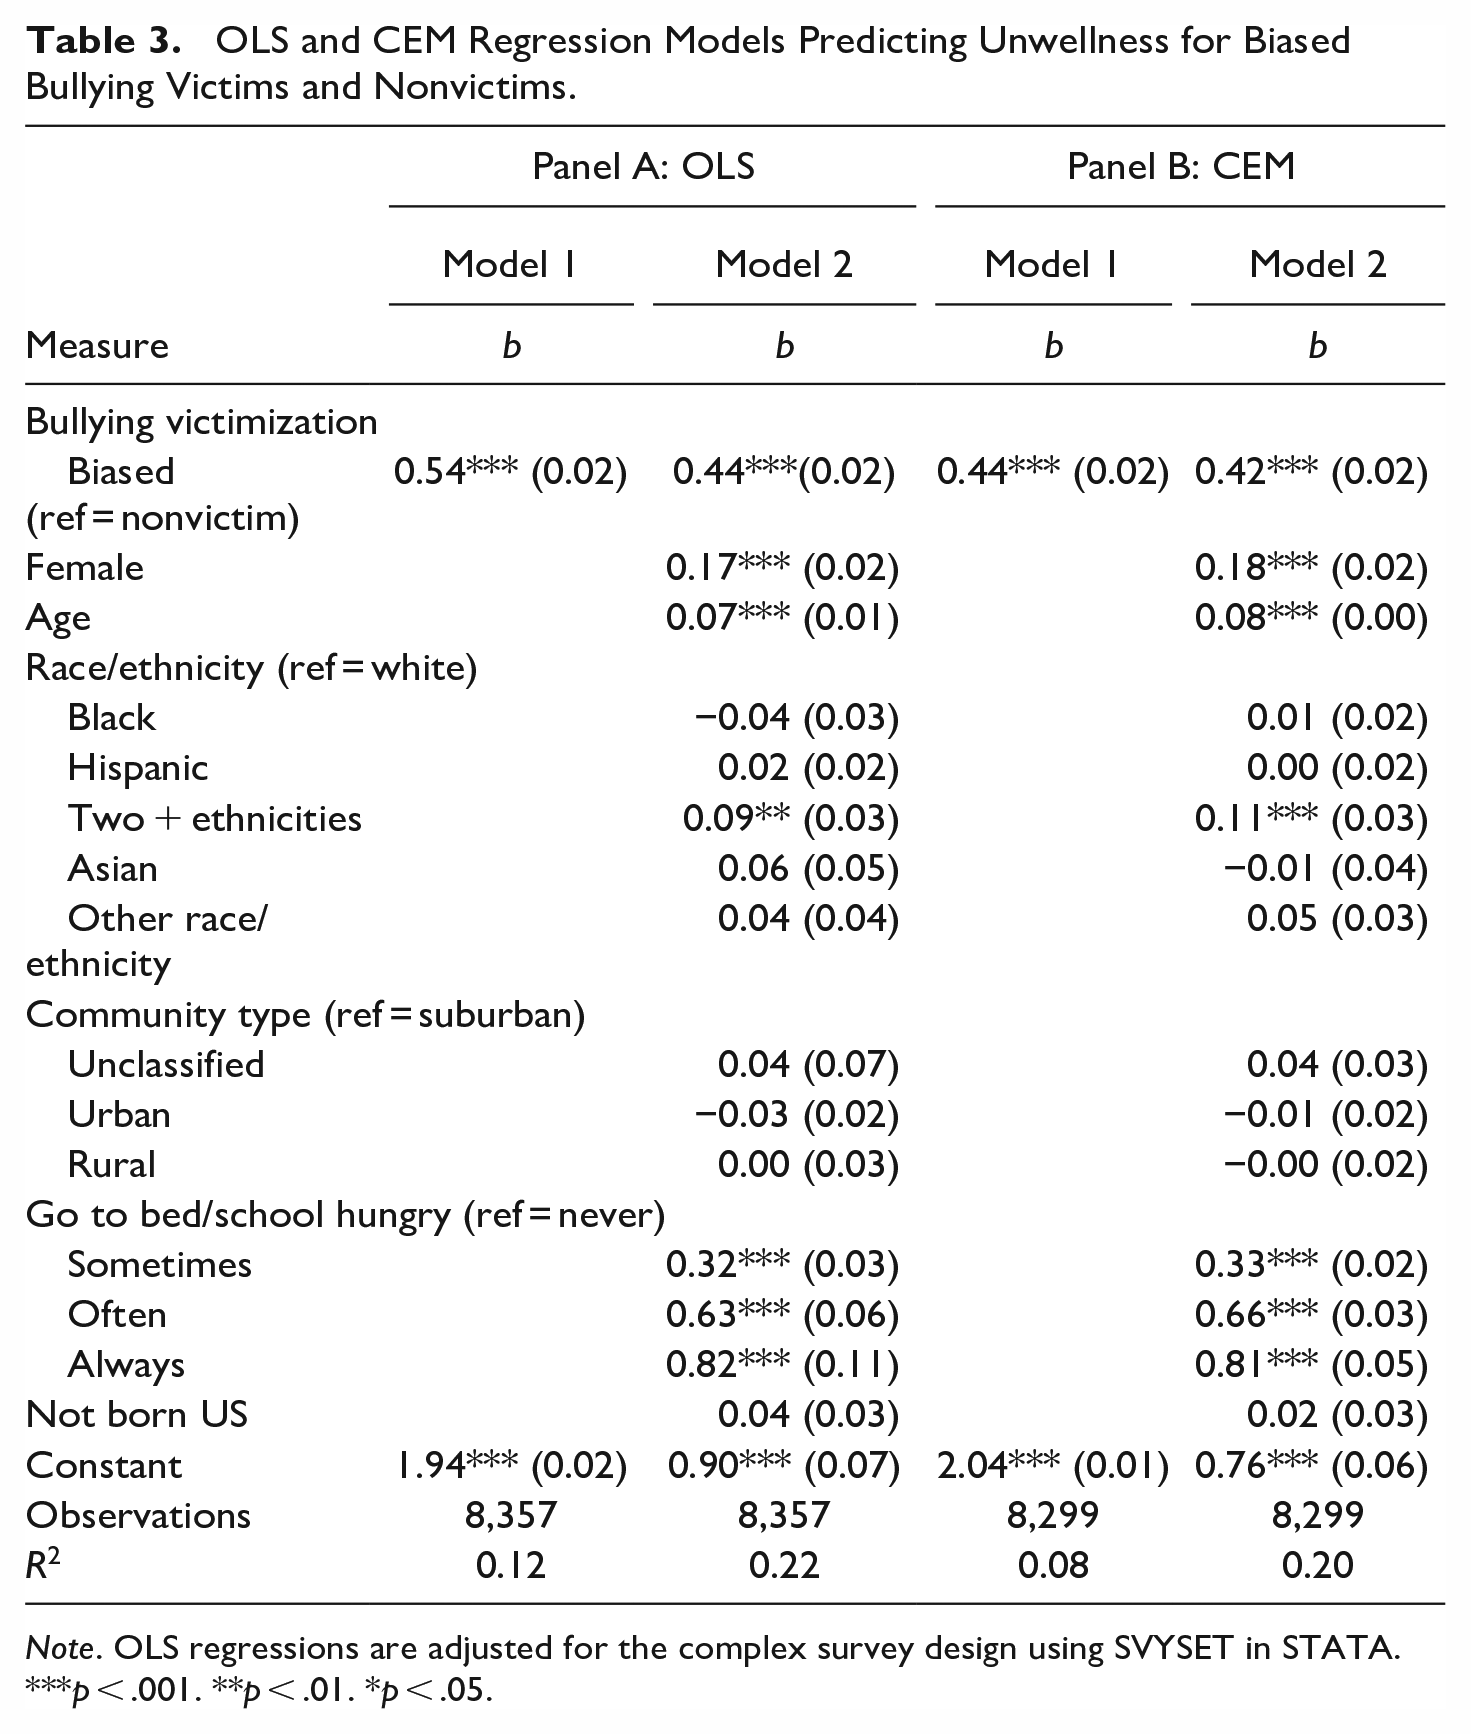
Note. OLS regressions are adjusted for the complex survey design using SVYSET in STATA.
p < .001. **p < .01. *p < .05.
Biased Bullying Victims Versus Nonbiased Bullying Victims Comparison
Next, I compared victims who experienced any biased bullying to victims who experienced only nonbiased bullying. For nonbiased compared to biased bullying victims, the exposure and control groups prior to matching differed on age, being two or more ethnicities, going to bed/school hungry, and not being born in the U.S. (see Table A1 in the Appendix). These differences were effectively reduced to zero after matching, as the multiple unbalanced L1 indicator was reduced from .164 before matching to 5.367E-15 after matching (Table A1). For the second match, 7 students from the control group (nonbiased bullying victims) and 42 from the exposure group (biased bullying victims) were not exactly matched and were dropped from the analysis.
As shown in Table 4, biased bullying victimization was associated with a .28 and .22 increase in unwellness relative to nonbiased bullying victimization in the unadjusted and adjusted OLS unmatched models, respectively (b = .28, p < .001; b = .22, p < .001; see Panel A). The CEM unadjusted model (Panel B Model 1) indicated that biased bullying victimization was associated with a .21 unit increase in unwellness relative to nonbiased victimization not accounting for the uncoarsened covariates (b = .21, p < .001). After adjusting for the uncoarsened covariates (Panel B Model 2), the effect was reduced slightly in magnitude, such that biased victimization was associated with a .19 increase in unwellness relative to nonbiased bullying victimization (b = .19, p < .001). As with the previous set of regressions, being female and each additional year of age were again both positively associated with unwellness, as were all of the non-reference categories of going to bed or school hungry. Overall, these results indicate that, in comparison to both nonvictims and victims of nonbiased bullying, youth who were victims of biased bullying in the past few months experience greater unwellness in the past week, even when students have been exactly matched on the included pre-exposure covariates.
OLS and CEM Regression Models Predicting Unwellness for Biased and Nonbiased Bullying Victims.

Note. OLS regressions are adjusted for the complex survey design using SVYSET in STATA.
p < .001. **p < .01. *p < .05.
Supplementary Analyses
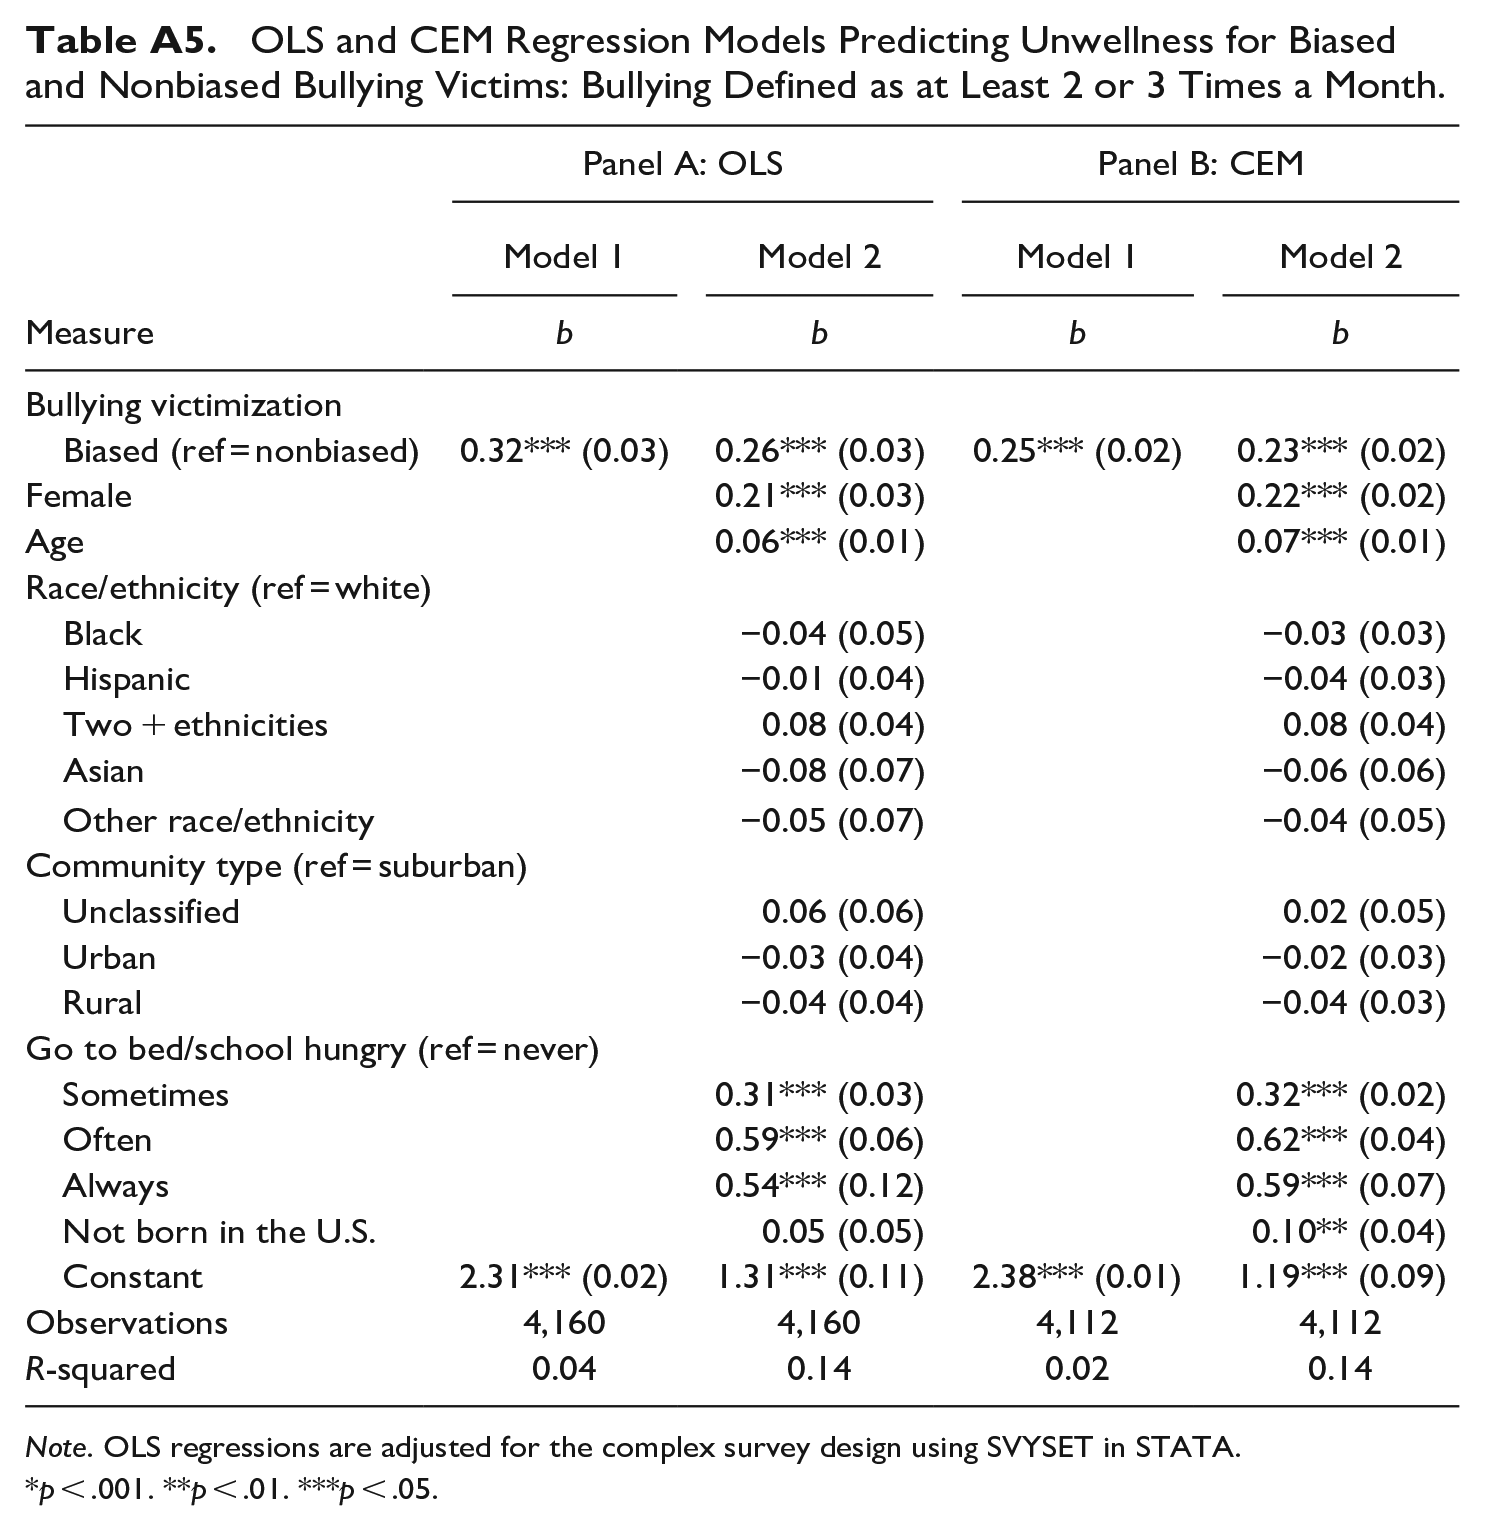
To assess whether removing victims who experienced bullying once or twice in the past couple of months (versus at least twice a month) from the analyses would affect the findings, I re-estimated all models using a measure of bullying victimization that only included students who reported being bullied 2 or 3 times a month or more (see Tables A4 and A5 in the Appendix). The results were similar to the main analyses. Specifically, relative to nonvictims, biased bullying victimization was associated with a .53 and .49 increase in unwellness in these adjusted OLS and CEM models, respectively (b = .53, p < .001; b = .49, p < .001). Relative to nonbiased victims, biased bullying victimization was associated with a .26 and .23 increase in unwellness in the supplementary adjusted OLS and CEM models, respectively (b = .26, p < .001; b = .23, p < .001).
Discussion
This study used nationally representative U.S. data to examine whether experiencing biased bullying victimization in the past couple of months was associated with greater unwellness in the past week than experiencing nonbiased bullying victimization as well as not being victimized by bullying. Extending prior research in this area, I used a matching strategy to maximize similarity across exposure and control groups on pre-treatment covariates and included multiple bias types in the analyses. Several key findings emerged.
First, the results indicated that biased bullying was quite common, as 27% of students in the sample experienced some form of bias as a component of their bullying victimziation. Notably, a similar proportion of students—26%—experienced (only) nonbiased bullying. As general (i.e., nonbiased) bullying is typically considered to be a widespread problem deserving of considerable policy attention, these findings indicate that bias-motivated incidents are also pervasive and ought to receive a similar degree of concern. In addition, nearly all victims who experienced biased bullying also experienced nonbiased bullying (i.e., 3% experienced only biased bullying). As experiencing a greater number of victimization types is associated with greater victim harm than experiencing a fewer number of victimization types (Finkelhor et al., 2007), future research should assess whether the total number of victimization types experienced differs between biased and nonbiased victims.
There is a dearth of research examining biased bullying across multiple bias types in comparison to nonbiased bullying. This gap means that there is not a firm standard against which these prevalence rates can be compared to. For example, Price-Feeney et al. (2018) found that 50% of youth experienced at least one form of bias-based victimization. However, that study did not provide a prevalence rate of nonbiased victimization for comparison. More research assessing the prevalence of biased victimziation (for multiple bias types) relative to nonbiased victimization can speak to the whether the findings of the current study will be replicated.
Being victimized by sexually biased bullying, measured as sexual gestures or comments, was more common than racial and religious bias in these data. This result is not consistent with some prior work on youth, which finds that racial bias is the most common bias type (Utley et al., 2022). However, it does align with other studies (Bayram Özdemir et al., 2016) as well as with theory (Messerschmidt, 1997) which suggests that biased victimization is commonly perpetrated by males to adhere to gendered cultural norms. It is possible that the high prevalence of sexually biased victimization in the current study is attributable to gender, gender identity, and sexual orientation biases being combined, as sexual comments probably captures all of these types of biases absent more specific indicators.
Second, biased bullying victimization was associated with greater unwellness in comparison to both nonvictims and nonbiased bullying victims, even when students were matched on several pre-exposure covariates. These results are in alignment with prior work on adult crime victims, which finds that bias-motivated incidents cause greater harm than nonbiased incidents (McDevitt et al., 2001). Evidently, biased bullying victimization is associated with deleterious mental health impacts for students as well. Moreover, the current analyses did not capture the indirect effects of biased bullying, or the in terrorem effects (Weinstein, 1992) of these incidents on non-victims who share the victim’s social characteristics (Iganski, 2001). Consequently, the harms of biased victimization reported here, while substantial and important in and of themselves, are likely underestimates of the total damage inflicted by biased victimization. In short, the results imply that biased victimization substantially compromises health and wellbeing among school-aged youth.
Third, although the analyses on the matched sample resulted in estimates that were smaller in magnitude than those from the unmatched sample, all estimates of the effects of biased bullying on unwellness remained statistically significant and substantively large using the matched data. For example, relative to no victimization, biased victimization was associated with a .44 increase in unwellness on a scale of 1 to 5, indicating that the student scored higher on the unwellness scale in the past week when they had this experience any time in the past few months. The only predictor variable in the models that had a larger impact on unwellness than biased victimization was going to bed and/or school hungry often or always (but not sometimes), which indicates severe lack of basic resources in the home. These findings suggest that, even though youth who are victimized by biased bullying differ from students who are not victimized by biased bullying in ways that might affect their unwellness, the impacts of biased bullying on unwellness are not confounded by these differences.
Taken together, these findings imply that more programming resources should be devoted to understanding, reducing, and preventing biased bullying in schools. As many anti-bullying initiatives currently do not focus on stigma (Earnshaw et al., 2018), programs should place greater emphasis on specifically targeting biased or discriminatory victimization. General anti-bullying solutions that do not address prejudice may not be sufficient, particularly for youth belonging to minoritized groups, who are the most likely to experience biased victimization and harassment (Bucchianeri et al., 2013). Failing to do so could magnify achievement gaps through damage to students’ wellbeing at school, which likely affects academic performance.
As the current study found that biased victimization generally—which included bias against race or color, religion, and sexual orientation/gender—related to greater unwellness than nonbiased victimization, school trainings should emphasize that biased victimization is harmful in all its forms. Teachers and other school personnel may believe that certain forms of biased bullying—such as sexual teasing—is expected in adolescence, and therefore be hesitant to step in. In fact, studies show that sexual and gender minority youth report that their teachers often do not intervene when they experience peer harassment (Berger et al., 2019), and this is probably the case for other types of biased victims as well. In light of criminological research which finds that hate crime victims are less likely than other victims to report the incident to the police (Lantz et al., 2022; Powers et al., 2020), it is possible that many students who experience biased victimization also do not report the incident to authorities. School personnel should be made aware of the prevalence, characteristics, and harms of biased bullying so that they can recognize it and intervene, even when the incident is not reported by the victim.
Other promising intervention strategies involve focusing on students. For example, the bystander student intervention (“STAC”) program, which was specifically designed to reduce ethnic bullying, teaches students how to intervene in incidents through role-playing exercises (Midgett et al., 2015). Other interventions draw from social cognitive theory (Tajfel et al., 1971) and intergroup contact theory (Allport, 1954) and aim to promote positive intergroup interactions, albeit with limited success (Zambuto et al., 2022). Although such programs are still building a strong evidence base, the findings of this study suggest that their implementation is an important step towards promoting a positive school experience for all students.
Strengths and Limitations
A strength of the current study is that the exposure (bullying) likely occurred before the outcome (wellbeing) due to the measurement strategy, so the common issue of time-ordering in cross-sectional was at least partially addressed. The matching strategy allowed for assessment of wellbeing for groups of students who were similar aside from their bullying experiences, which increases confidence in the estimates. Even so, matching strategies only account for measured confounding, so unmeasured confounding remains possible. For instance, it is possible that victims of biased victimization are also more likely than other students to experience discrimination by adults outside of school, which might affect wellbeing. Another strength is that these data are nationally representative and therefore have high generalizability in the U.S.
While this study contributes to the literature on school-based victimization in several ways, there are some limitations that should be taken into consideration. First, due to limitations of the data, only a few bias types were measured in this study (race/color, religion, sexual). It would be preferable in future studies to examine forms of sexual orientation and gender based bullying victimization separately, which may require over-sampling of certain groups to obtain reliable statistical estimates (e.g., transgender individuals). Second, this study did not explore the role of intersectionality, and I was unable to assess how experiencing biased victimization related to multiple minoritized identities may impact unwellness. Given that experiencing multiple forms of biased victimization may lead to greater impacts than one form (Mulvey et al., 2018), future research should consider co-occurrence of biased victimization within individuals.
Third, these data were self-reported, and it is possible that there was (intentional or unintentional) under or over reporting of biased victimization, particularly because biased victimization may invoke feelings of shame among some victims. Finally, it is possible that differences in school-level responses to biased victimization (e.g., reporting policies) influenced the findings of this study. However, the models were each re-estimated with school fixed effects (i.e., using dummy indicator variables for each school). The results did not differ meaningfully from the main results (available by request).
Conclusion
The results of the current study suggest that biased bullying is a serious public health concern because these victims have lower wellbeing than similar peers who have experienced only nonbiased bullying or no bullying. Resources should be directed towards biased bullying victims, and trainings for child-serving professionals in the school context should be informative about the prevalence of biased bullying and the different types of biased bullying being perpetrated in schools.
Footnotes
Appendix
OLS and CEM Regression Models Predicting Unwellness for Biased and Nonbiased Bullying Victims: Bullying Defined as at Least 2 or 3 Times a Month.
| Panel A: OLS | Panel B: CEM | |||
|---|---|---|---|---|
| Model 1 | Model 2 | Model 1 | Model 2 | |
| Measure | b | b | b | b |
| Bullying victimization | ||||
| Biased (ref = nonbiased) | 0.32*** (0.03) | 0.26*** (0.03) | 0.25*** (0.02) | 0.23*** (0.02) |
| Female | 0.21*** (0.03) | 0.22*** (0.02) | ||
| Age | 0.06*** (0.01) | 0.07*** (0.01) | ||
| Race/ethnicity (ref = white) | ||||
| Black | −0.04 (0.05) | −0.03 (0.03) | ||
| Hispanic | −0.01 (0.04) | −0.04 (0.03) | ||
| Two + ethnicities | 0.08 (0.04) | 0.08 (0.04) | ||
| Asian | −0.08 (0.07) | −0.06 (0.06) | ||
| Other race/ethnicity | −0.05 (0.07) | −0.04 (0.05) | ||
| Community type (ref = suburban) | ||||
| Unclassified | 0.06 (0.06) | 0.02 (0.05) | ||
| Urban | −0.03 (0.04) | −0.02 (0.03) | ||
| Rural | −0.04 (0.04) | −0.04 (0.03) | ||
| Go to bed/school hungry (ref = never) | ||||
| Sometimes | 0.31*** (0.03) | 0.32*** (0.02) | ||
| Often | 0.59*** (0.06) | 0.62*** (0.04) | ||
| Always | 0.54*** (0.12) | 0.59*** (0.07) | ||
| Not born in the U.S. | 0.05 (0.05) | 0.10** (0.04) | ||
| Constant | 2.31*** (0.02) | 1.31*** (0.11) | 2.38*** (0.01) | 1.19*** (0.09) |
| Observations | 4,160 | 4,160 | 4,112 | 4,112 |
| R-squared | 0.04 | 0.14 | 0.02 | 0.14 |
Note. OLS regressions are adjusted for the complex survey design using SVYSET in STATA.
p < .001. **p < .01. ***p < .05.
Declaration of Conflicting Interests
The author declared no potential conflicts of interest with respect to the research, authorship, and/or publication of this article.
Funding
The author received no financial support for the research, authorship, and/or publication of this article.