
Abstract
Correctional authorities require accurate, unbiased, and interpretable tools to predict individuals’ chances of recidivating if released into the community. However, existing prediction models have serious limitations meeting these requirements. We overcome these limitations by applying an established medical diagnostic approach: a relaxed naïve Bayes classifier. Using logistic regression in the form of a naïve Bayes classifier, we estimate the weights of observed features of offenders on recidivism. We apply these weights in a relaxed naïve Bayes classifier to predict the probability of recidivism. Results show that acquired features are stronger predictors of recidivism than innate features. Relaxed naïve Bayes classifier produces far less racial disparity than most alternatives. Critically, it is easier for users to interpret than its alternatives.
Keywords
Introduction
Fairness and efficiency require correctional authorities to make forecasts about previously convicted people’s (say offenders’) likelihoods of committing more crimes if they are released into the community (Lowenkamp & Latessa, 2005). Researchers have tested a variety of methods, including Bayesian analyses (de la Cruz et al., 2021; Mokros et al., 2010), regression analyses (Berk, 2017; Duwe & Freske, 2012; Flores et al., 2017; Tollenaar & Van der Heijden, 2013), and machine learning algorithms (Mohler & Porter, 2021; Ritter, 2013). All methods attempt to predict who will reoffend based on offenders’ characteristics and the characteristics of their criminal involvement. We will call these “observed features” of an offender since these characteristics were set before the predictions are made. Bayesian analyses show limited predictive performance, probably because the method begins by assuming that all observed features are conditionally independent and have unweighted contributions on an offender’s future behavior (Bennett, 2000; Lee et al., 2011). Regression analysis does not make this assumption, but still performs poorly. It allows observed features to have differentiated weights predicting the outcome, but naïvely assumes a linear relationship between observed features and offenders’ future behavior (Duwe & Kim, 2017). Recently, social scientists introduced a buffet of machine learning algorithms that may improve forecasting recidivism (Mohler & Porter, 2021). However, it is difficult to peer into machine learning algorithms to determine how they make predictions. This lack of interpretability hides biases that machine learning algorithms may catch from the data used to train them.
Our research describes a method designed to increase accurate predictions, reduce bias, and provide interpretability. This method—which we call “relaxed naïve Bayes” classification—does not claim that all observed features are unweighted. It was originally proposed by Spiegelhalter and Knill-Jones (1984) and has been used in medical diagnostics and prognostics for over 30
We begin by providing a brief introduction to the use of Bayes theorem in making forecasts. Then we turn to a method for relaxing the Bayes theorem by weighting all observed features differently in the forecasts. Over the course of several sections, we describe how we applied relaxed naïve Bayes classification to a correctional data set, and our findings. Then we compare these findings to results from alternative forecasting models. Of particular importance is our ability to look under the hood of our classifier to determine what features are most important for classifying a person as a likely recidivist. By making the classification interpretable, the relaxed naïve Bayes classifier helps to avoid a problem that can occur with machine learning algorithms: overconfidence based on ignorance of how the algorithm decides (Rudin, 2019; Seymour, 1988). Compared with existing recidivism forecasting methods, our method is sufficiently accurate, easy to apply and adjust, and reasonably interpretable based on crime theories.
Bayesian Analysis
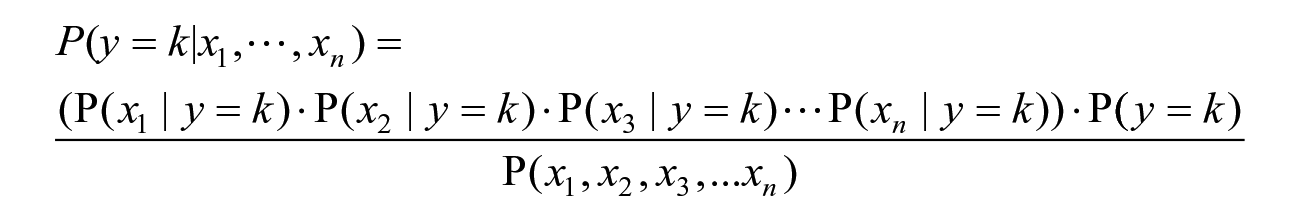
It is often of interest to predict to which of a number of categories an individual belongs from information about features observed on the individual. This can be done by considering the probability of being in each category k conditioned on (or given) the observed feature information. By Bayesian theorem, this is found from the probability distribution of the features given category k and the probability of category k before any feature information is observed. It is very difficult to specify the probability distribution of all the features given the category k, as this is complicated multivariate distribution (Rubin, 1984). To simplify this distribution, it is assumed that the features are independent given k. This means that univariate—rather than multivariate—distribution have to be satisfied. Applying this assumption is called naïve Bayesian analysis, or classification. Naïve Bayes makes the analyst’s job easier because she does not have to specify conditional probability distribution for all features together. She assumes that all features are conditionally independent (Lewis, 1998) and unweighted in the forecasts. Though this independence assumption is unrealistic, analysts find it useful when predicting categories. Examples include predicting spam mail through text classification (Zhang & Gao, 2011), classifying new articles into appropriate sections (Suleymanov et al., 2018), and recognizing faces (Cohen et al., 2003). If this independence assumption could be relaxed, however, analysts may be able to improve their predictions.
Besides this independence assumption, researchers attempted to relax (or weight) the unweighted features in Bayes analysis by applying weights on the observed features. Kernel Density Estimation, for example, is the one that employs Gaussian distribution to impose weights on the observed features (Xiang et al., 2016). Information theorists use entropy to calculate differentiated weights of observed features to predict the outcome variable (Lee et al., 2011). Though these approaches twist unweighted contributions of observed features in the Bayes theorem, they also show that conventional naïve Bayes can be improved if certain weights are applied to these features.
Bayes Theorem
Bayes theorem is a mathematical formula for calculating conditional probabilities through reversing the order of conditioning. Conditional probability is a measure of the probability of an event occurring given another event has occurred (Bayes, 1763). If we are trying to predict a future event, y, based on an observed event, x, we can proceed as follows.

where, P(y|x) is a posterior probability of y occurring given that x has happened. To calculate this probability, we need to know the probability P(x|y) that x happens given that y happens, the probability P(y) of y on its own without knowledge of x, and the probability P(x) of
In real-world problems, we have multiple features:
Naïve Bayes and Limitations
Consider a case where there are multiple features
where k is either Yes or No. For all values of k, the denominator is constant. Therefore, we can remove the denominator and proportionality can be introduced as follows.

Since we have only two possible outcomes for y (Yes (recidivism) or No (non-recidivism)), we can determine the category (y) of an offender (j) given
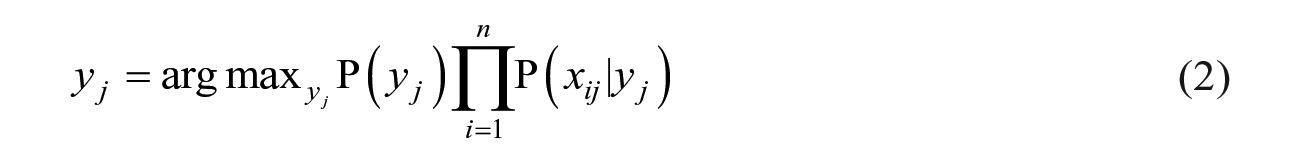
This is the naïve Bayes classifier.
If P(
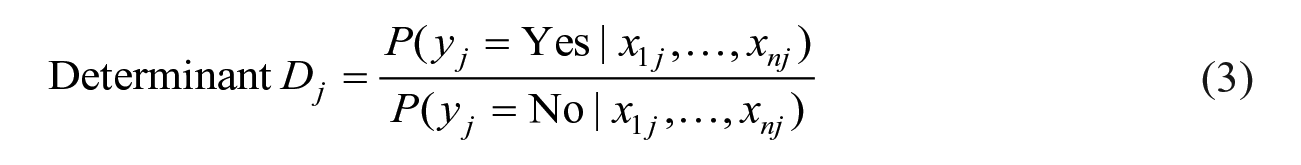
The determinant (
Relaxed Naïve Bayes
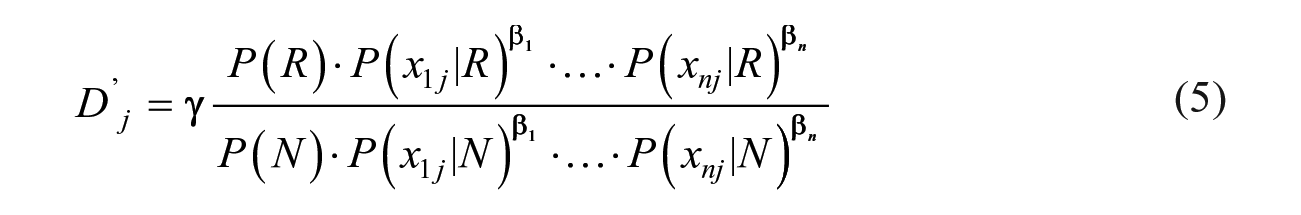
Following the Spiegelhalter and Knill-Jones’ method (1984) of deriving weights of observed features, we first dissect the components of both numerator and denominator and rewrite the
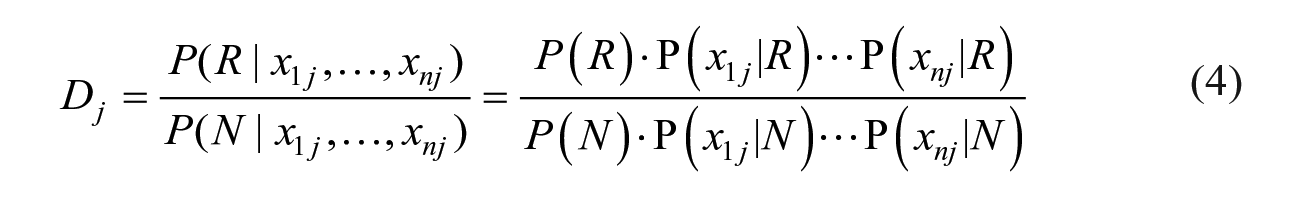
where R stands for recidivism, and N stands for non-recidivism. Instead of leaving all features unweighted to an outcome, we will impose weights. There are two reasons why relaxing (or weighting) the features is necessary. First, the unweighted contribution conflicts with the fact that most real-life features have varying contributions to any outcome. Though it is impossible to know, for any specific individual, the weights of each feature, it is possible to estimate the average weights of these features for all the individuals in a sample. Second, Zhang and Sheng (2004) provide evidence that weighting features increased the influence of highly predictive features and discounts other features that have little predictive value. To estimate the weights, we re-write the relaxed version
In the relaxed version
We can transform
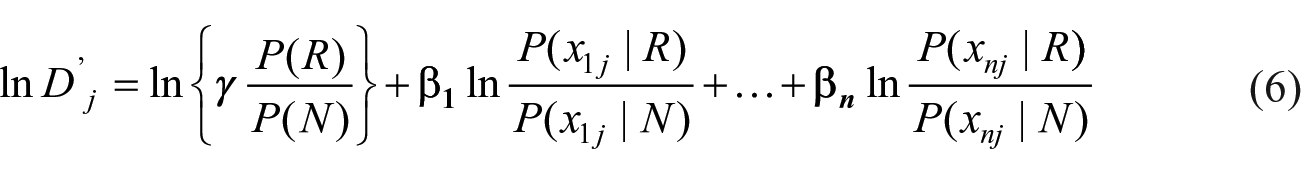
Since the observed outcome
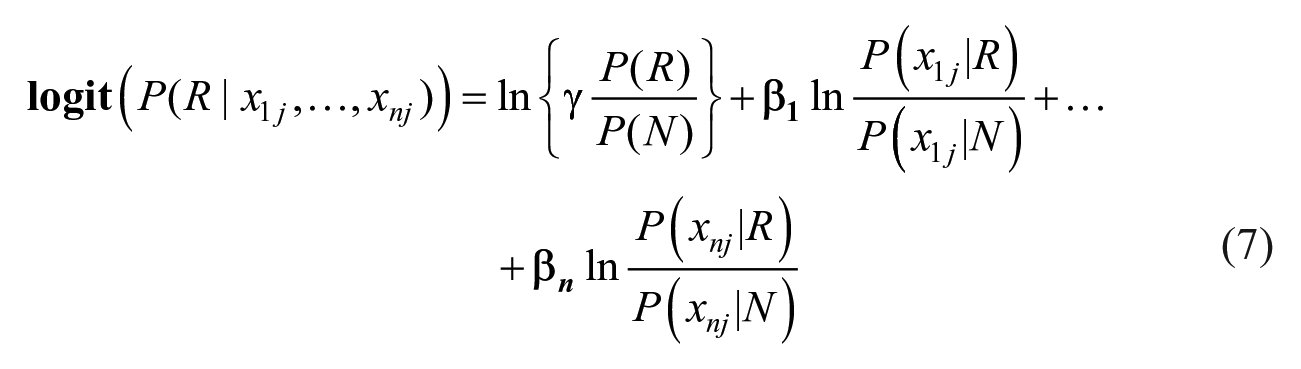
Since every probability on the right-hand side of equation (7) is known based on the training data, we can substitute
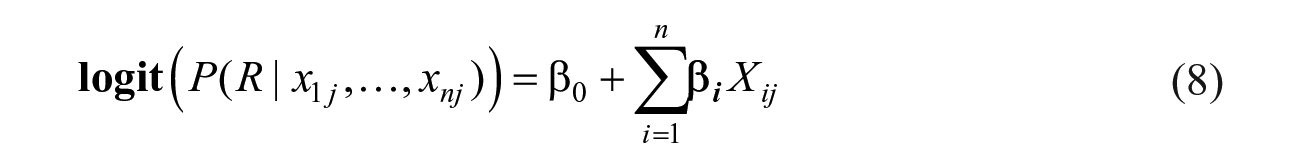
Since every observed feature,
To summarize, relaxed naïve Bayes classification does three things. First, it allows variation among the weights rather than leaving all observed features unweighted in the forecasts. Second, in the form of relaxed naïve Bayes classifier, the logistic regression accounts for correlation/covariation that relaxes the conditional independence assumption among the features in the conventional naïve Bayes classifier. Finally, it produces the probability that an offender will recidivate given his or her observed features.
Methods
Data
To validate whether the relaxed naïve Bayes predicts offender recidivism appropriately, we use the data set sponsored by the National Institute of Justice (NIJ) and prepared for their national competition, the NIJ Recidivism Forecasting Challenge. The data set comes from the state of Georgia and contains information describing various features of offenders paroled from Georgia prisons between January 1, 2013, and December 31, 2015. Offender description data include both demographic features such as gender, race, and education, and offense history. These data contain offenders’ residential areas, following prison release, described by the U.S. Census Bureau Public Use Microdata Area (PUMA) code. The data set also provides information of whether the offender was arrested for a new felony or misdemeanor in the first year of release: a measure of recidivism. Table 1 lists the variables we used and how we coded them. 3
Coding Schema.
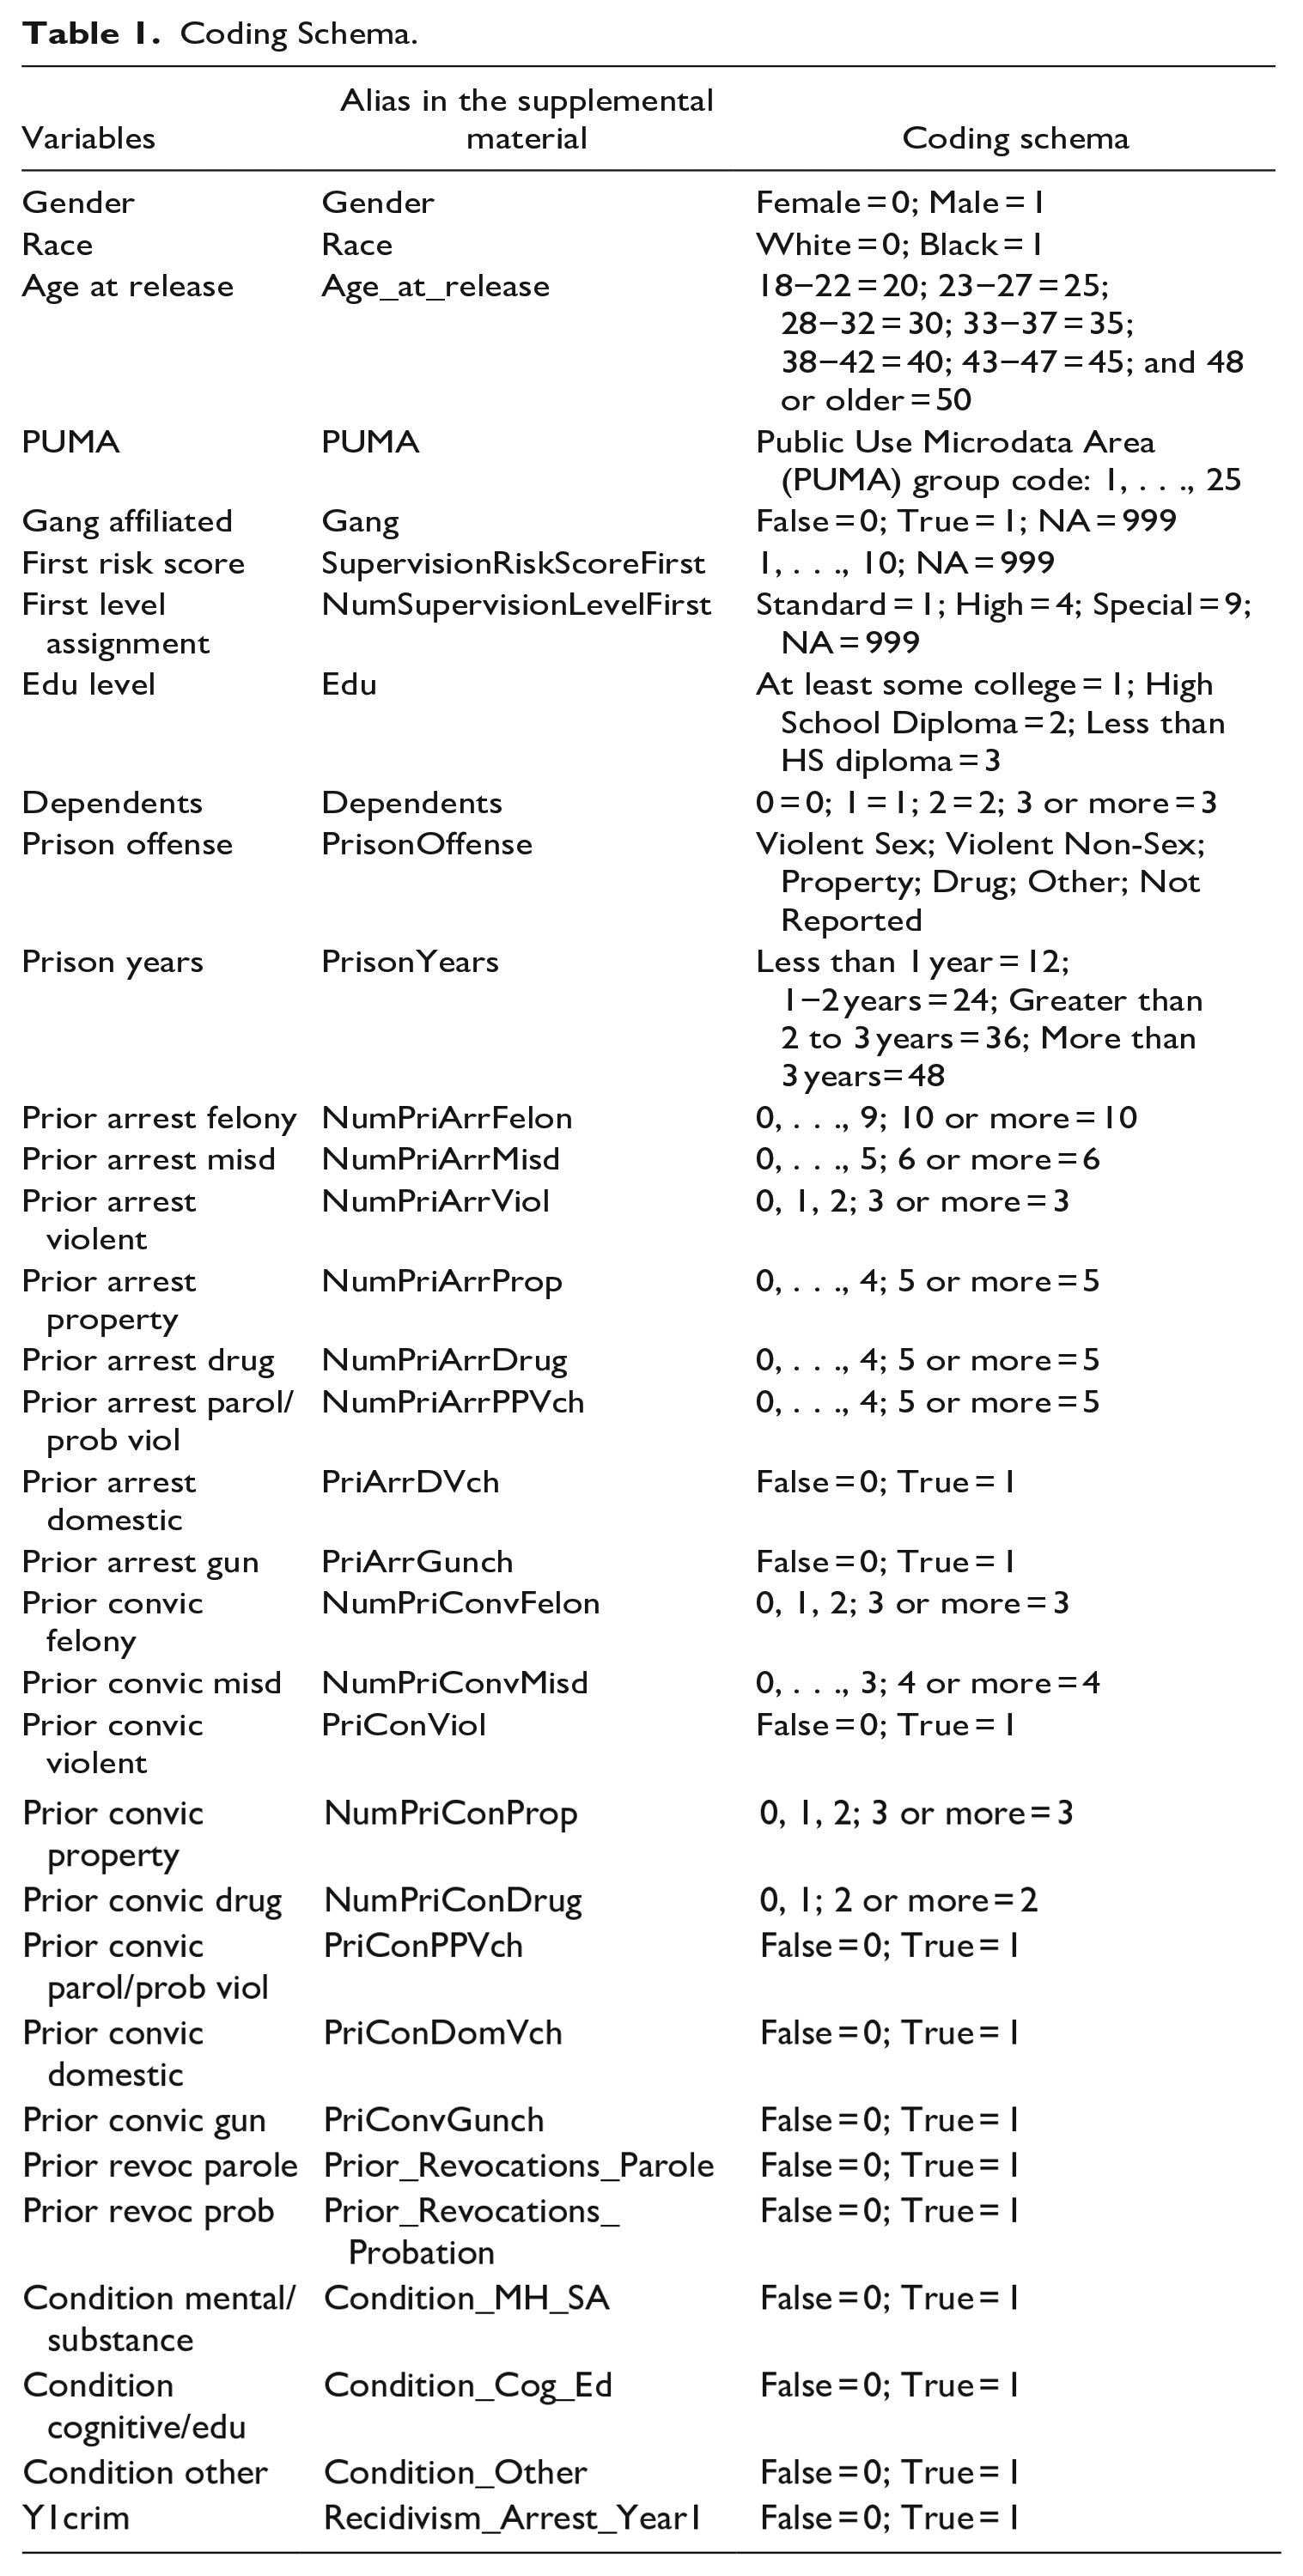
NIJ randomly partitioned the Georgia data set into two parts. The first part contains 70% of the offenders with their first-year recidivism results. This is the training set we used to estimate the weights of observed features in equation (8). In the training set, we use Microsoft Excel to calculate the conditional probability of every observed feature of naïve Bayes classifier in the determinant (
Forecasting Performance Metrics
To measure the forecasting performance of our method, we use a general accuracy metric along with two evaluation metrics suggested by NIJ. First, we employ a general accuracy metric (ACC) to measure the proportion of correct predictions (for both true positives and true negatives) among the total number of cases examined. To calculate all components of ACC, we use the 0.5 threshold to convert the predicted probability of recidivism to a binary outcome. We employ ACC since forecasting non-recidivating offenders is equally important to forecasting recidivating offenders. 5

where TP = True positive; FP = False positive; TN = True negative; FN = False negative.
Second, we use the Brier Score (BS) to measure the accuracy of forecasting. BS is simply a mean squared error between the forecasted probability of recidivism and the actual outcome for every individual offender. BS can be expressed as follows.

where
The third metric is the Fairness and Accuracy (FA) measure that takes into account both racial bias and forecasting accuracy simultaneously. Two components make up the FA metric: Fairness Penalty (FP) and the Brier Score. The Fairness Penalty examines the rates at which Black and White parolees are falsely predicted to recidivate, the false positive rates. A completely fair prediction model will show no difference between Black and White false positive rates. To calculate the false positive rates, we use a 0.5 threshold to convert the predicted probabilities of recidivism to binary outcomes: posterior probability greater than 0.5 means recidivism or 1, otherwise non-recidivism or 0. The fairness penalty is one minus the absolute difference between the Black and White false positive rates. So if the two false positive rates are identical (the best case), then FP = 0: no penalty. Tiny differences in these rates create small penalties, and big difference create large penalties.

The Fairness Penalty penalizes the Brier score. The Fairness and Accuracy (FA) score combines the FP with the Brier Score. If FP is zero (best case) then the FA is based only on the Brier Score’s measure of accuracy. But imagine if the false positive rate for Blacks were 0.8 and for Whites it was zero. Then the absolute value of the difference would be 0.8 and the FP score would be 0.2. This would drive down the FA score. Therefore, maximizing the FA score is preferred for accurate forecasting with minimum racial bias.

Results
Estimating Weights of Observed Features
Based on the year
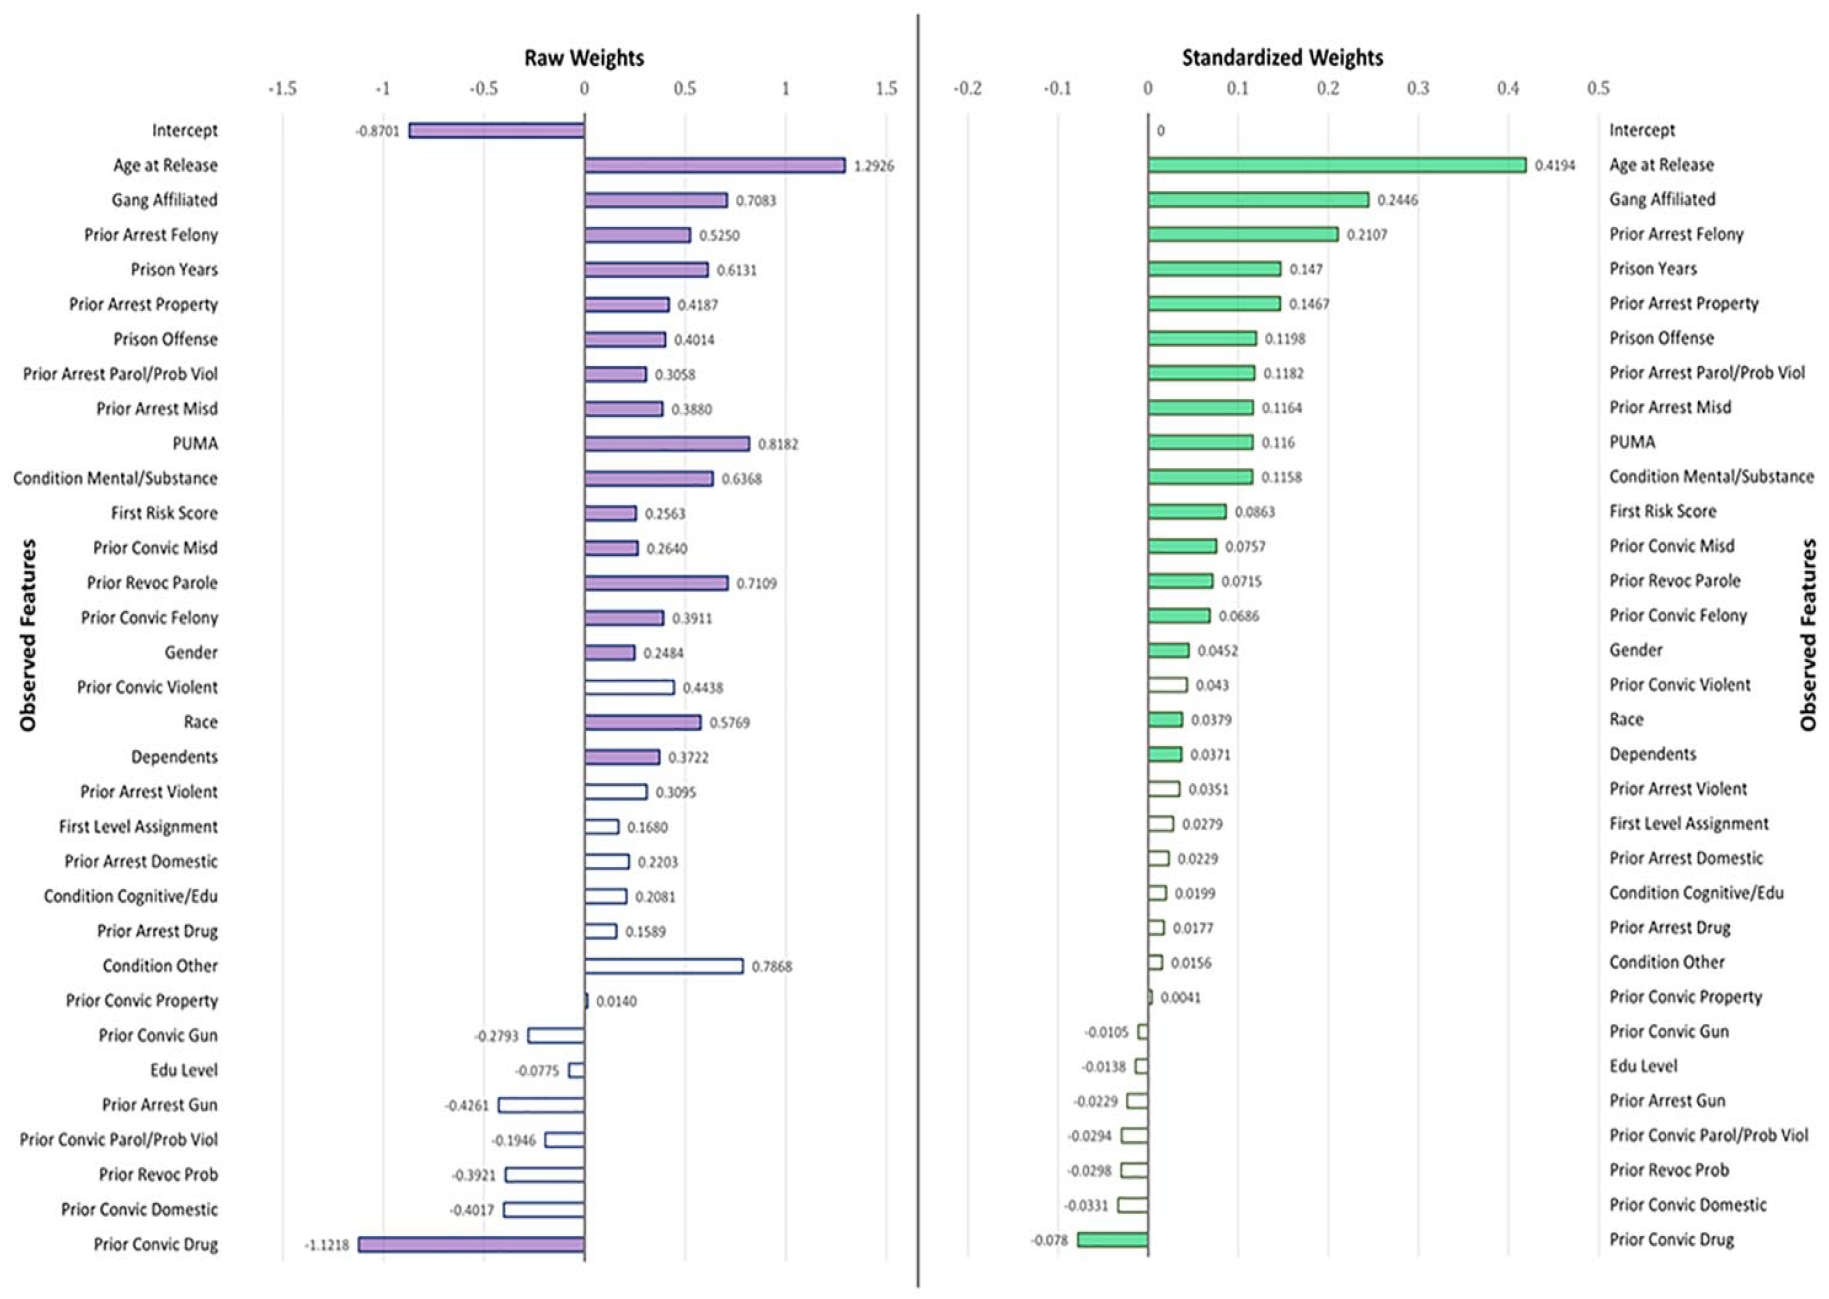
Estimated weights of observed features in forecasting offender recidivism.
To allow standardized comparisons among these features, we provide standardized weights of observed features next to the raw coefficient estimates in Figure 1. We standardized the raw weights of observed features but not the outcome since it is already a binary variable. When we look at the bright-green bars in Figure 1, age at release, gang affiliation, number of prior arrests by felony, years stayed at the prison, and the number of prior arrests due to property crime are the top five predictors of recidivism. These results are not surprising since previous studies of offender risk assessment and recidivism forecasting emphasized that these features are substantively related to the risk of offenders (Latessa & Lovins, 2010; Sjöstedt & Grann, 2002). The weight of PUMA, ranked at ninth position among the standardized weights, implying where offenders reside is a substantive predictor of recidivism. This is consistent with community crime literature emphasizing the role of environmental injustice and varying opportunities of crime across places (Chamberlain & Wallace, 2016; Hipp et al., 2010; Kubrin & Stewart, 2006). Race and gender are also found significant features, consistent with findings in the previous literature (Piquero et al., 2015). However, the magnitudes of standardized coefficients of race (0.0379) and gender (0.0452) reveal that their contributions to recidivism are weak to trivial. This hints at the possibility that, even if race and gender are found significant contributors, innate features of offenders are not the major contributors to future recidivism. Rather, acquired features of an offender such as age at release from the prison (0.4194), gang affiliation (0.2446), and prior arrests due to felony (0.2107) are stronger contributors to recidivism.
Forecasting Performance
Using the estimated coefficients based on the training data, we fit betas in our relaxed naïve Bayes in equation (8) and calculate each offender’s probability of recidivism in the test data.
6
Table 2 summarizes the performance of our relaxed naïve Bayes method. Specifically, the average Brier Score of the relaxed naïve Bayes is 0.152: 0.104 for female offenders and 0.159 for male offenders in the test data. We use the results posted on the NIJ leaderboard as a benchmark to evaluate how satisfactorily our method performed relative to other methods using the same data.
7
For year
Summary of Forecasting Performance.
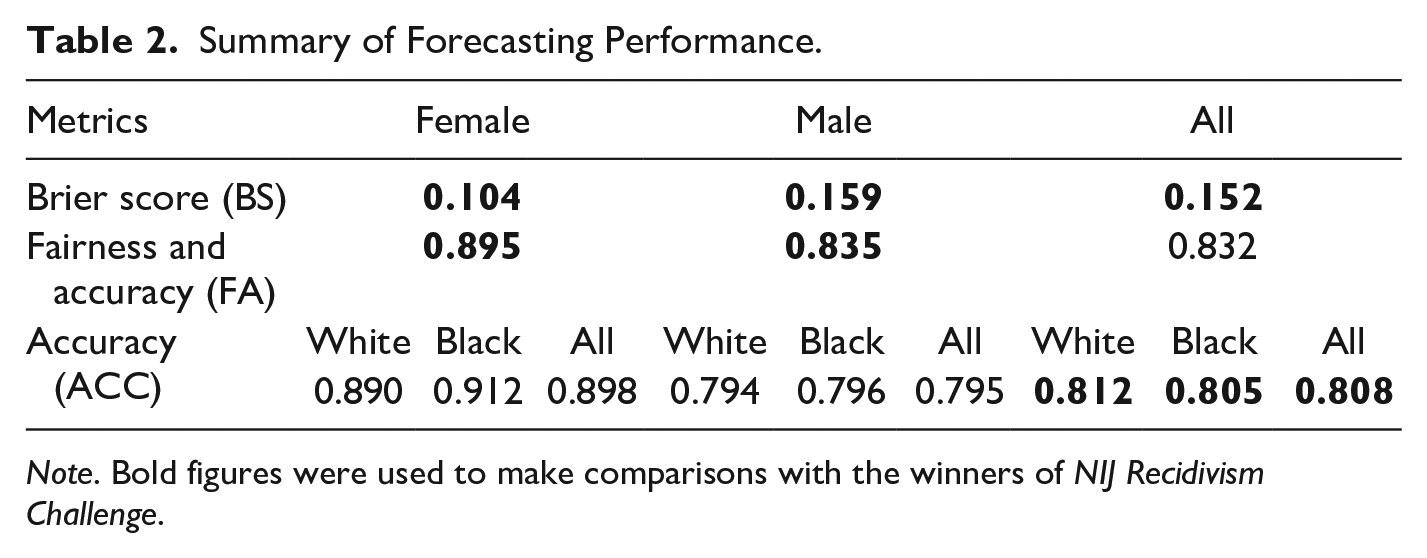
Note. Bold figures were used to make comparisons with the winners of NIJ Recidivism Challenge.
Comparison With Other Methods
There are several existing forecasting methods researchers can apply to recidivism. These include supervised machine learning models such as conventional naïve Bayes, AdaBoost method, logistic regression, multilayer perceptron, and random forest. We choose these methods for comparison because machine learning software offer these methods as default classifiers for forecasting purpose.
First, the conventional naïve Bayes classifier uses a traditional assumption of Bayes theorem in machine learning: all observed features are assumed conditionally independent and unweighted to the posterior probability (see John & Langley, 1995). Therefore, a cross-comparison of our relaxed naïve Bayes with conventional naïve Bayes allows us to evaluate how much improvement the relaxed naïve Bayes could achieve relative to conventional naïve Bayes. Second, AdaBoost (or Boost) is an ensemble machine learning algorithm for classification problems that implements a boosting algorithm. A major benefit of AdaBoost is the ability to combine multiple weak classifiers into one strong classifier in order to improve forecasting accuracy (see Freund & Schapire, 1996; Seymour et al., 1990). Third, the multilayer perceptron is a classifier that learns multilayer neural network using backward propagation, which is also known as an AI algorithm (see Frank et al., 2010). Similar to the human brain, a multilayer perceptron is composed of interconnected neurons that transfer information to each other. There are three major layers in the neural network: input, hidden, and outcome. It is necessary for the neural network to have at least one hidden layer which performs computations and operations on the input data. Therefore, the hidden layer determines both the processing speed and the efficiency of the model’s prediction. In order to make the multilayer perceptron model’s learning process faster and reasonably efficient in forecasting recidivism, we keep the total number of nodes and hidden layers not to exceed the number of input attributes (Cybenko, 1989; Hinton et al., 2006; Hornik, 1991). Specifically, we use 32 input variables, with 13-7-5-3 nodes within four hidden layers, and two outcomes (recidivate or not). Fourth, logistic regression is a binary classification method that learns coefficients for each input toward an outcome in machine learning. Specifically, input variables are combined linearly into a regression function and then transformed using a logistic function (see Cessie & van Houwelingen, 1992). Though logistic regression shares the same functional form as naïve Bayes, logistic regression makes a prediction for the probability using a direct functional form whereas naive Bayes figures out how the data was generated given the results. Further, compared with naïve Bayes, fitting logistic regression models and predicting with logistic regression models is more complicated when some features are missing; there is no standard, optimal way for handling missing values with logistic regression and this makes it rather complex. However, regarding naïve Bayes including our relaxed naïve Bayes classifier, missing values are not a problem at all. Let’s say there are two features per observation,
We use the WEKA machine learning software to train the machine learning program using each of these methods. For selecting the best model without overfitting, we applied 20 folds cross-validation of training data based on the conventional naïve Bayes classifier, logistic regression, AdaBoost method, multilayer perceptron, and random forest, respectively. We then use our test data to predict offender recidivism using each trained algorithm. 8 In Table 3, we show all results for each performance measure on the test data. Superscripts above bold figures in Table 3 shows either the first- or second-best performing models based on the same evaluation criteria. 9
Performance Comparison Between Relaxed Naïve Bayes and Other Forecasting Methods.
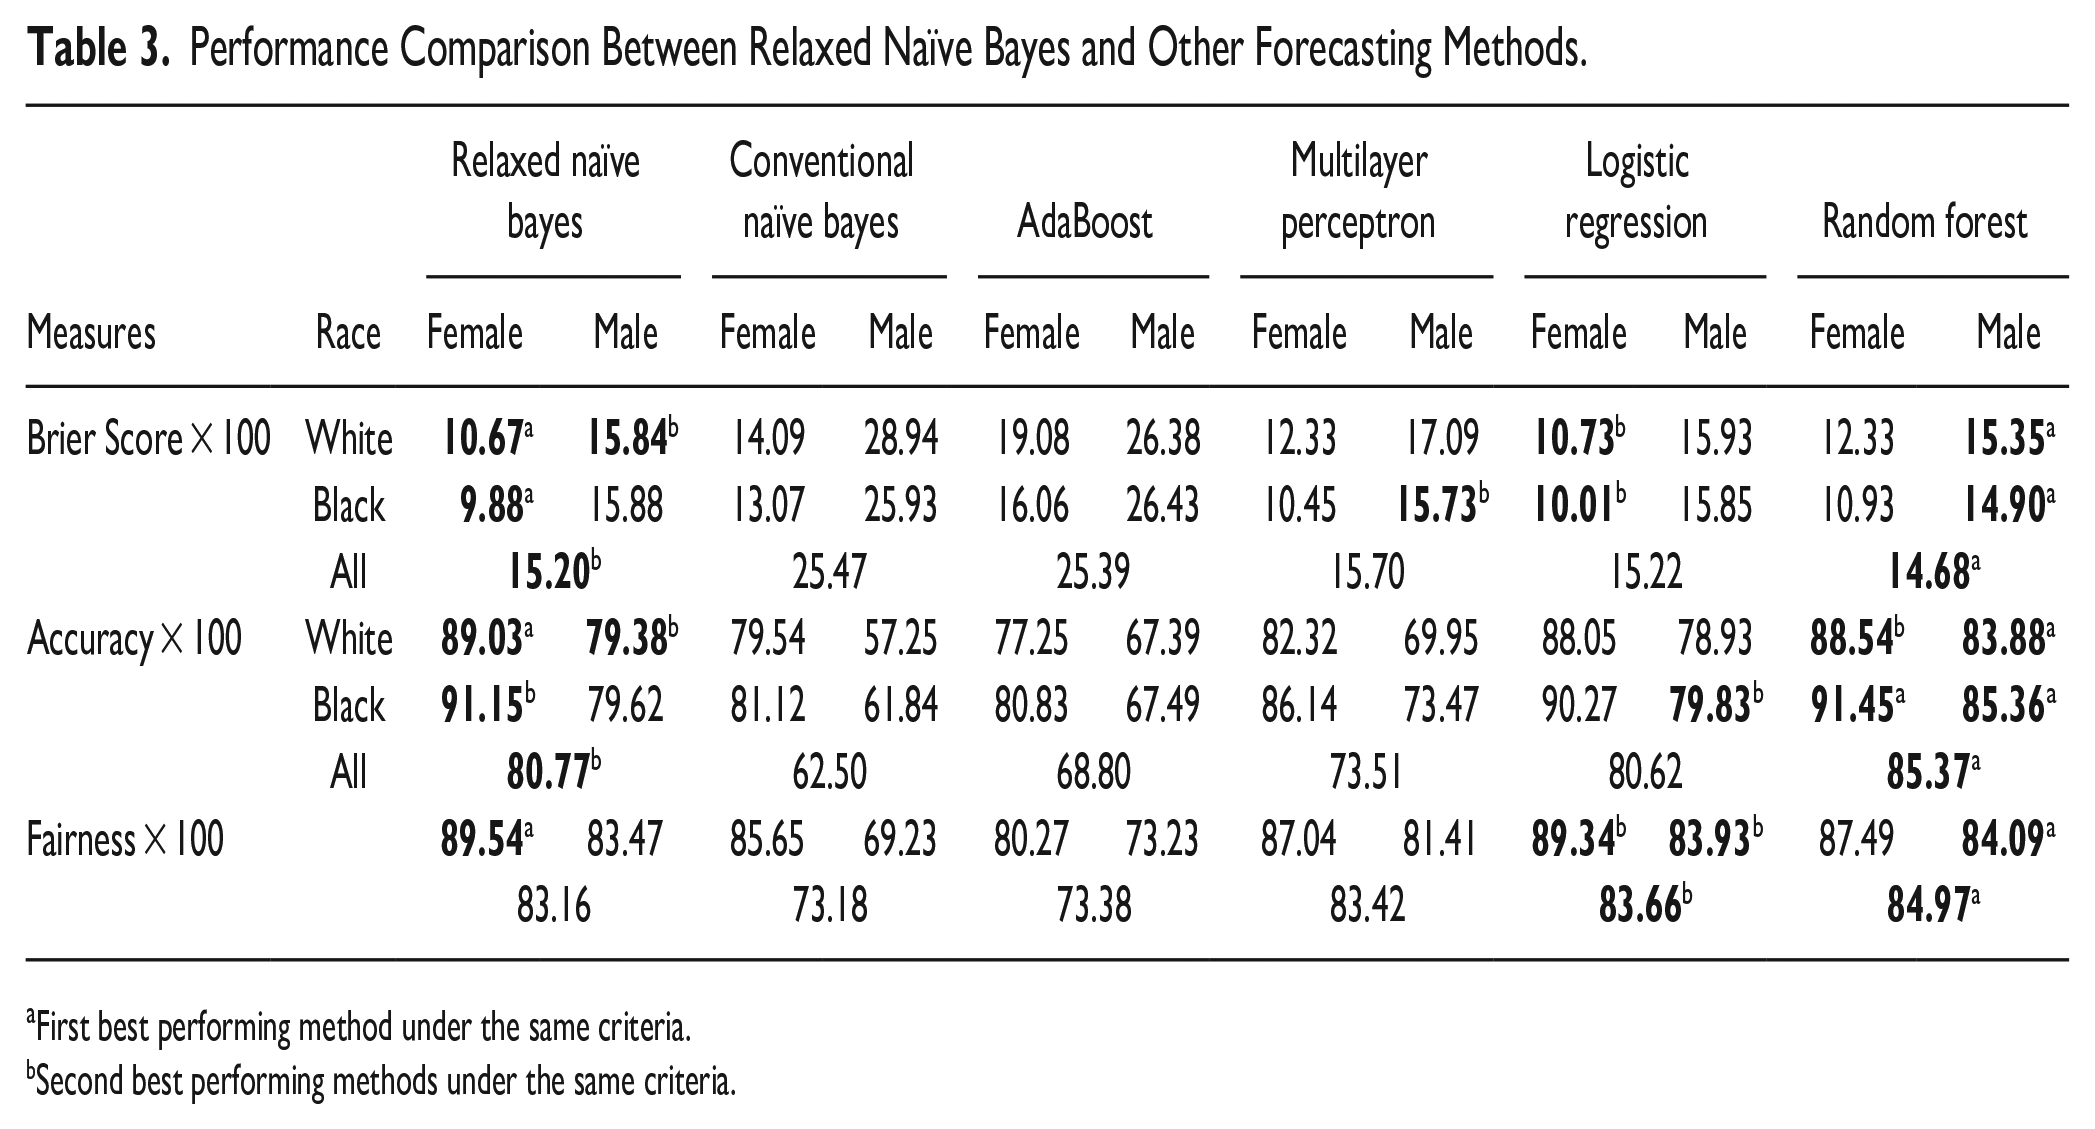
First best performing method under the same criteria.
Second best performing methods under the same criteria.
According to a cross-comparison with other methods in Table 3, relaxed naïve Bayes is superior to the machine learning algorithms, except for random forest. Specifically, if one is looking for a recidivism forecasting method with the least prediction error (lowest Brier score), relaxed naïve Bayes (
For all three performance measures with a set of 13 evaluation criteria (e.g., Brier score-White-Female, Accuracy-White-Female, and Fairness-White-Female), random forest is ranked first in nine criteria, relaxed naïve Bayes is ranked either first or second in nine criteria, and logistic regression method was ranked second in six criteria. Furthermore, the overall area size comparison in Figure 2 shows the dominance of random forest model relative to other forecasting methods across the overall criteria we considered in Table 3. The larger the radar area in Figure 2, the better the forecasting performance. This result is consistent with recent studies of inmate recidivism forecasting demonstrating that random forest outperforms other forecasting methods (Oh et al., 2022).
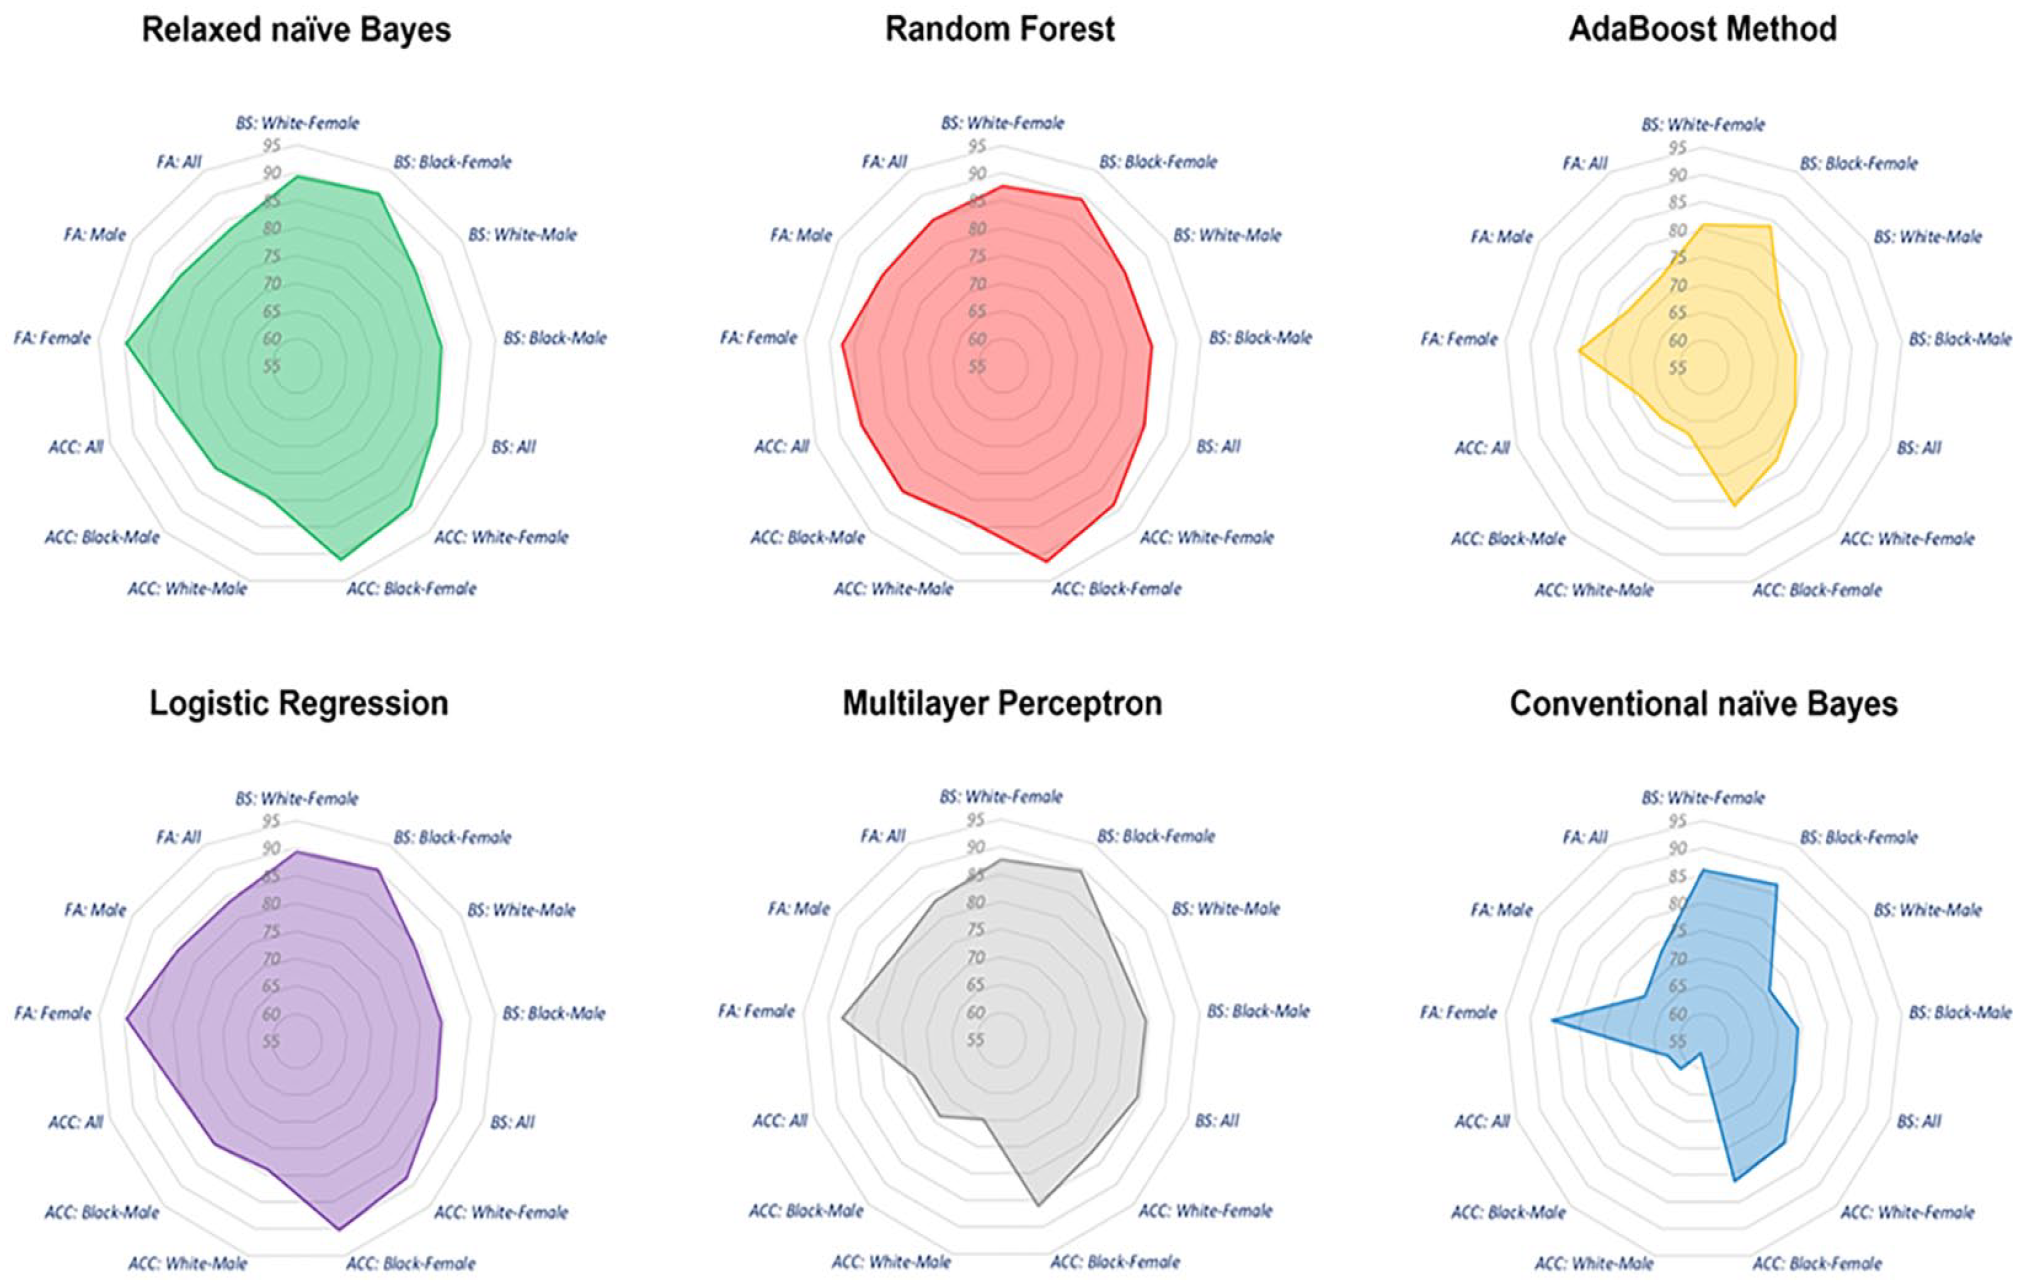
Recidivism forecasting performance across different methods over 13 criteria.
Interpretability
Despite random forest’s dominance over other methods, we would like to emphasize that relaxed naïve Bayes is computationally inexpensive and offers interpretable predictions. Interpretability is important especially in predicting human behavior because the lack of interpretability may undermine the confidence of the forecasted results and reduces the transparency of the model (Zhang et al., 2022). In fact, most predictive studies of recidivism do not clearly provide interpretable models or simply provide on average effect sizes of predictors. This information is not sufficient to persuade researchers and practitioners to apply the model in practice. Correctional authority needs clear information regarding which features have stronger contributions to recidivism relative to other features in order to diagnose and treat their inmates appropriately before releasing them into the community. Though the standardized coefficients (in Figure 1) are helpful to understand the “on average” contributions of observed features to recidivism, it doesn’t tell us how individual offenders are scored differently by their features in terms of recidivism. Spiegelhalter and Knill-Jones (1984) suggested an individual scoring system where weightings can be used to calculate the adjusted weights of evidence for each feature with an initial score, the constant
Table 4 shows an example of “balance of evidence” account based on one of the offenders in the training data. Each weight of evidence (score) corresponding to each feature shows how each feature contributes differently to the balance of evidence. For the offender in Table 4, gang affiliation is the strongest feature which increases the probability of recidivism, followed by his age at release from the prison (23–27), where he lives (PUMA = 25), and so on. On the other hand, prior convictions with domestic violence charges is the strongest feature which lowers the probability of recidivism, followed by prior revocations of probation and so on. The initial score −87 (≈
Example Balance of Evidence Account.
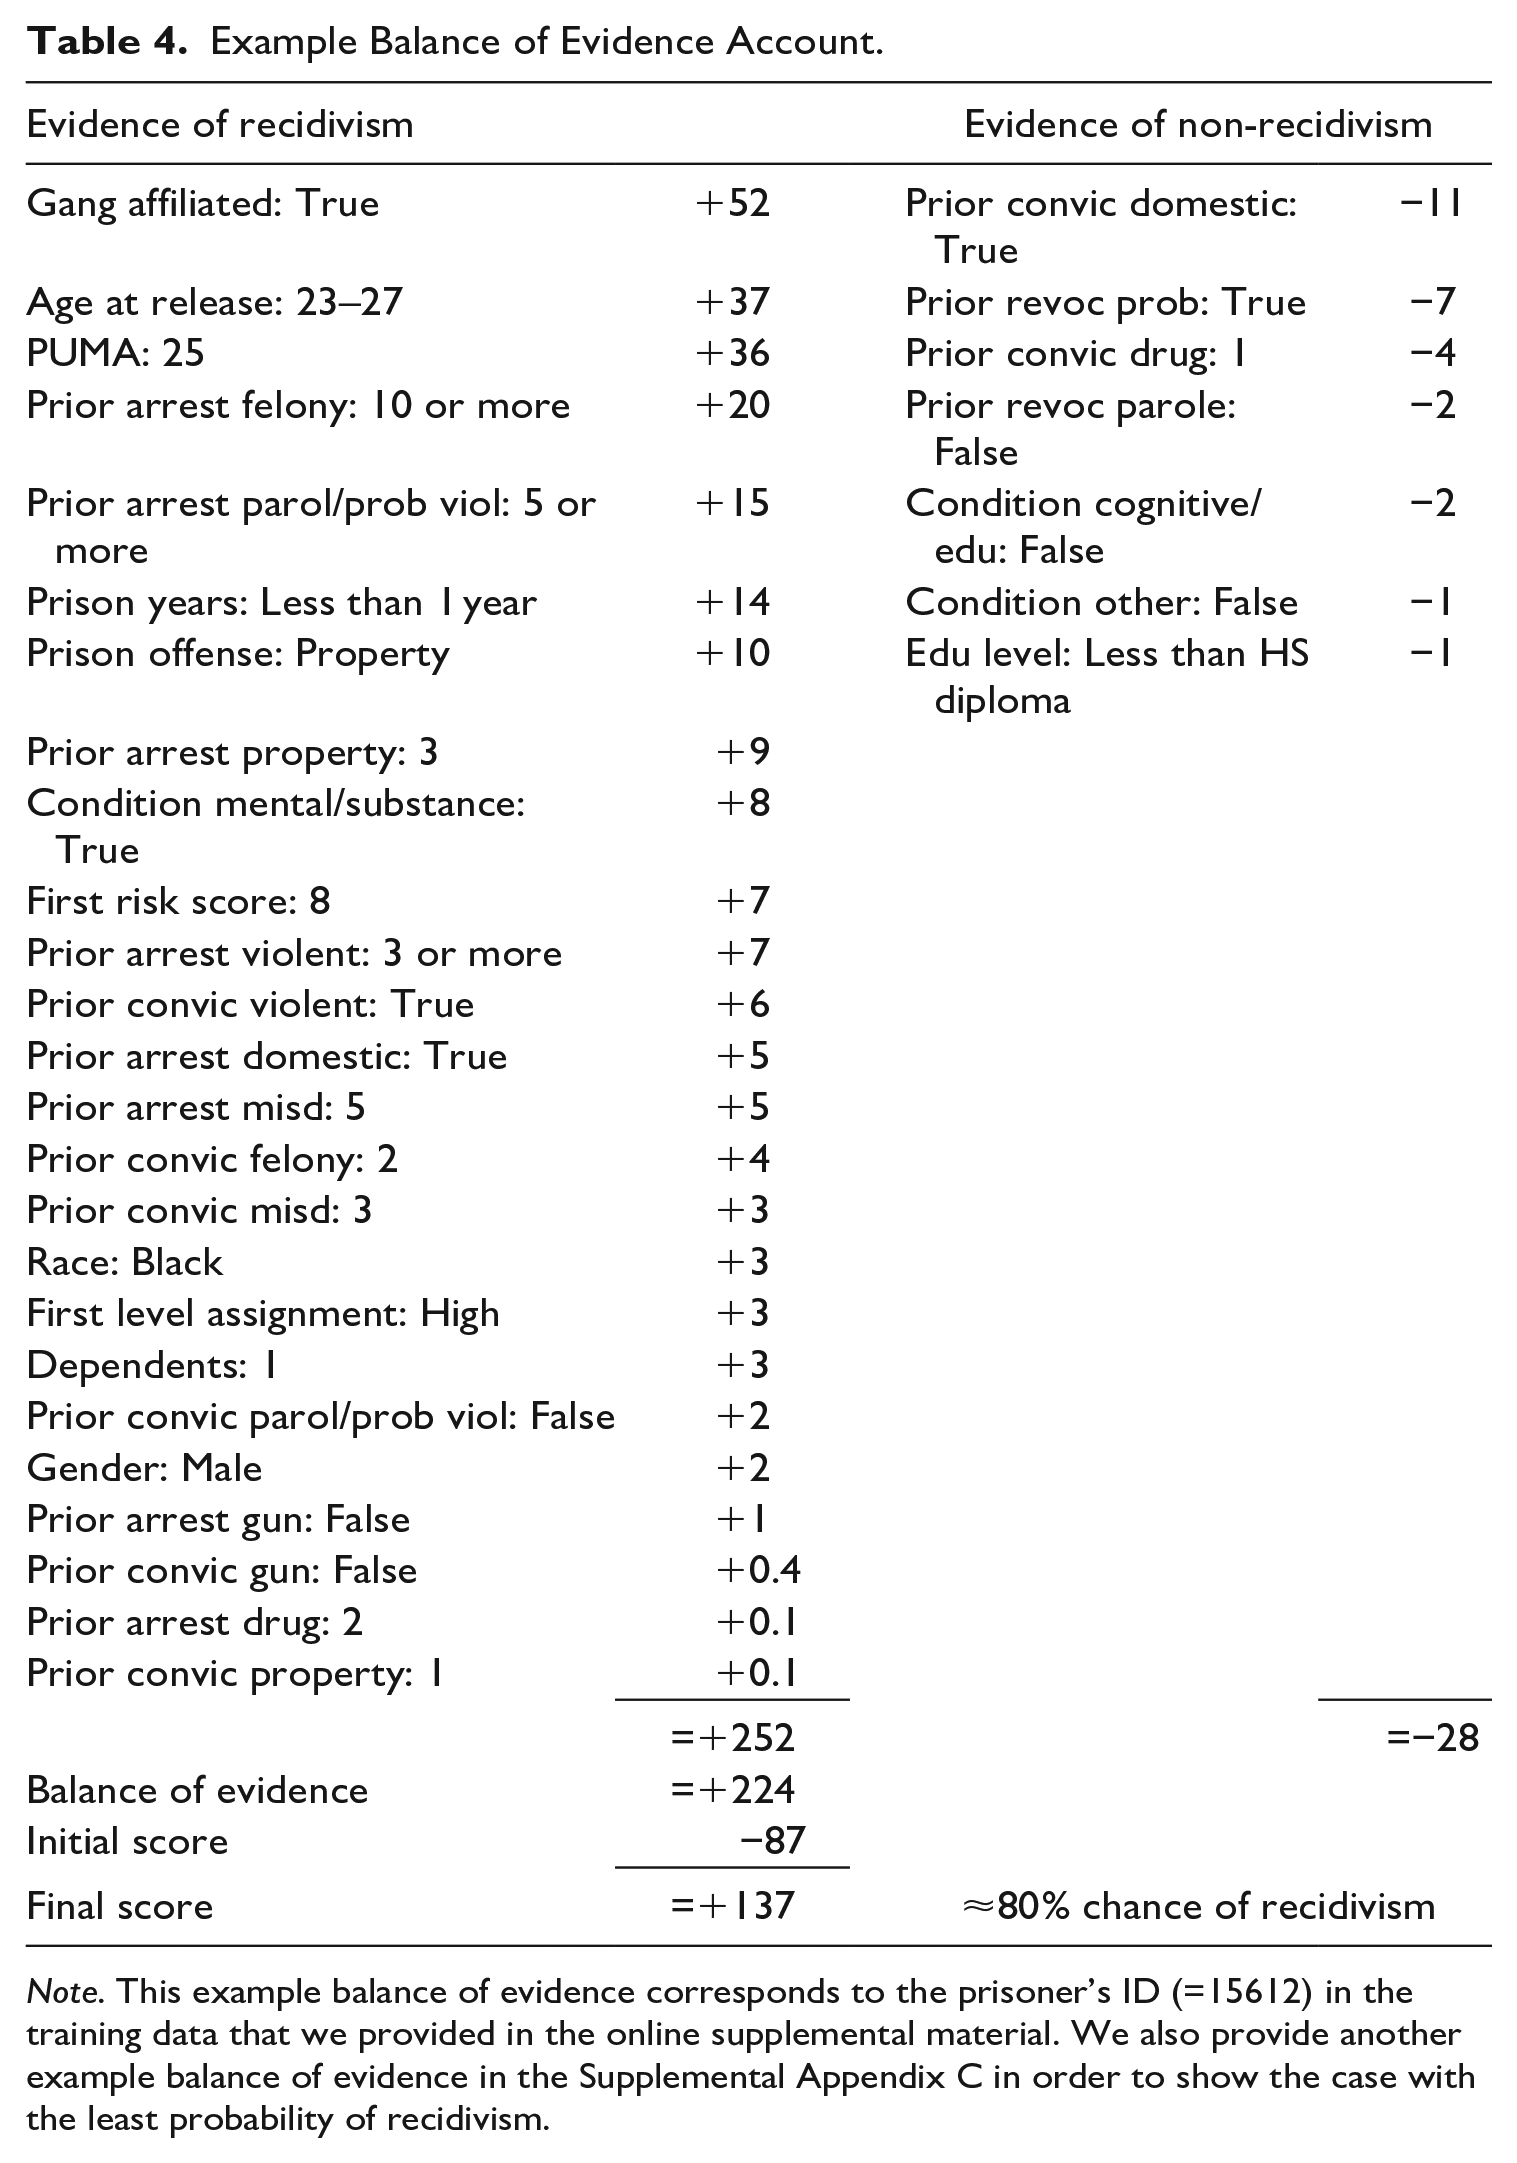
Note. This example balance of evidence corresponds to the prisoner’s ID (=15612) in the training data that we provided in the online supplemental material. We also provide another example balance of evidence in the Supplemental Appendix C in order to show the case with the least probability of recidivism.
Because the interpretability of balance of evidence provides transparency toward the recidivism forecasting, it also helps researchers and practitioners peer into the hood of our relaxed naïve Bayes method and adjust the model if needed. If the influence of certain features on recidivism is not consistent with existing theories, or found overly driving the recidivism forecasting in the balance of evidence, researchers could remove these features to discount their impact on recidivism forecasting, or vice versa. In this scenario, the balance of evidence account may be viewed as a tool for refining the recidivism forecasting by taking into account theories and practices.
To summarize, our findings show that relaxed naïve Bayes is a far better classifier than conventional naïve Bayes, it outperforms multilayer perceptron, AdaBoost method, and logistic regression, and is more interpretable than random forest model. With all the evaluation criteria taken into account, as well as interpretability and applicability, relaxed naïve Bayes is preferable method in recidivism forecasting.
Discussion and Conclusions
The relaxed naïve Bayes classifier performs well. It outperforms the winners of NIJ Recidivism Forecasting challenge. Compared with other machine learning forecasting methods, we found that relaxed naïve Bayes is superior to most machine learning algorithms, with the random forest model being the exception. However, there is another criterion we need to consider: interpretability. As Rudin (2019) highlighted, interpretability of the model (where one could interpret how all the variables are jointly related to each other) is more important in prediction than explaining black box models of machine learning since it is related to confidence and transparency of the model. She also warned that simply allowing black box models in criminal justice without considering the interpretability of the model may put many people in danger. As our subject matter is forecasting human behavior (“who” will recidivate in the future) rather than “which product” will be problematic, using an inherently interpretable model is crucial to understanding and forecasting human behavior. Our relaxed naïve Bayes provides a balance of evidence for prediction, which made this approach useful and reliable in medical diagnostics and prognostics over the past 30
Once all weights of observed features are estimated, one could interpret the meanings of weights from a broader perspective. Specifically, based on the estimated weights of the features, we found that acquired features of offenders are stronger contributors to recidivism than innate features such as race and gender. This is a practical advantage that machine learning algorithms cannot achieve, thus helping researchers and practitioners avoid inappropriate overconfidence in machine learning algorithms (Rudin, 2019). As we have already seen, however, the forecasting ability of machine learning algorithms ─ especially random forest ─ should not be undervalued. Nevertheless, we should always ask ourselves if the methods we use in machine learning are interpretable and how they relate to existing theories. As social scientists who use empirical evidence and theories to interpret social phenomena, we must understand what models and algorithms do specifically. Our method for estimating weights in a relaxed naïve Bayes approach meets this creed.
Compared with logistic regression, the relaxed naïve Bayes is a better method in practice for several reasons. First, it uses a “points for and points against” approach in the balance of evidence account to stack up or down stack the risk scores toward recidivism (Seymour et al. 1990). Since this is the way that many clinicians have already used in medical diagnostics and prognostics for patients’ risk assessments, relaxed naïve Bayes promises to be more clinically acceptable than logistic regression, if implemented correctly (Seymour et al., 1990). Implementing the relaxed naïve Bayes in a software package with a graphically appealing user interface will help correctional authorities to use the method with ease. Second, based on our findings, the relaxed naïve Bayes and logistic regressions may produce similar to almost identical forecasting results. This is possible under certain settings such as all input and outcome variables are binary and there is no missing value in the data (Seymour et al., 1990). However, relaxed naïve Bayes is still preferred in practice since its results presented in the balance of evidence sheet makes every feature interpretable for each offender in the forecast.
Despite that the relaxed naïve Bayes classifier outperforms other methods, we should note that incorporating race and gender in the model could potentially reinforce and magnify existing biases and stereotypes, given that the historical data used to operate the model often mirror systemic discrimination and societal inequalities. Legally, the inclusion of these variables might be contentious as numerous jurisdictions enforce stringent anti-discrimination laws that prohibit the use of race and gender in decision-making processes, including those involving predictive models. Implementing these variables in recidivism forecasting could thus incite legal complications and penalties for organizations that deploy such models.
We should also note that our forecasting method may perform differently based on different data sets since all predictions or forecasts are sample-specific (Hamilton et al., 2022). Nevertheless, we can overcome this limitation by updating the average odds of recidivism and the relative risk of observed features by using the new training data to update our relaxed naïve Bayes classifier. Further, since the predictive performance of our method may change depending on the metrics used, future research will need to test and replicate it. Even though our forecasting method does not always lead to the best performance overall, this claim is more a reflection of our imagination than the validity of our suspicion.
The present study implemented relaxed naïve Bayes using Microsoft Excel and the Stata 14 statistical software package to make it easy for researchers and practitioners to apply and adjust the model with a minimum amount of learning effort. Although we understand that providing example code (for both relaxed naïve Bayes and other methods we compared) in a single software package would facilitate sharing of our analyses with interested readers, we postpone this task to a future study since it is not the major focus of this paper. As such, we believe that the Spiegelhalter and Knill-Jones method of feature weighting deserves to be better known in crime research. The emphasis of this paper is to introduce this method rather than developing code in a single software package. Besides these notable limitations, we would like to reiterate that the relaxed naïve Bayes classifier outperforms other methods and provides an interpretable tool—balance of evidence account—that social scientists and correctional authorities can easily understand and apply without requiring additional training or skills. We should also emphasize that the balance of evidence account provides a neutral numeric value to indicate an offender’s risk of recidivism, rather than lumping individuals into rudimentary categories such as low, medium, and high risk. Employing a neutral numeric value as a risk score could help mitigate the negative implications of labeling and categorization. Furthermore, if correctional authorities have access to specific risk scores rather than broad categories, they would be better equipped to implement customized intervention and prevention strategies. Latessa and Lovins (2010) also contend that assessing an offender’s risk of recidivating is the cornerstone of a more effective, efficient, and just system. In line with this principle, our relaxed naive Bayes classifier achieves these goals by offering an interpretable and practical measurement of an offender’s risk of recidivism. The classifier goes beyond predicting which offenders are likely to recidivate; it also provides valuable insights for correctional authorities by identifying individual-specific features that may contribute to an increased likelihood of recidivism in the balance of evidence account. This information can be instrumental in developing targeted intervention strategies. Therefore, our relaxed naive Bayes classifier serves as a valuable tool that not only aids in predicting recidivism but also facilitates the implementation of tailored intervention approaches based on the identified individual-specific risk factors within the balance of evidence account.
If one is looking for a forecasting model with minimum prediction error and high accuracy with high racial fairness, as well as clear interpretability, the relaxed naïve Bayes achieves these goals across multiple evaluation criteria. Moreover, following the Spiegelhalter and Knill-Jones approach, this paper suggests a novel way to overcome the inherent limitations of the naïve Bayes method in forecasting recidivism. Therefore, instead of making any definitive statement, we would like to conclude our paper with a suggestion: using the same data, compare other forecasting algorithms with our relaxed naïve Bayes.
Supplemental Material
sj-docx-1-cad-10.1177_00111287231186093 – Supplemental material for Improving Recidivism Forecasting With a Relaxed Naïve Bayes Classifier
Supplemental material, sj-docx-1-cad-10.1177_00111287231186093 for Improving Recidivism Forecasting With a Relaxed Naïve Bayes Classifier by YongJei Lee, SooHyun O and John E. Eck in Crime & Delinquency
Footnotes
Acknowledgements
We thank Dr. Edward Latessa for his lifetime contribution to the area of corrections. In honor of his remarkable contributions, we dedicate this article to him.
Declaration of Conflicting Interests
The author(s) declared no potential conflicts of interest with respect to the research, authorship, and/or publication of this article.
Funding
The author(s) received no financial support for the research, authorship, and/or publication of this article.
Supplemental Material
Supplemental material for this article is available online.
Notes
Author Biographies
References
Supplementary Material
Please find the following supplemental material available below.
For Open Access articles published under a Creative Commons License, all supplemental material carries the same license as the article it is associated with.
For non-Open Access articles published, all supplemental material carries a non-exclusive license, and permission requests for re-use of supplemental material or any part of supplemental material shall be sent directly to the copyright owner as specified in the copyright notice associated with the article.