
Abstract
Why do age differences matter for voting in some countries and not in others? Despite the prevailing narrative that a ‘youthquake’ in voting is occurring across established democracies, age effects vary considerably across countries. We seek to explain this apparent contradiction through three studies, using large comparative survey data (the World Political Cleavages and Inequality Database and the European Election Study voter survey) and survey data from Denmark and Great-Britain. We find that the explanation for variation in age differences lies with the structure of party competition and the policy positions of the major parties. When left parties adopt a progressive position on the sociocultural dimension, younger people are attracted to the political left; when parties do not align themselves on this dimension, there are no significant age differences in voting in voting for the left. The findings suggest that party positioning structures age variations in voting, not social dynamics.
The 2017 UK General Election has been referred to as a ‘Youthquake’ election, with polls suggesting a strong surge in voting for Labour among the youngest voters, while older voters shifted to the Conservative party (Travis & Barr, 2017). Just a few months later, Jacinda Ardern led the New Zealand Labour party to a surprising victory (Vowles, 2018) by mobilizing support from young voters (Hickey, 2017). In Germany too, observers and scholars have noted large differences in the vote choices of young and old voters, though in this case it is not the Social Democrats but the Greens that benefit from strong support among the young. Hübner et al. (2022) report that 23% of 18 to 24 year olds voted for the Greens in the 2021 federal election, compared to 15% in the electorate as a whole. A similar pattern emerged in Australia in the 2022 election, with young voters opting for the Greens and eschewing the centre-right Liberals (McAllister, 2023).
Yet in other countries, recent elections show no such pattern and in some settings the young support right-wing parties more than the old. In the 2022 Swedish general election, for example, “the youngest generation voted more conservatively” (Off, 2022). The scholarly literature has also cast doubt on the idea that an age cleavage is indeed emerging. Reviewing research that has studied the changing cleavage structure of democracies in Western Europe, for example, Ford and Jennings (2020: 306) state that “there is scant evidence that age differences yet explicitly structure party competition.” In the 2024 European Union elections, the surge in support for far right parties was driven in part by support from younger voters, disillusioned with the policies of the mainstream parties (Cokelaere, 2024).
Despite the widespread narrative that young and old voters in established democracies increasingly vote for different parties, there is a paucity of empirical evidence supporting this claim. Furthermore, the few scholarly studies that do find evidence of large and growing age differences in voting behaviour focus on single cases (Fisher, 2008; Furlong & Jennings, 2024; Steiner, 2023; Whiteley, 2023), leaving open the possibility that the observed patterns are context-specific rather than a general trend.
In this paper, we argue that whether or not age differences structure the vote is dependent on context. More specifically, we test the proposition that the structure of party competition and the policy positions that parties take are crucial for understanding whether age differences in voting behaviour emerge, and what form these differences take. We theorize that because age groups sort into parties based on parties’ sociocultural positions, whether the young are more likely to vote for left parties than older voters depends on the extent to which the left-right dimension aligns with a second, sociocultural, dimension. When left parties take more (less) socially progressive positions, and right parties take more (less) socially conservative positions, we expect younger voters to be more (less) likely to vote for left parties than older voters.
We thus theorize that the structure of party competition shapes support for parties, and we follow earlier work in conceiving of party competition in Western democracies as structured by two main dimensions: an economic and a sociocultural one (Häusermann & Kriesi, 2015; Hooghe & Marks, 2018; Kitschelt, 1994; Kitschelt & Rehm, 2023). The economic left-right dimension distinguishes individuals and parties that are pro-redistribution and individuals and parties that take pro-market economic positions (Kitschelt & Rehm, 2023). While there is broad agreement about the meaning of the economic left-right dimension, the meaning and content of the second – sociocultural – dimension has been a topic of debate, and different terms have been used to refer to conflict on non-economic issues. Scholars have referred to it as, among other things: a libertarian-authoritarian dimension (Kitschelt, 1994; Kitschelt & Rehm, 2023); an opposition between Green/Alternative/Libertarian (GAL) and Traditional/Authoritarian/Nationalist (TAN) positions (Hooghe & Marks, 2018); a cosmopolitan-parochialism divide (De Vries, 2018); a universalism-particularism divide (Bornschier et al., 2021); a cultural dimension (Rovny & Polk, 2019; Van Der Brug & Van Spanje, 2009); and a sociocultural dimension (Lancaster, 2022). Despite differences in how scholars refer to the second dimension and how they conceptualize and operationalize it, there is general agreement that the second dimension consists of non-economic issues, relating to “cultural or “ideal” politics” (Inglehart, 1977: 13), including law and order, social lifestyle issues as well as issues relating to immigration and cultural diversity. In what follows, we refer to this dimension as a sociocultural dimension, with progressive and conservative positions at opposite ends on the divide.
We test our theoretical argument about the impact of parties’ positions on the sociocultural dimension in three complementary empirical studies, using aggregate, cross-sectional and panel data, focusing on party competition and support for parties.
In Study 1, we use data from the World Political Cleavages and Inequality Database (WPID) to conduct large comparative analyses of age differences in vote choice for left and non-left parties across established democracies. By combining these individual level data with Manifesto Project (MARPOR) data, we connect age differences to the structure of party competition on the sociocultural dimension. This supports our argument and shows that the young’s likelihood to vote for left parties is higher than that of older voters in party systems where left parties take more progressive sociocultural positions, and where right parties take less progressive sociocultural positions.
Study 2 sheds light on the individual level mechanisms that underpin this association by shifting the focus to the connection between the positions that specific parties take and the probablity that individuals will vote for them. Using data from the 2019 European Election Study (EES) voter survey matched to information on parties’ policy positions from the Chapel Hill Expert Survey (CHES) from the same year, we show that younger age groups have a higher utility to vote for left parties that are more socially progressive. By contrast, older voters prefer left parties that are more socially conservative, while voters of different age groups do not appear to sort into parties based on their economic left-right positions.
Study 3 provides evidence that shifts in parties’ positions on the sociocultural dimension can alter the age gradient in support for the left. We focus on two left-wing parties that have strongly altered their position on the sociocultural dimension, but in opposite directions: the British Labour Party shifted strongly in a progressive direction between 2015 and 2019, while the Danish Social Democratic Party became more conservative between 2007 and 2015. Using two waves of the British Election Study Internet Panel (BESIP) and two cross-sectional surveys from the Danish Election Study, we demonstrate that the young (old) become more (less) likely to support the British Labour Party as it moves in a progressive direction while younger (older) voters in Denmark were less (more) likely to support the Danish Social Democratic Party after it had moved in a more conservative direction.
Our findings show that there are important preconditions to the much discussed narrative of young voters increasingly turning to the left. Context-level factors that relate to the structure of party competition condition whether younger voters will prefer a left party, and whether older voters will prefer a non-left party. Our findings also contribute to the literature that has argued that second dimension politics increasingly structures voters’ preferences (Dassonneville et al., 2024; De Vries, 2018; Hooghe & Marks, 2018), by highlighting that young and old voters sort into parties based on this second dimension – rather than based on positions on the economic left-right dimension. Finally, our results speak to research that has shown that the positions of social-democratic parties on the sociocultural dimension structure their electoral success (Abou-Chadi & Wagner, 2021; Häusermann and Kitschelt 2024). We contribute to this literature by showing that the characteristics of supporters of these parties – and their age in particular – also vary when these parties shift their positions on the second dimension.
Context Variations in Age Gaps
It is often assumed that age correlates positively with support for right-wing policies and parties. One explanation for such age differences is what Peterson et al. (2020: 600) refer to as the “folk wisdom” that “people become more conservative as they grow older.” Half a century earlier, Butler and Stokes (1974: 62) referred to this as “political senescence” and for which they found little empirical support in their classic study, Political Change in Britain.
At a theoretical level, it has been argued that psychological processes, with for example an increase in close-mindedness as people age, could lead older voters to prefer conservative parties (Tilley & Evans, 2014). In addition, life-cycle changes are also thought of as a potential reason why growing older should lead voters to turn to the right, because they affect the resources that people hold as well as how financially secure they are (Ford & Jennings, 2020; Peterson et al., 2020; Tilley & Evans, 2014). Work that has used panel data to examine whether there is evidence of a right-ward shift as people age, however, fails to find strong evidence for such a pattern (Geys et al., 2022; Peterson et al., 2020). These studies suggest that the effect of ageing on political attitudes tends to be mild.
However, differences between the young and the old at one particular point in time not only reflect age differences, but also differences between members of different generations (Glenn, 2003). And such generational differences can also be a source of change, explaining the large age gaps in voting that have been observed in some countries (Fisher, 2008; Furlong & Jennings, 2024; Steiner, 2023; Whiteley, 2023). Specifically, if younger generations of voters hold systematically different – and more left-wing – preferences than previous generations, their gradual inclusion in the electorate could also result in a deepening of age differences in support for the left.
The main reason why the young hold more progressive attitudes, therefore, seems to be due to generational change rather than life-cycle effects. As theorized by Inglehart (1971, 2008), generations coming of age in a period of unprecedented material affluence and in a context of security – that was facilitated through the expansion of the welfare state – have prioritized post-material over material issues. Such postmaterialist values entail a weakening of traditional cultural norms and an increased emphasis on self-expression values (Inglehart, 2008). The importance of generation is reinforced by the incremental expansion of higher education from the 1980s onwards (Hansen & Tyner, 2021). Concretely, Inglehart (2008) associates postmaterialism with support for gender equality, more tolerance of outgroups, and environmental protection, among others. In Western democracies, the share of the population that holds such postmaterialist values has grown over time, not through shifts within generations but through generational replacement (Norris & Inglehart, 2019). In sum, younger generations have been socialized in a context that has fostered the development of postmaterialist values and as a result, hold values and attitudes that are more socially progressive than the rest of the population.
In what is – to the best of our knowledge – the most comprehensive study on over time changes in age and cohort differences in political attitudes, O’Grady (2023: 1397) shows that across Europe “each new cohort has (…) been persistently more socially liberal than its predecessor.” This finding is in line with the work of Lancaster (2022), who shows that younger cohorts are more progressive in terms of their gender attitudes. O’Grady (2023) also finds that newer birth cohorts are more pro-immigration than older cohorts (but cf Lancaster, 2022). For economic attitudes, O’Grady (2023) finds that cohort differences tend to be small. If anything, the youngest generations (Millenials and Gen Z) tend to be somewhat more right-wing economically.
There is thus some evidence that younger generations are more left-leaning than older ones, but only when considering their attitudes on social issues and immigration. While the analyses of O’Grady (2023) are restricted to European countries, there is also evidence from other settings showing that younger generations are more socially liberal and more pro-immigration on average than older voters (Ross & Rouse, 2015; Twenge & Blake, 2021).
If younger generations are systematically more progressive on the sociocultural dimension, why are we not seeing large age gaps in voting for the left across established democracies? We argue that the features of a country’s party system and the positions that parties take on the sociocultural dimension condition whether younger voters will vote for left parties, and whether older voters support non-left parties. In his work on age and cohort differences in attitudes across Europe, O’Grady (2023) already suggested that we should look at the supply of parties for a likely explanation for the emergence of age differences in voting. O’Grady (2023: 1399) posited that age differences in the vote choice should have increased over time because the “emergence of new parties with more extreme positions on social issues and immigration (…) has helped the young and the old to better express their long-standing non-economic differences when voting.”
Even though second dimension politics have gained importance (Dassonneville et al., 2024), and while new challenger parties take strong positions on these issues across democracies (De Vries & Hobolt, 2020), there is much variation in the presence and size of the age gap in voting for the left across the established democracies. This is demonstrated in Figure 1, where we use the World Political Cleavages and Inequality Dataset (WPID)
1
to show the estimated gap in the predicted likelihood of voting for the left between under 30 year olds and 60+ year olds in recent elections (the focus is on elections during the 2010s) across 22 established democracies. Difference in voting for the left between −29 and 60+ year olds in the 2010s, country-specific estimates. Note: Estimates from 22 country-specific estimations, in which voting for the left is regressed on membership of one of five age groups. The plot only shows the coefficient for being young versus old. Detailed estimates can be found in Appendix A. The spikes indicate 95% confidence intervals. Countries are identified by means of two-digit ISO codes.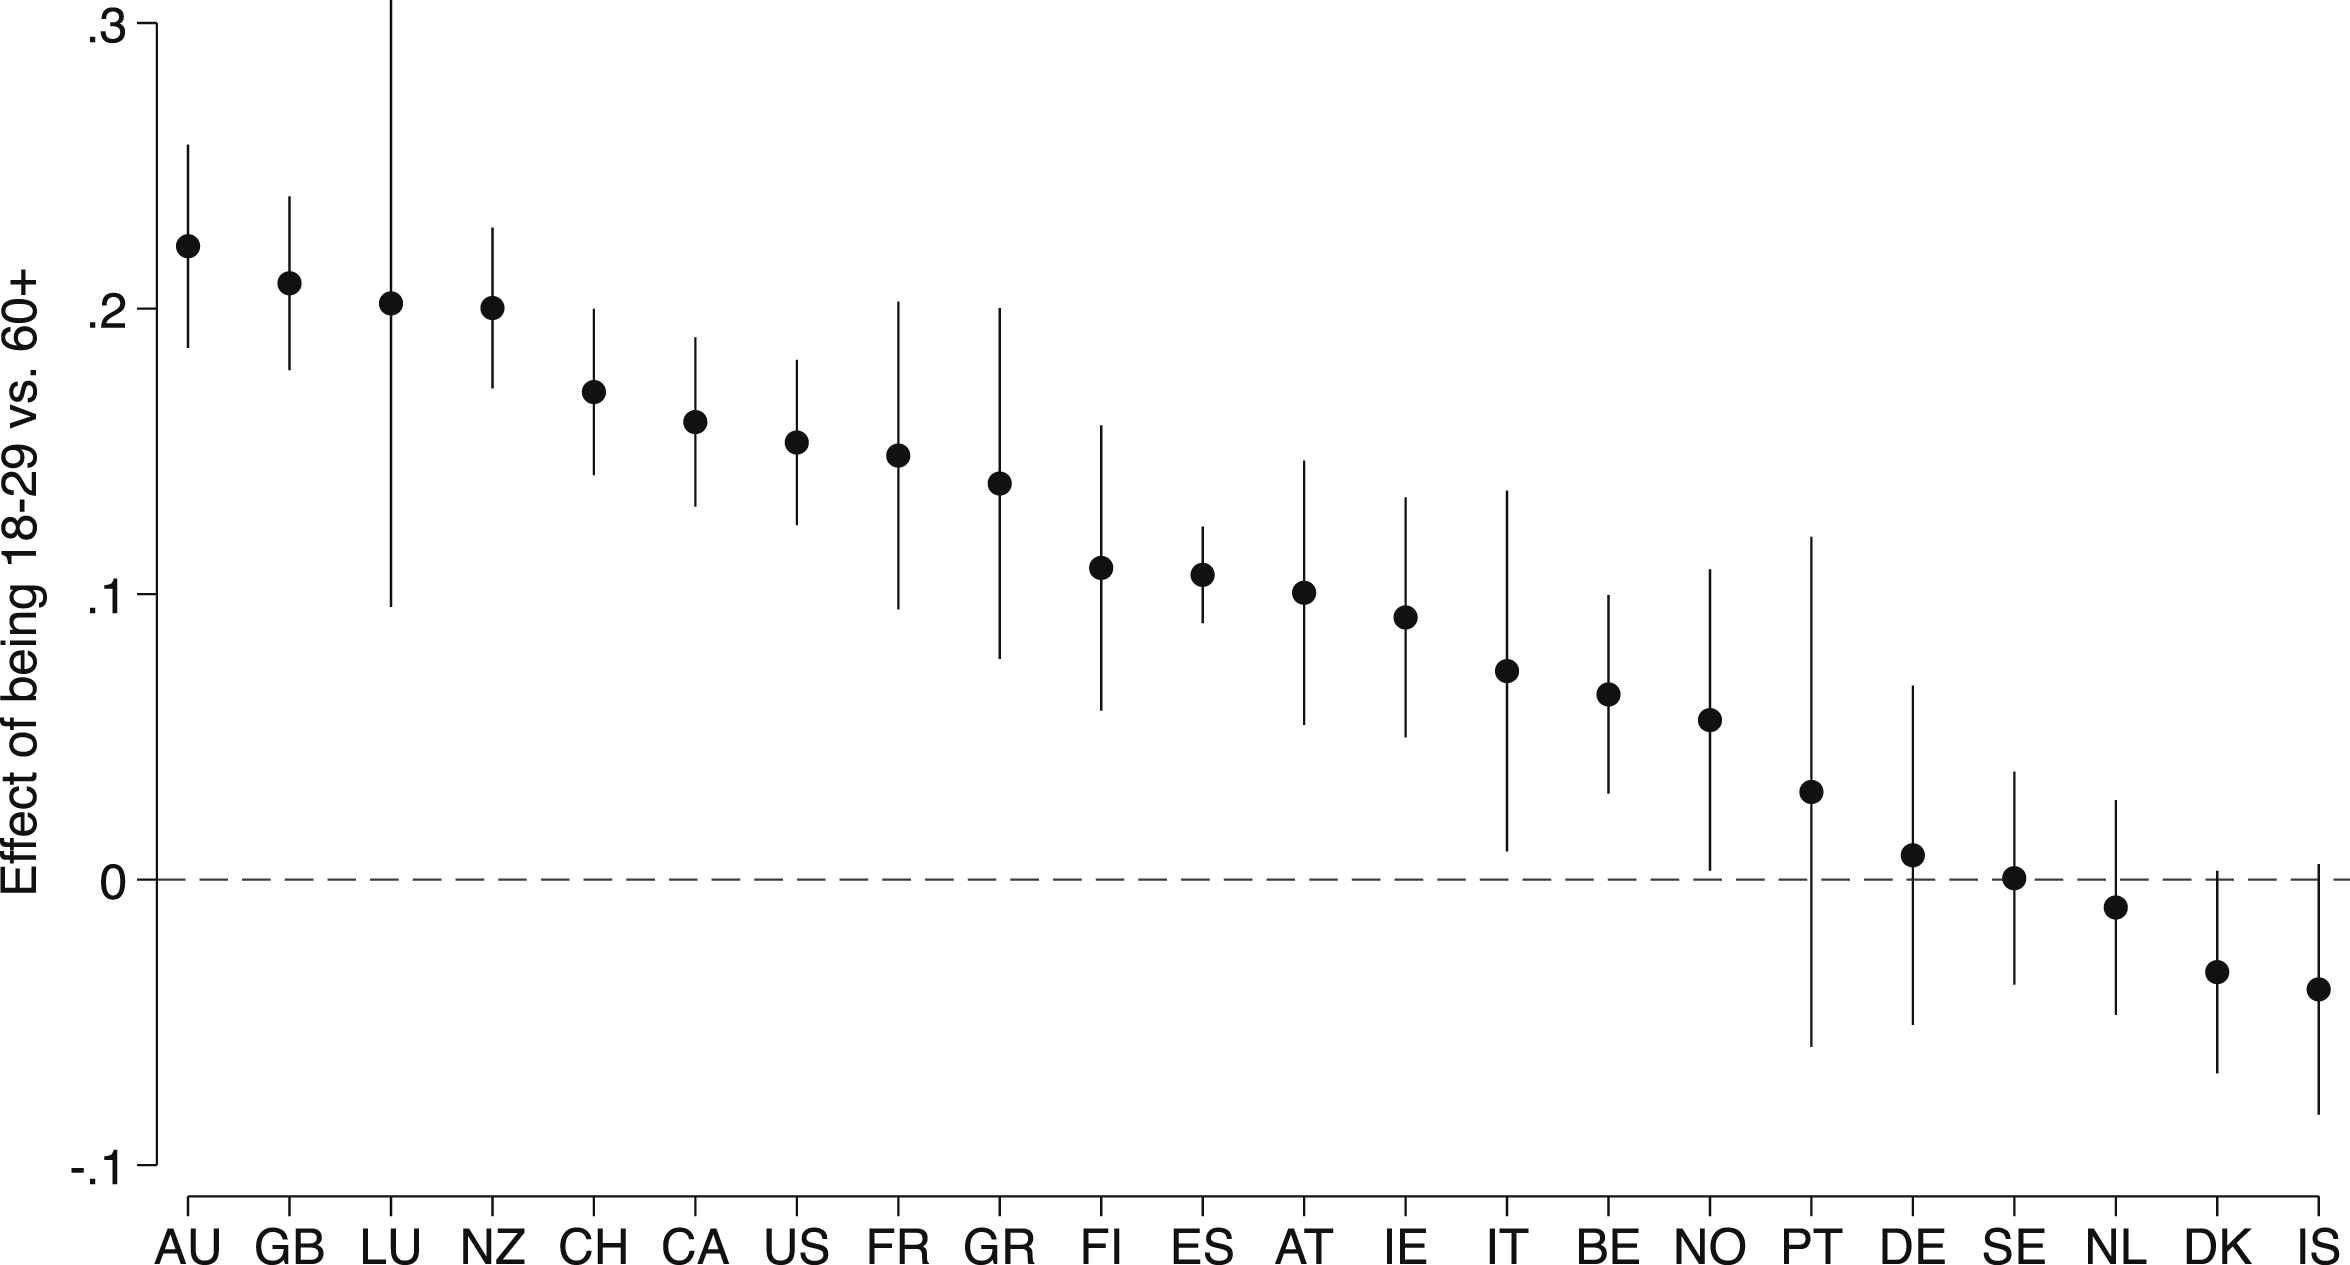
The results show large age gaps in voting for the left in Australia, Britain and New Zealand. 2 In Australia, the young (29 year old or younger) are 22 percentage points more likely to vote for the left compared to the oldest age group. In Britain, the difference is 21 percentage points, while it is 20 percentage points in New Zealand. There are also large gaps in Switzerland, Canada and the United States, ranging between 15 and 17 percentage points. At the other end of the scale, we find countries where the age gap is in voting for the left is very small: it is almost zero in Germany, Sweden and the Netherlands, and it is even negative in Denmark and Iceland – suggesting that the oldest age group is somewhat more likely to vote for the left in these countries compared to the young. In short, there are large variations between countries in the extent to which age structures support for left-wing parties.
We theorize that these large country differences result from context-level variation in how young and old voters can express their sociocultural preferences. Specifically, given that the young hold more progressive attitudes on sociocultural issues compared to older voters (O’Grady, 2023), whether the young will vote for left parties and older voters will prefer non-left parties should depend on the positions that both left-wing parties and non-left-wing parties take on these issues. In line with the literature, we conceive of left-wing parties as parties that can belong to different party families, including radical left, green left, and social democratic parties (Häusermann and Kitschelt 2024). We define non-left parties as those not belonging to one of these three party families. The positions that both groups of parties take on social issues and immigration, we argue, condition the age gap in voting for the left.
The extent to which party competition structures the age gap in voting for the left depends on two factors. First, when left parties take positions that are more socially conservative, or more anti-immigration, this should increase the likelihood that older voters – who are more conservative on these issues (O’Grady, 2023) – will vote for them, and decrease support from young voters. The age gap in voting for left-wing parties, as a result, should decrease when left parties shift to take more conservative social and immigration positions. Second, when non-left parties take more progressive positions on social issues and immigration, young voters should become more likely to vote for non-left parties. At the same time, the likelihood that older voters – who prefer conservative positions on these issues – will support non-left parties will be reduced.
These dynamics in the positions that left and non-left parties take on the sociocultural dimension are thus expected to condition age differences in voting for the left. In short, if left-wing parties are more conservative on these social issues and immigration, and if non-left parties are more socially progressive or pro-immigration, the age-gradient in voting for the left will be reduced. This leads to two hypotheses:
Age differences in support for the left are smaller when left parties take more conservative positions on social issues and immigration.
Age differences in support for the left are smaller when non-left parties take more progressive positions on social issues and immigration. In theorizing the context-level factors that condition the associaton between age and voting for the left, our work builds on a rich literature that has demonstrated that the strength of different types of cleavages on voting behaviour is conditioned by the ideological positions that parties take on these cleavages. For example, a large body of comparative work has shown that variations in the strength and salience of the class cleavage can be explained by the extent to which parties take clearly distinct positions on the economic (Evans & Tilley, 2012) and cultural (Angelucci & Vittori, 2023) dimensions.
3
There is also work that provides indications that the class-basis of radical right and radical left parties differs as a function of the economic and cultural positions that these parties take (Harteveld, 2016; Steiner et al., 2024). Similarly, scholars who have examined the effect of religion on vote choice have pointed out that ideological differentiation between parties – on moral issues in particular – shapes the electoral strength of the religious cleavage (Gomez, 2022).
Study 1. The Structure of Party Competition and Age Differences in Voting for the Left
Study 1 4 uses a large, comparative dataset on individuals’ vote choice to verify whether the structure of party competition – and the positions of left and non-left parties on the sociocultural dimension – correlates with the size of the age gap in voting for left parties.
Data and Methods
In Study 1 we make use of the individual-level data from the WPID (Gethin et al., 2022) to examine how the party system conditions voting for left parties. The WPID combines individual-level survey data from 51 democracies, which have been sourced from national election studies in these countries as well as comparative public opinion surveys such as the European Social Survey and regional barometer surveys. 5 The data have been harmonized across surveys, allowing for a comparative analysis of the sociodemographic determinants of voter turnout and the vote choice (for details, see Gethin et al., 2022).
Given our interest in the determinants of support for left parties, we restrict the dataset to Western democracies – where the left-right dynamics of political competition are well established (Kim & Fording, 1998). Specifically, we focus on the 21 countries that Gethin et al. define as western countries in their dataset, with the addition of Greece, because its left-right dynamics resemble those in other countries in Western Europe (Freire, 2008). 6
The outcome variable in our analysis of the WPID data captures voting for a left party, for which we rely on Gethin et al.’s (2022) coding of parties, with the adjustment that we do not code liberal parties as left-wing. By doing so, the analysis focuses on voting for parties that are social democratic, radical left or green left. The main independent variable captures voters’ age. We distinguish between five different age groups: −29, 30–39, 40–49, 50–59 and 60+. We include all age groups in the analyses, but in examining the results, we are particularly interested in the contrast between the youngest and oldest age groups.
To test our hypotheses, we use indicators that capture the structure of party competition, and specifically measures of the space that left and non-left parties cover on the sociocultural dimension. Given the geographical scope of the countries that are included in the WPID dataset, we rely on the MARPOR project, which uses a coding of the salience of issues in party manifestos to obtain estimates of parties’ positions on different dimensions. To capture parties’ positions on the sociocultural dimension, we make use of the Society dimension of the MARPOR project, which is constructed using references in party platforms that concern diversity, multiculturalism, traditional values and law and order. 7 We distinguish between the positions of left and non-left parties, treating as left parties all parties that are categorized in the social democratic, radical left or green party families. To test H1, we use a measure that captures the position of the most conservative left party – thus gauging whether there are left-wing parties that are fairly conservative. For testing H2, we employ a measure that indicates the most progressive position of a non-left party. This indicator thus captures whether there are non-left parties that are fairly progressive. To ensure these indicators do not capture the positions of parties that are not viable, we specify that the party should have at least 5% of the votes. While these are our main indicators, in Appendix G we use vote-share weighted average positions of left and non-left parties instead of indicators of the positions of the most conservative left and most progressive non-left party in a specific setting. 8 An alternative way of testing our theory consists of examining the likelihood of voting for left parties among young and old voters as the sociocultural distance between left and non-left parties changes. In Appendix G, we present results of such a test.
We estimate linear probability models to explain voting for a left party. 9 We account for the hierarchical structure of the data by specifying random intercepts at the country-year level, and a random slope for age groups – hence specifying that the age gradient can differ between country-years. Our main interest is in the cross-level interactions between age groups and the party position measures.
At the individual level, our main specifications only control for gender, because other individual-level controls are arguably descendants of when an individual is born (and thus their age). At the context-level, we control for the effective number of parties and the least squares index of disproportionality 10 , to capture differences in the size of the party system and the electoral system – that could determine the size of the left vote.
The WPID dataset includes survey data capturing voting behaviour since 1948, though there is only information on each of the 22 countries included in our sample from the 1980s onwards. Because there are important cohort differences in attitudes on social issues and immigration (O’Grady, 2023), assessing age differences since 1980 would conflate the reactions to characteristics of the party system among young and old voters of very different generations. To avoid this problem, we focus only on the most recent time period (post 2000). An alternative approach is to use the full dataset (post 1980) and estimate models that disentangle age group and generational differences. We present the results of this alternative approach in Appendix R.
Results
The detailed estimates of our multilevel models can be found in Appendix C, and we summarize the main results visually – focusing on the predicted level of voting for the left among the youngest (−29) and the oldest (60+) age groups, as a function of variation in the two context-level indicators.
Figure 2 illustrates the conditioning effect of the indicators of the party system structure. Each of the two graphs is structured in the same way, showing the predicted level of support for the left among the youngest age group (solid line) as well as the oldest age group (dashed line), as the value of the context-level indicator changes. Each of the graphs also includes a histogram, which shows the distribution of values on the context-level indicator in the estimation sample. The age gap in voting for the left, the conditioning effect of the sociocultural positions of left and non-left parties. Note: The graphs show the predicted probability of voting for the left among young (solid line) and old (dashed line) voters. The shaded areas indicate 95% confidence intervals. Estimates based on a multilevel model, with random intercepts and random slopes for age groups. Detailed estimates can be found in Appendix C.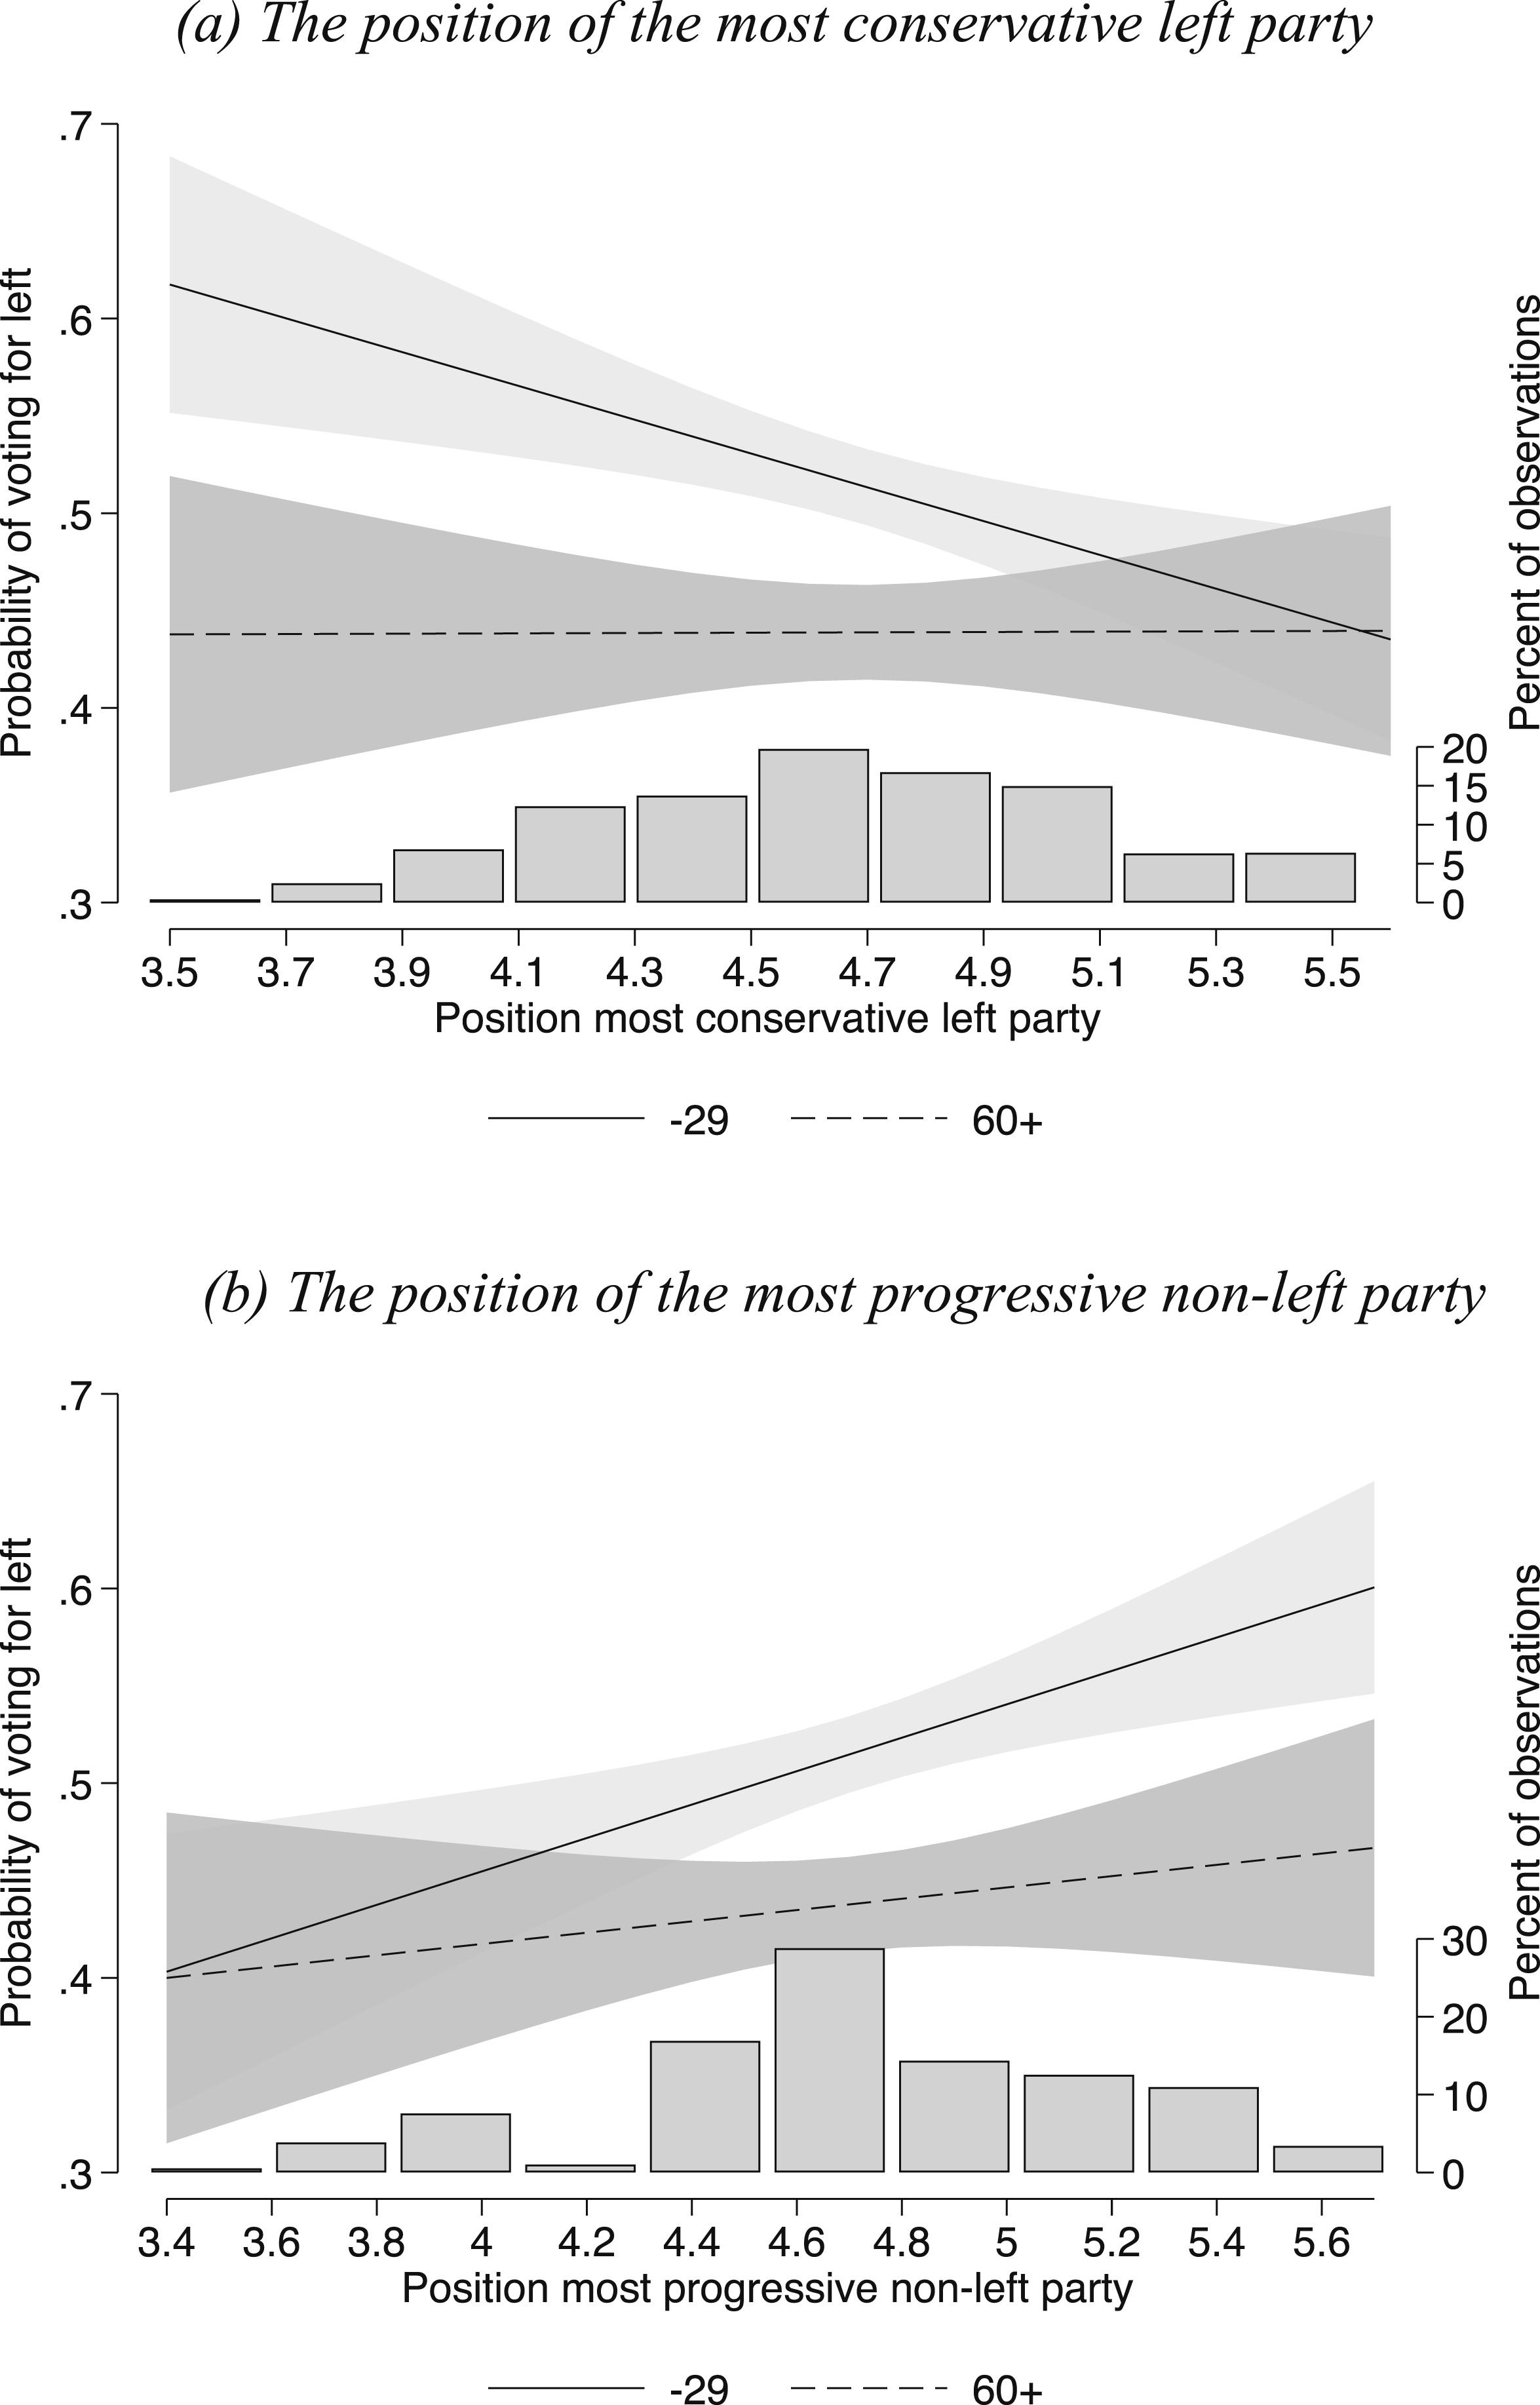
The results in Figure 2 are in line with our expectations. Panel A in Figure 2 shows that the age gap in voting for the left is substantially wider when left-wing parties are most progressive (left-hand side of the graph) than when they are more conservative (right-hand side of the graph). Panel B in Figure 2 also shows estimates that are in the expected direction, with a smaller age gap in voting for the left when non-left parties take progressive positions, than what holds when non-left parties are more socially conservative.
For the positions of left-wing parties (Panel A), the effects are significant and substantively important. The gap in voting for the left decreases from 17.9 points when left-wing parties take the most progressive positions – a gap that corresponds to the age gap found in Switzerland or Canada (see Figure 1) – to a gap of 0.5 points when left-wing parties take the most conservative positions on the sociocultural dimension. These results provide evidence that is in line with H1.
The estimates in Panel B in Figure 2 are also in line with our expectations (H2). The plot of the predicted probability of voting for the left indicates that the gap in the likelihood that the youngest and oldest age group vote for the left is 0.3 points when a non-left party takes fairly progressive sociocultural positions. The gap increases to 13.4 points when non-left parties take the most conservative positions. The fact that the slope is positive for both age groups suggests that left parties generally perform better when they are competing with non-left parties that are socially conservative.
We probed the robustness of our analyses in four ways. First, our main specifications only control for gender at the individual level, because other individual-level controls are arguably descendants of when an individual is born (and thus their age). As an additional test, however, we verified whether our conclusions hold when we account for respondents’ level of education. As can be seen from Appendix D, the results are substantively the same when we add this control. Appendix D furthermore reports results in which we additionally control for respondents’ religious denomination and whether they are an ethnic minority – two socio-demographic variables that correlate with attitudes on the sociocultural dimension (Dancygier & Saunders, 2008; Marcinkiewicz & Dassonneville, 2022). The results are substantively the same when we control for religion. When accounting for ethnic minority status, the effects for the sociocultural position of non-left parties is no longer statistically significant, but the effects for the positions of left parties still holds.
Second, in the main specifications we only focused on data from the last two decades to ensure that we are not estimating the effects of age groups who are members of very different generations. In Appendix E, we show that even if we analyze the full dataset (i.e., the time period for which we have information on all countries – 1980–2020), we still find that the sociocultural positions of left and non-left parties condition the age gap in voting for the left.
Third, our indicators of the positions of left and non-left parties focus on the position of the most conservative left party and the position of the most progressive non-left party. In Appendix G, we show that when we substitute an indicator that summarizes the positions of all left and non-left parties – by means of a vote-share weighted average – we still find strong evidence that the sociocultural positions of left parties condition the age gap in voting but not the sociocultural positions of non-left parties. Furthermore, when we focus on the moderating effect of indicators of the distance between left and non-left parties on the sociocultural dimension, the results are also in line with our expectations. As can be seen from Appendix G, there is evidence of a larger age gap in voting for the left as left parties are more socioculturally progressive than non-left parties.
Fourth, in Appendix H we show the results of estimations that also include an interaction between the effective number of parties and age groups. By doing so, we seek to verify whether the results are really driven by the positions that parties take, or merely reflect differences between small and large party systems. As can be seen from the estimates that are reported in Appendix H, we do not find strong evidence of a conditioning effect of the effective number of parties, while the conditioning effect of left and non-left parties’ sociocultural positions is robust to including this control.
Study 2. Sociocultural Positions of Parties and PTVs for Parties
The results of Study 1 indicate that age gaps in voting for the left vary as a function of the party offerings on the sociocultural dimension, and whether there is competition between left and non-left parties on the progressive and conservative ends of this second dimension. Study 2 seeks to provide insights into the mechanisms that connect the structure of the party system and voting for the left, by examining how the positions of parties on the sociocultural dimension shape citizens’ likelihood of voting for these parties – by means of an analysis of their reported propensity to vote (PTV) for different parties. Our theoretical argument is based on the assumption that young and old voters are better sorted into parties based on their sociocultural positions than their economic left-right positions – generating cross-pressure when both left and right parties are positioned on their preferred end of the sociocultural dimension. Study 2 tests whether this is indeed the case, by assessing the weight of the sociocultural and economic left-right dimensions in young and old voters’ voting utilities.
Data and Methods
We make use of data from the 2019 European Election Study voter survey. In this survey, respondents across European countries were asked to indicate their propensity to vote (PTV) for each of the main parties in their country. These measures capture respondents’ self-reported utility to vote for different parties, and have been found to strongly correlate with measures of partisanship and vote choice (Paparo et al., 2020; van der Eijk, 2002). Given our interest in dynamics in the established democracies, we limit the dataset to countries in Western Europe.
To assess whether young and old voters evaluate their PTV for a party differently depending on the position the party takes, we first transform the dataset to a long format, so the units of analysis are respondent-party dyads. We then merge the EES voter survey data with data from the 2019 wave of the Chapel Hill Expert Survey (CHES), which are our source for estimates of parties’ positions in Study 2 – matching the party that is being evaluated with experts’ assessments of where the party is positioned (for a similar approach, see Dassonneville et al., 2024). Specifically, as measures of the sociocultural positions that parties take, we use estimates of parties’ GAL-TAN positions as measured in the CHES. Experts participating in CHES are asked to report parties’ positions on a scale that distinguishes between libertarian/postmaterialist positions on the one hand and traditional/authoritarian positions on the other. 11 Even though the survey does not ask experts to take into account parties’ positions on immigration and diversity, empirically the GAL-TAN dimension correlates strongly with more specific indicators that ask experts to position parties on immigration (Binding et al., 2024; Lancaster, 2022). While our hypotheses concern the positions of parties on the sociocultural dimension, to demonstrate that age dynamics result from these positions and not positions on the economic dimension, we also examine how different age groups respond to parties’ economic left-right positions.
We examine how PTVs vary as a function of parties’ positions on the sociocultural and economic left-right dimensions, and assess whether these effects vary by age group. We use the same age groups as Study 1, distinguishing between −29, 30–39, 40–49, 50–59 and 60+ year olds. We estimate two OLS models, one for left parties and one for non-left parties, and double-cluster the standard errors at the respondent and country levels. As controls, we account for respondents’ gender at the individual level and include country fixed effects to account for differences in party evaluations between countries.
Results
The detailed estimates of the analyses of Study 2 are reported in Appendix I, and we summarize the results visually. As we did in Study 1, our visualization focuses on the contrast between the youngest (−29) and oldest (60+) age groups.
We start with the estimates for left parties. The top panel in Figure 3 shows how the predicted PTVs for left parties vary as these parties have more progressive or conservative positions on the GAL-TAN dimension. This graph offers support for the expectation that young and old voters respond differently to left parties’ positions on the GAL-TAN dimension. As shown in Panel A, when left parties take progressive positions on the GAL-TAN dimension, the youngest age group rates their PTV for the party significantly and substantially higher than the oldest age group does. For the lowest observed GAL-TAN value, which is 0.8, the PTV for a left party is 4.6 among −29 year olds, while it is 2.9 among respondents who are 60+. In contrast, for left parties that take more conservative positions on the GAL-TAN dimension, both age groups report essentially the same PTV for the party (3.9 vs. 3.8). The gap in PTVs for left parties between the youngest and oldest age group is thus reduced by 1.6 points as we move from the most progressive to the most conservative left parties. The different slopes for the youngest and oldest age group result in smaller differences in the PTVs for left parties when left parties take more socially conservative positions, which is in line with our first hypothesis: when left parties take more conservative socio-cultural positions, age difference in support for left parties are smaller. Predicted PTV for left parties, as a function of parties’ GAL-TAN and economic left-right positions, for young and old voters. Note: The graphs show the predicted PTV for left parties among young (solid line) and old (dashed line) voters. The shaded areas indicate 95% confidence intervals. Estimates based on OLS regression with country fixed effects and standard errors double clustered at the country and respondent levels. Detailed estimates can be found in Appendix I.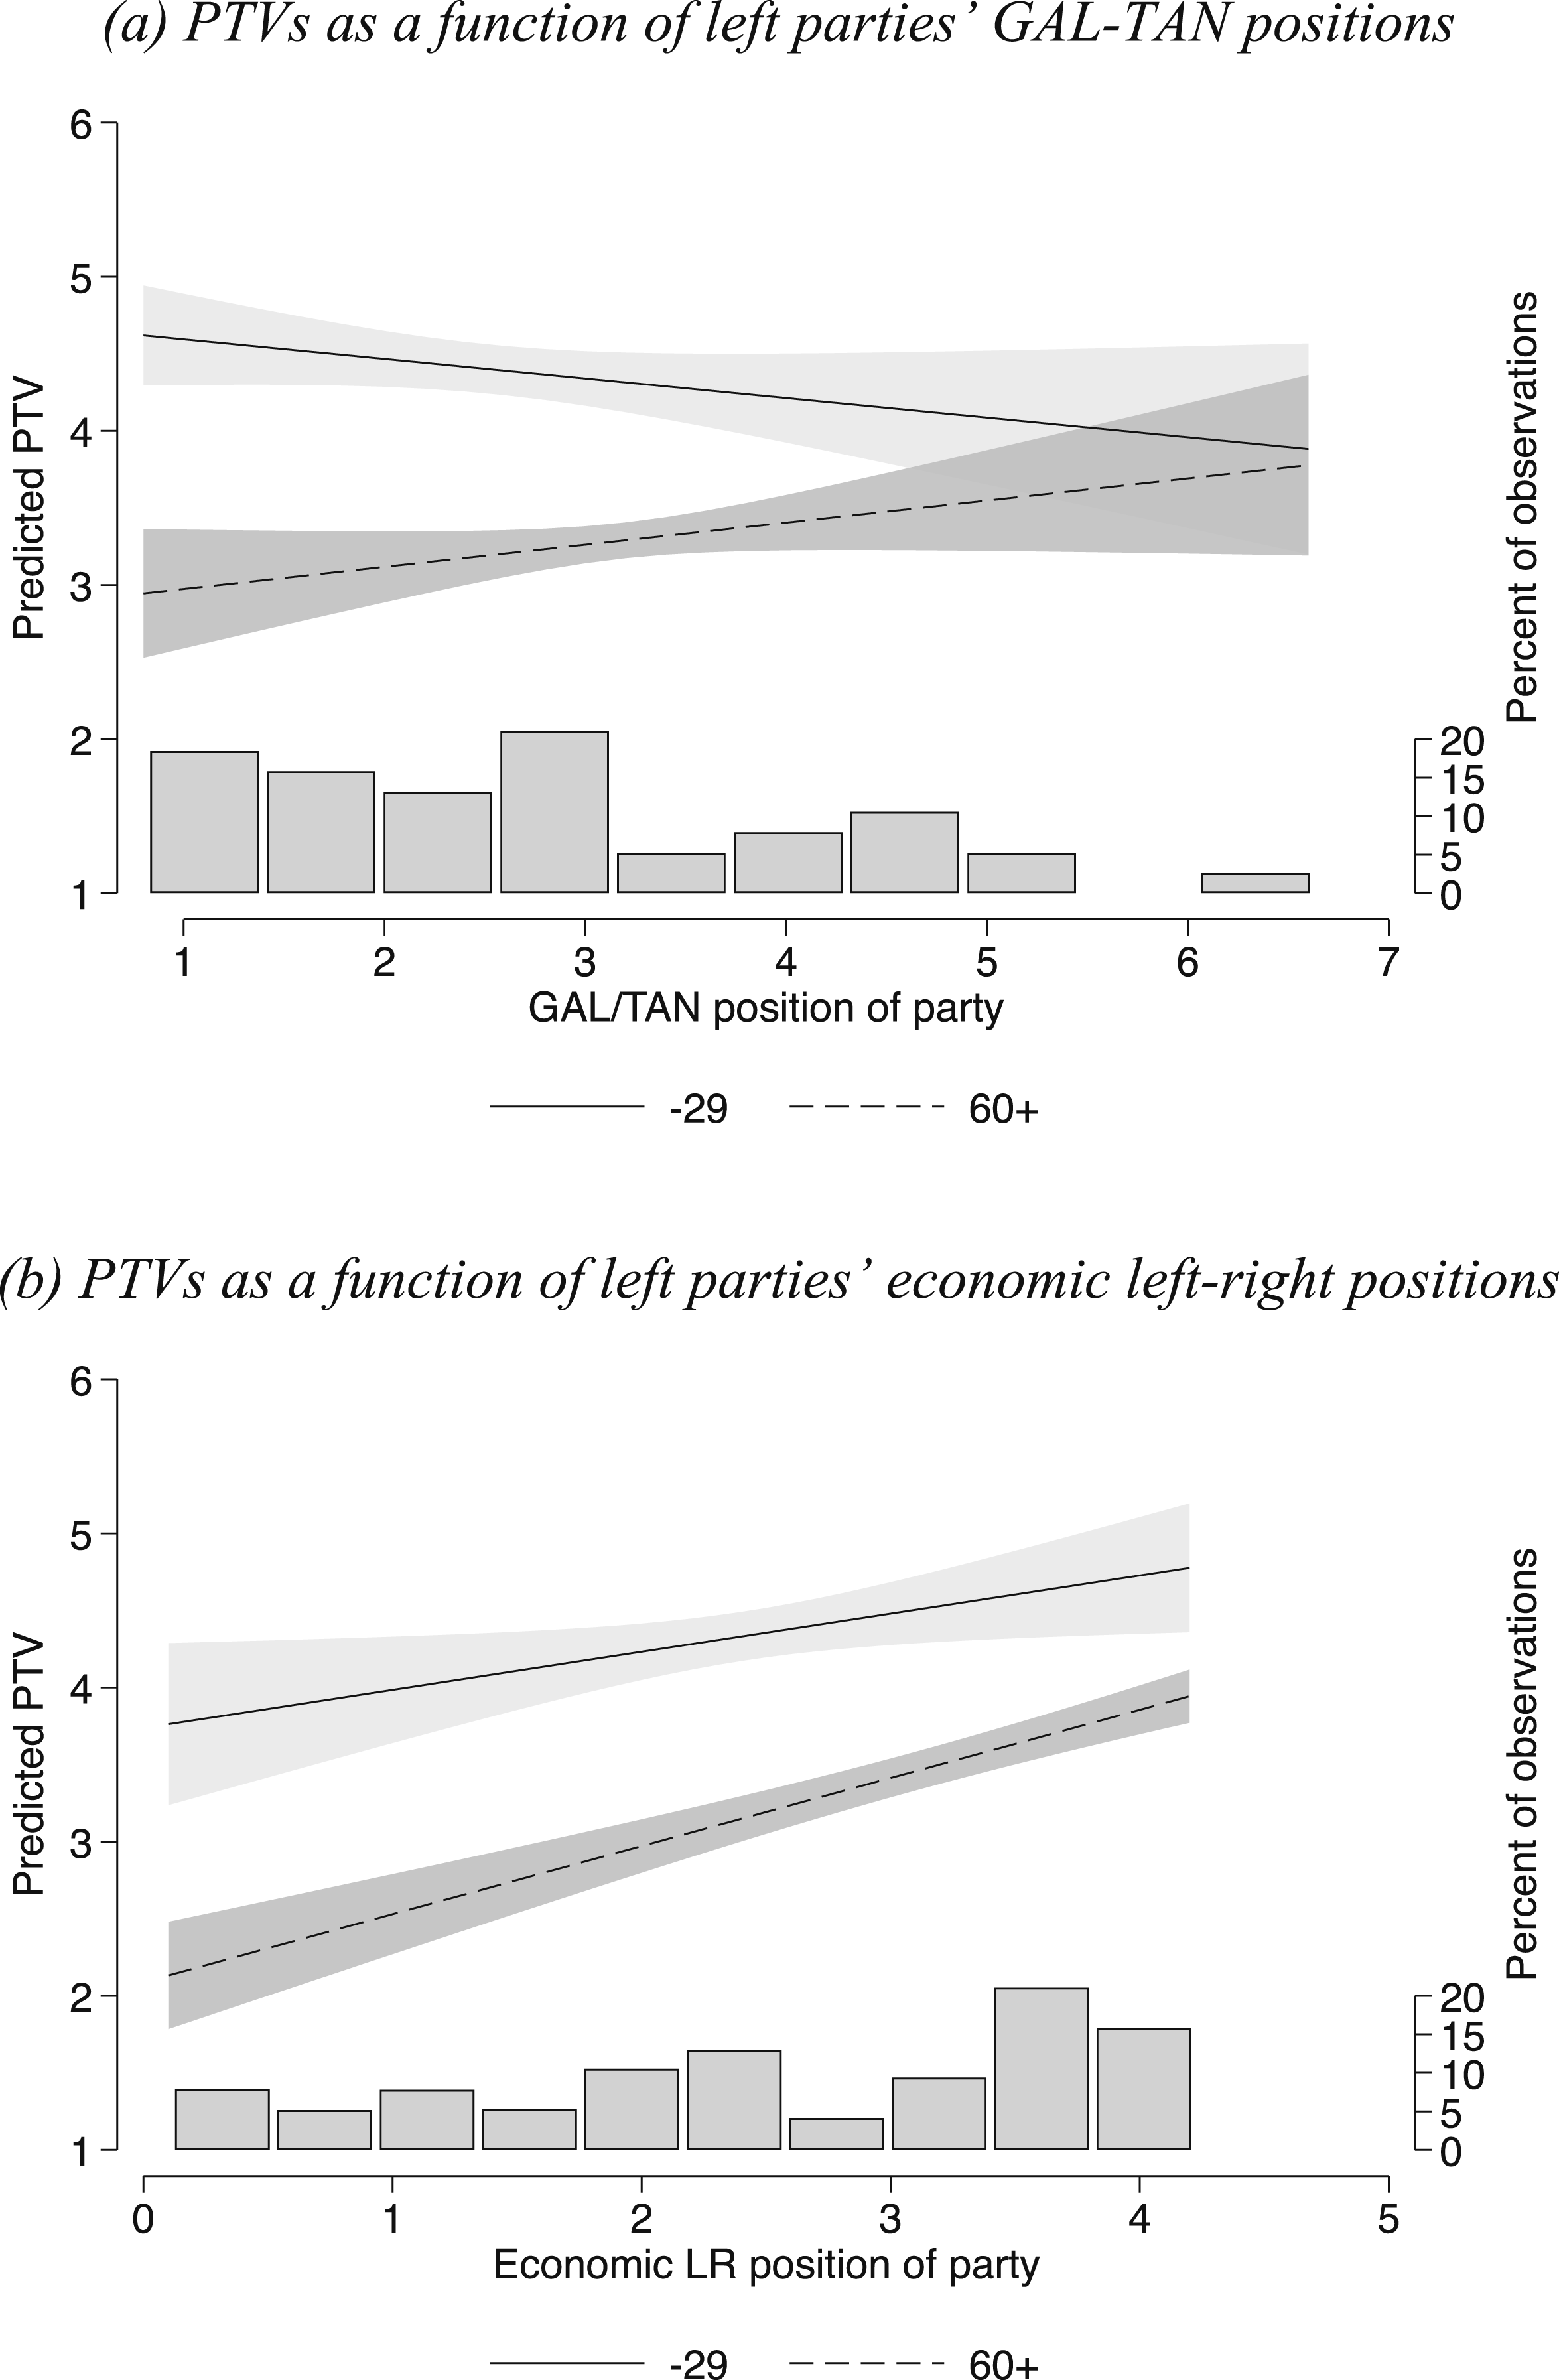
The bottom panel in Figure 3 clarifies that parties’ economic left-right positions do not substantially alter age differences in PTVs for left parties. As can be seen from this graph, both age groups tend to give higher PTVs on average to left parties that are more economically right-wing, and the gap in predicted PTVs for the youngest and oldest age group only somewhat alters across the range of economic left-right positions. Specifically, for the most economically left-wing parties, the gap in PTVs is 1.4, while it is 0.9 for the most economically right-wing parties – a difference of 0.5 points. Positions on the sociocultural dimension (GAL-TAN) thus have three times the effect that positions on the economic left-right axis have on reducing the gap in left party preferences between the youngest and oldest age groups.
Figure 4 shows the equivalent estimates focusing on PTVs for non-left parties, as a function of these parties’ GAL-TAN (top panel) and economic left-right (bottom panel) positions. For non-left parties as well, the results indicate that GAL-TAN positions are associated with strong age differences in PTVs for these parties, while age differences in PTVs are stable across the range of economic left-right positions that non-left parties take. The top panel in Figure 4 shows that the young strongly prefer non-left parties that are progressive on the GAL-TAN axis, while the PTVs among the oldest age groups do not vary as a function of the GAL-TAN positions that non-left parties take. Turning to economic left-right positions (bottom panel in Figure 4), both the youngest and the oldest age group give marginally higher PTVs to non-left parties when these parties take more economically right-wing positions. The gap in the PTVs that the youngest and oldest voters give to non-left parties, however, is small and stable across the range of economic left-right positions that these parties take. Predicted PTV for non-left parties, as a function of parties’ GAL-TAN and economic left-right positions, for young and old voters. Note: The graphs show the predicted PTV for left parties among young (solid line) and old (dashed line) voters. The shaded areas indicate 95% confidence intervals. Estimates based on OLS regression with country fixed effects and standard errors double clustered at the country and respondent levels. Detailed estimates can be found in Appendix I.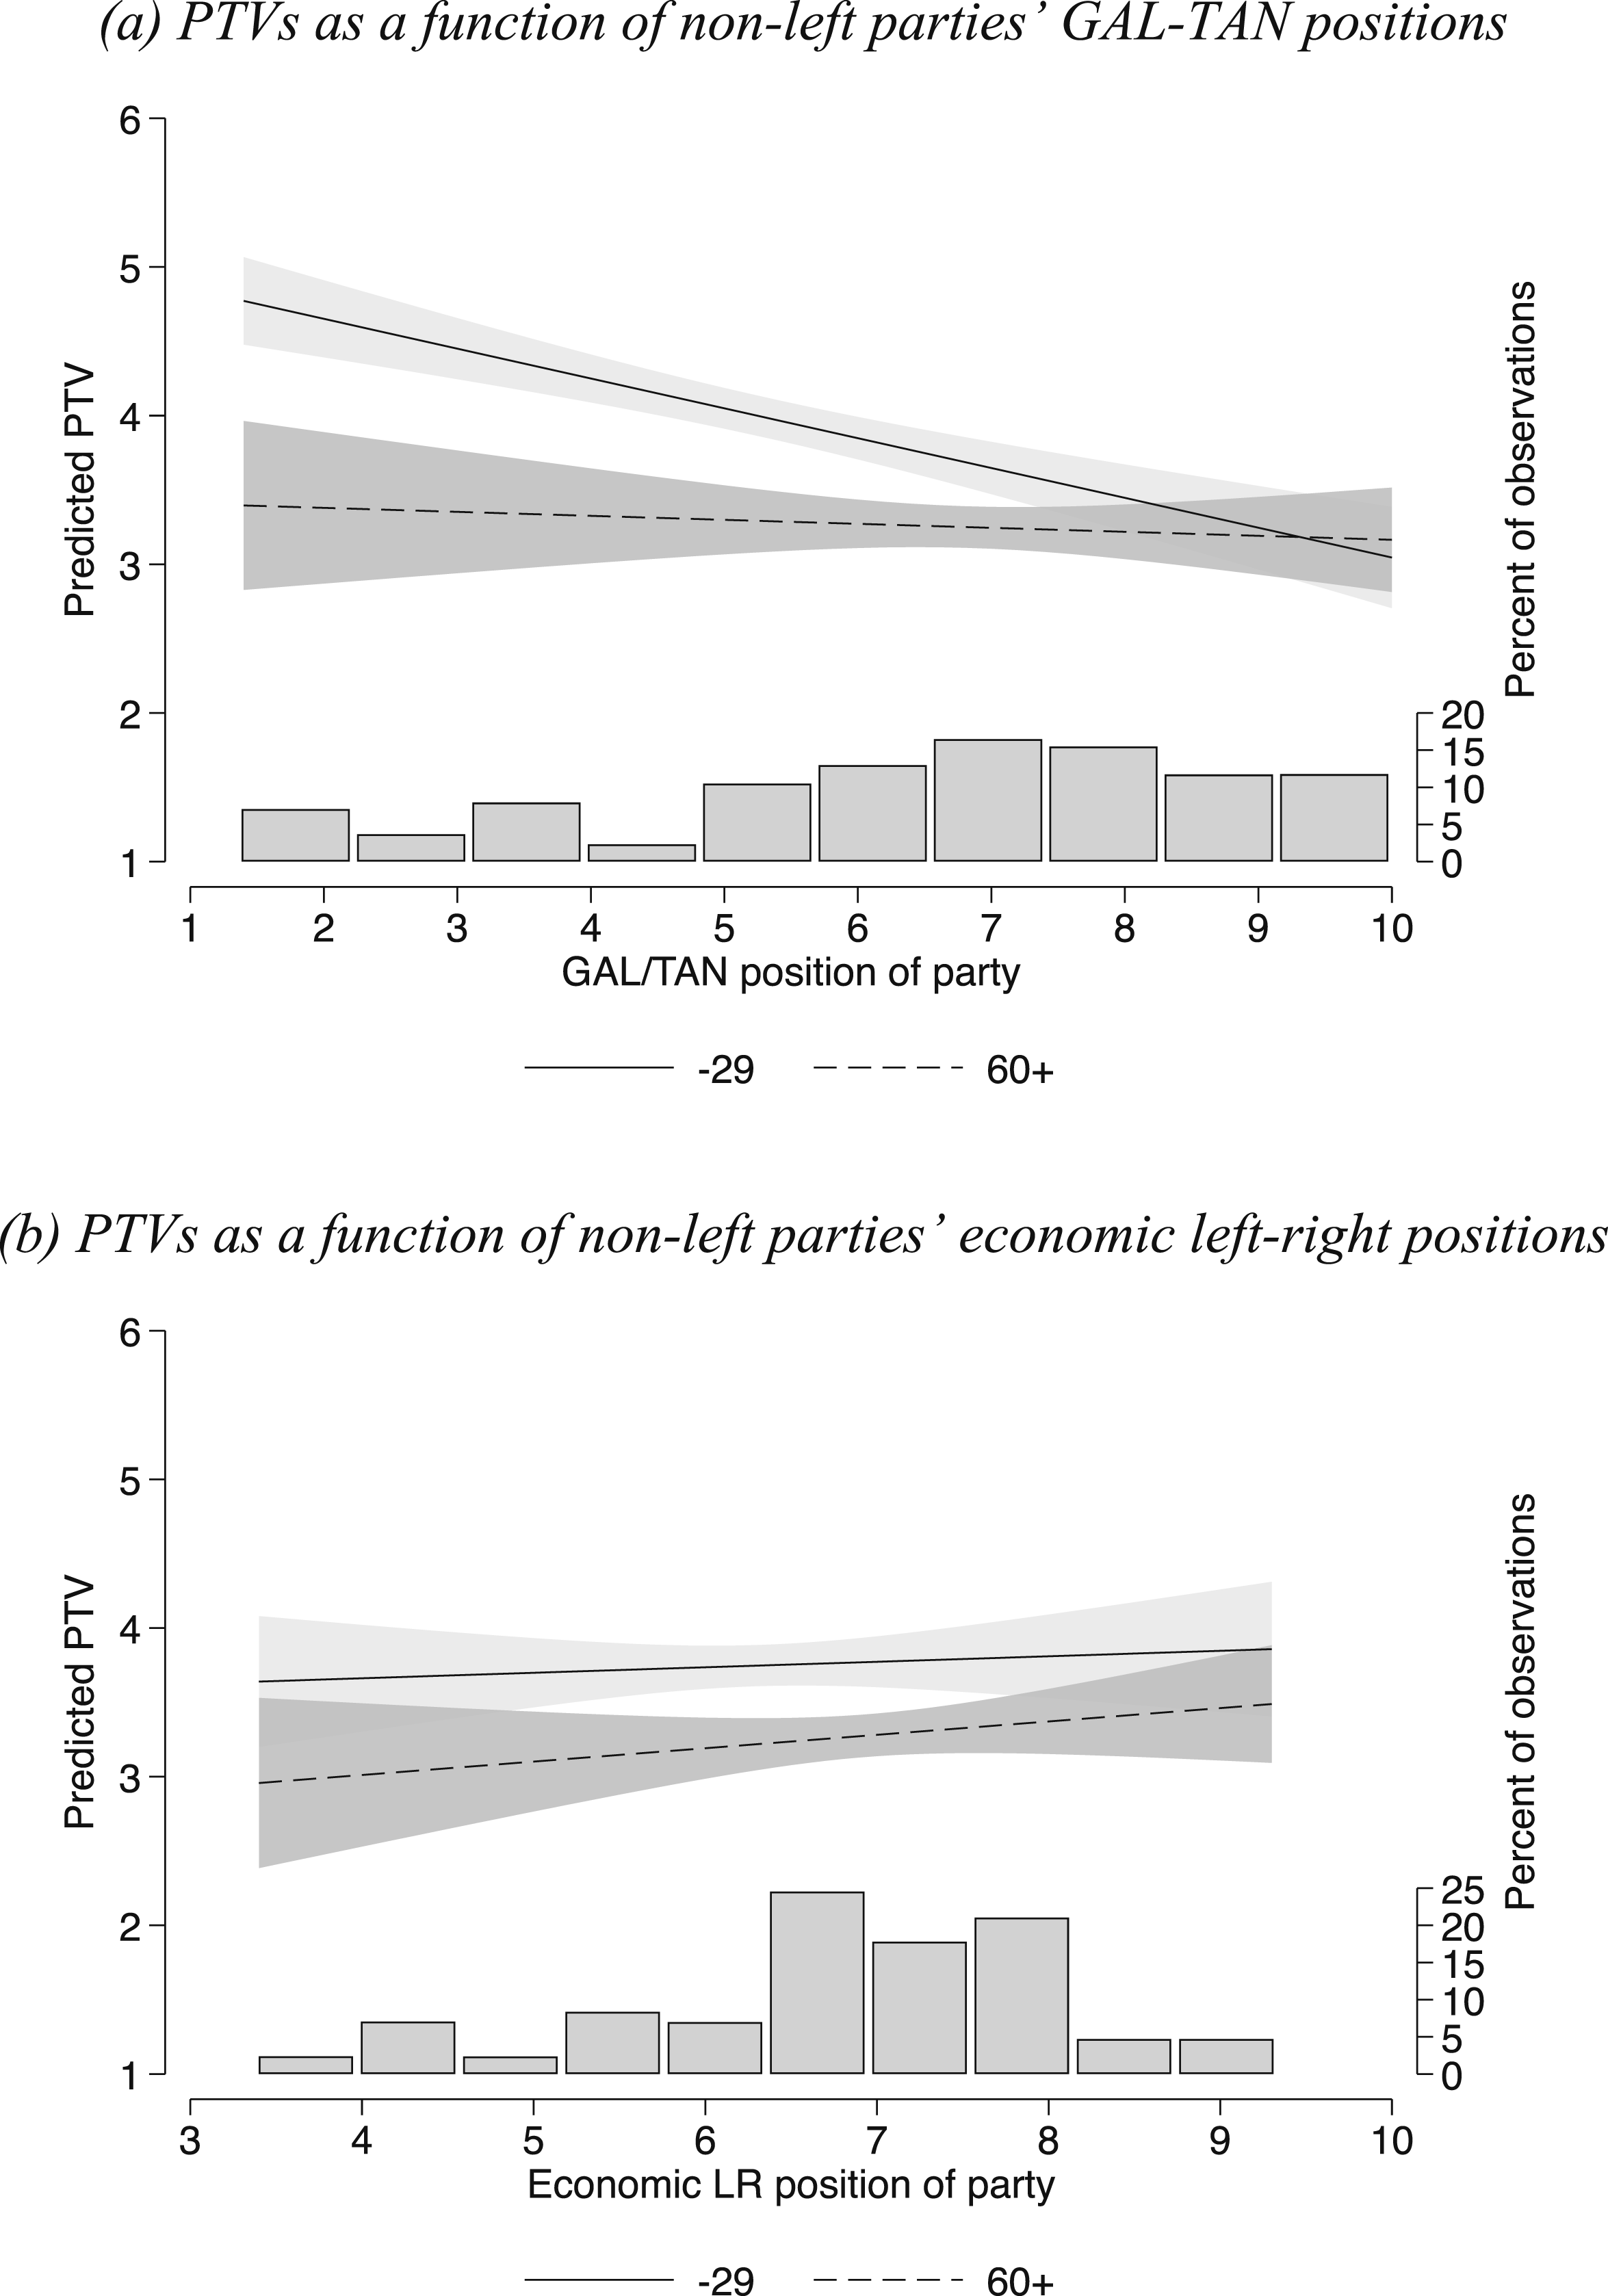
The results from Figures 3 and 4 provide important insights into the mechanisms that explain why the age gap in voting for the left is larger when left parties take more progressive sociocultural positions and when non-left parties take more conservative sociocultural positions – as we have shown in Study 1. At an individual level, what seems to be key in generating these dynamics is young voters having a strong preference for socially progressive parties over socially conservative parties. As a result, they are much more likely to vote for a left party when this party is more progressive, and they also are more likely to vote for a non-left party when this party takes a more progressive position. For older voters, we find that they are not strongly affected by the second-dimension positions of non-left parties, but they are sensitive to the sociocultural positions that left parties take and give higher PTVs to these parties when their positions are somewhat more socially conservative. As a consequence, older voters too can be expected to contribute to the narrowing of the age gap in voting for the left when left parties take more socially conservative positions.
We probed the robustness of the results of Study 2 in a number of ways. First, our preferred specification only accounts for respondents’ gender as a control at the individual level. As can be seen from Appendix J, however, the results are substantively the same when we add a control for respondents’ level of education. This Appendix furthermore shows that additionally controlling for religious denomination does not substantively affect the results. Using the EES data, we unfortunately cannot control for respondents’ racial or ethnic identity. Second, we relied on self-reported measures of respondents’ propensities to vote for different parties to gauge the association between party positions and the likelihood of supporting parties. In Appendix K, we show that our conclusions also hold when we use a dichotomous measure of the reported vote for a party rather than the PTV measures. Finally, previous work has demonstrated that younger generations have a higher likelihood of voting for parties that take positions on the new socio-cultural cleavage, with green and radical right parties in particular being more popular among this generation (Mitteregger, 2024). To verify that the results reflect differences due to the sociocultural positions that parties take and not these more general differences between different types of parties, in Appendix L we estimate models in which we explain variation in PTVs while accounting for differences between party families. Even though these results are more uncertain, they are broadly consistent with our main results.
Study 3. The Age Gradient when Left Parties Change Their Sociocultural Positions
Our results indicate that the age gap in voting for the left varies as a function of where left and non-left parties are positioned on the socio-cultural dimension (Study 1). These patterns seem to be driven by the fact that young voters strongly prefer socially progressive parties over socially conservative parties, while older voters prefer left-wing parties that are more conservative on the sociocultural dimension (Study 2). Owing to the large comparative designs that we used in Studies 1 and 2, comparing party systems and parties in a large number of countries, we cannot exclude the possibility that these associations are confounded by other characteristics of parties or party systems that explain why the young or old prefer specific parties that we do not control for in the analyses. To reduce the impact of such context-level factors, in Study 3 we hold parties constant and examine how the age gradient in support for a left-wing party alters when the party changes its position on the sociocultural dimension. To do so, we analyze the support for two left-wing parties, during a time period in which the parties substantially shifted their sociocultural position: the British Labour Party and the Danish Social Democratic Party.
Data and Methods
By focusing on the British Labour Party and the Danish Social Democratic Party, we examine support for two parties that have – in recent times – substantially changed their positions on the sociocultural dimension, but in opposite directions. This is illustrated in the top graph in Figure 5, which shows the position of both parties on the sociocultural dimension – based on MARPOR estimates for this dimension
12
– in elections since the 1980s. Circles indicate the positions of the British Labour Party, while the squares indicate the position of the Danish Social Democrats. On this scale, lower (more negative) values correspond to more progressive positions on the sociocultural dimension, while higher (more positive) values correspond to more socially conservative positions. As a result, a downward trend implies the party is moving on the sociocultural dimension to take on a more progressive position. Positions of the social democracies parties in Western democracies since 1980. Note: MARPOR estimates, based on a coding of party platforms, of parties’ positions on the sociocultural dimension. Data are restricted to the period since 1980. The bottom graph only shows changes in parties’ positions for parties that obtained at least 1% of the vote.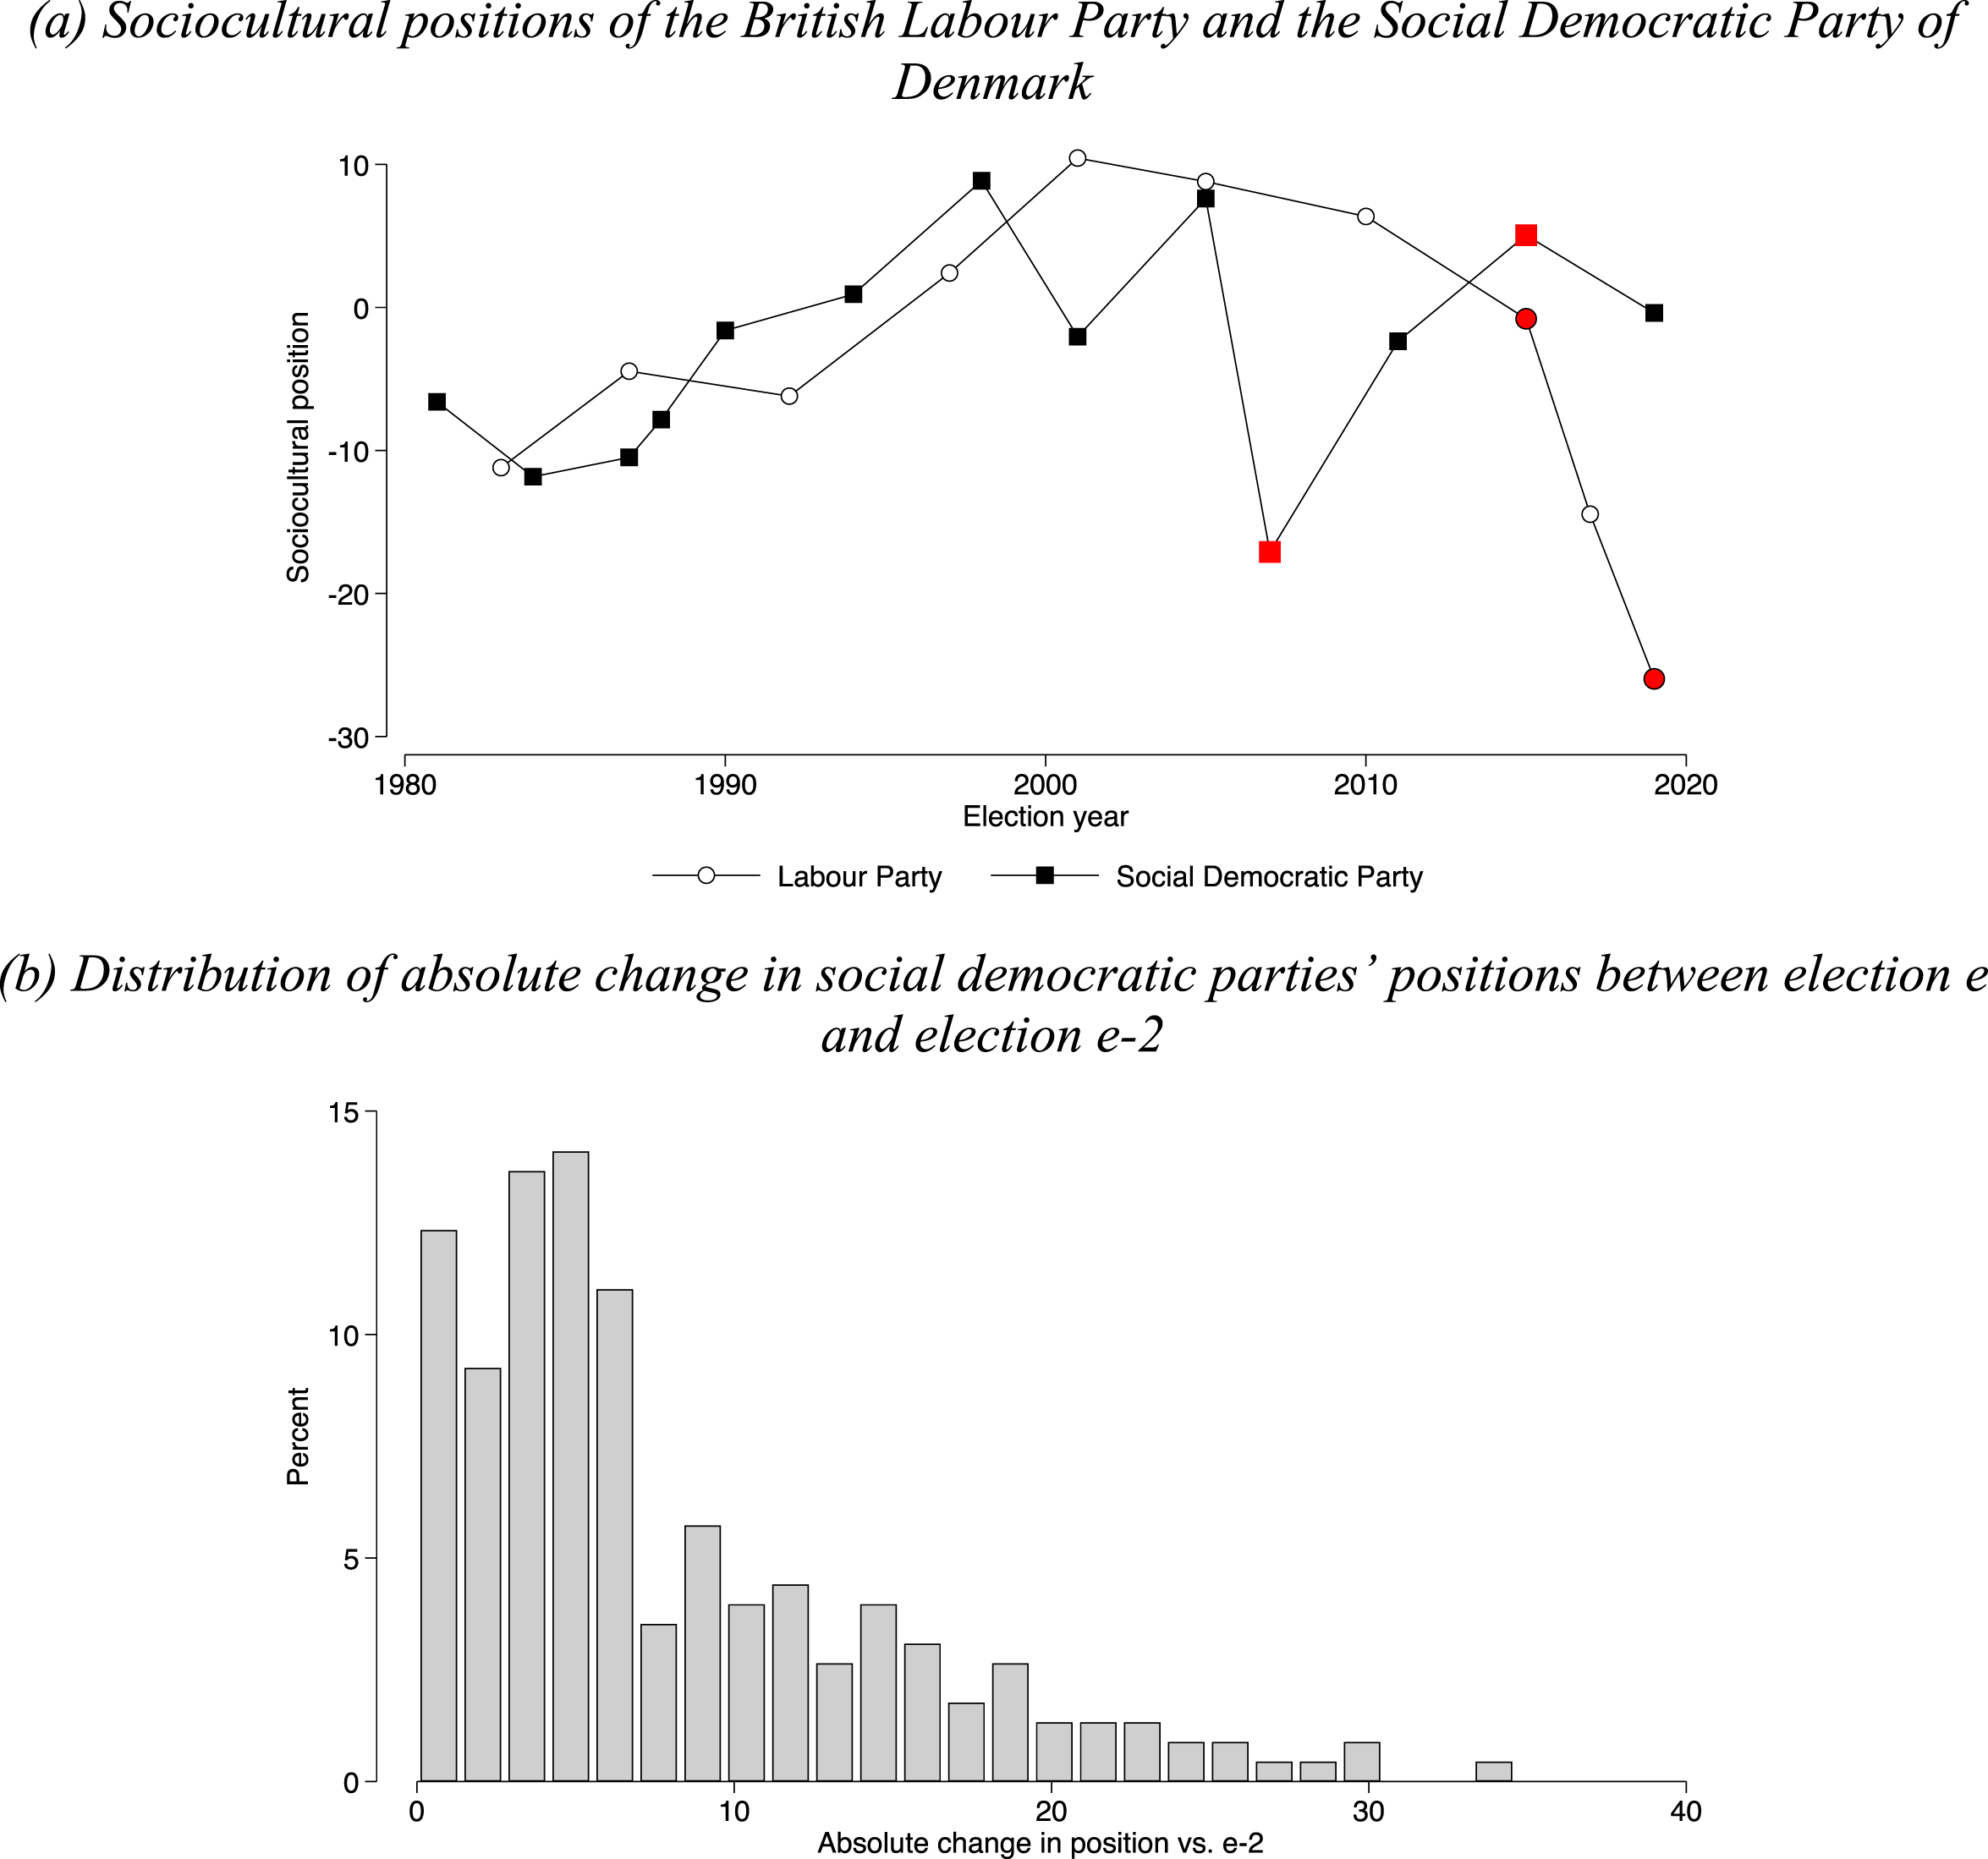
While the graph shows that the positions of both parties have fluctuated over time, in recent years both parties have moved in opposite directions – and shifted their positions strongly. For British Labour, while its position was socially conservative during the late 1990s and early 2000s, there is a strong shift towards the progressive end of the scale between the 2015 and 2019 election platforms, when the party was led by Jeremy Corbyn. The MARPOR estimates suggest a 25 point shift in the progressive direction. These two elections, which are marked in red in Figure 5, will serve as points of comparison for our analysis of the impact of British Labour’s progressive shift on the age gradient in support for the party. The Danish Social Democrats, on the other hand, had their most socially progressive platform in 2007 and have shifted in a more conservative direction since. Between 2007 and 2015, which are the points of comparison that we will use in the analyses, the party shifted 22 points in a conservative direction.
Changes of this size are quite exceptional among major political parties. This is confirmed in the bottom graph in Figure 5, which shows the distribution of absolute changes in the sociocultural positions of social democratic parties across Western Europe for a comparable time frame – contrasting positions in one election with the positions the party took two elections earlier. As can be seen from the long tail of the distribution, there are only few instances where parties change their positions more than 20 points between elections e-2 and e.
Our focus on these two parties thus allows studying the impact of large shifts in the sociocultural positions of left parties. Our interest lies in examining how the age gradient in support for British Labour and the Danish Social Democrats alters between the time points that are highlighted in red in the top panel in Figure 5.
For the British case, we rely on panel data from the British Election Study Internet Panel (BESIP), which started in 2014. We contrast respondents’ likelihood to vote Labour between the 2015 and 2019 elections, using the post-election waves from the BESIP data. 13 The panel structure allows us to assess how the same respondents evaluate Labour, as the party’s positions shifted on the sociocultural dimension. To do so, we estimate a linear probability model explaining the vote choice (contrasting voting for Labour versus another party). Our interest is in the effect of the interaction between age groups (based on respondents’ age in 2015) and the survey wave. For categorizing respondents in age groups, we use the same categories as we used in studies 1 and 2. Our expectation is that in 2019, as Labour had moved to a more socially progressive position, age differences in voting for Labour will be stronger compared to 2015. We restrict the analysis to those respondents who participated in both survey waves, to assess how age differences in the panel respondents’ likelihood of voting Labour change between 2015 and 2019. The data have a long format, with two rows (one row per wave) for each panel respondent. We cluster the standard errors by respondent. In line with how we proceeded in Study 1 and 2, we estimate parsimonious models and only include respondents’ gender as a control.
For Denmark, we do not have panel data, but use two cross sections from the Danish National Election Study. We use the 2007 and 2015 voter surveys. In each survey, we examine the association between age and voting for the Danish Social Democratic Party. We estimate two linear probability models, one for the 2007 survey and one for 2015, and focus on the effect of respondents’ age groups (using the same categories as before) on the likelihood to vote for the social democrats. The only control that is included in the estimations is respondents’ gender. Our expectation is that the the young will be less likely to vote for the Danish Social Democratic Party in 2019 – after the party had moved to a more socially conservative position – than in 2015.
Results
We first discuss the results for the British Labour Party, which moved in a progressive direction between the 2015 and 2019 general elections. The detailed estimates of our regression estimation are reported in Appendix M, and Figure 6 visualizes the results. Figure 6 plots the predicted likelihood, by age group, of voting Labour among respondents who participated in both the 2015 and 2019 post-election waves of the BESIP. The white circles indicate the predicted likelihood of voting for Labour in 2015. Comparing the predicted likelihood of voting Labour between age groups, the results show that the differences were small in 2015. The 18–29, 30–39, 40–49 and 50–59 age groups all had a probability of voting for Labour of about 33-34%. The likelihood of voting Labour was the lowest among the 60+ age group, at approximately 27%. While the oldest age group was thus least likely to vote for Labour, the differences with younger voters were limited – with a 7.2 percentage points gap in voting Labour between the youngest (18–29) and oldest (60+) age groups. Likelihood to vote for British Labour by age group in 2015 and 2019. Note: Estimates from a linear probability model explaining voting for British Labour. Full estimates are reported in Appendix M. The spikes indicate 95% confidence intervals.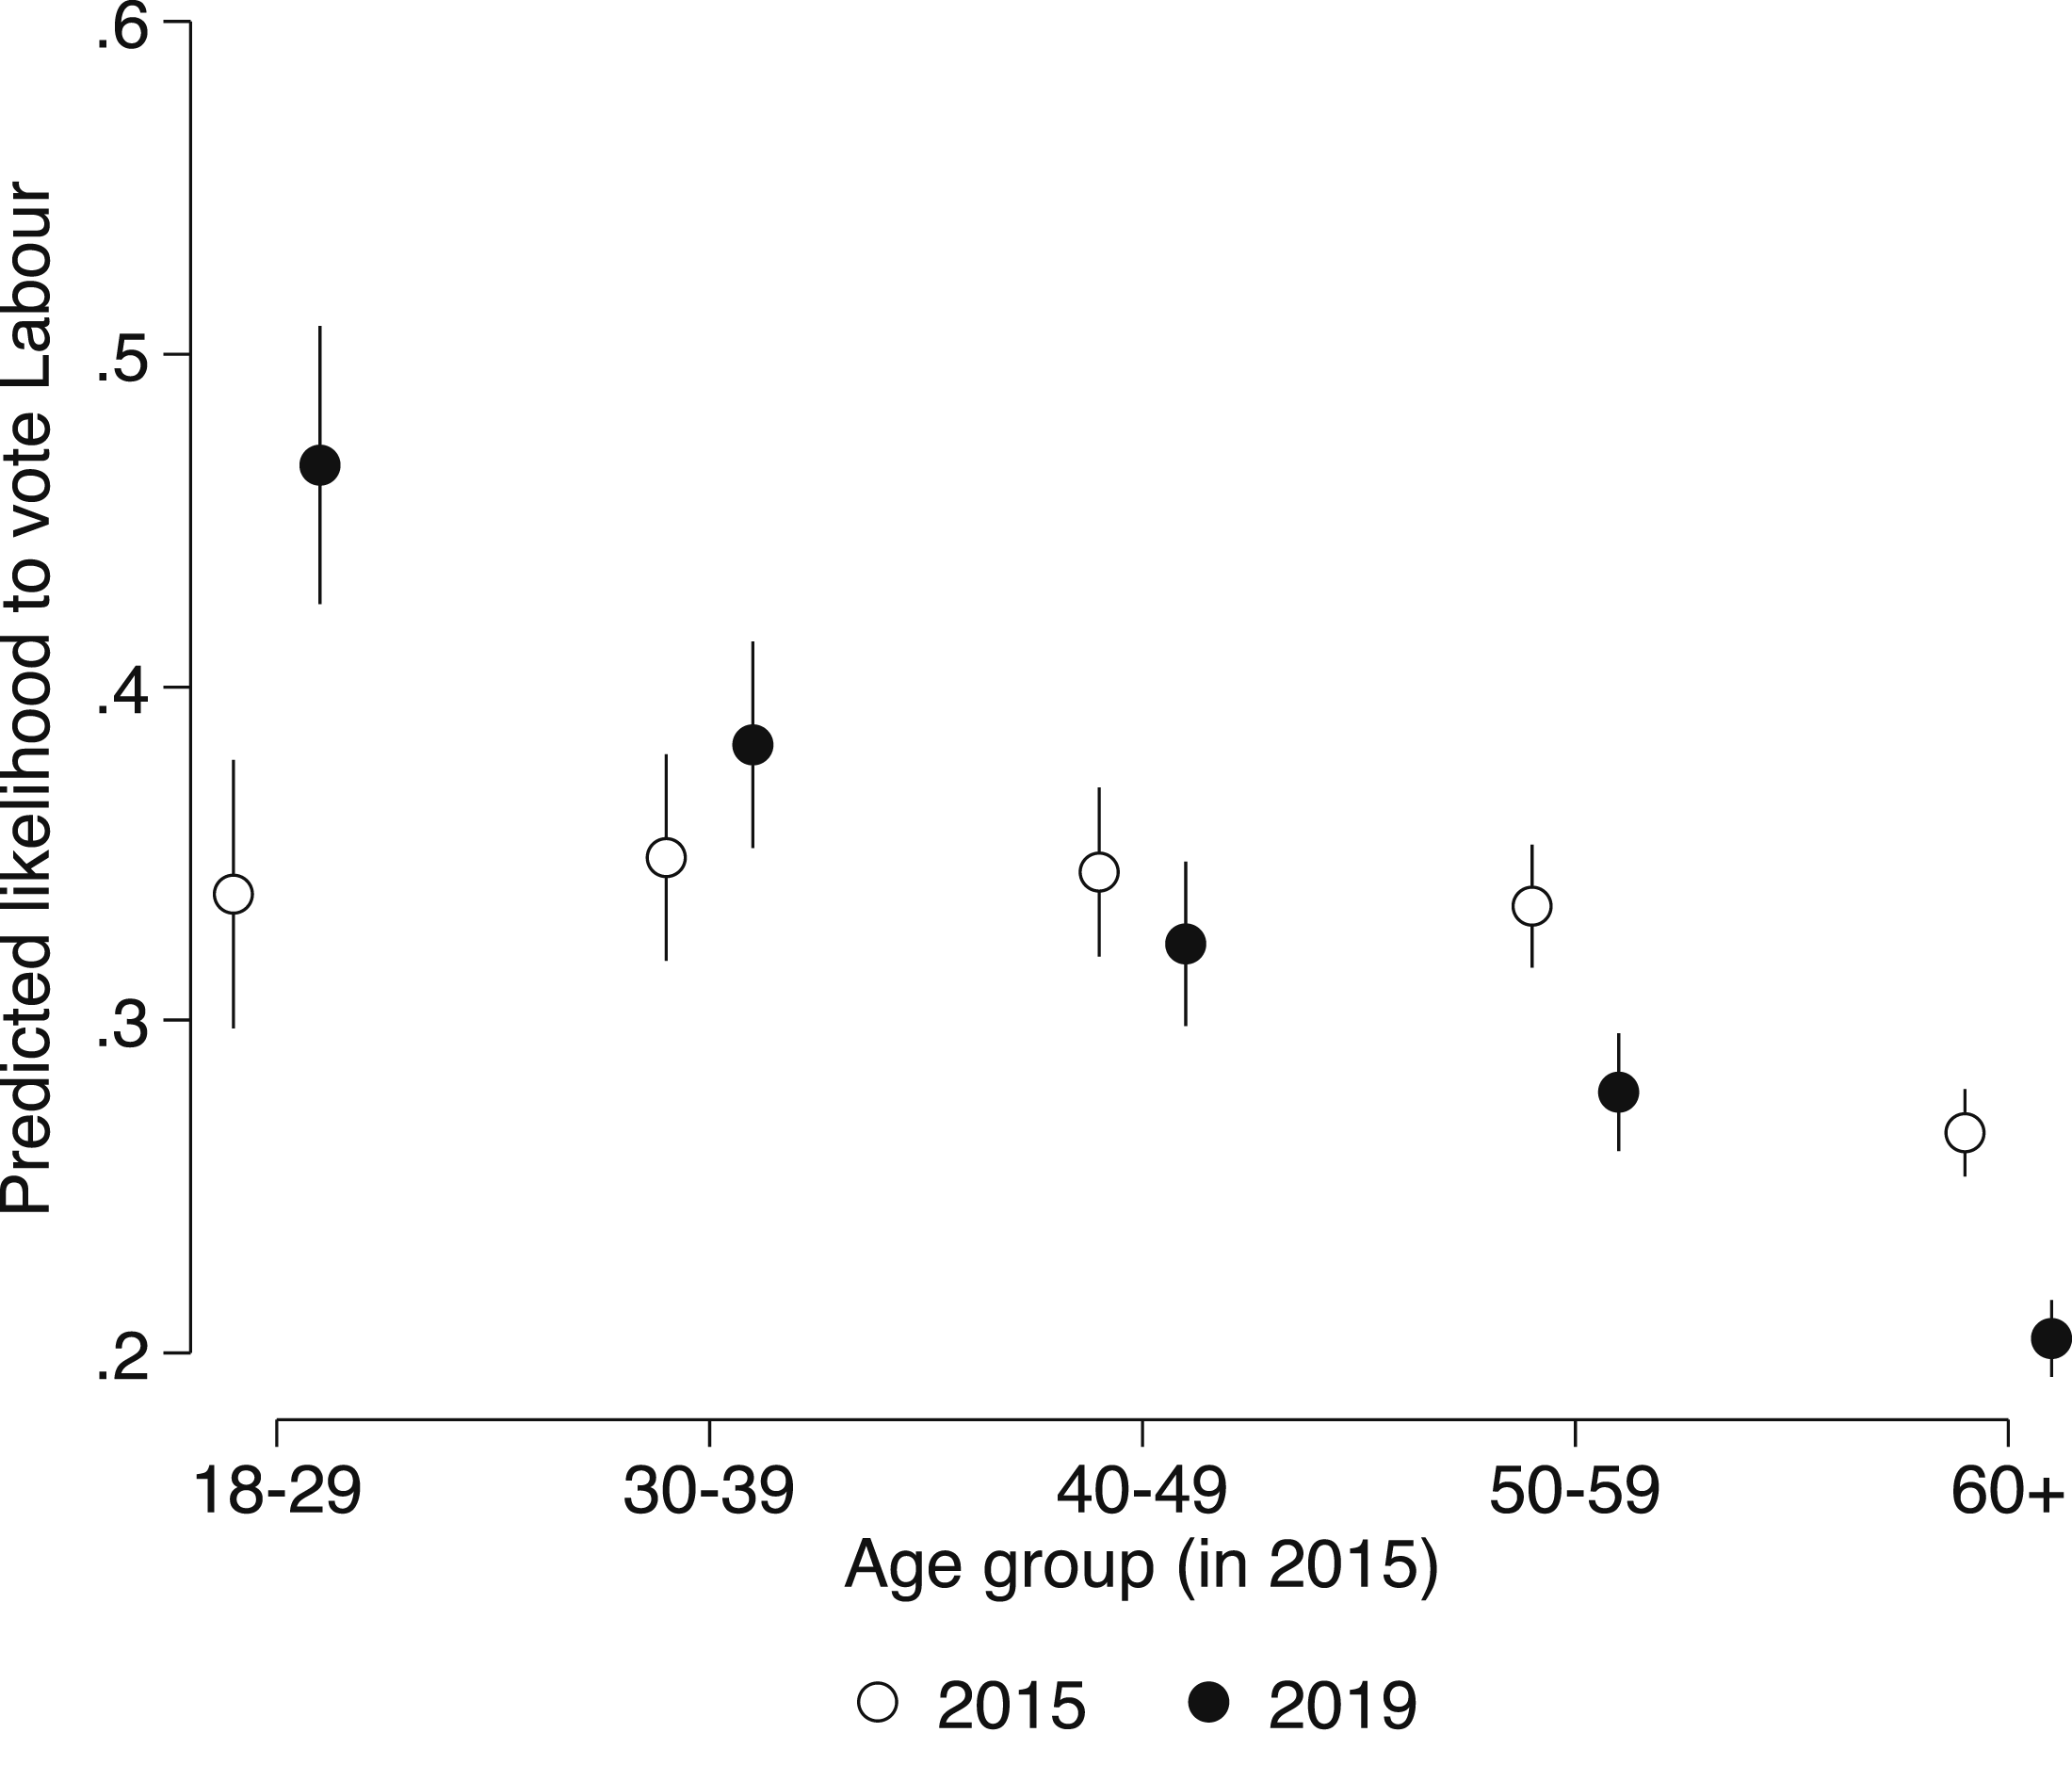
The black circles in Figure 6 show that in 2019, when the party had shifted its position to a substantially more progressive position on the sociocultural dimension, age differences in voting for Labour were significantly larger. The estimates for respondents’ predicted likelihood of voting Labour in 2019 decrease in a fairly linear fashion for each age group. The youngest age group had a likelihood of 47.7% of voting Labour in 2019, while it was only 20.4% among the oldest age group. This implies that the age gap in voting for the left was 3.5 times larger in 2019 – when Labour took a very progressive sociocultural position – than it was in 2015, when its position on the sociocultural dimension was more centrist.
The results in Figure 6 are in line with our expectation, and provide further evidence to support the hypothesis that age differences in support for the left are smaller when left parties take more socially conservative positions (H1).
One concern with regard to these results might be that vote choices in 2019 are strongly affected by Brexit identities rather than by the ideological positions of parties. Given that the young were more likely to support the Leave option than older voters (Hobolt, 2016), Brexit identities might drive the change in the age gradient of support for Labour. To account for the role of Brexit, in the Appendix we verify whether the strengthening of the effect of age on voting for Labour was already present in 2017 – when the party had already substantially shifted its sociocultural position, but when Brexit identities were still less pronounced. As can be seen from Appendix N, age differences are significantly stronger in 2017 than they were in 2015, and this effect further strengthened in 2019. The Brexit referendum does not appear to have unduly affected our findings.
Finally, Figure 7 visualizes the results from our analyses of the 2007 and 2015 Danish elections, contrasting a time when the Danish Social Democrats adopted a progressive sociocultural positions (the 2007 election) and when the party shifted to a more conservative sociocultural position (the 2015 election). The left-hand panel in Figure 7 shows the estimates for 2007, while the right-hand panel shows the estimates for the 2015 election. The estimates for 2007 indicate that, despite the party’s more progressive position at this time, all age groups had a similar likelihood of voting for the Danish Social Democratic Party – 21% for the youngest age group and about 23% for the oldest age group. When the party took a more socially conservative position, in 2015, important age differences emerged, with the oldest age group now being much more likely to vote for the party compared to the youngest age groups. Specifically, in 2015 we estimate that 18–29 year old voters only had a 14.3% likelihood of voting for the Social Democrats compared to 38.5% for the oldest age group, a substantial increase of 24 percentage points.
14
Likelihood of voting for the Danish Social Democratic Party by age group in 2007 and 2015. Note: Estimates from two linear probability models explaining voting for the Social Democrats. Full estimates are reported in Appendix O. The spikes indicate 95% confidence intervals.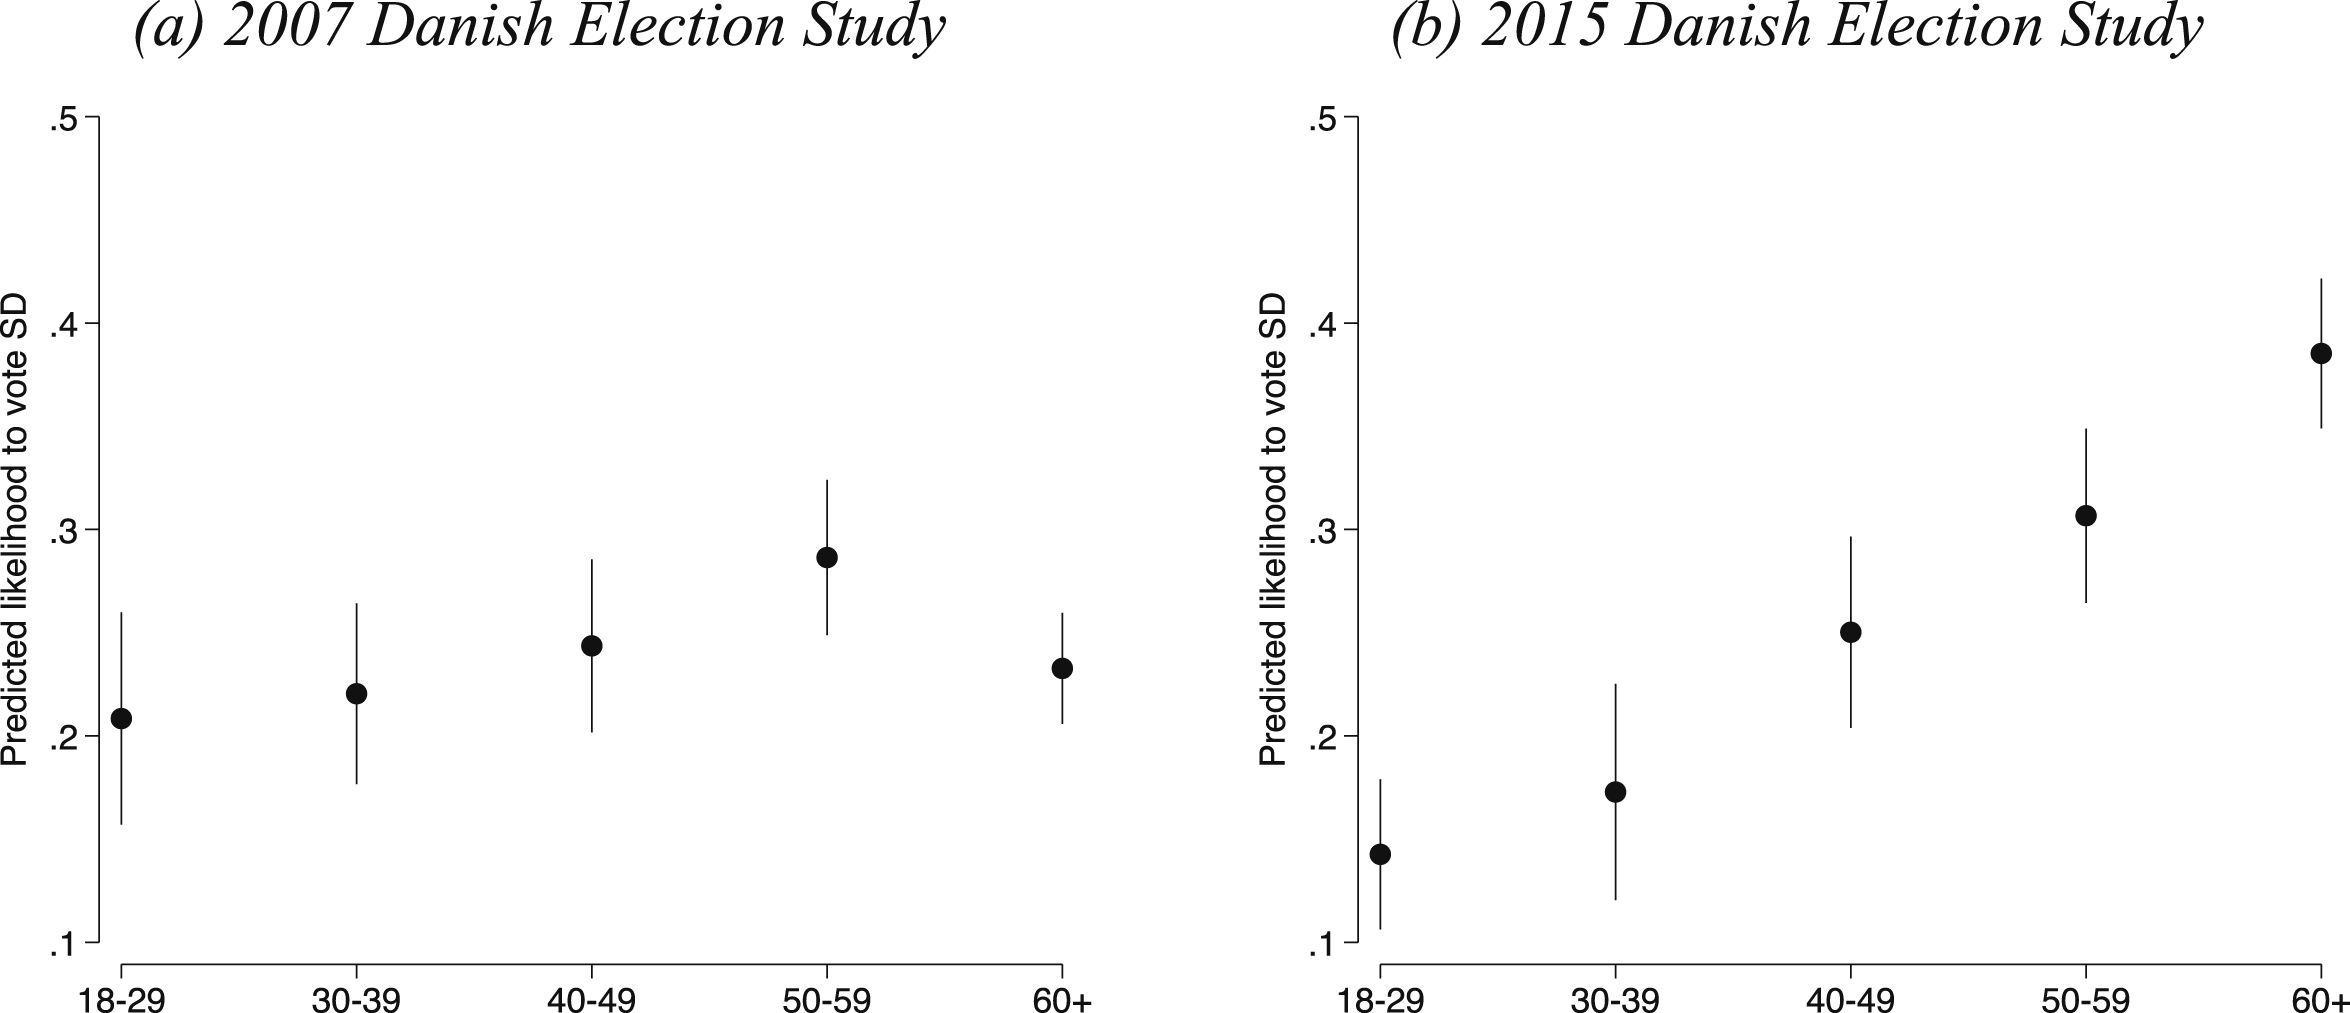
The results of our analyses of the Danish survey data therefore provide further evidence that the positions that parties – and left parties in particular – take on the sociocultural dimension structures the age gap in voting for left parties. The Danish data show that the sociocultural positions of left parties not only shape the size of the age gap in voting for the left, but also the form the age gap is taking. In most settings, the young are more likely to vote for left parties than older voters. But in some contexts, the gap is reversed – as holds for Denmark (cfr. Figure 1). Our analysis of Danish survey data suggest that this reversed age gap was absent when the main left party took a progressive stand on the sociocultural dimension, but that it became substantial when the party returned to a more conservative sociocultural position.
Our preferred specifications for explaining support for the British Labour Party and the Danish Social Democratic Party only account for respondents’ gender at the individual level. As Appendices K and L demonstrate, the estimates are very similar when we additionally control for education. Using the BESIP data we can furthermore control for respondents’ religious denomination and their ethnic background. As can be seen from Appendix M, doing so does not affect our conclusions. We also replicated the analyses of Study 3 using like/dislike ratings of these parties as an outcome variable instead of a dichotomous indicator of voting for the party. The results of these analyses are reported in Appendix P, and are consistent with those from the main analyses.
Discussion
While our findings are consistent across three different studies and using different empirical approaches, our analyses can also be challenged in a number of ways. Here, we address two important challenges: that our analyses conflate age-differences due to life-cycle and generational effects, and that by focusing solely on the role of parties’ ideological positions, we cannot exclude that alternative explanations drive the results.
First, our analyses focus on the behaviour of younger voters in recent elections. As we indicated in our review of previous research, different theoretical arguments have been made to explain age differences in voting behaviour and in the political attitudes that citizens hold. While some work argues that age differences result from life-cycle effects (Peterson et al., 2020; Tilley & Evans, 2014), others argue that differences in the extent to which the young hold progressive attitudes and values reflect a process of generational replacement (Inglehart, 1971, 2008; O’Grady, 2023). While our main focus is on theorizing and explaining context-level differences in the extent to which contemporary young voters support left parties, in additional analyses that are reported in Appendix R we separate the effects of age, period, and generational differences. By doing so, we not only gain a better understanding of the structural sources of the age gap in voting for the left, but we also shed light on the likely long term evolution of the gaps we document. That is, if the observed differences are mostly driven by the fact that members of different generations hold different attitudes and values, and not the result of life-cycle differences, the implication would be that continued generational change can fundamentally change the age-dynamics of voting for the left.
To conduct this additional analysis, we replicate the analysis of Study 1 – which is the only data set we use that covers an extended time period – while distinguishing period effects from age, and generational effects. We do so by using the WPID data since 1980. As can be seen from the estimates that are reported in Appendix R, when we simultaneously estimate how ideological positions moderate differences in voting for the left between age groups, members of different generations, and over time, generational differences appear most important. These findings suggest that the larger support of contemporary young voters for parties that take more socioculturally progressive positions reflects generational differences (Inglehart, 1971, 2008).
Second, in this paper we focused on how the ideological positions that parties take can partially explain age-related differences in party support. While the results provide evidence that is in line with our theoretical argument, we cannot exclude the possibility that other factors that are unrelated to parties’ positions also contribute to generating age-differences in support for left parties. Valence factors are notably missing from our analyses, and given that it has been argued that younger age groups have disproportionally suffered from recent crises (García-Albacete & Lorente, 2022), valence likely shapes age-differences in voting behaviour too. Without excluding the role of such factors, it is reassuring to note that the additional analyses that are reported in Appendix S and that account for the effect of political trust and economic evaluations on voting for left parties and for age-differences in these effects, still show evidence for our hypotheses about the role of party positions.
Conclusion
Contemporary narratives view age as a stronger predictor of voting – with the young voting for parties on the left and older voters for parties of the right – than at any time in the past. In 2017, the Oxford English Dictionary even made “youthquake” its word of the year to reflect this apparent change. Yet this seemingly new phenomenon shows considerable variations across the established democracies – countries with very similar social dynamics and which have been affected by external events in much the same way. In some countries, such as the Anglo-American democracies, the effects of age on the vote are considerable and represent a major disjuncture with past voting behaviour. In other countries, such as the Nordic democracies, there is no discernible effect for age on the vote. What accounts for these wide variations?
One possible explanation is lifecycle effects. However, research that has examined lifecycle effects has largely rejected it as a possible explanation, as the social and financial resources that people possess at different stages of the lifecourse have not materially changed (Geys et al., 2022; Peterson et al., 2020). A second possible explanation is generation. Generational effects are often expected these to operate in much the same way across all of the established democracies and to result in consistent changes in voting behaviour (O’Grady, 2023). The fact that there is cross-country variation rather than consistency, however, represents a significant puzzle. In this paper, we sought to address this puzzle by theorizing that age differences in voting for the left depend on the structure of party competition and on the policy positions adopted by the major parties. More specifically, when left parties adopt a progressive position on a sociocultural dimension, younger people are attracted to the political left; when parties do not align themselves on this dimension, there are no significant age differences on voting.
To test this hypothesis, we have employed three separate studies. The first study covers 22 democracies since the early 2000s, matching voting with the parties’ positions on the sociocultural dimension. The second study conducts a similar analysis to the first but at one timepoint—the 2019 European elections—and among 14 European countries. Our third study examines age differences in voting for two left-wing parties—British Labour and the Danish Social Democrats—that have moved in different directions on the sociocultural dimension. Each study has a different approach to the hypothesis but comes to the same conclusion: the age gap in voting for the left varies as a function of where left and non-left parties are positioned on the sociocultural dimension. Younger voters prefer socially progressive parties, and when the left party in a country adopts such a position, there is likely to be an age difference in voting. When a left party does not adopt such a position, age differences will be muted or reversed. In other words, party positioning structures age variations in voting for left parties.
The fact that the results are consistent across three studies that use different data sources and empirical approaches strengthens our confidence in the findings. Still, the observational nature of our data implies that we should be cautious. Even in Study 3, the fact that party position changes do not occur exogenously implies that we can not infer the causal effect of positional shifts on the age gradient in support for parties. A logical next step to test the implications of our theory would therefore be to experimentally manipulate party positions, and observe the reactions of younger and older voters to such manipulations.
Nothwistanding this limitation, our findings contribute to a better understanding of voting behaviour in the established democracies in three important ways. First, our results counter the “youthquake” interpretation of voting. Age differences may be important in some countries, but this depends on whether the party system is structured in such a way that it facilitates them. Second, much attention has been given to the argument that party systems in the Westen democracies are dealigning, through mechanisms such as declining partisanship, the rise of the populist right, or through the personalization of politics (Cameron & McAllister, 2024; Chou et al., 2021). To the extent that dealignment is occurring, it is less a consequence of changes in age than in party adapation and positioning. Third, we contribute to a growing body of literature which emphasizes the importance of party strategy and party postioning in vote-seeking (Abou-Chadi & Wagner, 2021; Dalton et al., 2011; Häusermann & Kitschelt, 2024). Party adaptation and positioning can stifle or exacerbate the electoral consequences of social changes; social changes will not themselves lead to major changes in voting behaviour.
The social stucture of Western democracies is changing, as generations move out of the electorate and new generations, with different goals and aspirations, replace them. The extent to which these social changes fundamentally change the politics, we show, rests in the hands of the political parties.
Supplemental Material
Supplemental Material - Is there a ‘Youthquake’? The Structure of Party Competition and Age Differences in Voting
Supplemental Material for Is there a ‘Youthquake’? The Structure of Party Competition and Age Differences in Voting by Ruth Dassonneville and Ian McAllister in Comparative Political Studies
Footnotes
Acknowledgements
A previous version of this paper was presented at the 2024 Annual Meeting of the American Political Science Association. We thank Armin Schäfer, Gary Marks, and panel participants for their feedback and helpful suggestions.
Declaration of Conflicting Interests
The author(s) declared no potential conflicts of interest with respect to the research, authorship, and/or publication of this article.
Funding
The author(s) disclosed receipt of the following financial support for the research, authorship, and/or publication of this article: This work was support by an Australian National University Visiting Fellowship for Ruth Dassonneville.
Data Availability Statement
Supplemental Material
Supplemental material for this article is available online.
Notes
Author Biographies
References
Supplementary Material
Please find the following supplemental material available below.
For Open Access articles published under a Creative Commons License, all supplemental material carries the same license as the article it is associated with.
For non-Open Access articles published, all supplemental material carries a non-exclusive license, and permission requests for re-use of supplemental material or any part of supplemental material shall be sent directly to the copyright owner as specified in the copyright notice associated with the article.