
Abstract
Governments across the Global South have begun introducing biometric IDs (eIDs) in an attempt to improve citizen-state legibility. While such initiatives can improve government efficiency, they also raise important questions about citizen privacy, especially for groups with a history of mistrust in the state. If concerns about increased legibility produce differential uptake or changes in political behavior, eID initiatives may exacerbate societal inequalities. In a conjoint experiment with 2,072 respondents from four Kenyan regions, we examine how perceptions of and willingness to register for eID under different policy conditions vary across politically dominant, opposition, and “securitized” (heavily policed) ethnic groups. We find meaningful group-level variation in support for specific policy features, and suggestive evidence that policies facilitating surveillance may discourage opposition political participation. Our most surprising finding, however, is that there is such broad support for expanded legibility. The promise of access to government services appears to outweigh other considerations.
Introduction
In recent years, governments across the Global South have begun to introduce digital or biometric identity cards (eIDs), in an attempt to improve citizen legibility to the state (Gelb & Clark, 2013). 1 Expanding and deepening legibility can, in principle, help states govern more efficiently and fairly, and expand citizen access to public services (Lee & Zhang, 2017). Yet eID initiatives also represent a significant expansion of state surveillance capacity, and may raise particular concerns for groups with a history of mistrust in or conflict with the state. If these concerns lead to differentially lower eID adoption among historically marginalized groups, the introduction of eIDs may ultimately exacerbate, rather than reduce, intergroup inequality in access to public goods and services. Members of certain social groups may also modify their behavior in response to expanded citizen-state legibility in ways that meaningfully affect the outcomes of political processes. Understanding these potential consequences is crucial to gain a fuller picture of the likely effects of legibility expansion in unequal societies.
In this paper, we explore the implications of eID policies for intergroup inequality by examining citizens’ perceptions of different state policies connected to the expansion of legibility, and how these perceptions vary across salient social groups. We use the example of the legally contested (and ultimately halted) roll-out of an eID system in Kenya – the Huduma Namba card program – as an entry point to help understand perceived costs and benefits of increasing citizen legibility to the state, and implications for citizen behavior. In a conjoint experiment with 2,072 citizens drawn from four regions across Kenya, we examine how features of potential policies governing the eID program – including the integration of eIDs with state security services, voting systems, taxation, public goods, and welfare benefits – affect general support for the program, intended eID uptake, beliefs about the implications of eIDs for data privacy, perceived ease of access to services, and considerations surrounding political participation. We examine differential responses to specific eID policy features among historically dominant, opposition, and “securitized” (intensively policed) ethnic groups in Kenya.
Our findings suggest broad support for the expansion of legibility via eIDs, even among members of historically marginalized groups, and even when legibility may impose costs on citizens, such as enhanced surveillance and tax collection. We hypothesized that certain eID policy features, including data-sharing to improve the quality of public services and the use of eIDs to deliver social welfare benefits, would increase support and willingness to register for eIDs, while others, including the provision of biometric data to security services to improve video surveillance, automatic tax registration, and mandatory use of eID for voter registration, would decrease support and willingness to register, particularly among opposition and securitized groups. Contrary to these expectations, we find positive or null effects for all of these potential “uses” of eID on support and willingness to register, within the full sample and among the sub-groups we examined. Kenyans appear to prefer digitalization initiatives that connect eIDs to a larger set of government functions, compared to initiatives that are more limited in scope. Despite the controversy surrounding the Huduma Namba card program, a more digitalized government appears to be seen by most as preferable to the status quo.
We do, however, find meaningful between-group variation in the effects of specific policy features on support for and willingness to register for eIDs. As expected, members of politically dominant ethnic groups were, relative to other groups, more supportive of policies that would utilize data from eIDs to improve the quality of public services (compared to eID policies not explicitly linked to public service provision). Members of these groups may be more confident they will benefit from further state investment in public goods provision. Contrary to our expectations, respondents in all sub-groups preferred policies that involve automatic data sharing with security services over policies that limit information sharing, a finding suggestive of widespread demand for more effective security provision. However, this preference was significantly weaker for the “securitized” minority group (Somali Kenyans in our sample), who may balance their demand for security against concerns about discriminatory policing.
Finally, we find suggestive evidence that policy choices in the implementation of eIDs may have important implications for political behavior. Opposition group respondents were relatively more likely to express concern about data privacy and punishment for political speech under policies that involve automatic data sharing with security services. Even if concerns about the expansion of legibility do not produce differential uptake between dominant and marginalized groups, the introduction of eIDs may contribute to political inequality if it disproportionately discourages opposition political participation. Overall, our findings highlight the need to better understand how different groups perceive expansions of state-citizen legibility, in order to prevent such initiatives from exacerbating existing inequalities.
The rest of the paper proceeds as follows: in the next section, we connect the adoption of digital and biometric identification systems to broader literature on state-building and citizen-state legibility. Next, we motivate and list our primary hypotheses about the effects of different eID policy features on citizen attitudes and behaviors and provide more detail on the Kenyan context. We then describe our survey and research design, present results from pre-registered analyses, and conclude with a discussion of the implication of our findings.
Digital IDs, Legibility, and Intergroup Inequality
The proliferation of digital and biometric identification initiatives in recent decades is the latest in a series of state-led initiatives to increase the legibility of their populations. Biometric identification uses a person’s unique physiological characteristics (biometric identifiers), such as fingerprints or facial images, to recognize this person’s identity (Jain et al., 2000). As of 2022, 120 countries had introduced passports using biometric recognition, while 70 countries had introduced eID cards. 2
Citizen-state legibility – defined by Scott (1998) as the aggregation of local practices in such a way that renders them accessible, standardized, and understandable to state administrators – is a prerequisite for many forms of state intervention (Lee & Zhang, 2017). By making it easier to track populations within their borders, verify individuals’ identities, and share data across government agencies, eIDs have the potential to make states more effective at fulfilling key functions, such as the funding, planning, and provision of public goods, the delivery of social assistance, and the maintenance of public security.
Recent studies highlight the potential for biometric identification systems to improve welfare, including by reducing “leakage” in the delivery of employment and pension benefits (Muralidharan et al., 2016), and improving patient care at government healthcare facilities (Bossuroy et al., 2019). The use of eIDs for voter registration also has been touted as a means of improving the integrity of democratic elections (Piccolino, 2015). In contexts with low state capacity, eID systems can “help link citizens to the government directly,” making it easier for them to access public goods and services to which they are entitled (Suri & Bhogale, 2019). The ability to easily prove one’s identity using biometrics can also open up access to credit and the formal economy. These individual-level benefits may be particularly important for members of historically marginalized populations who have previously been excluded due to a lack of identity documentation (Hunter & Brill, 2016).
Given the potential benefits of eIDs, particularly for citizens, critiques of digital and biometric ID programs have (rightly) focused on the risks of excluding marginalized group members. Registration for digital IDs typically requires pre-existing identity documents such as birth certificates; thus, citizens who already face marginalization due to a lack of primary identity documentation may be further excluded if this prevents them from enrolling in an eID program (Gelb & Clark, 2013). Logistical barriers to enrollment, such as insufficient biometric data quality (e.g. due to physical disability or damage to fingerprints from manual labor), poor electricity, limited internet access, and low levels of digital literacy may also lead to the disproportionate exclusion of already-marginalized groups (Khera, 2017; Rao, 2019). As governments increasingly integrate eIDs into basic state functions, exclusion from digital ID systems could further limit access to public services and benefits. Thus, if measures to prevent exclusion errors are left unaddressed, the digital transition may have the effect of exacerbating, rather than ameliorating, societal inequality.
Less well-studied to date are the potential costs to citizens of inclusion in eID schemes and of being made more legible to the state. In less democratic regimes, citizens may be concerned about the use of their data for targeted surveillance, which may ultimately discourage political participation (Eck et al., 2021). They may also be concerned about the security of their data, particularly where trust in institutions is low. Some costs to individuals are by design. Indeed, one of the most important ways in which legibility underpins the state’s “infrastructural power” (Mann, 1984) and facilitates the provision of public goods is by increasing its extractive capacity and ability to limit fiscal free-riding (Lee & Zhang, 2017). Citizens may resist what they see as an effort to increase their individual tax burdens, particularly if they do not expect to benefit from state expenditures (Scott, 1998).
These costs – real or perceived – may in turn affect citizens’ willingness to register for eIDs in the first place. As Szreter and Breckenridge (2012) write, taking a historical perspective, “[state] registration systems frequently fail to persist without the voluntary cooperation of those being registered” (p. 19). Digital IDs are no exception. Limited uptake by citizens has proven a barrier to the success of eID initiatives, including in relatively high-capacity states in the Global North (Domeyer et al., 2020). Not only does the potential for citizen reluctance present a challenge to state capacity-building efforts, but it may also have important implications for societal inequality, if perceptions of the costs and benefits of legibility differ across societal groups. Understanding how citizens view potential costs and weigh them against potential benefits in deciding whether to take-up new eID systems, is crucial for understanding the prospects for their success in improving public goods provision and access, and their implications for inequality.
Even absent differential uptake, digital identification may exacerbate political inequality if concerns about privacy and surveillance disproportionately reduce political participation among opposition or otherwise marginalized groups. Recent work by Allie (2022) highlights this concern, finding that the use of facial recognition technology at polling stations in Telangana, India reduced voter turnout in areas with larger shares of Muslim residents. Our study complements existing work by focusing squarely on the potential for and implications of differential uptake of and support for a contentious digital identification (eID) program in contemporary Kenya. The next section presents our theoretical argument on how citizens react to an expansion of legibility as well as the resulting hypotheses.
Hypotheses
Previous work on identity registration has emphasized both benefits and costs to individuals of being made legible to the state. On one hand, identity documentation provides a form of recognition, empowering citizens to exercise rights, make material claims on the state, and participate in the formal economy (Hunter & Brill, 2016; Szreter & Breckenridge, 2012). Greater legibility can also enable the state to provide public goods more effectively (Lee & Zhang, 2017). On the other hand, Scott (1998) and Foucault (1991) emphasize the coercive nature and extractive motivations of previous state attempts to extend and deepen legibility.
Following these competing accounts, we hypothesize that support for and willingness to opt into eID will vary according to different policy features that carry costs and benefits of enhanced legibility resulting from digitalization. Further, drawing on theories of ethnic politics, we expect different groups of citizens to react differently to these policy features, depending upon their pre-existing orientations toward state power, with potentially stark implications for intergroup inequality.
We use variation in the design of hypothetical but realistic eID policies to understand citizen attitudes toward eIDs for two primary reasons. First, doing so allows us to isolate specific concerns and expectations citizens may have about the effects of eIDs. As the contrasting perspectives in the literature on legibility highlight, greater legibility can facilitate a range of actions by the state, some of which may be considered beneficial to citizens (e.g., easier delivery of government benefits) and some of which may be considered costly (e.g., easier surveillance). Asking explicitly about potential actions the state may take as it pursues digitalization, rather than merely soliciting opinions about digitalization efforts in general, can help us better understand the drivers of public opinion and behavior.
Second, there is active debate among policymakers – in Kenya, the context we study here, and more broadly – about the appropriate uses of eIDs and the regulations that should accompany their roll-out. Understanding the likely consequences of particular policy options for eID uptake and citizen attitudes toward eIDs is important in and of itself. For example, if we expect citizens to oppose or opt out of eIDs due to data privacy concerns, it is important to know whether policies intended to mitigate these concerns (such as requiring permission from individuals to share their data for specific purposes) will in fact do so, and for whom.
Below, we present pre-registered hypotheses about the effects of different policy features on support and willingness to register for eIDs in general, and for specific groups.
Costs and Benefits of Legibility
Theories emphasizing potential benefits of eIDs for citizens mostly point to more efficient access to social transfers and improving the ability of government to deliver higher-quality public services. Hunter and Brill (2016) argue that citizen legibility leads to inclusive social protection by the state. Studying the drivers that lead countries to improve state legibility, and in particular birth registration, they argue that “state development occurs as a result of the state’s own understanding of its imminent needs.” Hunter and Brill offer evidence that political incentives for governments to implement social welfare programs, such as conditional cash transfers (CCTs), create a practical need and increase citizen demand for birth registration. Citizen-state legibility improves as birth registrations allow citizens to access government transfers and create benefits for governments in the form of electoral approval. Following this line of argument, we expect that citizens will be more positive towards eID initiatives if they are linked to social protection transfers.
H1: Citizens will be more likely to prefer, support, and register for policies that link digital IDs with social protection transfers than policies that do not.
Lee and Zhang (2017) argue that increased citizen-state legibility—which they define as “the breadth and depth of the state’s knowledge of its citizens and their activities” (p. 118)—improves the efficiency of tax collection (by curbing fiscal free-riding) and, consequently, leads to improvements in public goods provision. They offer cross national evidence linking more accurate census data (their measure of legibility) with higher tax revenues, lower mortality and higher literacy rates. Overall, this argument highlights that a state can improve the quality of services the more information it has on its citizens. We therefore expect that citizens will, on average, be more supportive of eID initiatives if they are linked to improved quality of public services.
H2: Citizens will be more likely to prefer, support, and register for policies that link digital IDs with improved quality of public services than policies that do not.
Scott’s (1998) more pessimistic account of legibility emphasizes state attempts to increase central control and monitoring capabilities at the expense of local and individual freedoms. Shirk (2019) claims that the modern state has responded to violent uprisings by enhancing capacity for surveillance, for instance, by creating centralized biometric databases. While citizens may be willing to accept some surveillance in return for welfare and security (Weller, 2012), general trust in the “security of centralized repositories of information” (p. 63) has declined, especially in less democratic regimes. We therefore expect that citizens will be less favorable toward eID initiatives if they are linked to security and surveillance:
H3: Citizens will be less likely to prefer, support, and register for policies that link digital IDs with security and surveillance than policies that do not.
While citizens value state efforts to improve social welfare, they often fear state attempts to put tax burdens on them (Scott, 1998, p. 65). Especially in those states where trust in public institutions is low, people are less willing to entrust the state with matters of income redistribution (Garcia & Von Haldenwang, 2016; Habibov et al., 2018). We therefore expect that citizens will be be less inclined to support eID initiatives if they are linked to taxation.
H4: Citizens will be less likely to prefer, support, and register for policies that link digital IDs with automatic tax registration than policies that do not.
Any state requires a reliable list of citizens eligible to vote in order to hold elections (Piccolino, 2015). In many developing countries, a lack of state capacity is associated with incomplete voter rolls and biometric technology has been “heralded as a possible solution” (Piccolino, 2016, p. 498). However, the technology itself may not prevent vote rigging, and may even facilitate centralized electoral fraud. For instance, Kenya’s 2017 elections were annulled by the Supreme Court due to flaws in the electronic voting transmission system. In many countries where technology is introduced to improve electoral processes, the technology itself remains a “black box” and may decrease voters’ confidence in the integrity of elections (Odote & Kanyinga, 2021). We therefore expect that citizens will be less supportive of eID initiatives if they are linked to voter registration.
H5: Citizens will be less likely to prefer, support, and register for policies that link digital IDs with voter registration than policies that do not.
Group Heterogeneity
We expect preferences, support, and willingness to register for eID to vary across different societal groups. Specifically, we expect that historically dominant ethnic groups will vary in their attitudes toward different policy features compared to historically marginalized groups. We consider two distinct types of marginalized groups’ relations with the state: (1) “opposition groups” and (2) “securitized groups,” and compare their responses to those of politically dominant ethnic groups. We conceptualize opposition groups as those that have attempted but failed to secure control of the government at the national level and securitized groups as those disproportionately policed by the state, e.g. for (stated) reasons of national security. 3 In general, while we expect dominant groups to be more supportive of those policies promising direct and indirect benefits, we expect members of opposition and securitized groups to be more skeptical that they will receive promised benefits, and more sensitive to potential costs.
Scott (1998) argues that any society is likely to create legibility in a way that mostly benefits “those …who have the knowledge and access to easily decipher the new state-created format” (p. 78). Indeed, social and political ties to those in government appear to be an important factor explaining whether people benefit from state initiatives (Burgess et al., 2015; Ferrali et al., 2022; Kramon & Posner, 2016). Citizens from historically dominant ethnic groups may therefore be more confident that they, or their communities, will benefit from state efforts to improve public goods and social welfare provision through digitalization. As such, we should expect dominant ethnic groups to more strongly prefer policies that explicitly link digital IDs with social protection transfers or improved quality of public services than citizens belonging to other groups.
H6a: Members of historically dominant ethnic groups will be more supportive of policies that link digital IDs with social protection transfers than members of other groups.
H6b: Members of historically dominant ethnic groups will be more supportive of policies that link digital IDs with higher-quality public services than members of other groups.
In their attempts to simplify complex social realities, states may expand legibility in ways that harm minority groups Scott (1998). Especially when the state considers particular minority groups to be a threat, legibility may be harnessed for central monitoring and control of these groups (Kam & Clarke, 2021). We therefore expect that securitized ethnic groups will be particularly wary of state usage of digital IDs for purposes of security and surveillance.
H7: Members of historically securitized ethnic groups will be less supportive of policies that link digital IDs with state surveillance than members of other groups.
The registration of voters can be used as an instrument to alter political outcomes, if designed in such a way that the state can intervene in opposition-leaning areas (Slater, 2008). The linking of digital IDs to voter registration may increase the state’s ability to engage in targeted election interference. We therefore expect that opposition ethnic groups will be less favorable toward policies that link digital IDs with voting.
H8: Members of historically opposition ethnic groups will be less supportive of policies that link digital IDs with voter registration than members of other groups.
We pre-registered two additional hypotheses about attribute-level interactions to capture potential trade-offs between perceived costs and benefits. First, we hypothesized that among members of the securitized group, the effects of promised benefits on policy selection, support, and willingness to register would be less positive for policies using digital IDs to facilitate greater state surveillance. In other words, when digital IDs are expected to be used to bolster the state’s security apparatus, securitized group members will be less positively persuaded by the potential for digital IDs to improve access to public goods and welfare programs. Second, we hypothesized that among members of historical opposition groups, the effects of promised benefits on policy selection, support, and willingness to register would be less positive for policies that link digital IDs with voter registration. These hypotheses are implicitly provisional, in that they assume that the main effects of policies identified ex ante as costs and benefits move in opposite directions for these subgroups. 4
We now turn to a discussion of our study’s research setting and the design of a policy conjoint experiment that highlights potential costs and benefits of biometric identification to a diverse sample of Kenyan respondents drawn from social groups with very different historical experiences in their interactions with the state.
Research Context
In 2019, the Kenyan government introduced a new biometric National Integrated Identity Management System (NIIMS) known as Huduma Namba (“service number” in Swahili), with the goal of centralizing and digitizing identity documents. The initial roll-out began without a clear legal framework for data protection in place, however, leading to a ruling by the Kenyan High Court in January 2020 that ordered a halt to the program until these were established (Privacy International, 2020). In November 2020, the government resumed its registration drive for Huduma Namba. These efforts were again stopped by the High Court, which ruled in October 2021 that data collection under NIIMS violates the Data Protection Act (Privacy International, 2022). Huduma Namba registration has not resumed since.
Revised legislation to govern Huduma Namba under consideration at the time of our survey would have made Huduma Namba the only valid proof of identity in Kenya, imposed fines for citizens who failed to sign up, directed Kenya’s electoral commission (Independent Electoral and Boundaries Commission) to base the national voting register on Huduma Namba, and enabled the Kenya Revenue Authority to access the NIIMS database to facilitate tax collection (Macdonald, 2022). This proposal met with criticism in the media and by civil society organizations, who raised concerns that the NIIMS would exclude those who did not register for Huduma Namba from services and even risks inducing statelessness among some non-registrants. The main critique is that identity documents, such as a birth certificate or national identity card, are needed for registration, but are difficult to obtain for marginalized communities in Kenya. Mutung’u and Rutenberg (2020) warn of particular risks of statelessness for Nubian and Somali communities. Although the bill proposed vetting committees to help these communities to obtain legal documentation, the criteria for recognizing a person as a citizen remain unclear (Manby, 2021).
As such, at the time of this writing and at the time our survey took place, there is currently no national biometric identification system in place in Kenya, proposals to institute one have been contentious, at least in elite circles, and specific concerns about the potential for exclusion of already marginalized groups have been raised in the public discourse. We know relatively little about the attitudes of ordinary Kenyans toward digital or biometric identity initiatives. What we do know is that the attempted roll-out of Huduma Namba has taken place during a period of highly charged political competition along ethnic lines.
In this paper, we examine politically dominant, opposition, and securitized group reactions to state attempts to expand citizen legibility through the attitudes and beliefs of Kikuyu and Kalenjin (dominant), Luo (opposition), and Kenyan Somali (securitized) survey respondents. In Kenya, ethnic groups tend to be geographically concentrated and access to public goods and services have historically been dependent on relationships with political leaders (Bates, 1974). The Kikuyu and Kalenjin are classified as dominant because these ethnic groups have held the presidency since Kenya’s independence, have been dominant in Kenyan national politics more generally, and have historically benefited the most from state patronage (Burgess et al., 2015; Kramon & Posner, 2016). The Luo are classified as an opposition group because they have repeatedly attempted but failed to secure the presidency, or form part of the dominant political coalition during this period. Somali Kenyans are classified as securitized because the government has disproportionately targeted them for surveillance and policing, particularly in the past decade. 5 Refer to Section A.1 for further details on this historical context.
Design
Sample
We conducted a face-to-face survey of Kenyan citizens aged 18+ years that contains an embedded policy conjoint experiment. 6 To understand the potential effects of eID systems on intergroup inequality, it was crucial that we reached respondents from historically dominant, opposition, and securitized groups. To ensure sufficient heterogeneity of respondents along this dimension, we recruited a representative sample of 1,063 respondents from Nairobi, and randomly sampled an additional 1,009 respondents from the Mt. Kenya, Nyanza and Garissa regions, for a total sample of 2,072 respondents. These three locations outside Nairobi are predominantly inhabited by Kikuyu (dominant), Luo (opposition) and Somali (securitized) ethnic groups, respectively. Our sample includes respondents from a total of 14 ethnic groups. Tables A1–A3 provide an overview of descriptive statistics and covariate balance.
Survey enumeration took place between June 27 and July 29, 2022. Enumeration areas within each region were selected using probability-proportional-to-population-size (PPPS) sampling. Within each enumeration area, households were sampled using a random walk procedure, and respondents within each household were randomly selected from the full set of household members aged 18+ at the time of the interview. At the end of the interview, respondents received an incentive of 150 KSh (1.25 USD at the time of enumeration) worth of phone credit for their participation in the survey, which took approximately 20–30 minutes to complete.
Experimental Design
We test our hypotheses using a policy conjoint experiment embedded in the survey. Conjoint analysis is a tool used to study preferences about complex, multidimensional phenomena, such as government policies, commercial products, or candidates for public office (Hainmueller et al., 2014). An important advantage of conjoint analysis is that it allows researchers to isolate the effects of many different features or dimensions of an object (e.g. a policy) on attitudes about that object. In a typical conjoint experiment, research subjects are presented with multiple “profiles” randomly generated from different possible combinations of attributes, and asked to evaluate these profiles, either individually or in comparison to one another.
In this study, survey respondents were presented with multiple hypothetical policies governing digital ID in Kenya. Each hypothetical policy varied along several dimensions that reflect ongoing debates about the use and regulation of eIDs and that represent distinct potential consequences of greater legibility gained through the roll-out of eIDs. After a short set of pre-treatment questions, each respondent was presented with three (3) pairs of hypothetical digital ID policies. The policies were introduced with the following text: The Kenyan government is considering new initiatives to introduce digital IDs – ID cards linked to biometric data about citizens that the government will collect and store – as a part of a broader initiative to make the government more effective in many areas. Next, you will be asked to consider several policy proposals for a new digital ID program that would be accessible to all Kenyans. Please note that these exact policies have not necessarily been proposed by anyone, but they may be similar to real proposals that are being considered.
We chose to specify that the hypothetical digital IDs “would be accessible to all Kenyans,” in order to bracket considerations of eligibility and access. We limit our sample to Kenyan citizens for the same reason. Accessibility issues are crucial to understanding the societal consequences of eIDs and, as discussed above, have been studied in detail elsewhere. Our focus is instead on willingness to take up eID initiatives, conditional on the ability to do so. However, as we discuss below, we cannot definitively rule out the possibility that certain groups’ skepticism or uncertainty about eligibility affects their preferences for specific eID policy features.
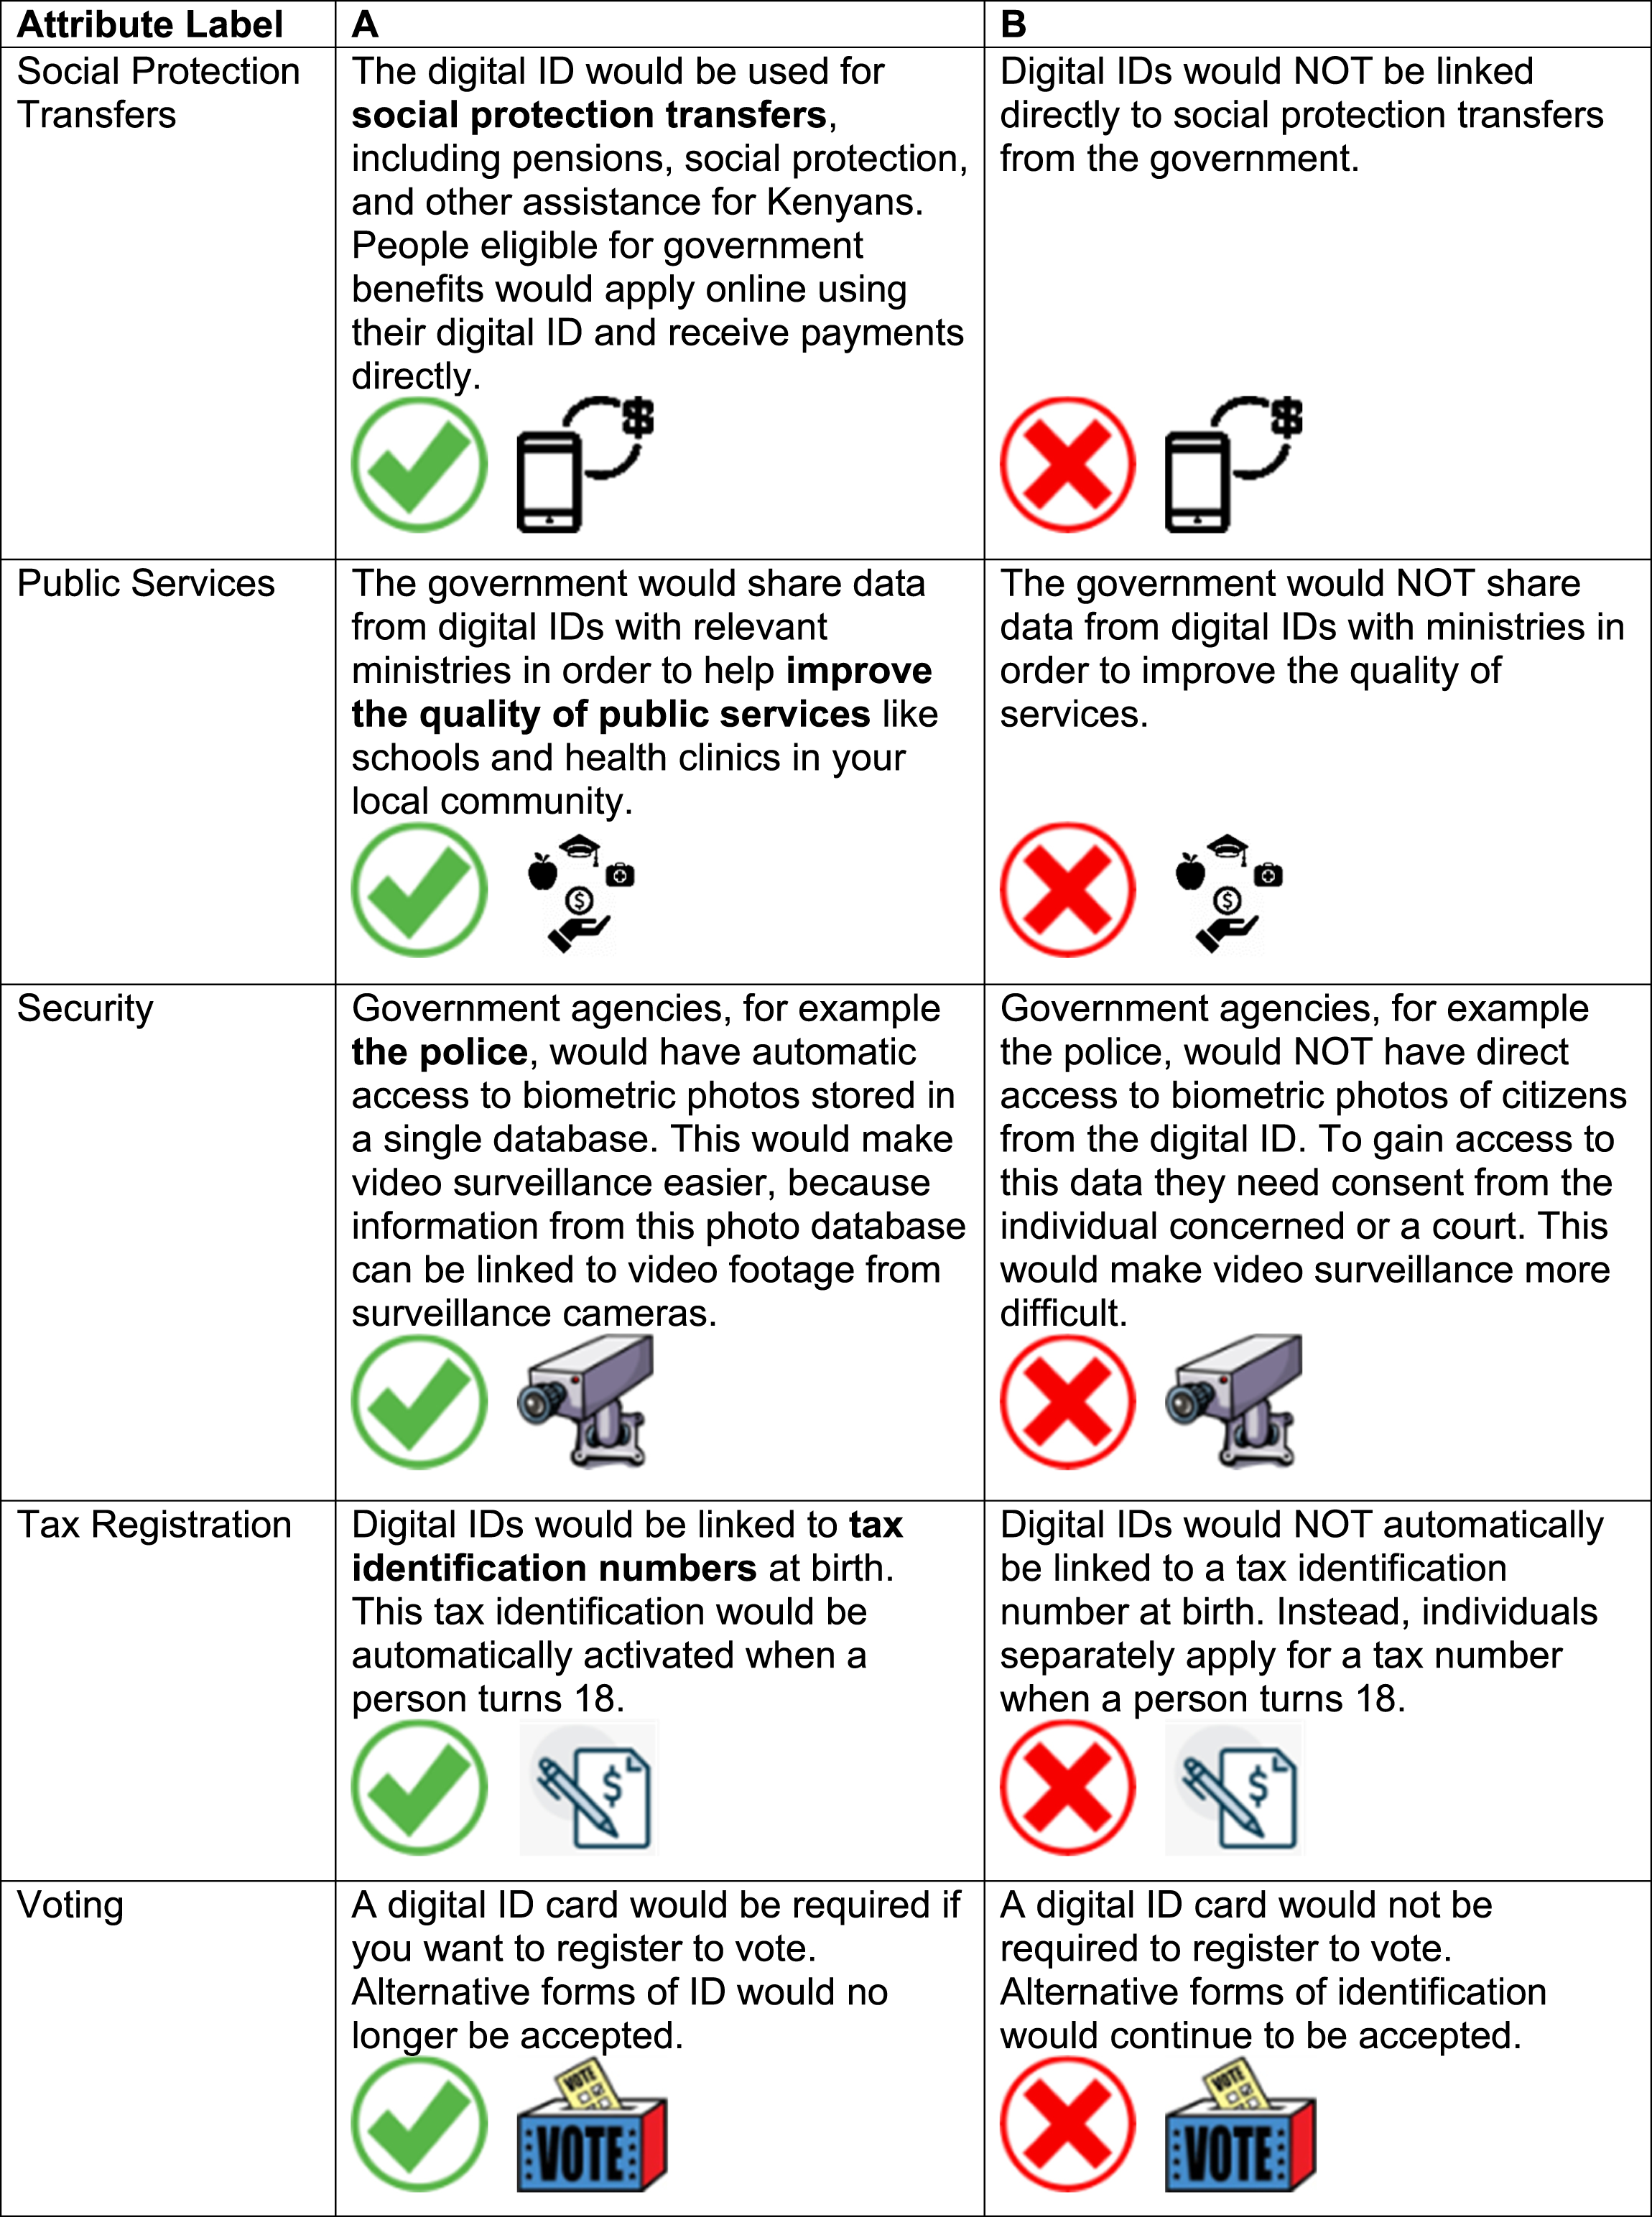
Each hypothetical eID policy varies along the following five (5) dimensions: • • • • •
The exact wording of the attribute values as they appeared on a showcard provided to each respondent, with accompanying images, is included in Figure 1 below. All attribute values were assigned independently and with equal probability using simple random assignment. With five (5) binary attributes, this yields 25 = 32 possible attribute combinations for a single policy. Each respondent was shown three (3) policy pairs, or six (6) profiles in total, for a total of 12,300 profiles evaluated across the sample. Only pairs with identical profiles were excluded. The order in which attributes appeared was randomized between respondents, but fixed across rounds for a single respondent. We collected data on three primary outcomes for each round: • A forced choice between two digital ID policies, for each policy pair (“Which of the following two policy proposals for a new digital ID would you prefer?“) • Two individual policy evaluation questions: – Willingness to register for a digital ID under a given policy (Scale from 1–4, “Not at all likely” to “Very likely”) – Level of support for a given digital ID policy (Scale from 1–4, “Not at all supportive” to “Very supportive”) Conjoint attributes.
We also collected data on the following secondary outcomes for both policies shown in the first round. These outcomes are included to help us understand both the mechanisms underpinning variation in support for eID and potential implications of different eID policies for political behavior: • Belief that the digital ID policy would make it easier to access government services (Scale from 1–4, “Strongly disagree” to “Strongly agree”) • Belief that the privacy of data would be adequately protected under the digital ID policy (Scale from 1–4, “Strongly disagree” to “Strongly agree”) • Concern about being punished for expressing political views under the digital ID policy (Scale from 1–4, “Strongly disagree” to “Strongly agree”) • Concern about one’s vote being counted under the digital ID policy (Scale from 1–4, “Strongly disagree” to “Strongly agree”) • Concern about the police using one’s personal information under the digital ID policy (Scale from 1–4, “Strongly disagree” to “Strongly agree”)
After the first two rounds of the conjoint experiments, we included manipulation checks, asking respondents whether the policy proposal they had just seen included one of the following policy profiles: • •
Estimands and Analysis
In our main analysis, we estimate average marginal effects of each conjoint attribute using the following OLS specification, regressing each outcome on the five dimensions of experimental variation interacted with indicators for membership in each of the following groups: dominant, opposition, and securitized.
7
Policy profiles are indexed by i and respondents by r.
8
Standard errors are clustered at the level of the respondent.
Treatment and group indicator variables are demeaned to allow for the attribute base terms (β1 − β5) to be interpreted as the average marginal effects for each attribute within the entire sample. These coefficients correspond to Hypotheses 1–5 above. Hypotheses 6a, 6b, 7, and 8 are tested using the corresponding group-indicator interaction terms.
Results
Before presenting our findings on the effects of different policy features on attitudes about hypothetical eID policies, we examine overall attitudes toward these hypothetical policies among the full survey sample and within our subgroups of interest. If a particular group is universally supportive or unsupportive, we should not expect specific policy features to matter for that group. Importantly, we do not interpret this as a measure of general support for digitalization. In particular, given our survey design, attitudes about hypothetical policies may not fully reflect expectations surrounding eligibility for future programs that are actually proposed.
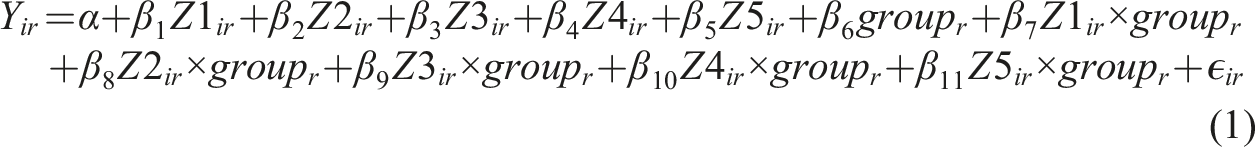
Figure 2 shows the distribution of support for and willingness to register for hypothetical eID policies, averaged across all combinations of policy features presented in the conjoint experiment. In the full sample, respondents said they would be “somewhat likely” or “very likely” to register under the hypothetical eID policy in a majority (66.8%) of conjoint tasks. Similarly, for 67.3% of policy profiles, respondents were “somewhat” or “very” supportive. Support for and willingness to register under hypothetical eID policies, averaged across all combinations of policy features.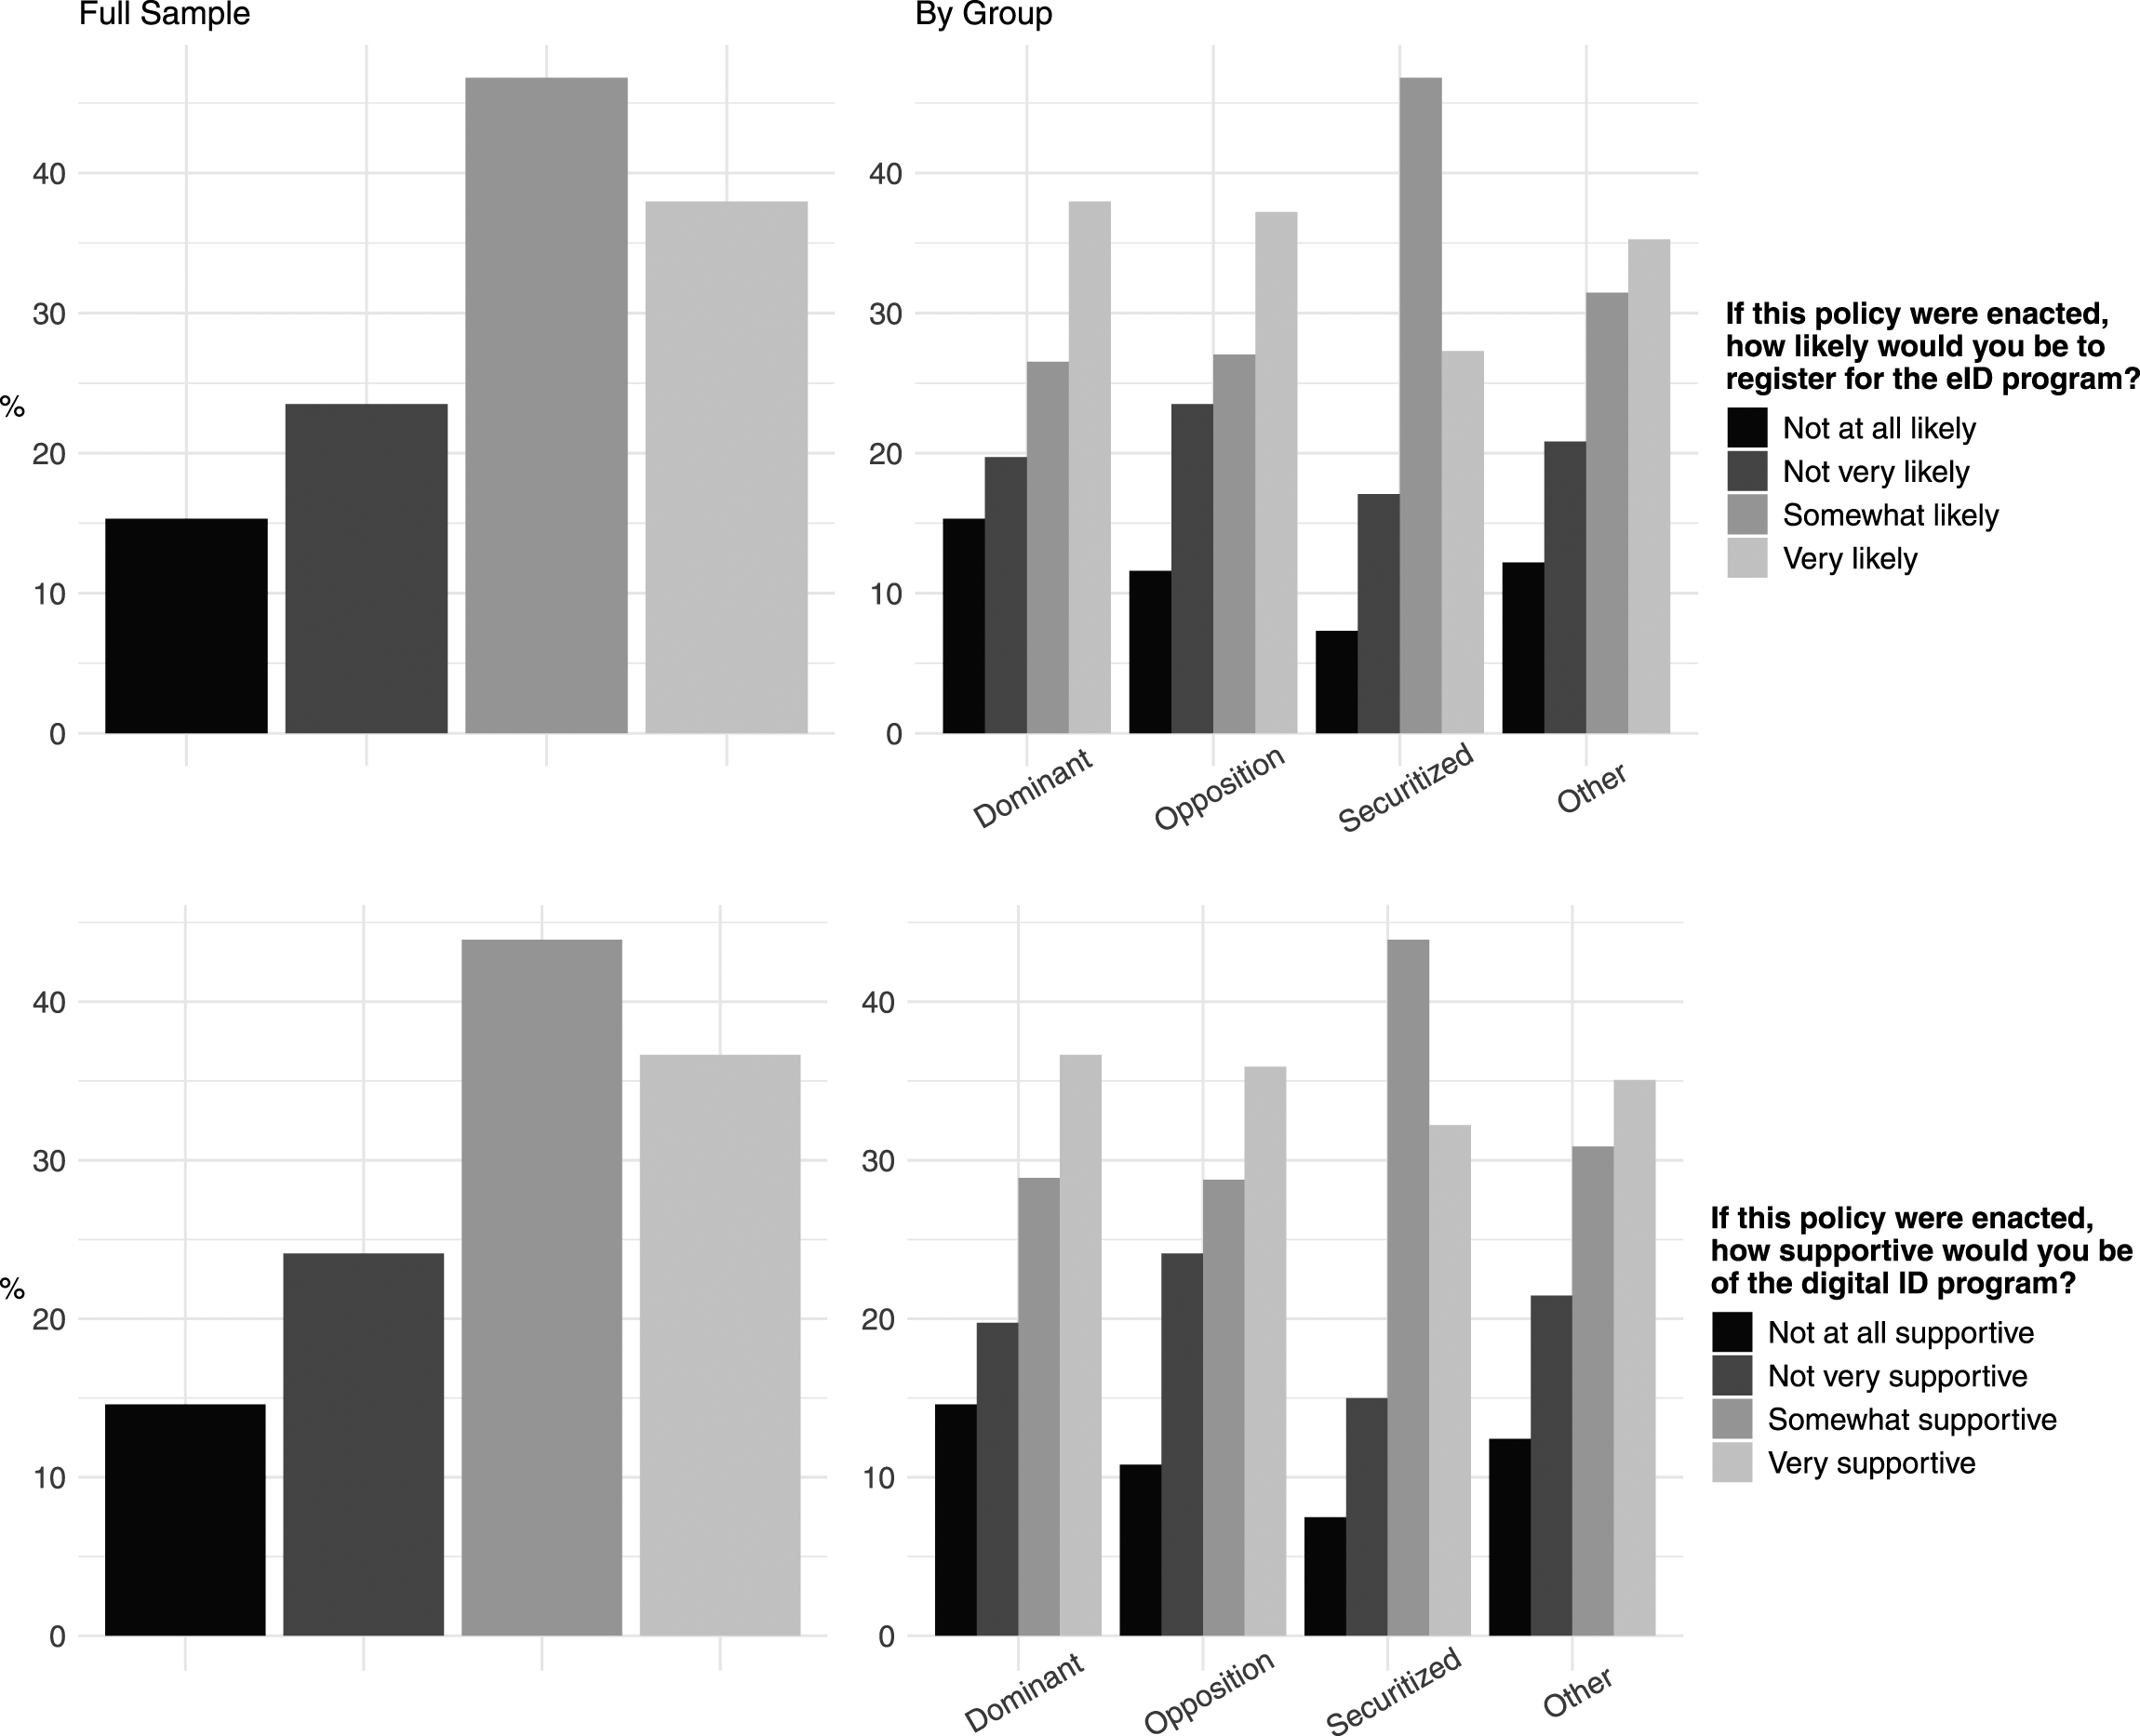
Overall, respondents in the securitized group were more likely than respondents in other groups to state that they were “somewhat supportive” of and “somewhat likely” to register under a hypothetical policy. They were the least likely to provide answers on either extreme (“not at all [supportive/likely]” or “very [supportive/likely]”). By contrast, dominant group respondents were more likely than other respondents to provide answers on both extremes. Opposition group respondents answered similarly to dominant group respondents, but were more likely to answer that they were “not very [supportive/likely]” as opposed to “not at all [supportive/likely]”. Despite expectations that the costs of digitalization may be borne to a greater extent by marginalized groups, we do not find clear evidence that securitized and opposition group respondents are less supportive overall. If anything, securitized group respondents in particular seem less certain about their views, while dominant group respondents are more certain, with a non-trivial minority expressing strong opposition. 9
There is considerable variation within all groups. In our main analysis, we assess the extent to which this support depends on specific policy features.
Primary Outcomes
We analyze the effects of the five conjoint attributes on our three primary outcomes: forced choice, policy proposal support, and willingness to register for a digital ID under the hypothetical policy. We include group-attribute interactions to test whether respondents from three dominant, opposition, and securitized ethnic groups react differently to each attribute, relative to the rest of the sample.
Results from this analysis appear in Figure 3 below and in Table A4 in the appendix.
10
We first present our findings for the full sample, and then turn to the findings from our analysis of group-level heterogeneity. Average marginal component effects of policy features on policy choice, policy support, and likelihood of registering for eID under the hypothetical policy, for the whole sample, and within sub-groups. Support and willingness to register are measured on a scale from 1 (Not at all supportive/Not at all likely) to 4 (Very supportive/Very likely). Bars represent 95% confidence intervals, with standard errors clustered at the respondent level.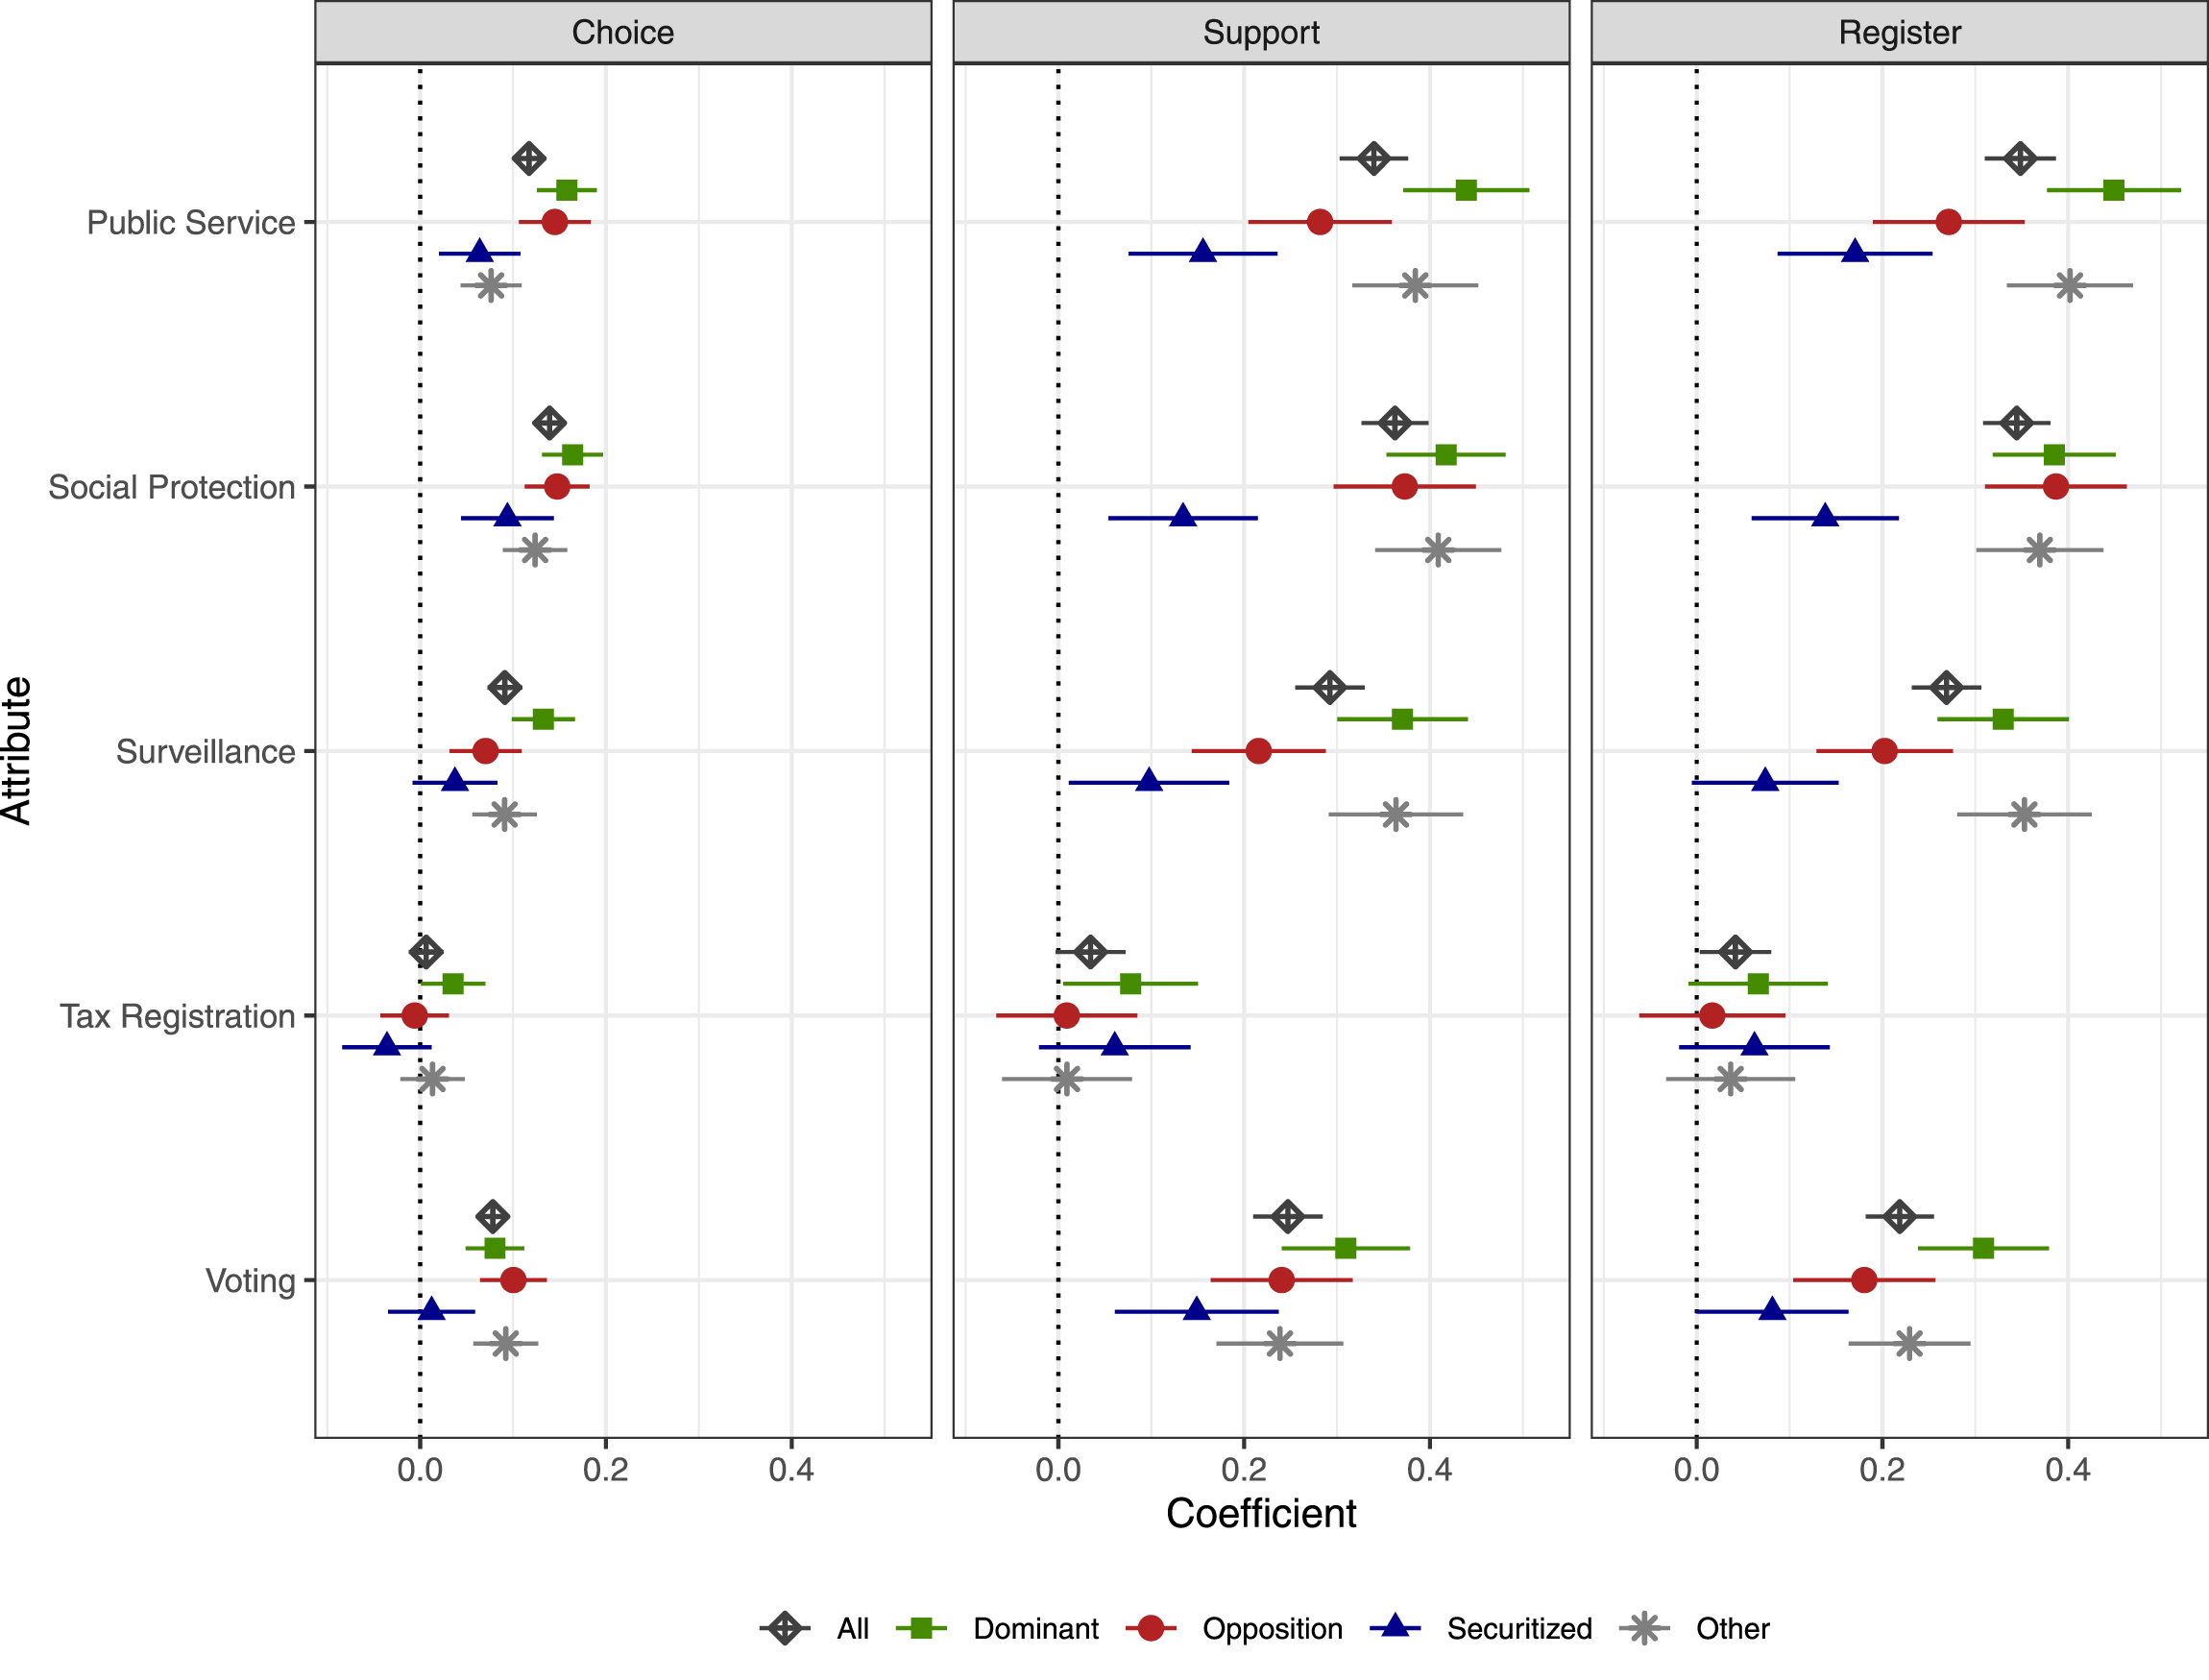
Full Sample
The coefficients in Figure 3 represent the average marginal component effects of each policy attribute on our primary outcomes. These can be interpreted as the effect of a hypothetical policy feature, compared to its alternative, on choice of a policy, support for eID under that policy, or willingness to register for eID under that policy. 11 The coefficients in the first row, for example, represent the difference in the probability of preferring a hypothetical policy (Panel 1), level of support for that policy (Panel 2), and willingness to register under that policy (Panel 3) when the policy includes data sharing across government agencies for the purpose of improving public services, compared to when it does not, averaged across all other possible combinations of policy features.
Turning first to results for the full sample, we find that, on average, respondents prefer policies linking eID with social protection transfers and improved quality of public services, in line with Hypotheses 1 and 2. However, contrary to Hypotheses 3 and 5, respondents also prefer policy proposals in which biometric data is made automatically available to security services (compared to policy proposals that restrict this data sharing), and in which eIDs are required for voter registration (compared to policies where alternatives forms of ID would be accepted). These relationships are statistically significant (p < .001) and suggest overall optimism about the integration of eIDs with a variety of government functions. Counter to hypothesis 4, respondents also express greater willingness to register for eIDs under policies that automatically link eID to tax registration (p < .05) compared to policies that that do not; however, tax registration has no significant effect on choice and only a marginally significant positive effect on support (p < .1).
Group Heterogeneity
We next turn to the analysis of heterogeneous effects for our three pre-specified subgroups. As in the full sample, the coefficients for most attributes are positively signed within all three subgroups, suggesting that, on average, respondents in each of these groups are more positively inclined toward policies that integrate data from digital IDs with a larger range of government functions, compared to those that limit its use. However, we do find meaningful differences between groups in the magnitudes of these effects.
Consistent with Hypothesis 6b, we find that politically dominant group respondents react more positively to data sharing across government agencies to improve public services, compared to respondents from other groups. As shown in Columns 1–3 of Table A4, which include interactions between each attribute and an indicator for membership in the dominant group, the interaction terms are positive and statistically significant across all three outcomes. We also find suggestive evidence in support of Hypothesis 6a: the positive effect of linking eIDs with social protection payments on policy support was significantly greater for dominant group respondents compared to other groups. For the forced choice and willingness to register outcomes, the interactions between the public service and dominant group indicators are positive, but fall short of statistical significance at the p < .05 level. 12
Contrary to Hypothesis 8, we find no statistically significant differences in the effect of the voting attribute for opposition group respondents (see columns 4–6 in Table A4). We do find evidence in support of Hypothesis 7. Compared to other groups, respondents from the securitized group are significantly less likely to prefer policies that allow automatic data sharing with security agencies compared to policies that do not. The coefficients on the interaction between securitized group membership and the surveillance attribute are negative and statistically significant across all three outcomes (see columns 7–9 of Table A4). As is apparent in Figure 3, respondents in the securitized group still (weakly) prefer hypothetical policies that involve automatic sharing of biometric data with security services over hypothetical policies that restrict data sharing. 13 In general, it appears that securitized respondents’ preference for, support for, and willingness to register under hypothetical eID policies is less influenced by the specific features of the policy compared to other groups. We explore potential explanations for this pattern below.
Alternative Explanations and Threats to Inference
Our findings point to significant differences between ethnic groups in the effects of specific policy features on attitudes toward hypothetical digital ID policies. However, the group-level heterogeneity we observe may be driven by other factors correlated with group membership, such as education levels or socio-economic status, rather than the group-specific relations to the state motivating our research design. While we cannot definitively rule this out, we implement additional analyses to probe potential alternative explanations.
First, we note that respondents from the securitized group were less responsive to specific policy features in their support for eID policy proposals, compared to other respondents. This was not only true for surveillance-related attribute about which we hypothesized, but for most other attributes as well. One potential explanation for this difference is that respondents in this group were less likely to understand the conjoint task. To assess this possibility, we first examine manipulation check failure rates across groups. As shown in Figure O2 in the Online Appendix, we do not find that securitized group respondents were significantly more likely than other groups to fail conjoint manipulation checks. Next, we drop respondents who failed manipulation checks in the first round and analyze only the second- and third-round responses of the remaining sample. As shown in Table O21 in the Online Appendix, our results remain largely unchanged. 14 These findings suggest that the group-level differences in effects of the attributes are not driven by group-level differences in comprehension.
Second, the fact that we did not find differential effects on our primary outcomes for the opposition group could reflect unusual features of the ethnic coalitions that arose ahead of the 2022 election, held shortly after we fielded our survey. The 2022 campaign differed from previous contests in that the political elite of the dominant group (specifically the Kikuyu) were divided between the two candidates: Raila Odinga (the opposition candidate and a Luo) and William Ruto (the dominant candidate and a Kalenjin). 15 Under these circumstances, support for the opposition candidate, rather than membership in an ethnic group that has historically been in opposition, may have been a more important predictor of views about the digitalization of voter registration. We assess this in a pre-registered analysis that interacts an indicator for support of the opposition candidate (Odinga) with the conjoint attributes. As shown in Table O30, consistent with our main analysis, we do not find that opposition supporters differ significantly from others in their views on linking digital ID with voting.
Third, we systematically compare the importance of ethnic group category to that of other observable respondent characteristics as predictors of heterogeneity in the effects of the conjoint attributes. Following Robinson and Duch (2022), we use a machine learning approach to estimate and compare the importance of different individual-level covariates for partitioning estimated individual-level marginal component effects. 16 Results from this analysis appear in the Online Appendix. Group membership indicators consistently outperform other variables we might expect to matter, such as income, wealth, and education. For the public service attribute, membership in the dominant group is the single most important among all candidate predictors. 17 We additionally estimate our main specifications controlling for socioeconomic characteristics, including income, asset ownership, and education. Our results remain robust to the inclusion of these control variables. 18
Robustness
We implement a range of additional specifications to further examine the robustness of our results. First, we re-estimate all models including a dummy variable for whether respondents were based in Nairobi or another location. Our main results remain robust, suggesting that the group-level differences we observe are not driven by the greater representation of certain groups in the Nairobi sample (see Table A8). The results are also robust to models including enumerator and round fixed effects (see Table O2 and O3 in the Online Appendix). 19
Second, we drop all “unclassified” respondents, i.e. those not coded as dominant (Kikuyu and Kalenjin), opposition (Luo), or securitized (Somali) (see Tables O4 to O7 in the Online Appendix). In these specifications, we compare each group to the other two groups only (for example, we only compare the dominant group to the opposition and the securitized group). Effect sizes and directions remain close to those in the original analyses except for respondents in the opposition group. However, when comparing the opposition to the dominant group only (by excluding the securitized group from the sample), effect size and direction of the interaction effects are close to those in the original analyses and even more pronounced (see Tables O8 and O9 in the Online Appendix).
Third, we conduct additional analyses using responses only from the first round to address potential priming effects arising from the secondary outcome questions posed after the initial round of the conjoint experiment. Although some of the results lose statistical significance due to a considerable reduction in sample size, the overall direction of the effects remains consistent (see Table O10).
Fourth, we recode group membership for each respondent using the classifications in the Ethnics Power Relations (EPR) dataset that correspond most closely to our pre-specified ethnic group categories (Vogt et al., 2015). 20 The results are consistent with our findings (see Tables O17 and O20 in the Online Appendix).
Finally, we implement corrections for multiple hypothesis testing. Specifically, we apply a False Detection Rate (FDR) correction across all pre-registered hypothesis tests, and a more conservative family-wise error rate (FWER) correction across the three primary outcomes (forced choice, support, and willingness to register) used to test each individual hypothesis. As shown in Table O11 in the Online Appendix, our main findings are robust to these adjustments.
Mechanisms
We now examine the effects of different policy features on respondents’ beliefs about the implications of hypothetical eID policies. These additional analyses help shed light on potential mechanisms underlying the findings for our primary outcomes, and provide suggestive evidence about the possible effects of eID programs on political behavior. Figure 4 presents results from these analyses, showing the average marginal component effects for each attribute on responses to a series of statements about the hypothetical eID policies, by subgroup.
21
Average marginal effects of policy attributes on agreement with the following statements about hypothetical eID policies: “If this policy were enacted…the program would make it easier for people like me to access government services”, “the privacy of my data would be adequately protected”, “I would be worried about the police using my personal information”, “I would be worried about being punished for expressing my political views”, and “I would be worried about my vote being counted”. Agreement is measured on scale from 1 (Strongly Disagree) to 4 (Strongly Agree). Bars represent 95% confidence intervals, with standard errors clustered at the respondent level.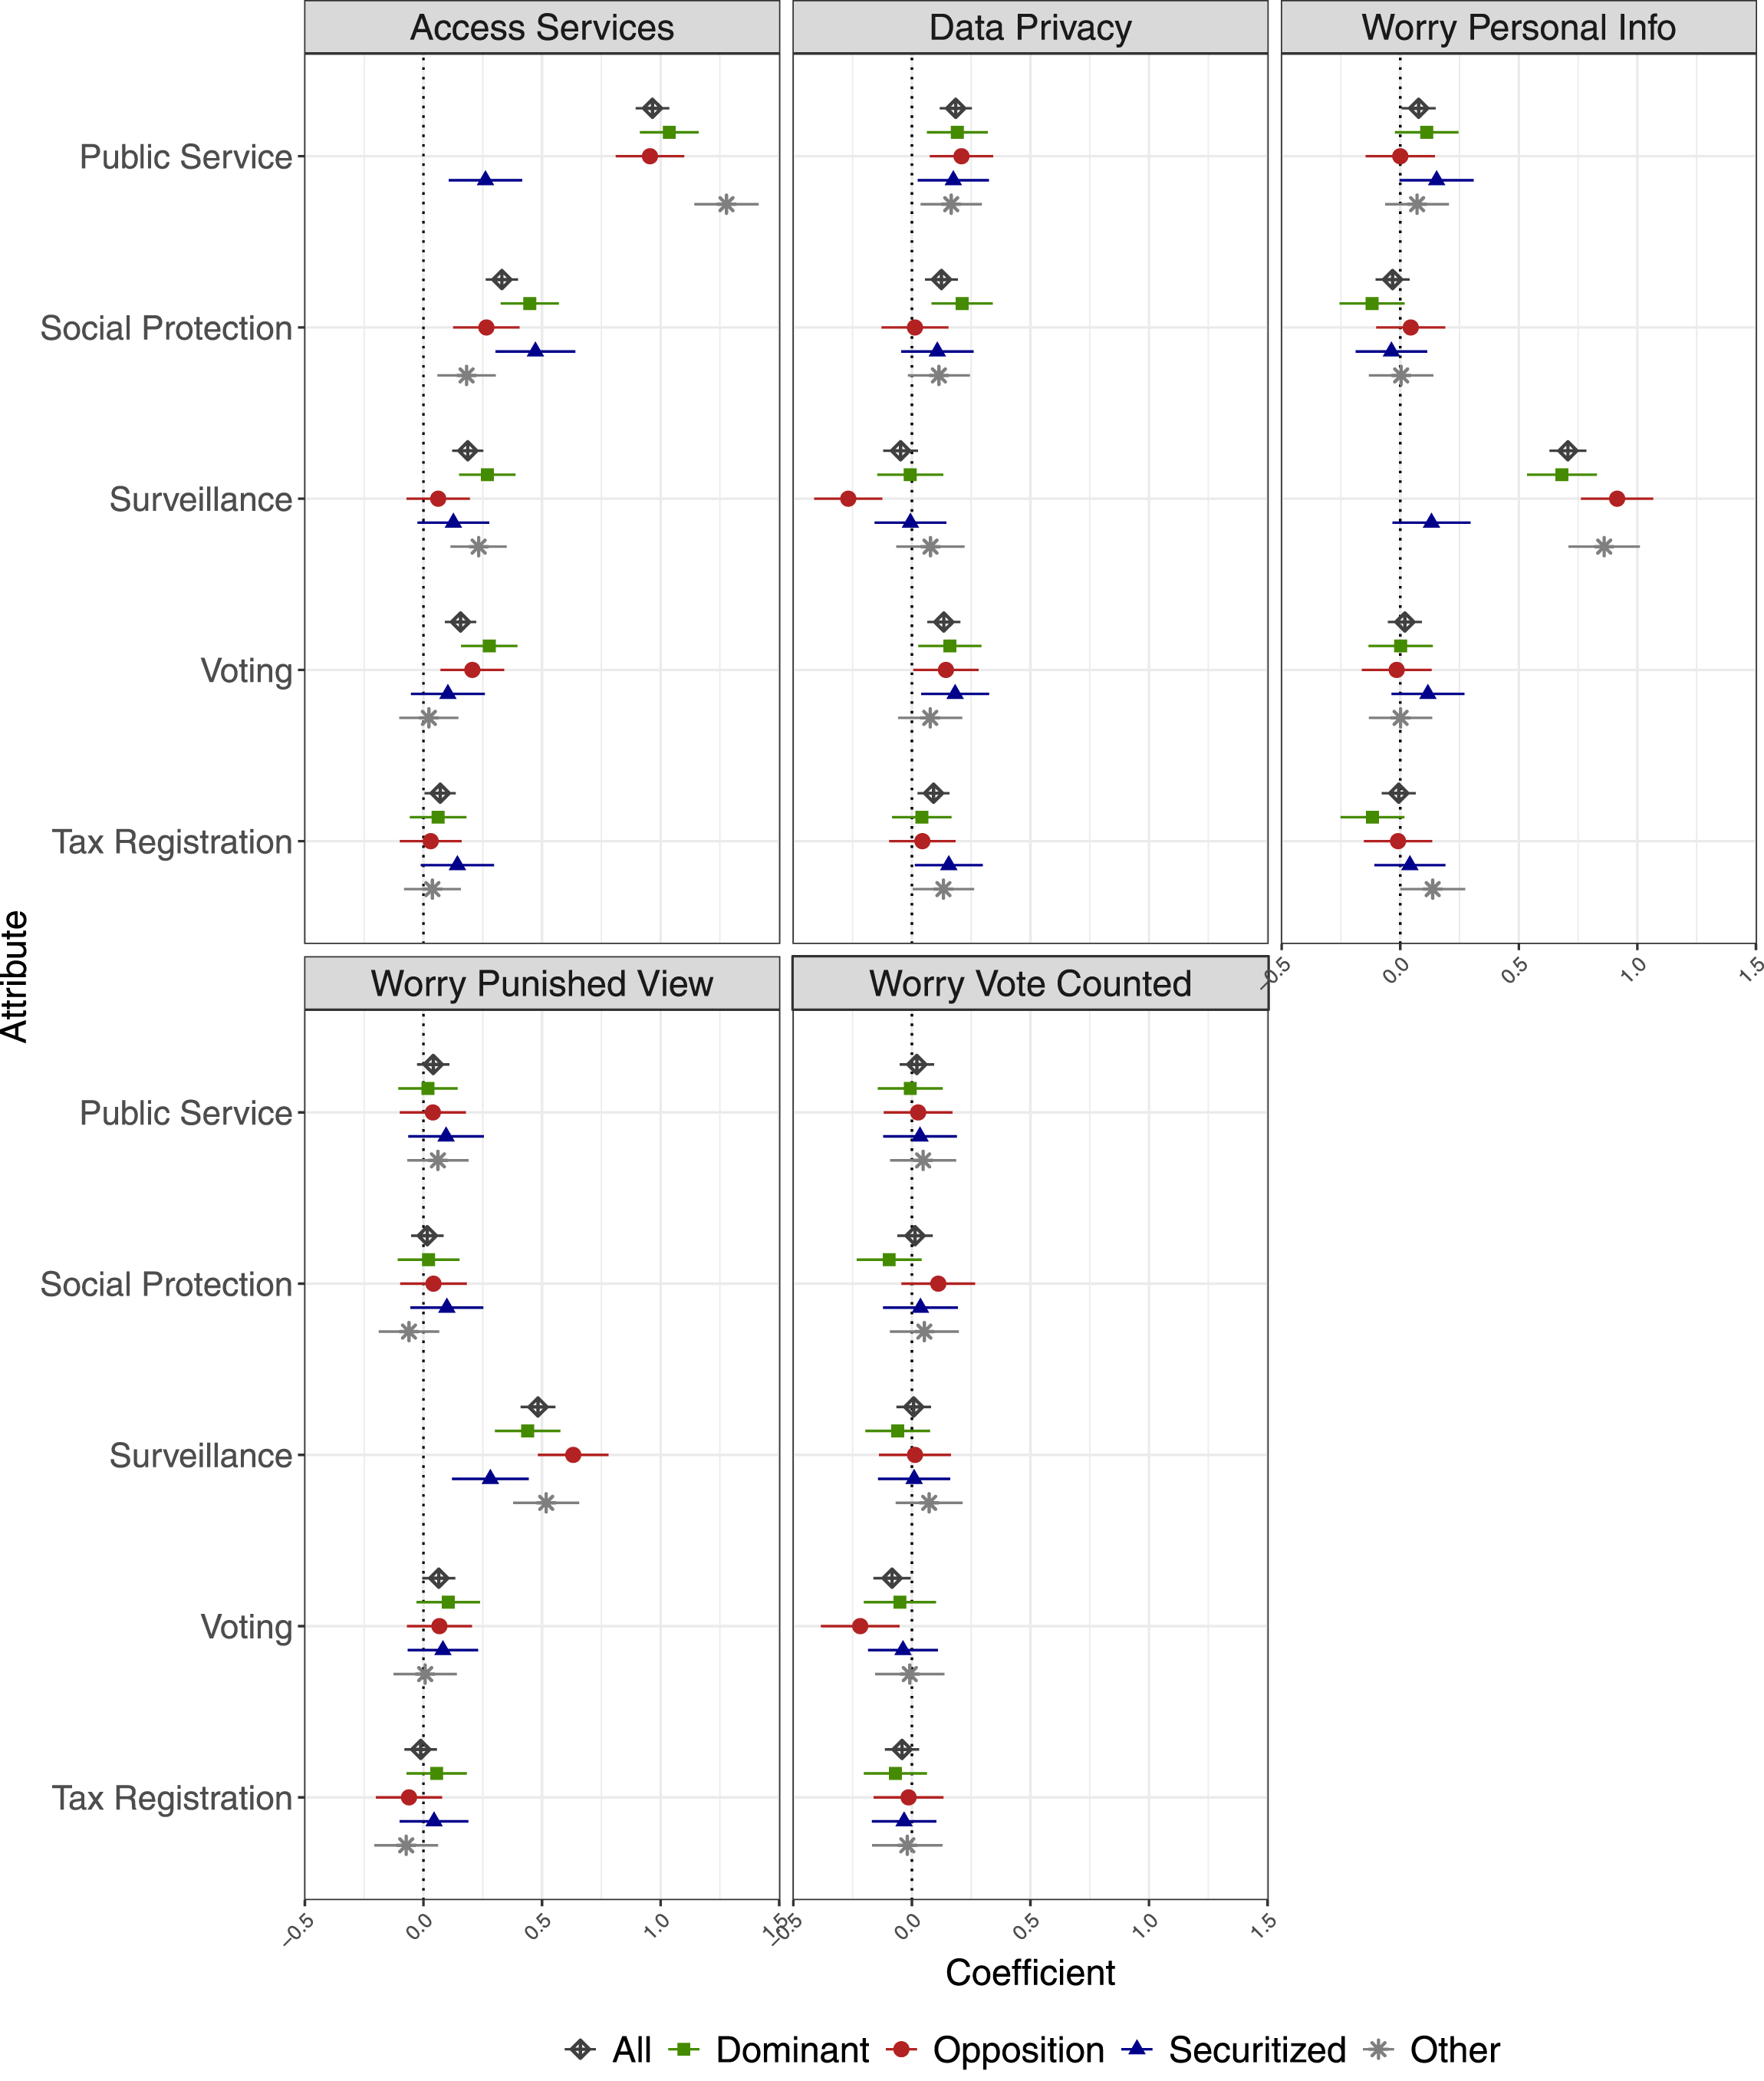
On average, respondents from all three groups who were shown policies that made an explicit link between eID and improved public service provision were more likely to agree that the policies would make it easier for people like themselves to access government services (as shown in Figure 4, upper left panel, first column). When we examine the three types of ethnic groups separately, however, it is clear that the securitized group’s beliefs about access to government services are significantly less affected by government policy surrounding the use of eID data, compared to the dominant and opposition groups. 22 We see smaller but still significant positive effects among respondents who were shown policies making an explicit link between eID and social protection transfers, but here we do not observe significant differences across ethnic groups.
Next, we turn to the effects of different eID policy features on concerns about one’s vote being fairly counted. Interestingly, we find that opposition group respondents were less worried about their vote being counted under policies that would require a digital ID for voter registration, both compared to policies that would not require a digital ID (p < .05) and relative to other groups (p < .1). 23 This finding may reflect low levels of trust in the existing electoral process on the part of opposition group members (particularly during what had been a highly contentious electoral season), an interpretation we return to below.
Finally, we examine the effects of eID policy features on concerns about the security of one’s personal information, data privacy more generally, and concerns about open political speech. Respondents in all subgroups become more worried, on average, about their personal information being used by the police and about being punished for expressing their political views under hypothetical eID policies that would facilitate greater state surveillance. This effect is particularly strong for members of the opposition group (see Figures A3 and A5 in the appendix). Opposition respondents are are also significantly less likely to express confidence in the privacy of their data under these conditions. 24 By contrast, the effects of the surveillance attribute on concerns about data security and expressing political views were significantly less pronounced for securitized group respondents, compared to the rest of the sample. 25 Importantly, however, as shown in Figures A3 and A5 in the appendix, securitized group respondents were more concerned on average about use of their personal information by the police and about expressing their political views. 26
Discussion
In the following, we discuss our core results in greater detail. First, contrary to our expectations, but perhaps encouragingly for digitalization efforts, we do not find evidence that concerns about government use of eIDs in ways that are potentially costly (such as enhanced state surveillance capacity) reduce support for and likely uptake of eIDs, on average. Second, we find suggestive evidence that the introduction of eIDs might indirectly contribute to intergroup inequality through differential effects on political behavior.
While respondents generally support policies linking eIDs with potential benefits, respondents are also more supportive of policies that use eIDs in ways that may be considered potentially costly (compared to policies that limit the use of eID data in these domains). In particular, respondents are, on average, more supportive of policies that require eIDs for voter registration (compared to those that do not) and of policies that allow unrestricted sharing of biometric data with security agencies to improve surveillance capabilities (compared to those that limit this access). We find evidence for these preferences even among opposition and securitized group respondents, although the effects are weaker among the securitized group.
One interpretation these findings is that they reflect hopes that digitalization will improve upon an unsatisfactory status quo. Mistrust in Kenya’s electoral system has been widely documented (Brechenmacher & Sambuli, 2022). Kenyans, especially those who feel disadvantaged in electoral politics, may welcome attempts at reform. In light of the outcomes of recent national elections in Kenya, where opposition groups have been repeatedly excluded from office by narrow margins, they may simply believe that a new, digitized identification system can only be an improvement. Consistent with this interpretation, we find that opposition respondents were more likely to express confidence that their vote would be counted under hypothetical policies that would require eID to register to vote, compared to those that would not (see Table A6, column 4).
Similarly, the positive effects of surveillance integration on policy support may reflect a demand for better security provision by the state, perhaps in response to numerous deadly terrorist attacks in the past decade and high rates of crime, particularly in Nairobi. In support of this idea, our exploratory heterogeneity analyses suggest that security integration has a larger positive effect on policy preference among members of both the dominant and opposition groups based in Nairobi, compared to those residing outside Nairobi (see Figures O14 and O12 in the Online Appendix).
Members of securitized groups may weigh demand for greater security against potential concerns about discriminatory policing, explaining the smaller positive effect of the security attribute in the experiment among this group. Another possibility is that this group already believes the state collects data on them or does not view policies that would limit data sharing as credible. 27 On the other hand, expectations surrounding the impact of digitalization on policing practices are not straightforward. Indeed, insights from qualitative interviews conducted with a subset of Somali survey respondents in Nairobi in January 2024 suggest that individuals from marginalized communities may view digitalization as a means of reducing discrimination in their interactions with the state. 28 Several respondents reported frequent discrimination during encounters with the police in Kenya. As one respondent put it, “for many Somalis, they are really marginalized. They get very different treatment than other Kenyans. There is this presumption that all Somalis are terrorists.“ 29 Another emphasized perceived discrimination in asking for bribes: “I think it is discrimination. They might ask for money. Everywhere we go to interact with the police, for example when you are reporting a crime, they ask for money. if you refuse to pay, you will not get any services or taken to a cell”. 30
Some respondents suggested that the digitalization of citizen-state interactions might reduce exposure to this form of discrimination. A Somali Kenyan interview respondent from the (Somali-Kenyan-concentrated) Eastleigh neighborhood in Nairobi expressed this viewpoint, when asked whether their community will benefit from a digital ID:
“Yes, they will benefit a lot. I think it will really help reduce discrimination against Somalis. If we can just do everything online, we won’t have to have these bad face-to-face interactions. We won’t have to face harassment, or stereotyping, or have to be asked to give bribes. It would just be a much better experience for us.” (Interview 3504)
Another Somali Kenyan interview respondent made a similar suggestion:
“I actually think that sharing information with the police is probably a good idea. It might even mean that they stop harassing us so much. If our information is in a digital database, they will see that we are Kenyans and will finally trust us. Now, they just look at our ID cards and don’t believe us. They think we just faked our cards!” (Interview 2502)
These reactions suggest that Somali Kenyans, even if they have some privacy concerns, may perceive digitalization as an opportunity to minimize face-to-face interactions during which they routinely experience discrimination.
More generally, our ex-ante categorization of various policies as costs and benefits may oversimplify the complex considerations influencing how citizens view hypothetical policies. As mentioned above, some policies, such as the use of digital IDs to enhance tax collection or policing capacity, may be reasonably considered both beneficial and costly. Particularly in an emerging policy domain (digitalization) where citizens have limited direct experience, they may face considerable uncertainty surrounding the possible consequences of different policy decisions. As a result, their policy preferences may be influenced more by their satisfaction (or dissatisfaction) with the status quo than their expectations about the future.
Citizens’ expectations may also be colored by past experiences interacting with representatives of the state and their perceptions of state capacity. In a context where many have experienced the state as weak or ineffectual – a perception which, in the Kenyan context, may be reinforced by the state’s repeated failures to implement digital IDs – the idea that state officials will be able to use their personal data for targeted repression, election manipulation, and other sophisticated forms of social and political control may not seem plausible. Evidence from our interviews support this idea. For example, a Kikuyu interview respondent from Nairobi expressed this type of doubt about the capacity of the police:
“In Kenya, the police are not very reliable. They are typically not very well educated ... If they give the police this information, I think it’s OK. What can they even do? In general, the police you meet in the day to day, they are so corrupt, they are just taking bribes. If they are so incompetent, I am not too worried about them having information, since I don’t think they would even know how to use it.” (Interview 3086)
It is worth noting that this respondent is a member of the dominant ethnic group, for whom the machinery of the state is likely to work more efficiently than it does for members of marginalized groups. Research in contexts where the state has demonstrated the capacity to engage in targeted repression on a large scale may yield different findings.
Still, our exploratory analyses suggest that, even in a relatively low-capacity context, many citizens are seriously considering the potential consequences of expanded state surveillance capacity, with possible implications for political behavior.
We find that opposition (Luo) respondents were also relatively less supportive of hypothetical policies with surveillance-enhancing features than members of the dominant group. Furthermore, these respondents become more worried about their personal information being used by the police and that they will be punished for expressing their political views if digital IDs are connected to surveillance (Table A6, column 3 and 5). These results point to the risk that eIDs may lead to differential effects on political behavior across groups – if these concerns curb participation by members of opposition groups in routine political behavior, such as peaceful protest, or choosing to stand for office, the push for digitalization may exacerbate rather than reduce political inequality.
Conclusion
The push to introduce eID systems has myriad potential benefits for government efficiency and offers the promise of significant expansion in access to government services across social groups. But early initiatives in India, South Africa, and elsewhere have raised concerns that logistical barriers to registration in digital ID programs in poor or otherwise marginalized communities may actually wind up exacerbating, rather than reducing, inequalities in access to a range of public goods and services, particularly in settings where eIDs become necessary to access these benefits.
Although existing studies have highlighted these (important) logistical hurdles, little existing research has focused on another potential source of intergroup inequality in the impact of eIDs – differential willingness to take up eID between different social groups as well as their unequeal impact on political participation. Our study explores this question and suggests there may be reason for concern, as group histories shape individual expectations of the potential benefits and costs of digital ID policies.
In a conjoint experiment with 2,072 respondents drawn from four regions across Kenya – where the roll-out of an eID program was halted by court order in 2021 amid controversies about data privacy – we investigate how hypothetical policies emphasizing potential costs and benefits of eIDs for citizens affect support and willingness to register for eIDs as well as potential mechanisms through which they do. On average, we find that citizens are more supportive of hypothetical eID programs that link eIDs to government benefits and improved public services. Perhaps surprisingly, policies leveraging eIDs to increase government extraction and surveillance capacity do not reduce support or willingness to register for eIDs. If anything, these policies make citizens more positively inclined toward eIDs.
These findings weigh against the idea that differential concerns about costs of increased legibility through eIDs are likely to lead to inequalities in uptake. On the other hand, we do find meaningful group differences in the effects of these hypothetical policy features on support. Importantly, we find that members of “securitized” groups, with a history of intensive policing by the state, were less positively persuaded than other groups when presented with details linking eID to a range of potential costs (surveillance, taxation) and even potential benefits (improved public goods provision). This finding may reflect greater ambivalence about the potential security benefits of eIDs within this community, or even a lack of trust in measures the state may take to limit use of biometric data for surveillance.
Finally, our findings highlight the need for further investigation into the consequences of legibility for political behavior. We find suggestive evidence that opposition groups in particular become more concerned about data privacy and the consequences of political speech under policies that use eIDs to enhance surveillance capacity. While concerns about eIDs and surveillance among opposition groups may not exacerbate inequality through differential uptake, they may contribute to political inequality if they disproportionately discourage opposition political participation.
Supplemental Material
Supplemental Material - Who Wants to be Legible? Digitalization and Intergroup Inequality in Kenya
Supplemental Material for Who Wants to be Legible? Digitalization and Intergroup Inequality in Kenya by Lisa Garbe, Nina McMurry, Alexandra Scacco, and Kelly Zhang in Comparative Political Studies.
Footnotes
Acknowledgement
We are grateful to Elena Kromark, Mathew Boswell, and Abigail Peña Alejos for excellent research assistance, to TIFA Research for their superb work in survey implementation in Kenya, to the WZB Berlin Social Science Center and MIT GOV/LAB for funding the research, and to Bernd Beber, Manuel Boscancianu, Jonah Foong, John Gerring, Macartan Humphreys, Wendy Hunter, Nahomi Ichino, Georgiy Syunayev, Minh Trinh, and participants at the APSA annual meeting in Montreal, the Working Group in African Political Economy meeting at the University of Nairobi, and the Winter Retreat organized by the Comparative Politics Group at the University of St. Gallen and ETH Zürich in Switzerland for thoughtful comments and feedback on the design of this study and on earlier versions of this paper.
Declaration of Conflicting Interests
The author(s) declared no potential conflicts of interest with respect to the research, authorship, and/or publication of this article.
Funding
The author(s) disclosed receipt of the following financial support for the research, authorship, and/or publication of this article: We acknowledge the WZB Berlin Social Science Center and the Massachusetts Institute of Technology Governance Lab MIT GOV/LAB for internal funding support.
Ethical Statement
Data Availability Statement
Replication code and data are available on the Comparative Political Studies Dataverse: https://doi.org/10.7910/DVN/EGVC5Q (see Garbe et al., 2024).
Supplemental Material
Supplemental material for this article is available online.
Notes
Appendix
Descriptive Statistics.
Variable
N
Mean
Std. Dev
Min
Max
Heard Huduma Namba
2072
0.98
0.141
0
1
Voted in 2017 election
2072
0.723
0.447
0
1
Female
2046
0.47
0.499
0
1
Age
2046
30.7
10.1
18
90
Garissa
2072
0.139
0.346
0
1
Homa Bay
2072
0.0439
0.205
0
1
Kirinyaga
2072
0.0478
0.213
0
1
Kisumu
2072
0.0434
0.204
0
1
Migori
2072
0.0449
0.207
0
1
Murang’a
2072
0.0492
0.216
0
1
Nairobi
2072
0.513
0.5
0
1
Nyandarua
2072
0.0328
0.178
0
1
Nyeri
2072
0.0478
0.213
0
1
Siaya
2072
0.0381
0.192
0
1
Kalenjin
2063
0.0107
0.103
0
1
Kikuyu
2063
0.294
0.456
0
1
Luo
2063
0.252
0.434
0
1
Somali
2063
0.159
0.365
0
1
Other language
2063
0.285
0.452
0
1
Refused to answer
2063
0
0
0
0
No formal schooling
2072
0.0145
0.119
0
1
Some primary school
2072
0.0299
0.17
0
1
Primary school completed
2072
0.185
0.389
0
1
Secondary school completed
2072
0.406
0.491
0
1
Post-secondary qualifications other than university
2072
0.202
0.401
0
1
At least some university
2072
0.157
0.364
0
1
Refused to answer
2072
0.00483
0.0693
0
1
Christian
2072
0.807
0.395
0
1
Muslim
2072
0.178
0.383
0
1
No religion
2072
0.0106
0.103
0
1
Refused to answer
2072
0.00193
0.0439
0
1
Regions and Ethnicity.
Language
Garissa
Homa Bay
Kirinyaga
Kisumu
Migori
Murang’a
Nairobi
Nyandarua
Nyeri
Siaya
Total
Kamba
4
2
156
2
1
165.00
Somali
278
49
327.00
Swahili
6
1
1
10
18.00
Kisii
1
4
2
2
85
3
1
1
99.00
Luhya
3
6
2
2
201
6
1
6
227.00
Luo
87
74
84
1
200
1
1
71
519.00
Kikuyu
95
91
277
50
94
607.00
Meru
2
1
36
1
1
41.00
Pokot
1
1
2.00
1
2
4
1
1
9.00
Kalenjin
3
16
3
22.00
Other
1
4
2
16
1
24.00
Maasai
2
2.00
Mijikenda
3
3.00
Taita
6
6.00
Turkana
1
1.00
Total
288
91
99
90
93
102
1063
68
99
79
2072.00
Balance.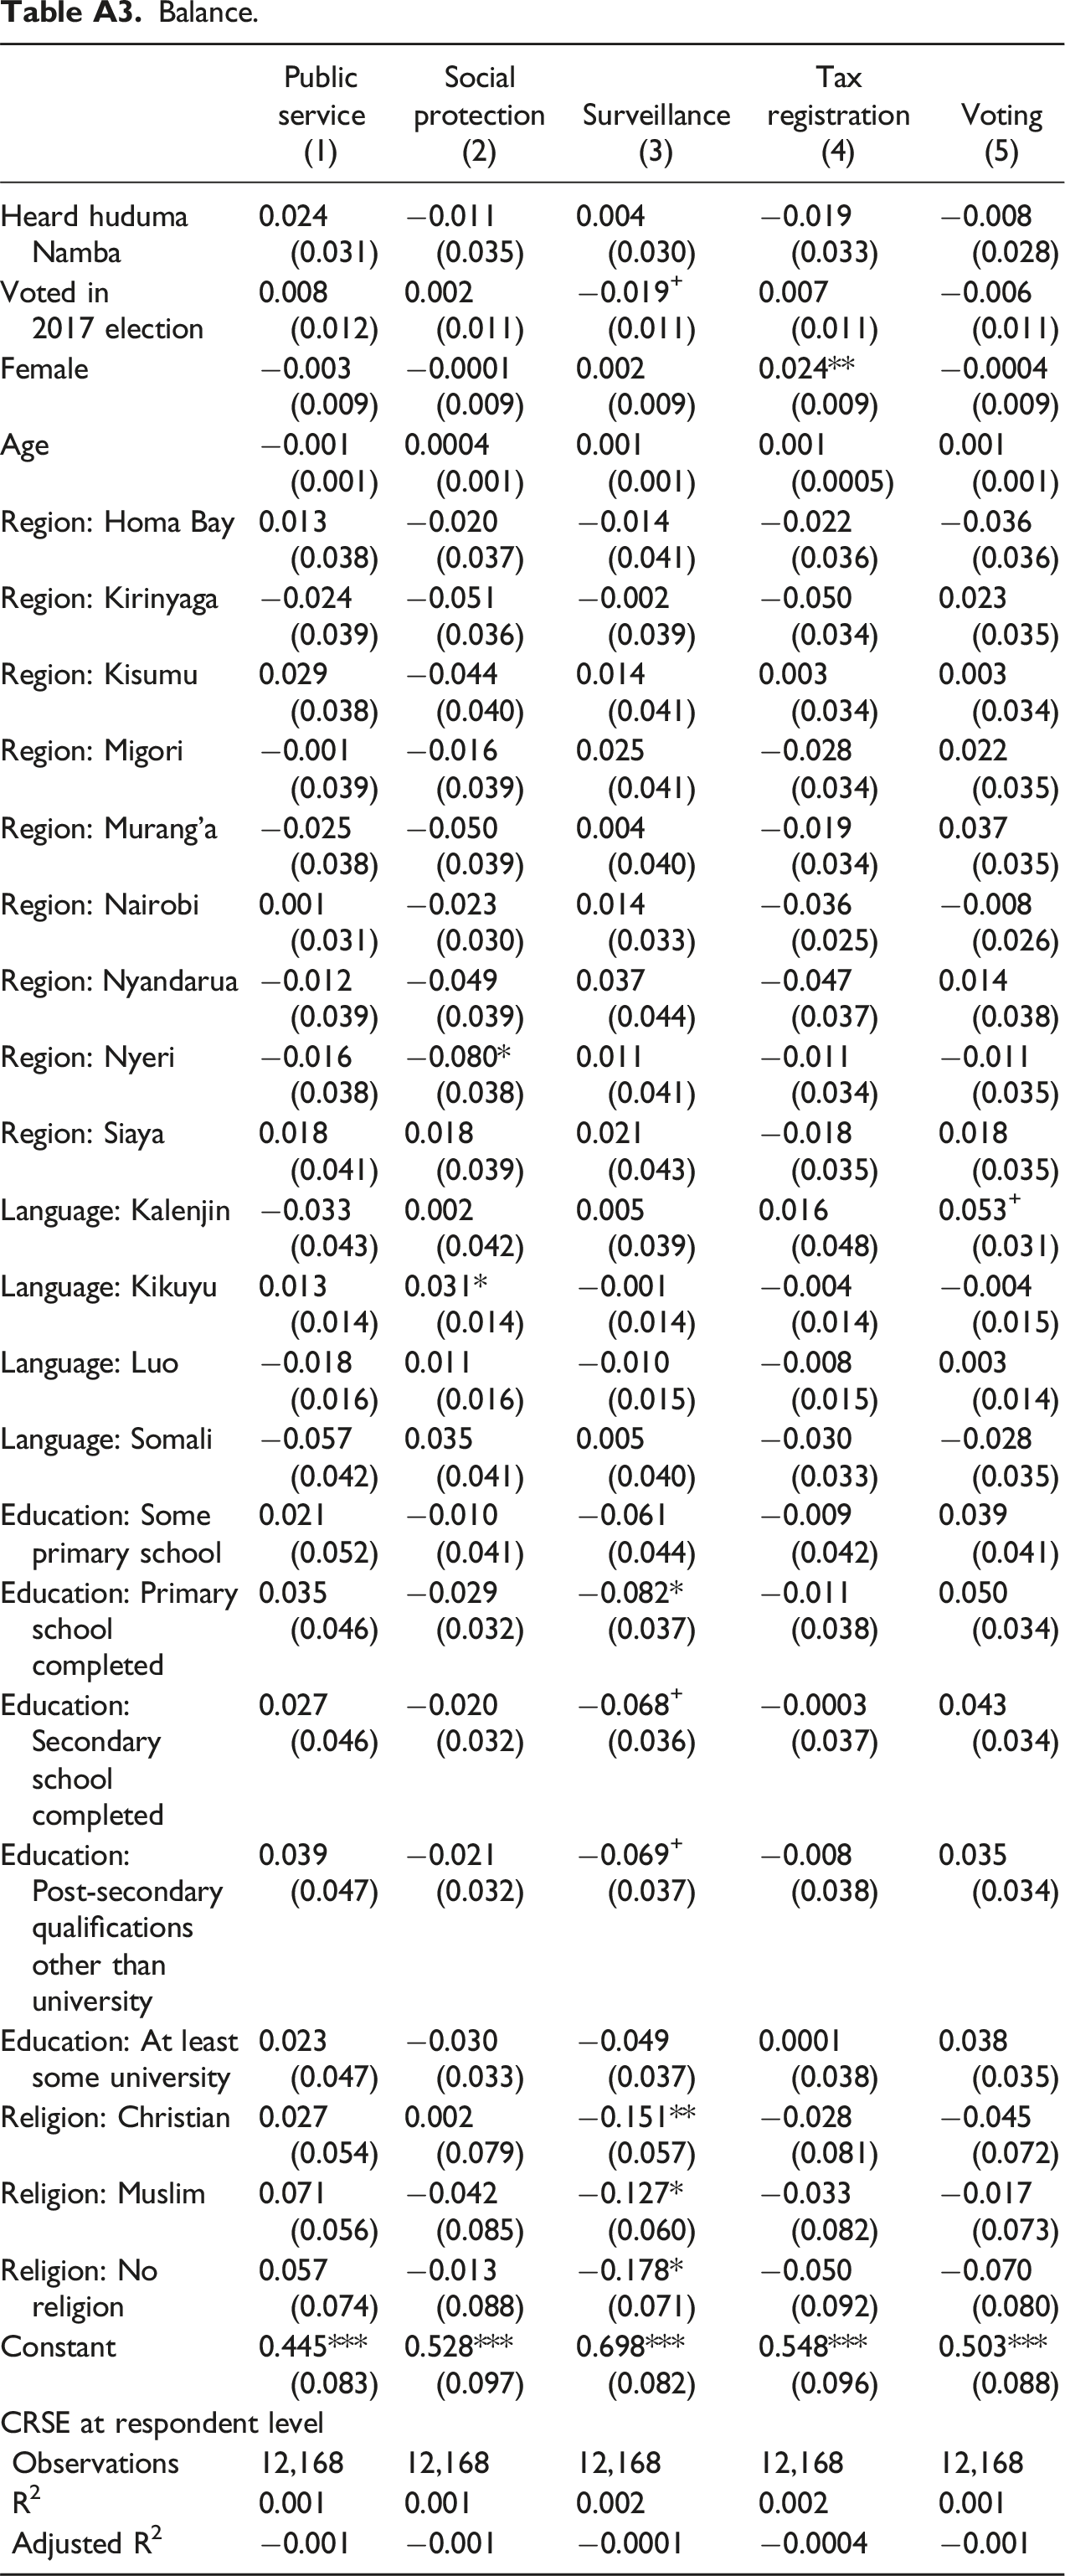
Public service (1)
Social protection (2)
Surveillance (3)
Tax registration (4)
Voting (5)
Heard huduma Namba
0.024 (0.031)
−0.011 (0.035)
0.004 (0.030)
−0.019 (0.033)
−0.008 (0.028)
Voted in 2017 election
0.008 (0.012)
0.002 (0.011)
−0.019+ (0.011)
0.007 (0.011)
−0.006 (0.011)
Female
−0.003 (0.009)
−0.0001 (0.009)
0.002 (0.009)
0.024** (0.009)
−0.0004 (0.009)
Age
−0.001 (0.001)
0.0004 (0.001)
0.001 (0.001)
0.001 (0.0005)
0.001 (0.001)
Region: Homa Bay
0.013 (0.038)
−0.020 (0.037)
−0.014 (0.041)
−0.022 (0.036)
−0.036 (0.036)
Region: Kirinyaga
−0.024 (0.039)
−0.051 (0.036)
−0.002 (0.039)
−0.050 (0.034)
0.023 (0.035)
Region: Kisumu
0.029 (0.038)
−0.044 (0.040)
0.014 (0.041)
0.003 (0.034)
0.003 (0.034)
Region: Migori
−0.001 (0.039)
−0.016 (0.039)
0.025 (0.041)
−0.028 (0.034)
0.022 (0.035)
Region: Murang’a
−0.025 (0.038)
−0.050 (0.039)
0.004 (0.040)
−0.019 (0.034)
0.037 (0.035)
Region: Nairobi
0.001 (0.031)
−0.023 (0.030)
0.014 (0.033)
−0.036 (0.025)
−0.008 (0.026)
Region: Nyandarua
−0.012 (0.039)
−0.049 (0.039)
0.037 (0.044)
−0.047 (0.037)
0.014 (0.038)
Region: Nyeri
−0.016 (0.038)
−0.080* (0.038)
0.011 (0.041)
−0.011 (0.034)
−0.011 (0.035)
Region: Siaya
0.018 (0.041)
0.018 (0.039)
0.021 (0.043)
−0.018 (0.035)
0.018 (0.035)
Language: Kalenjin
−0.033 (0.043)
0.002 (0.042)
0.005 (0.039)
0.016 (0.048)
0.053+ (0.031)
Language: Kikuyu
0.013 (0.014)
0.031* (0.014)
−0.001 (0.014)
−0.004 (0.014)
−0.004 (0.015)
Language: Luo
−0.018 (0.016)
0.011 (0.016)
−0.010 (0.015)
−0.008 (0.015)
0.003 (0.014)
Language: Somali
−0.057 (0.042)
0.035 (0.041)
0.005 (0.040)
−0.030 (0.033)
−0.028 (0.035)
Education: Some primary school
0.021 (0.052)
−0.010 (0.041)
−0.061 (0.044)
−0.009 (0.042)
0.039 (0.041)
Education: Primary school completed
0.035 (0.046)
−0.029 (0.032)
−0.082* (0.037)
−0.011 (0.038)
0.050 (0.034)
Education: Secondary school completed
0.027 (0.046)
−0.020 (0.032)
−0.068+ (0.036)
−0.0003 (0.037)
0.043 (0.034)
Education: Post-secondary qualifications other than university
0.039 (0.047)
−0.021 (0.032)
−0.069+ (0.037)
−0.008 (0.038)
0.035 (0.034)
Education: At least some university
0.023 (0.047)
−0.030 (0.033)
−0.049 (0.037)
0.0001 (0.038)
0.038 (0.035)
Religion: Christian
0.027 (0.054)
0.002 (0.079)
−0.151** (0.057)
−0.028 (0.081)
−0.045 (0.072)
Religion: Muslim
0.071 (0.056)
−0.042 (0.085)
−0.127* (0.060)
−0.033 (0.082)
−0.017 (0.073)
Religion: No religion
0.057 (0.074)
−0.013 (0.088)
−0.178* (0.071)
−0.050 (0.092)
−0.070 (0.080)
Constant
0.445*** (0.083)
0.528*** (0.097)
0.698*** (0.082)
0.548*** (0.096)
0.503*** (0.088)
CRSE at respondent level
Observations
12,168
12,168
12,168
12,168
12,168
R2
0.001
0.001
0.002
0.002
0.001
Adjusted R2
−0.001
−0.001
−0.0001
−0.0004
−0.001
Main Effects Analysis.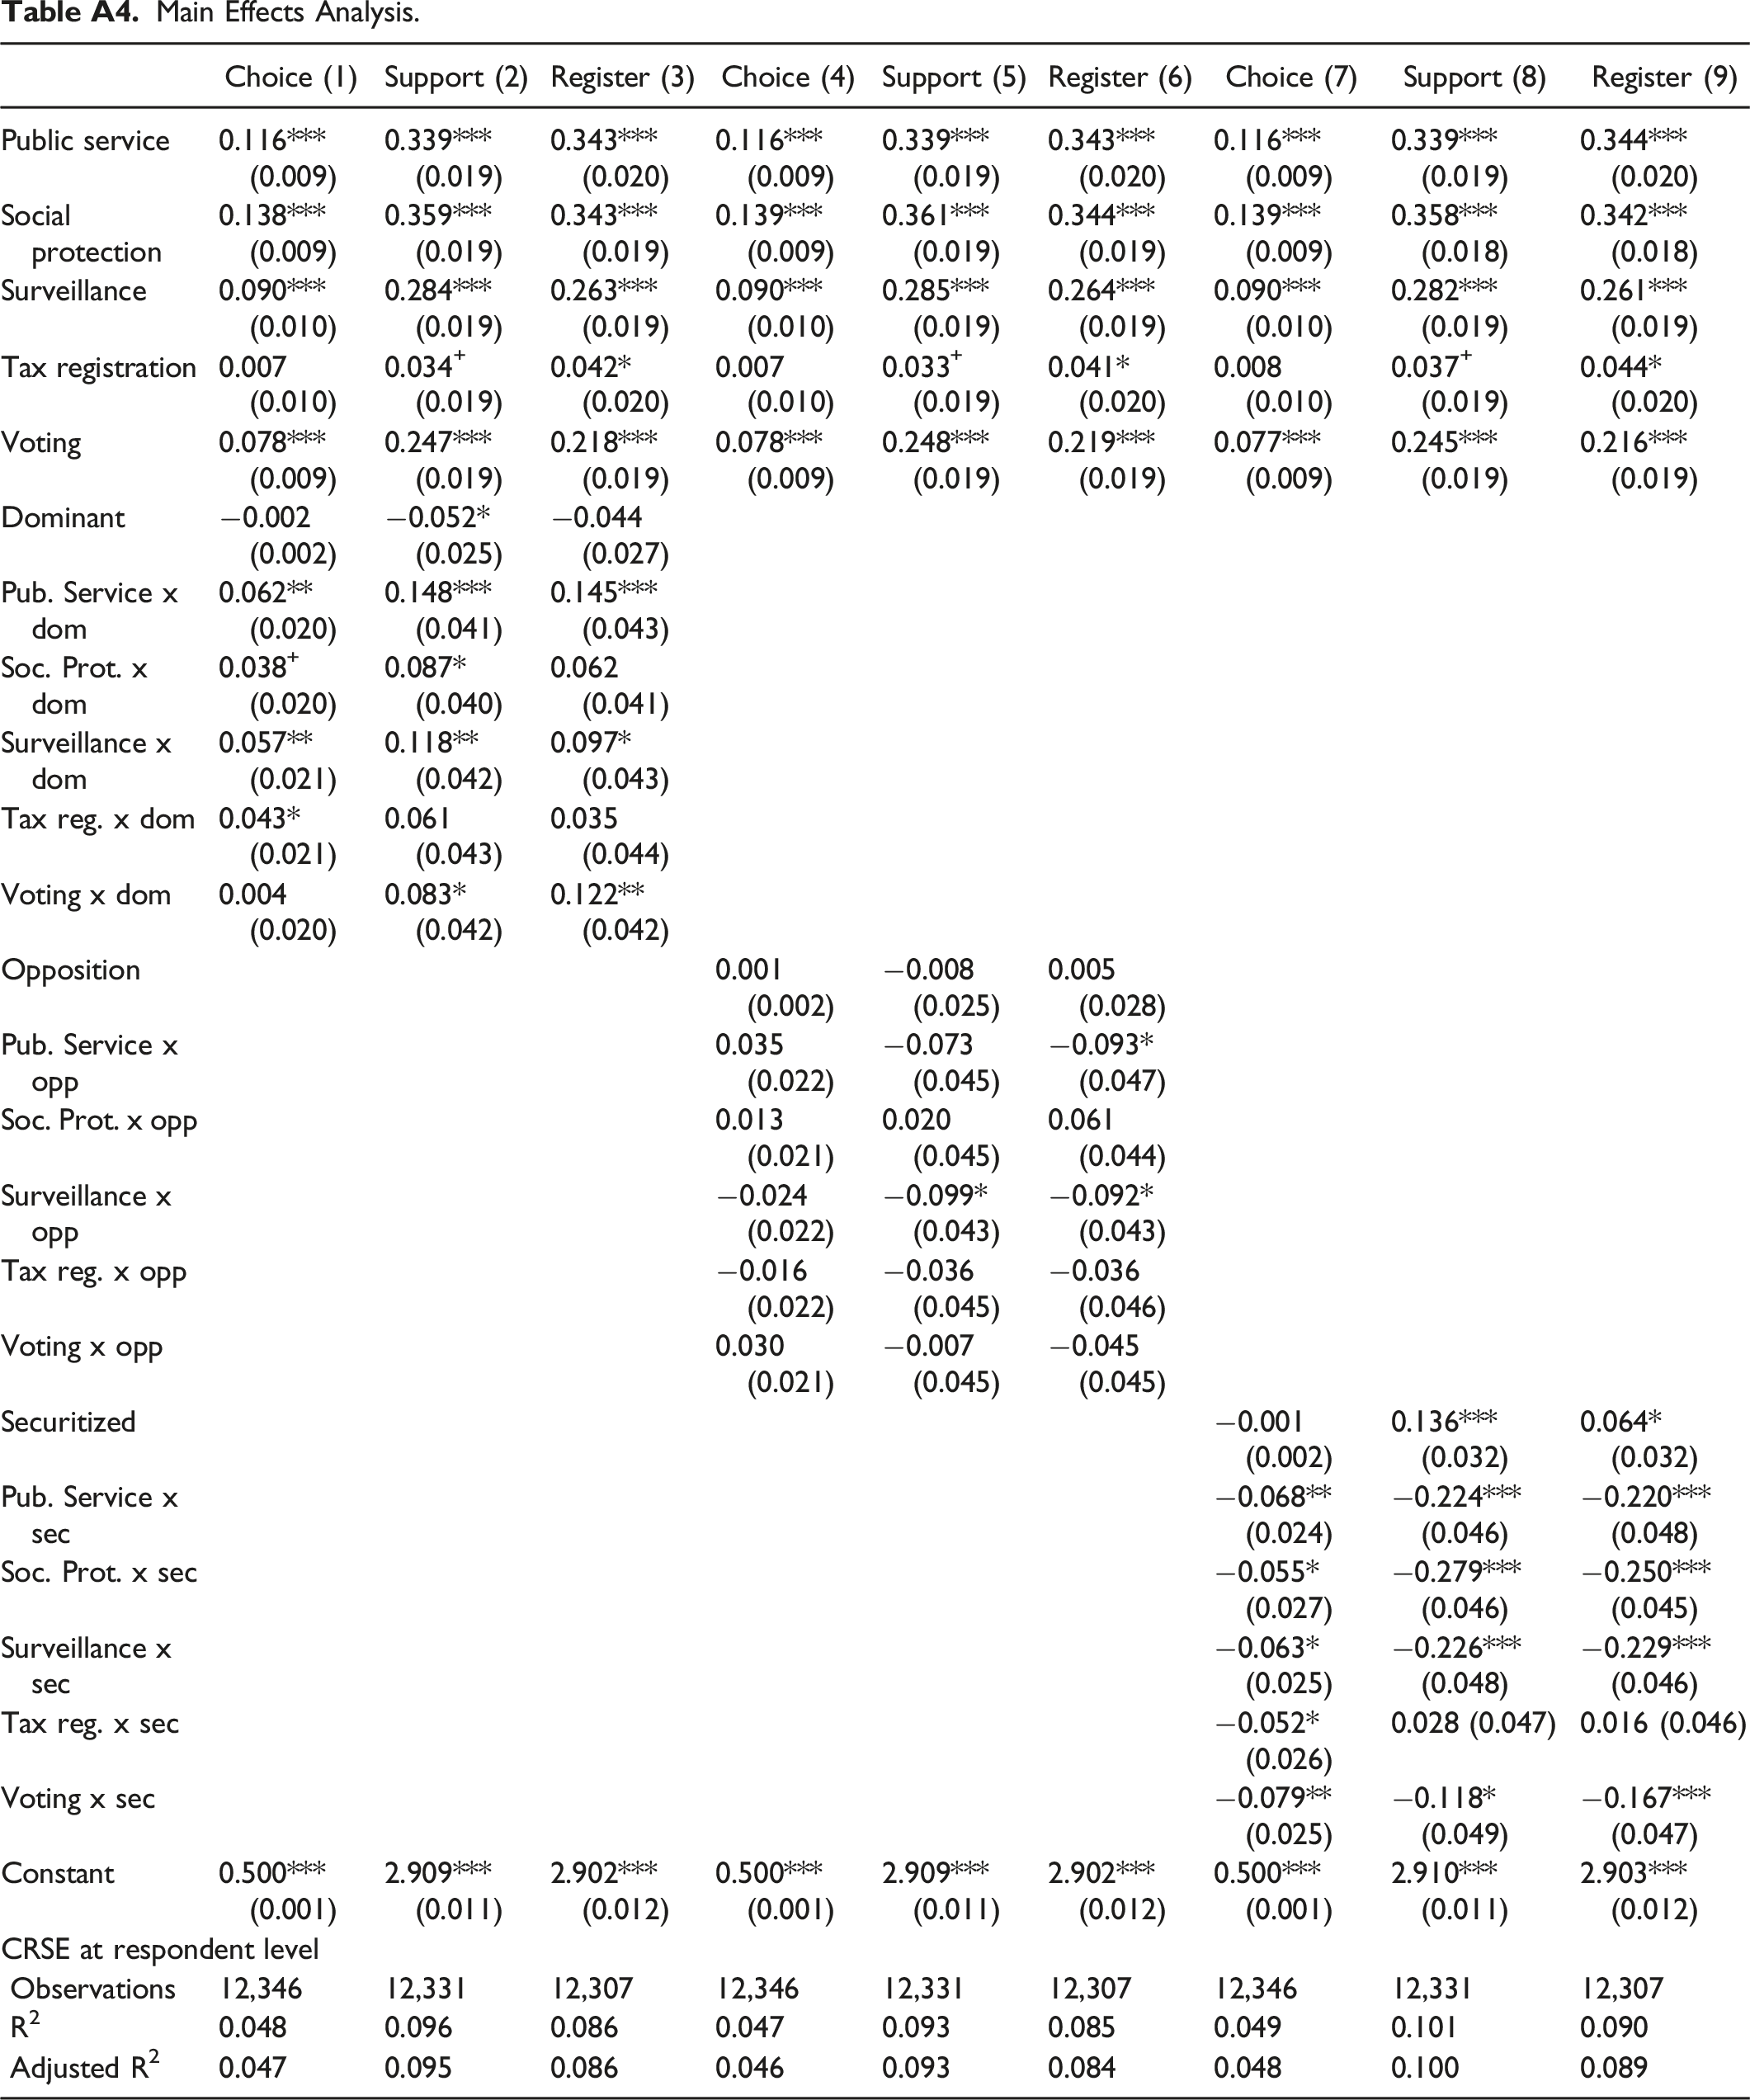
Choice (1)
Support (2)
Register (3)
Choice (4)
Support (5)
Register (6)
Choice (7)
Support (8)
Register (9)
Public service
0.116*** (0.009)
0.339*** (0.019)
0.343*** (0.020)
0.116*** (0.009)
0.339*** (0.019)
0.343*** (0.020)
0.116*** (0.009)
0.339*** (0.019)
0.344*** (0.020)
Social protection
0.138*** (0.009)
0.359*** (0.019)
0.343*** (0.019)
0.139*** (0.009)
0.361*** (0.019)
0.344*** (0.019)
0.139*** (0.009)
0.358*** (0.018)
0.342*** (0.018)
Surveillance
0.090*** (0.010)
0.284*** (0.019)
0.263*** (0.019)
0.090*** (0.010)
0.285*** (0.019)
0.264*** (0.019)
0.090*** (0.010)
0.282*** (0.019)
0.261*** (0.019)
Tax registration
0.007 (0.010)
0.034+ (0.019)
0.042* (0.020)
0.007 (0.010)
0.033+ (0.019)
0.041* (0.020)
0.008 (0.010)
0.037+ (0.019)
0.044* (0.020)
Voting
0.078*** (0.009)
0.247*** (0.019)
0.218*** (0.019)
0.078*** (0.009)
0.248*** (0.019)
0.219*** (0.019)
0.077*** (0.009)
0.245*** (0.019)
0.216*** (0.019)
Dominant
−0.002 (0.002)
−0.052* (0.025)
−0.044 (0.027)
Pub. Service x dom
0.062** (0.020)
0.148*** (0.041)
0.145*** (0.043)
Soc. Prot. x dom
0.038+ (0.020)
0.087* (0.040)
0.062 (0.041)
Surveillance x dom
0.057** (0.021)
0.118** (0.042)
0.097* (0.043)
Tax reg. x dom
0.043* (0.021)
0.061 (0.043)
0.035 (0.044)
Voting x dom
0.004 (0.020)
0.083* (0.042)
0.122** (0.042)
Opposition
0.001 (0.002)
−0.008 (0.025)
0.005 (0.028)
Pub. Service x opp
0.035 (0.022)
−0.073 (0.045)
−0.093* (0.047)
Soc. Prot. x opp
0.013 (0.021)
0.020 (0.045)
0.061 (0.044)
Surveillance x opp
−0.024 (0.022)
−0.099* (0.043)
−0.092* (0.043)
Tax reg. x opp
−0.016 (0.022)
−0.036 (0.045)
−0.036 (0.046)
Voting x opp
0.030 (0.021)
−0.007 (0.045)
−0.045 (0.045)
Securitized
−0.001 (0.002)
0.136*** (0.032)
0.064* (0.032)
Pub. Service x sec
−0.068** (0.024)
−0.224*** (0.046)
−0.220*** (0.048)
Soc. Prot. x sec
−0.055* (0.027)
−0.279*** (0.046)
−0.250*** (0.045)
Surveillance x sec
−0.063* (0.025)
−0.226*** (0.048)
−0.229*** (0.046)
Tax reg. x sec
−0.052* (0.026)
0.028 (0.047)
0.016 (0.046)
Voting x sec
−0.079** (0.025)
−0.118* (0.049)
−0.167*** (0.047)
Constant
0.500*** (0.001)
2.909*** (0.011)
2.902*** (0.012)
0.500*** (0.001)
2.909*** (0.011)
2.902*** (0.012)
0.500*** (0.001)
2.910*** (0.011)
2.903*** (0.012)
CRSE at respondent level
Observations
12,346
12,331
12,307
12,346
12,331
12,307
12,346
12,331
12,307
R2
0.048
0.096
0.086
0.047
0.093
0.085
0.049
0.101
0.090
Adjusted R2
0.047
0.095
0.086
0.046
0.093
0.084
0.048
0.100
0.089
Main Effects Mechanisms: Dominant.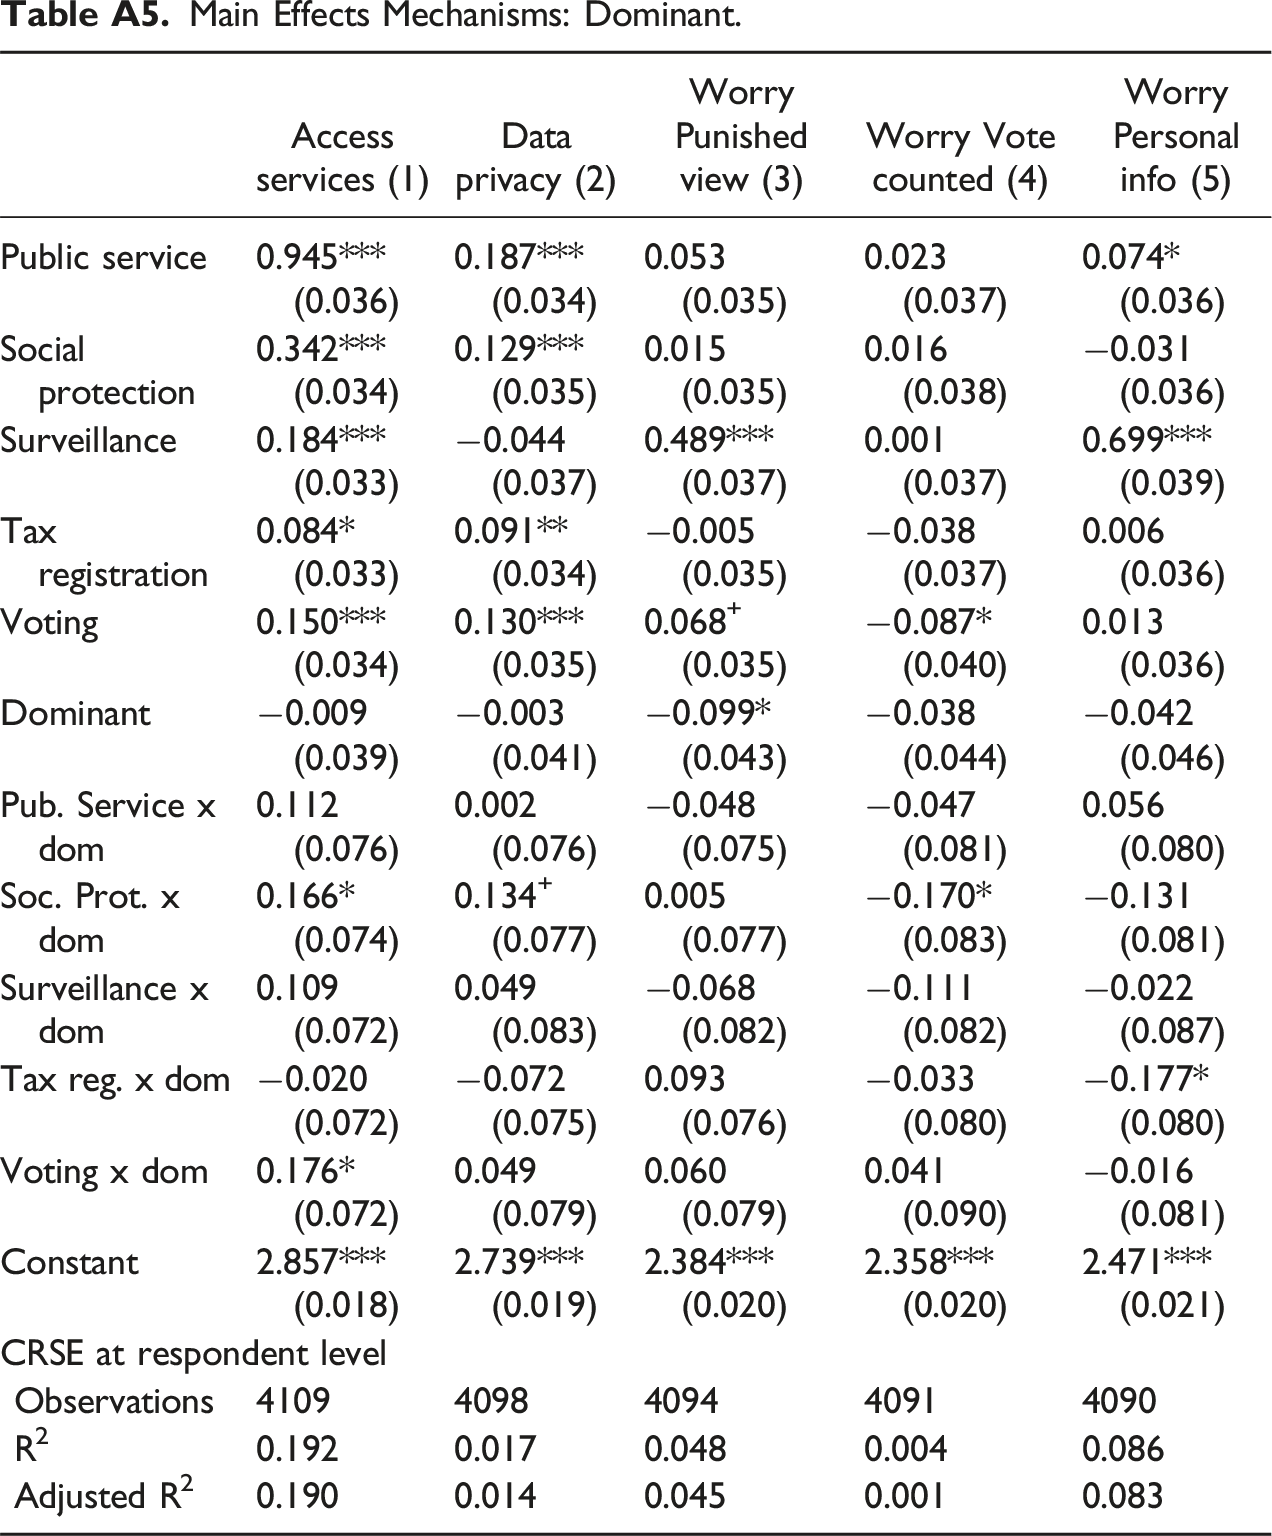
Access services (1)
Data privacy (2)
Worry Punished view (3)
Worry Vote counted (4)
Worry Personal info (5)
Public service
0.945*** (0.036)
0.187*** (0.034)
0.053 (0.035)
0.023 (0.037)
0.074* (0.036)
Social protection
0.342*** (0.034)
0.129*** (0.035)
0.015 (0.035)
0.016 (0.038)
−0.031 (0.036)
Surveillance
0.184*** (0.033)
−0.044 (0.037)
0.489*** (0.037)
0.001 (0.037)
0.699*** (0.039)
Tax registration
0.084* (0.033)
0.091** (0.034)
−0.005 (0.035)
−0.038 (0.037)
0.006 (0.036)
Voting
0.150*** (0.034)
0.130*** (0.035)
0.068+ (0.035)
−0.087* (0.040)
0.013 (0.036)
Dominant
−0.009 (0.039)
−0.003 (0.041)
−0.099* (0.043)
−0.038 (0.044)
−0.042 (0.046)
Pub. Service x dom
0.112 (0.076)
0.002 (0.076)
−0.048 (0.075)
−0.047 (0.081)
0.056 (0.080)
Soc. Prot. x dom
0.166* (0.074)
0.134+ (0.077)
0.005 (0.077)
−0.170* (0.083)
−0.131 (0.081)
Surveillance x dom
0.109 (0.072)
0.049 (0.083)
−0.068 (0.082)
−0.111 (0.082)
−0.022 (0.087)
Tax reg. x dom
−0.020 (0.072)
−0.072 (0.075)
0.093 (0.076)
−0.033 (0.080)
−0.177* (0.080)
Voting x dom
0.176* (0.072)
0.049 (0.079)
0.060 (0.079)
0.041 (0.090)
−0.016 (0.081)
Constant
2.857*** (0.018)
2.739*** (0.019)
2.384*** (0.020)
2.358*** (0.020)
2.471*** (0.021)
CRSE at respondent level
Observations
4109
4098
4094
4091
4090
R2
0.192
0.017
0.048
0.004
0.086
Adjusted R2
0.190
0.014
0.045
0.001
0.083
Main Effects Mechanisms: Opposition.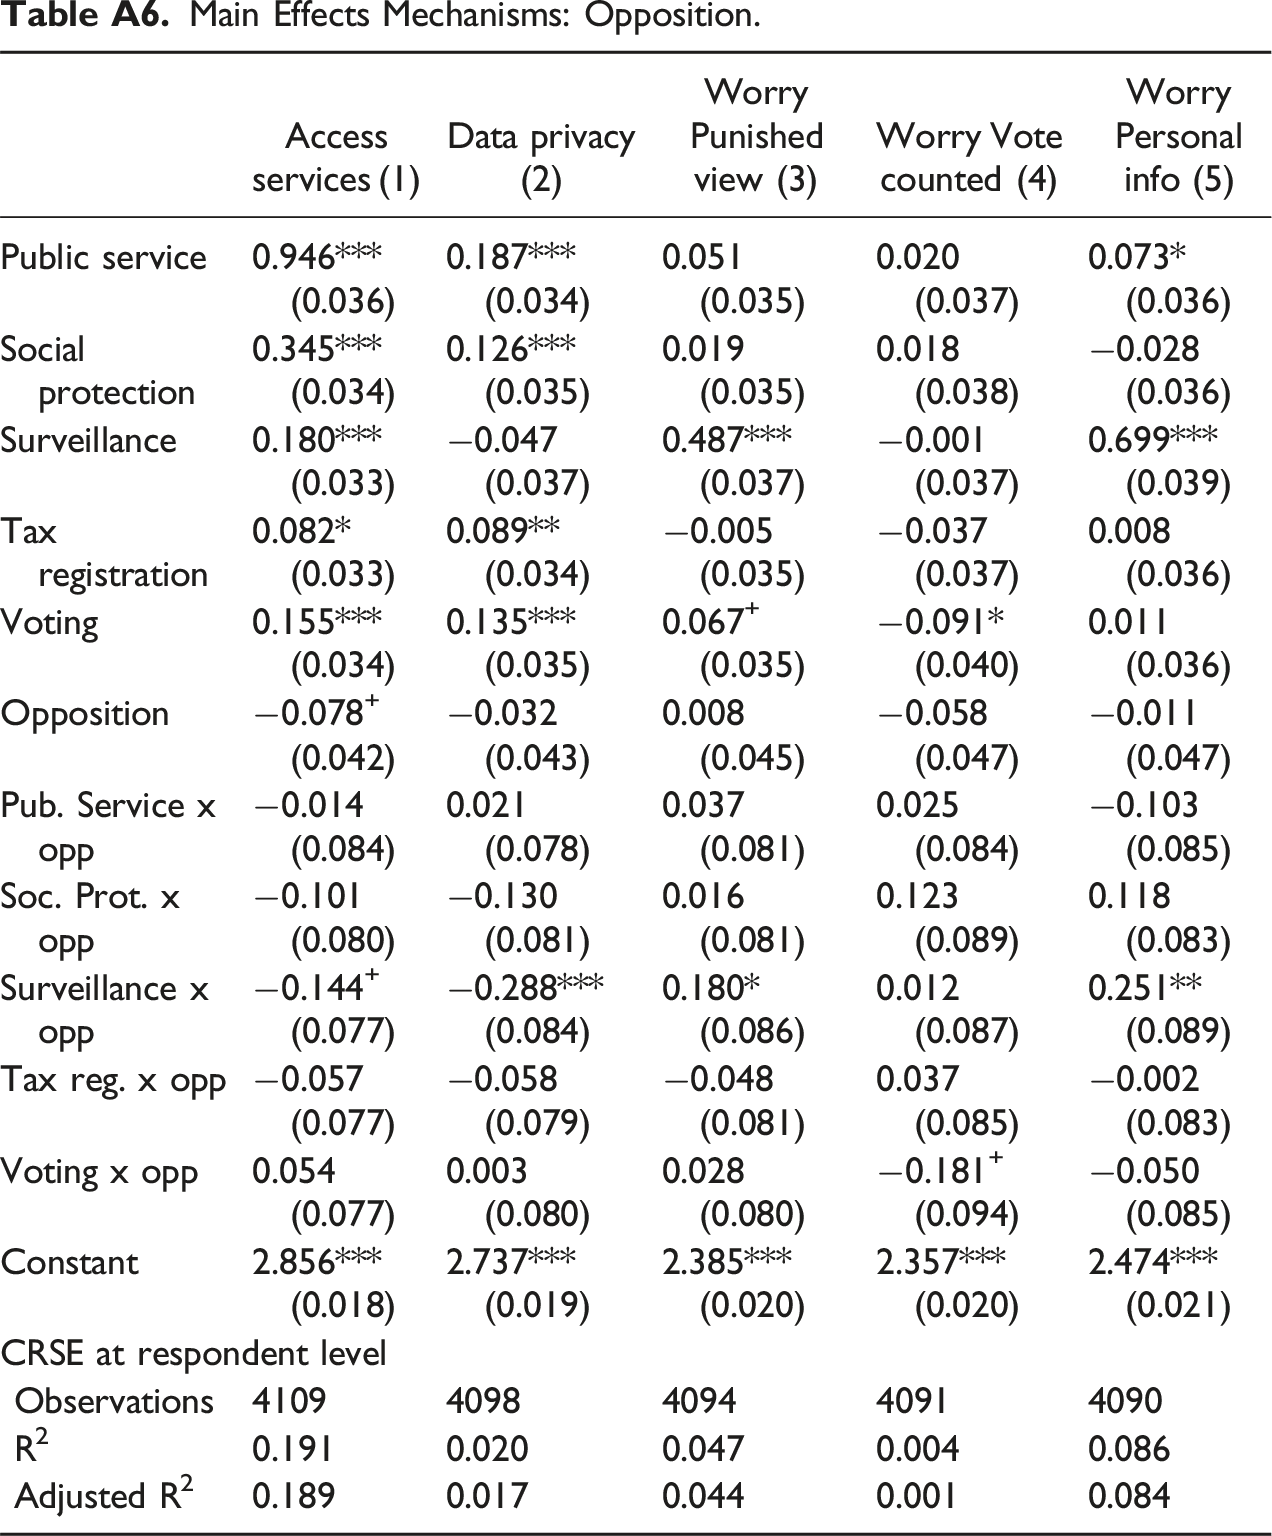
Access services (1)
Data privacy (2)
Worry Punished view (3)
Worry Vote counted (4)
Worry Personal info (5)
Public service
0.946*** (0.036)
0.187*** (0.034)
0.051 (0.035)
0.020 (0.037)
0.073* (0.036)
Social protection
0.345*** (0.034)
0.126*** (0.035)
0.019 (0.035)
0.018 (0.038)
−0.028 (0.036)
Surveillance
0.180*** (0.033)
−0.047 (0.037)
0.487*** (0.037)
−0.001 (0.037)
0.699*** (0.039)
Tax registration
0.082* (0.033)
0.089** (0.034)
−0.005 (0.035)
−0.037 (0.037)
0.008 (0.036)
Voting
0.155*** (0.034)
0.135*** (0.035)
0.067+ (0.035)
−0.091* (0.040)
0.011 (0.036)
Opposition
−0.078+ (0.042)
−0.032 (0.043)
0.008 (0.045)
−0.058 (0.047)
−0.011 (0.047)
Pub. Service x opp
−0.014 (0.084)
0.021 (0.078)
0.037 (0.081)
0.025 (0.084)
−0.103 (0.085)
Soc. Prot. x opp
−0.101 (0.080)
−0.130 (0.081)
0.016 (0.081)
0.123 (0.089)
0.118 (0.083)
Surveillance x opp
−0.144+ (0.077)
−0.288*** (0.084)
0.180* (0.086)
0.012 (0.087)
0.251** (0.089)
Tax reg. x opp
−0.057 (0.077)
−0.058 (0.079)
−0.048 (0.081)
0.037 (0.085)
−0.002 (0.083)
Voting x opp
0.054 (0.077)
0.003 (0.080)
0.028 (0.080)
−0.181+ (0.094)
−0.050 (0.085)
Constant
2.856*** (0.018)
2.737*** (0.019)
2.385*** (0.020)
2.357*** (0.020)
2.474*** (0.021)
CRSE at respondent level
Observations
4109
4098
4094
4091
4090
R2
0.191
0.020
0.047
0.004
0.086
Adjusted R2
0.189
0.017
0.044
0.001
0.084
Main Effects Mechanisms: Securitized.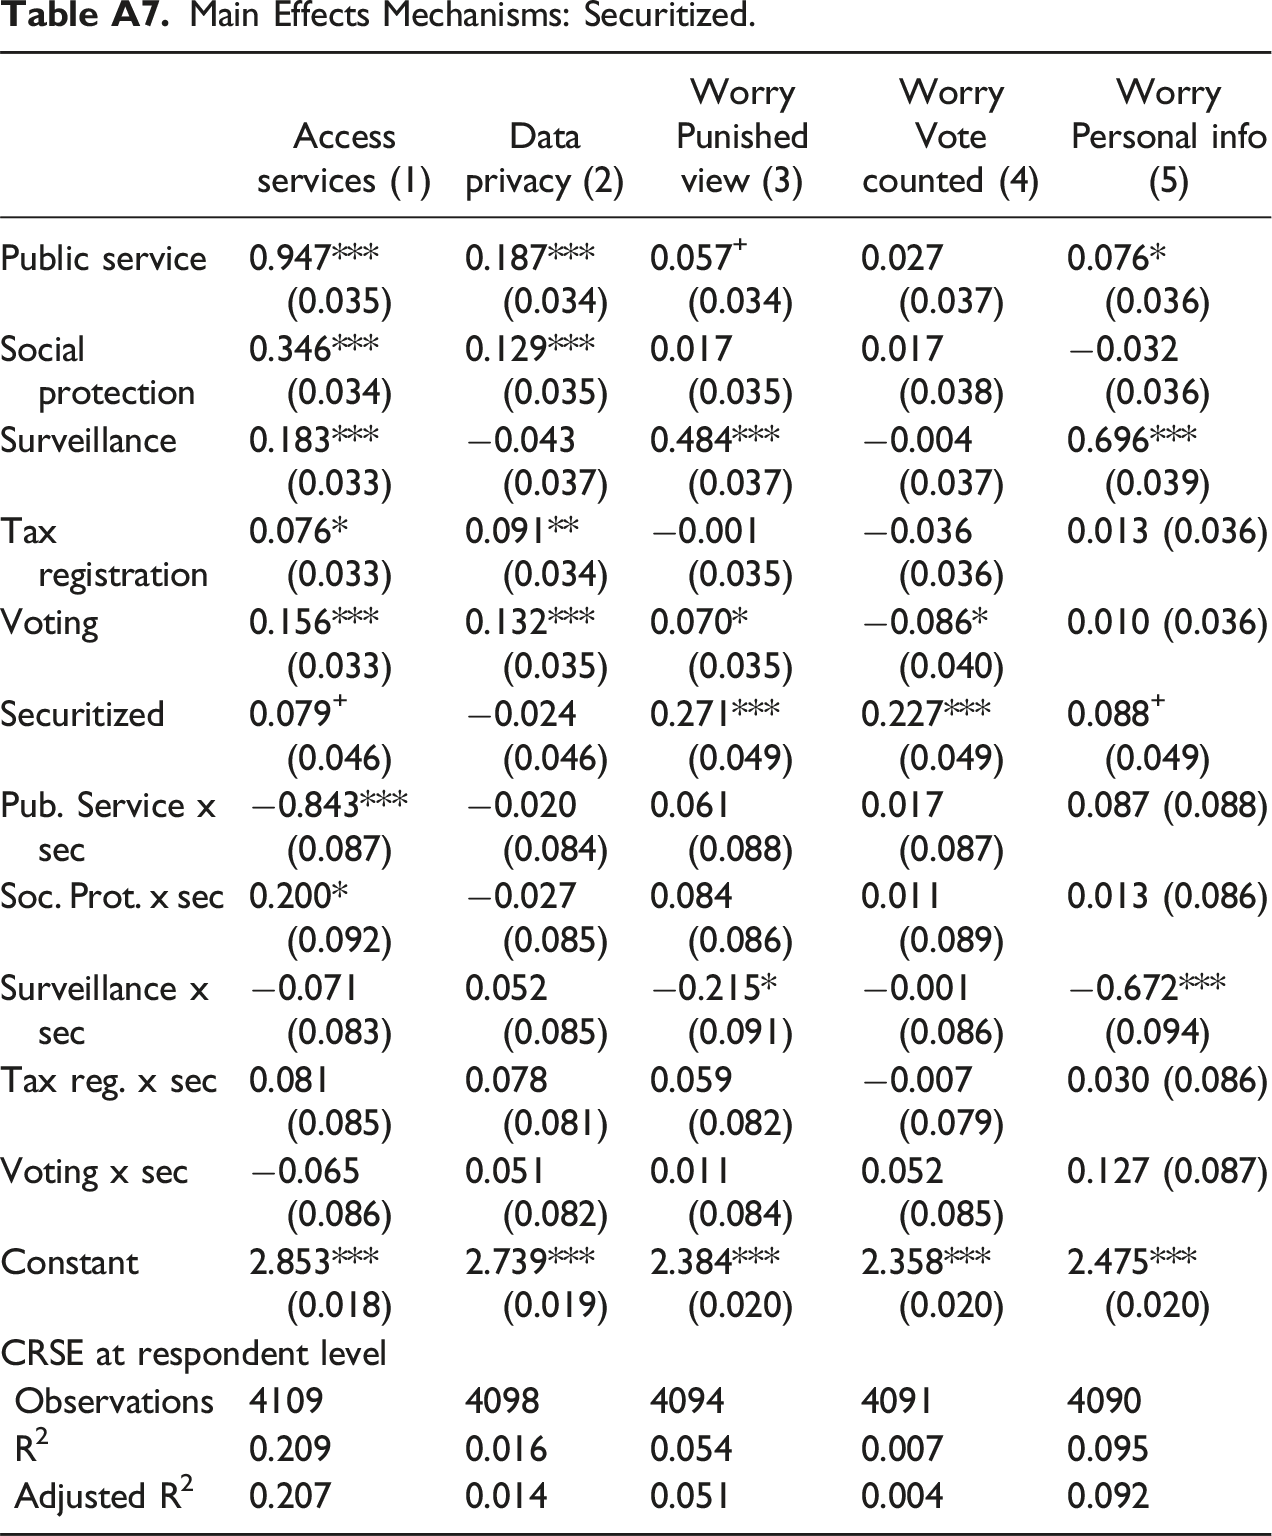
Access services (1)
Data privacy (2)
Worry Punished view (3)
Worry Vote counted (4)
Worry Personal info (5)
Public service
0.947*** (0.035)
0.187*** (0.034)
0.057+ (0.034)
0.027 (0.037)
0.076* (0.036)
Social protection
0.346*** (0.034)
0.129*** (0.035)
0.017 (0.035)
0.017 (0.038)
−0.032 (0.036)
Surveillance
0.183*** (0.033)
−0.043 (0.037)
0.484*** (0.037)
−0.004 (0.037)
0.696*** (0.039)
Tax registration
0.076* (0.033)
0.091** (0.034)
−0.001 (0.035)
−0.036 (0.036)
0.013 (0.036)
Voting
0.156*** (0.033)
0.132*** (0.035)
0.070* (0.035)
−0.086* (0.040)
0.010 (0.036)
Securitized
0.079+ (0.046)
−0.024 (0.046)
0.271*** (0.049)
0.227*** (0.049)
0.088+ (0.049)
Pub. Service x sec
−0.843*** (0.087)
−0.020 (0.084)
0.061 (0.088)
0.017 (0.087)
0.087 (0.088)
Soc. Prot. x sec
0.200* (0.092)
−0.027 (0.085)
0.084 (0.086)
0.011 (0.089)
0.013 (0.086)
Surveillance x sec
−0.071 (0.083)
0.052 (0.085)
−0.215* (0.091)
−0.001 (0.086)
−0.672*** (0.094)
Tax reg. x sec
0.081 (0.085)
0.078 (0.081)
0.059 (0.082)
−0.007 (0.079)
0.030 (0.086)
Voting x sec
−0.065 (0.086)
0.051 (0.082)
0.011 (0.084)
0.052 (0.085)
0.127 (0.087)
Constant
2.853*** (0.018)
2.739*** (0.019)
2.384*** (0.020)
2.358*** (0.020)
2.475*** (0.020)
CRSE at respondent level
Observations
4109
4098
4094
4091
4090
R2
0.209
0.016
0.054
0.007
0.095
Adjusted R2
0.207
0.014
0.051
0.004
0.092
Marginal Means: Belief that the digital ID policy would make it easier to access government service. Marginal Means: Belief that the privacy of data would be adequately protected under the digital ID. Marginal Means: Concern about the police using one’s personal information under the digital ID policy. Marginal Means: Concern about one’s vote being counted under the digital ID policy. Marginal Means: Concern about being punished for expressing political views under the digital ID policy.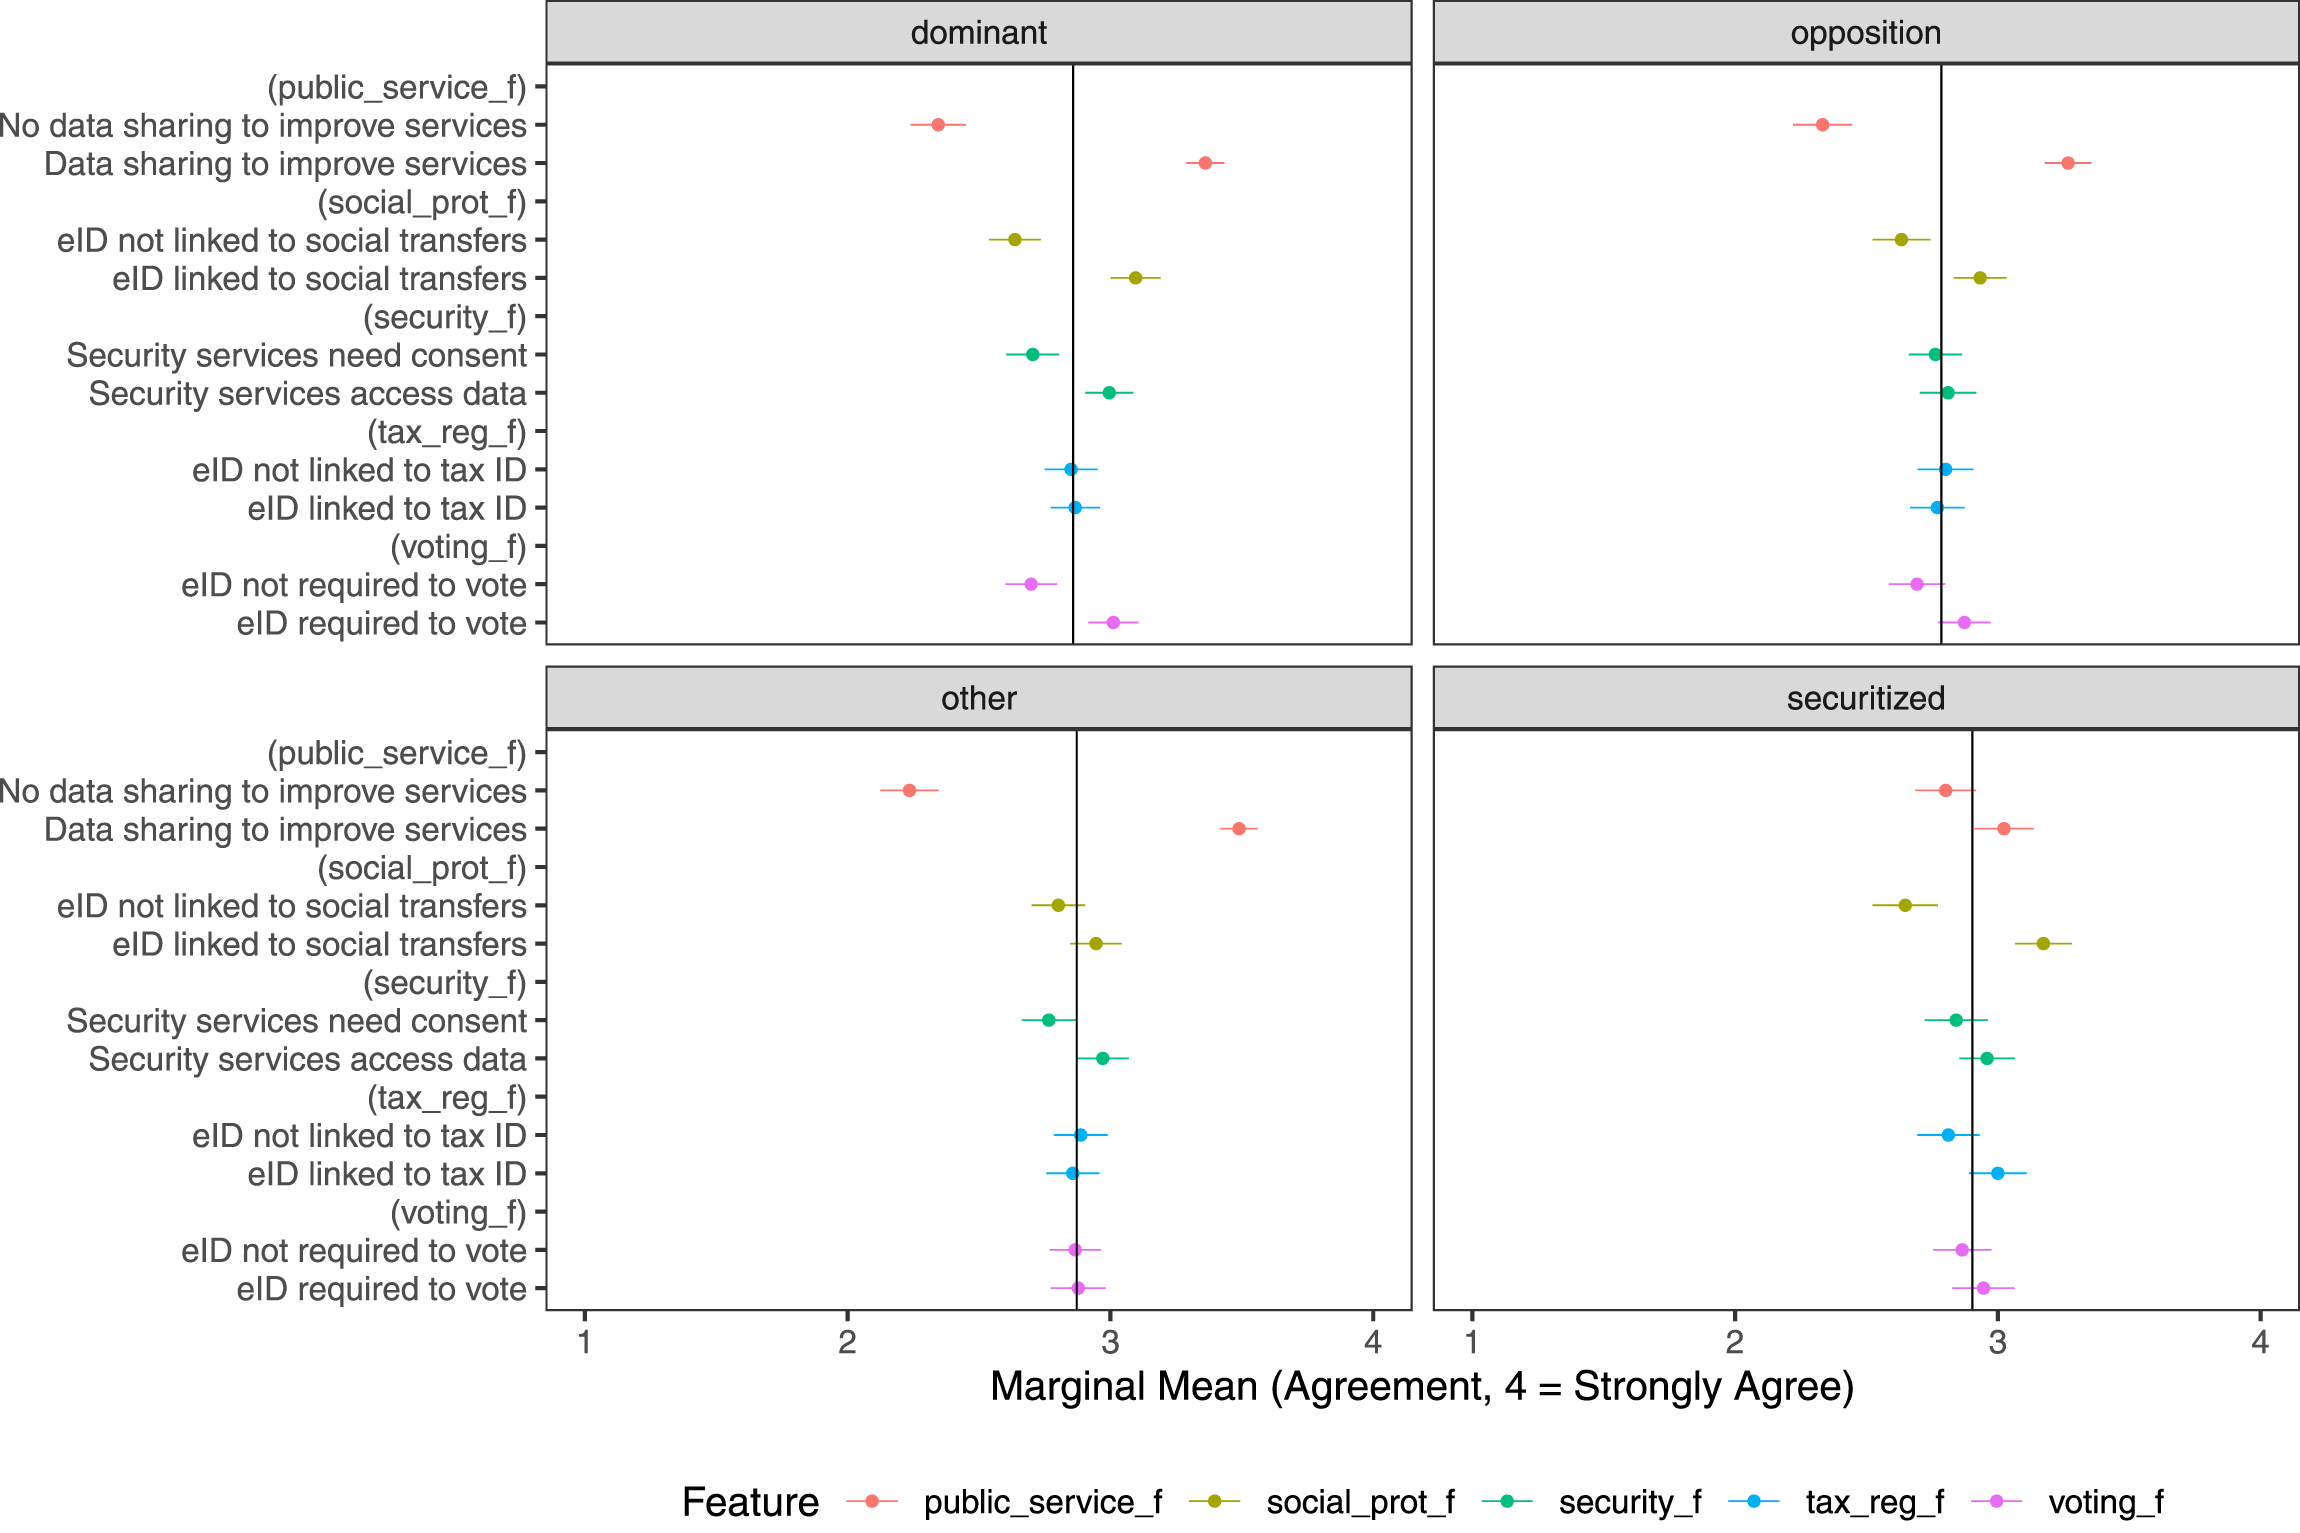
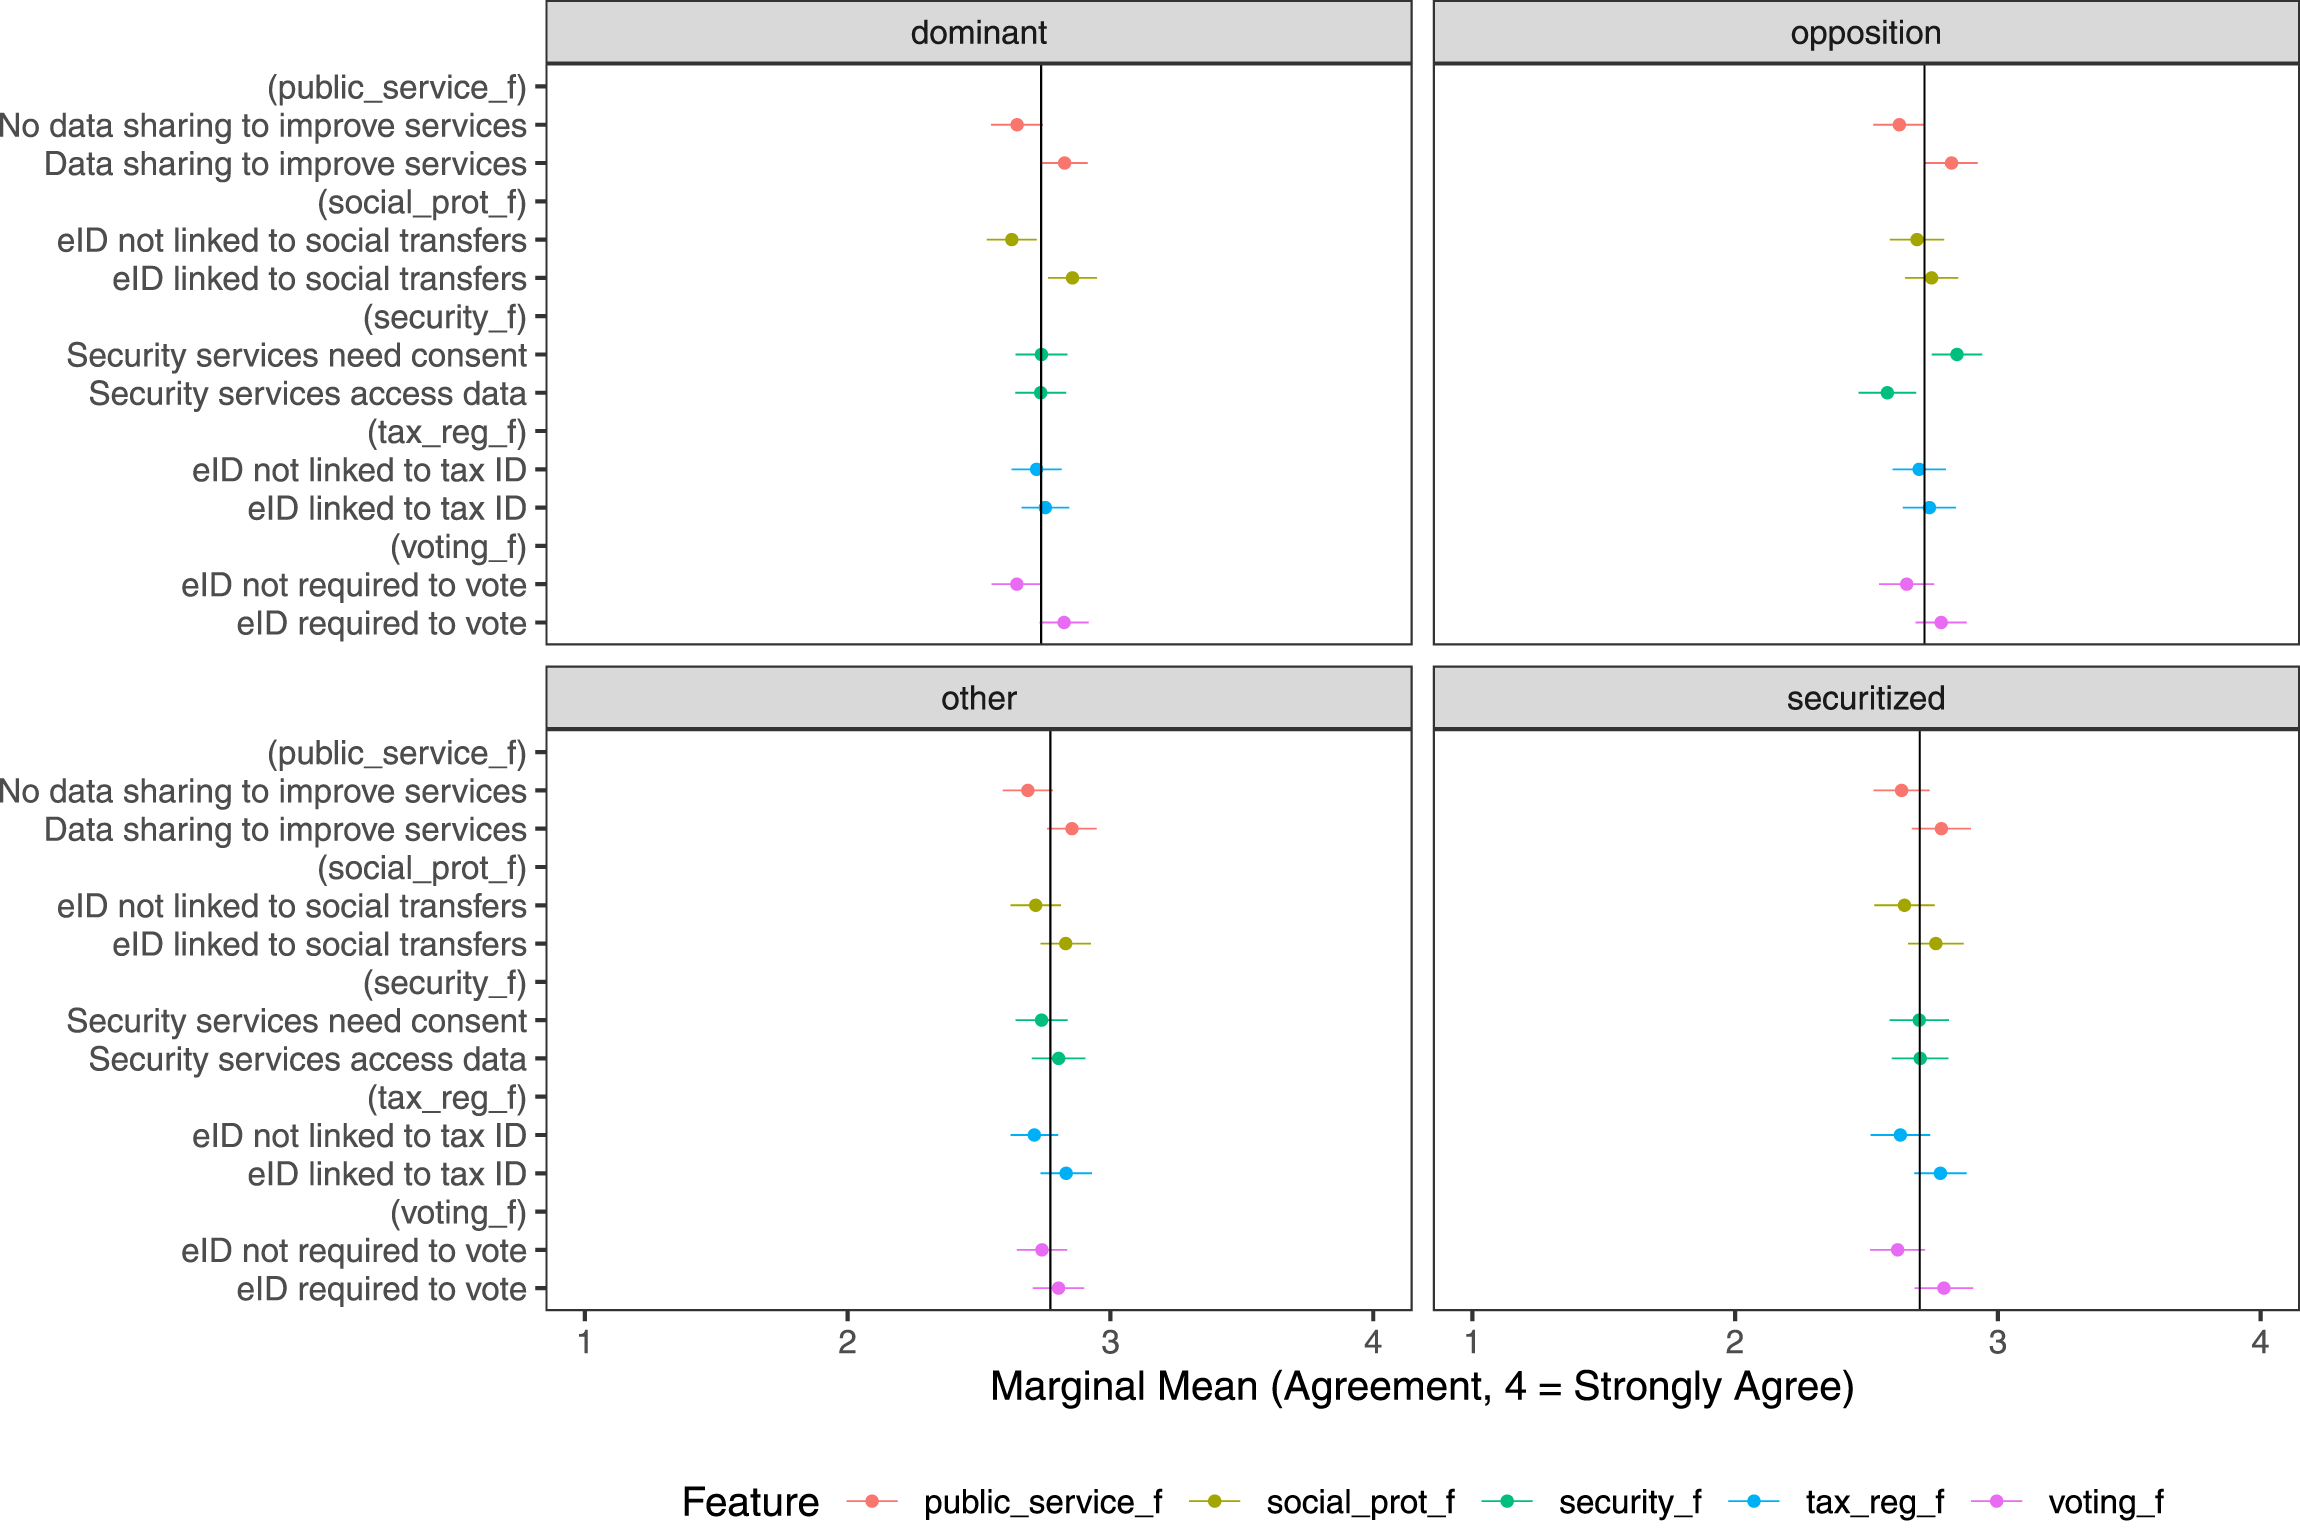
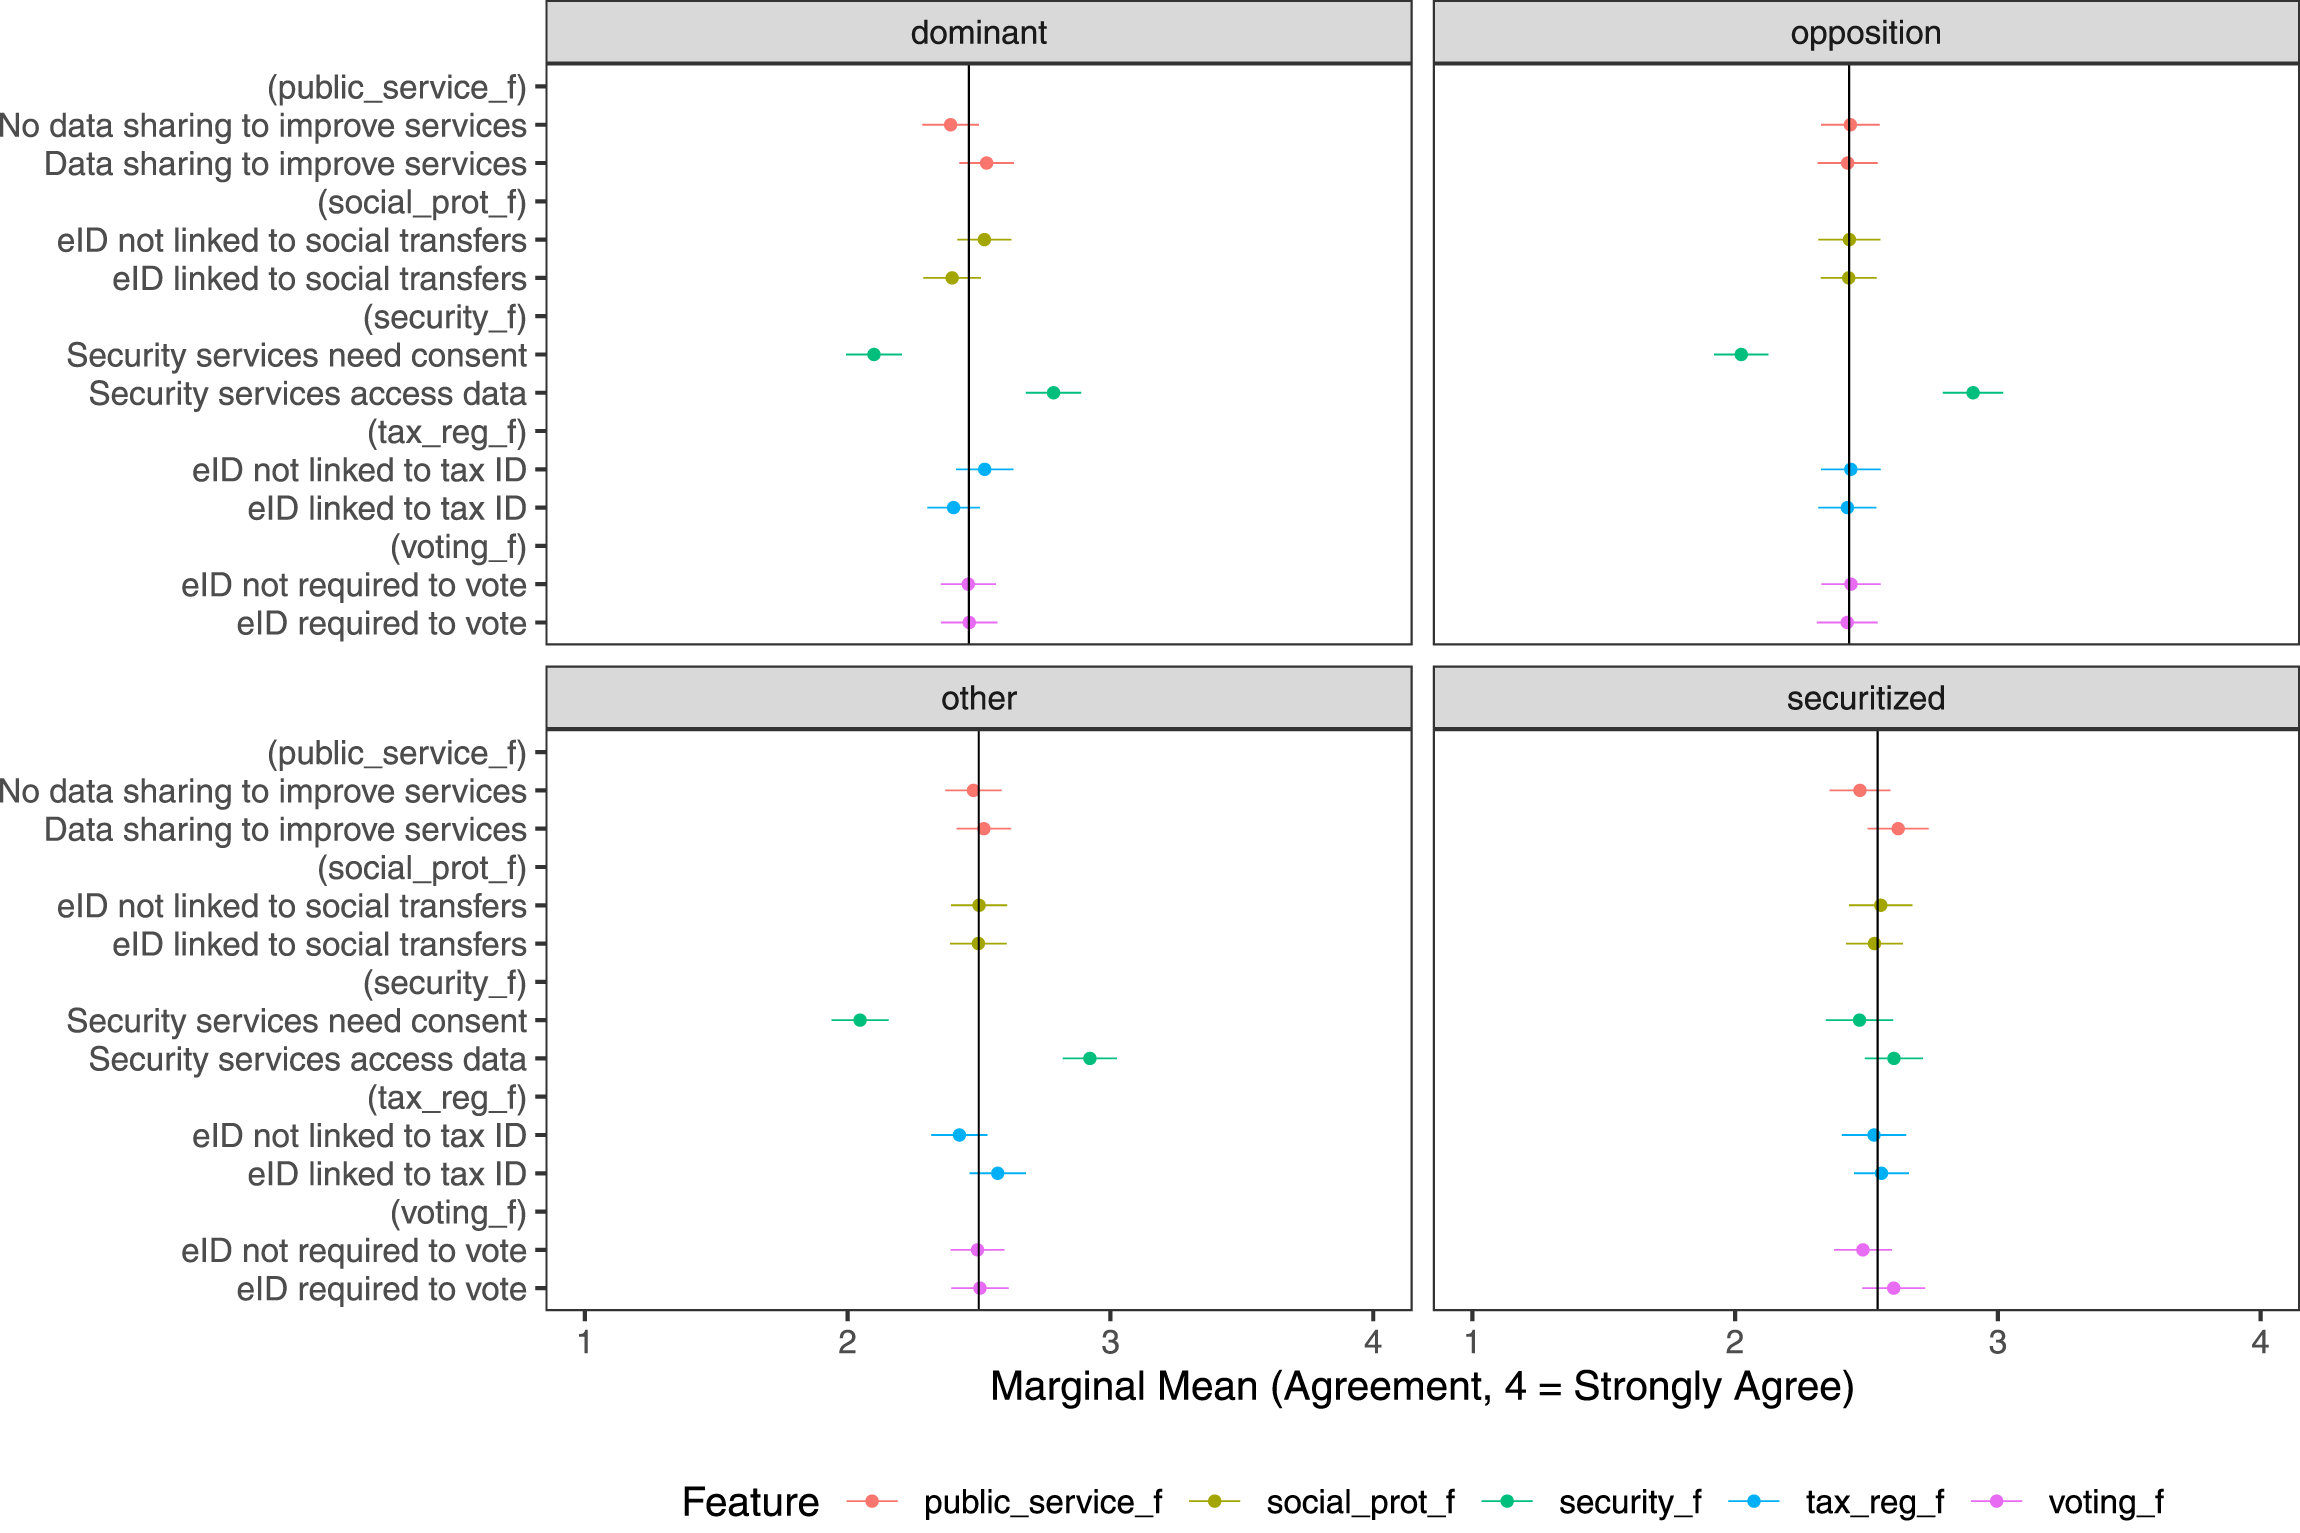
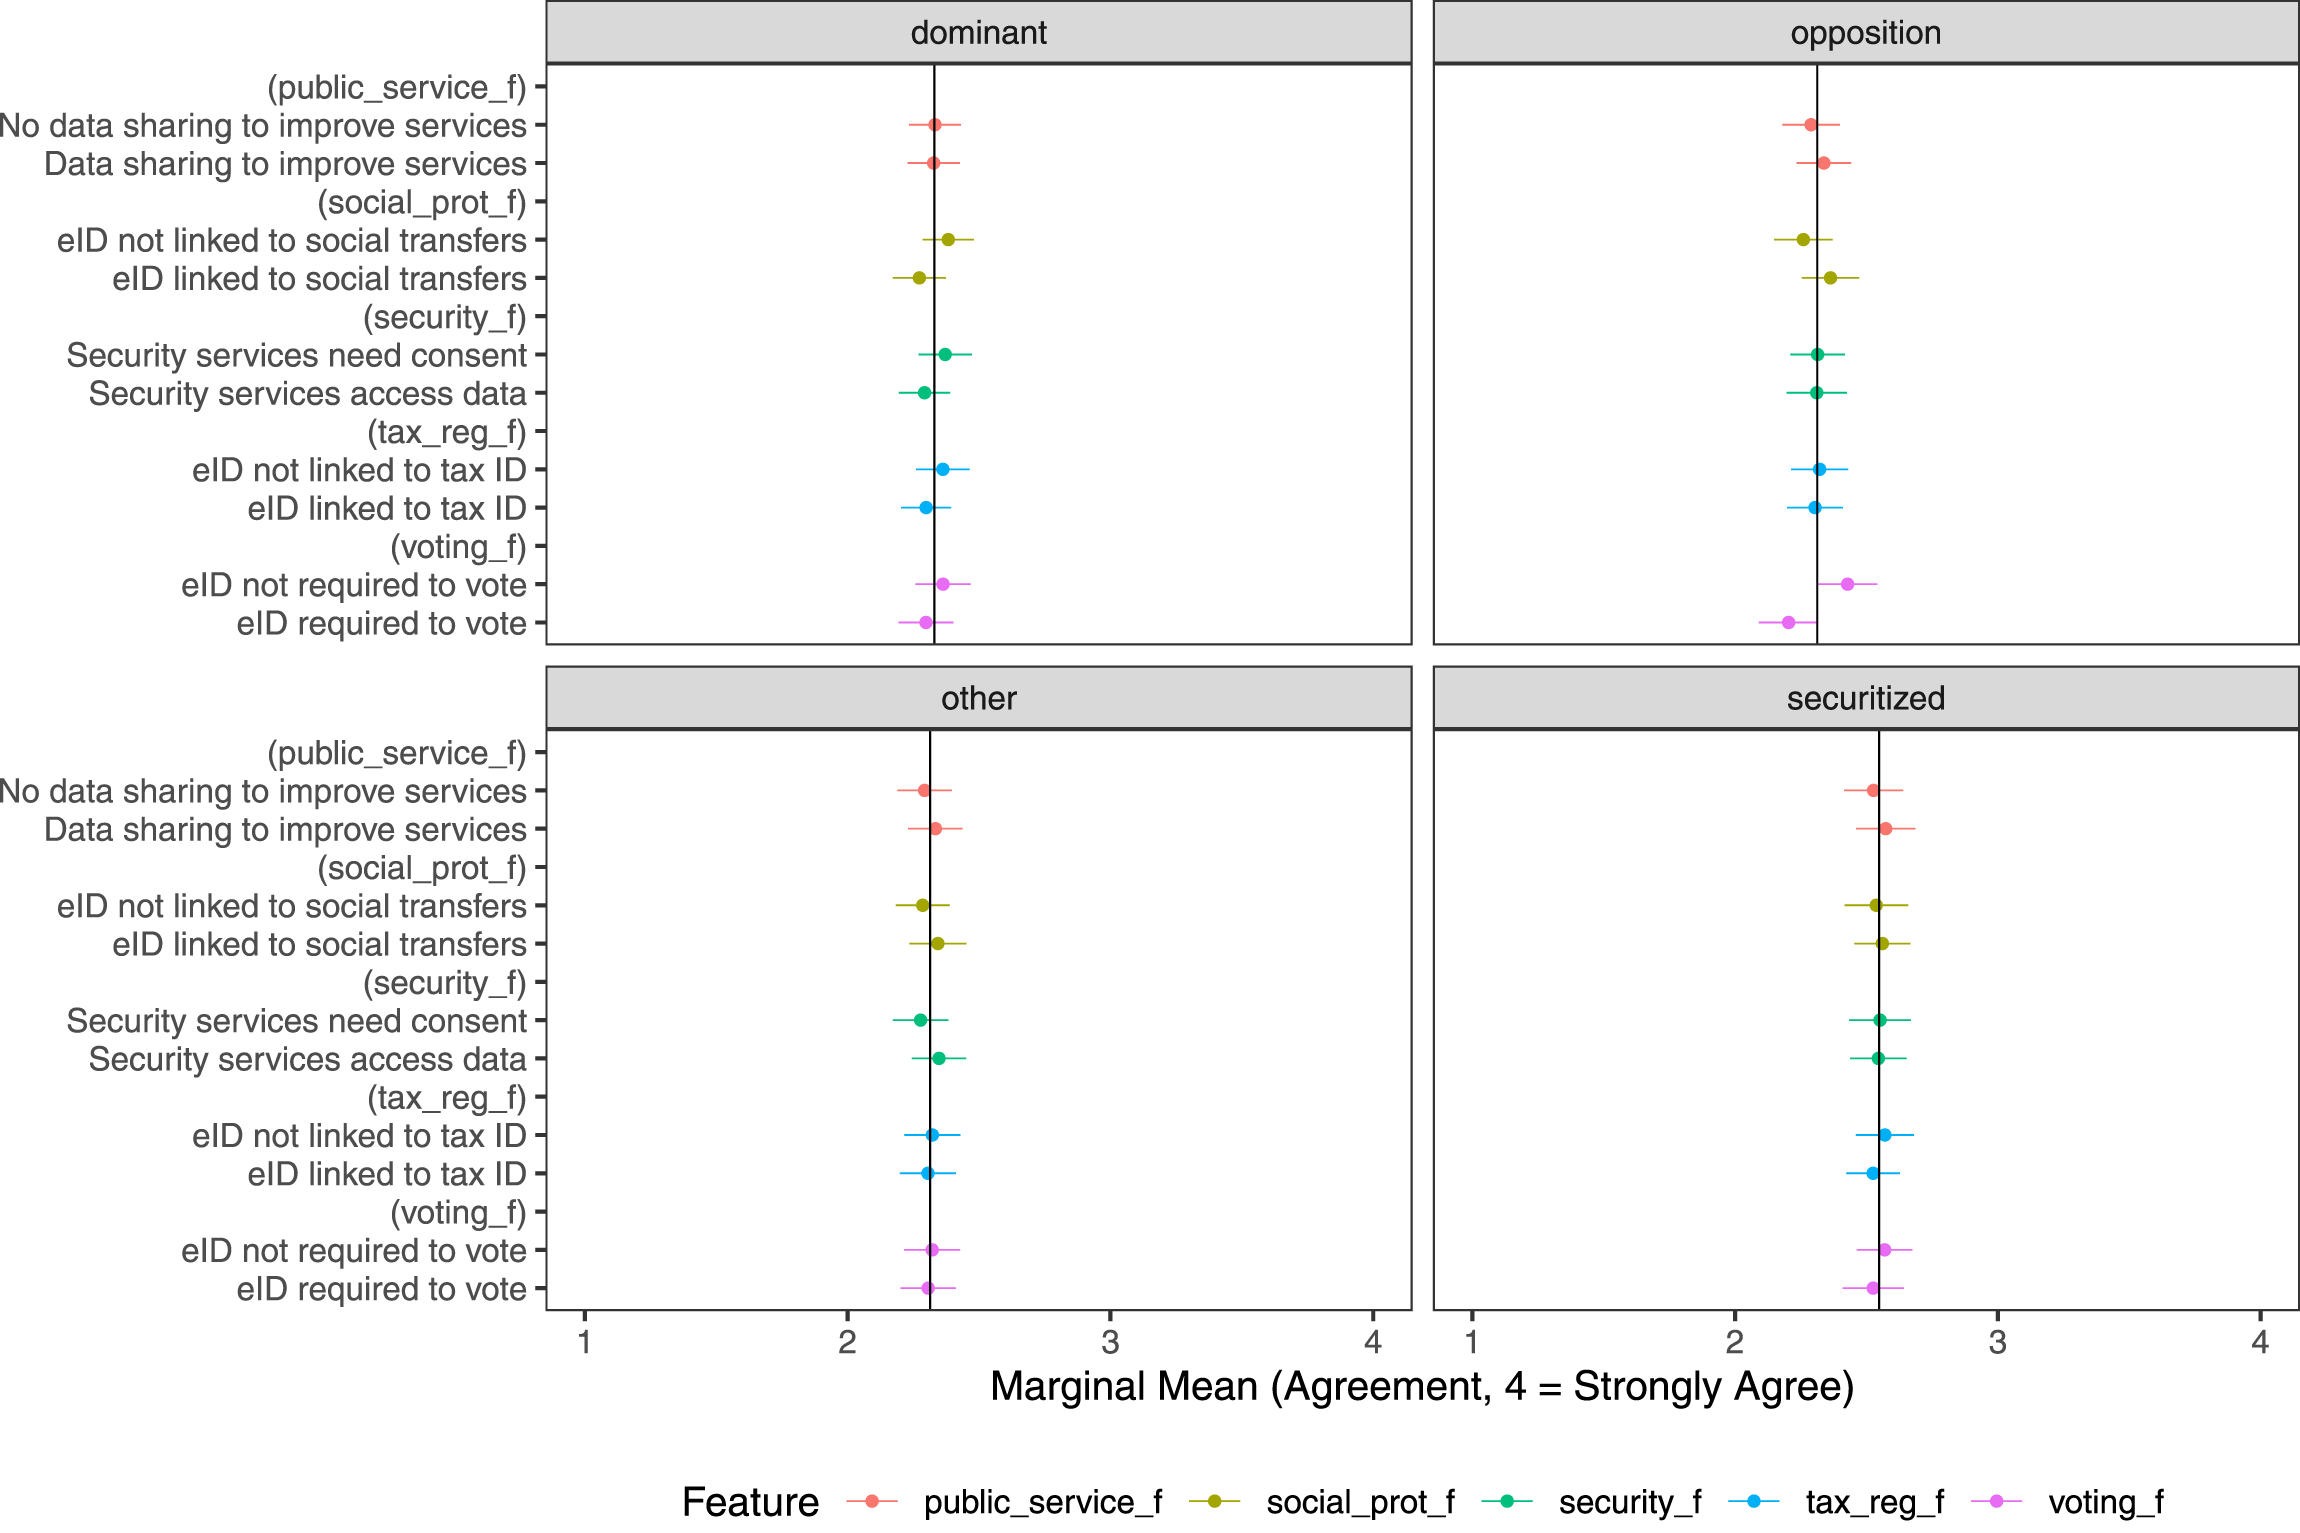
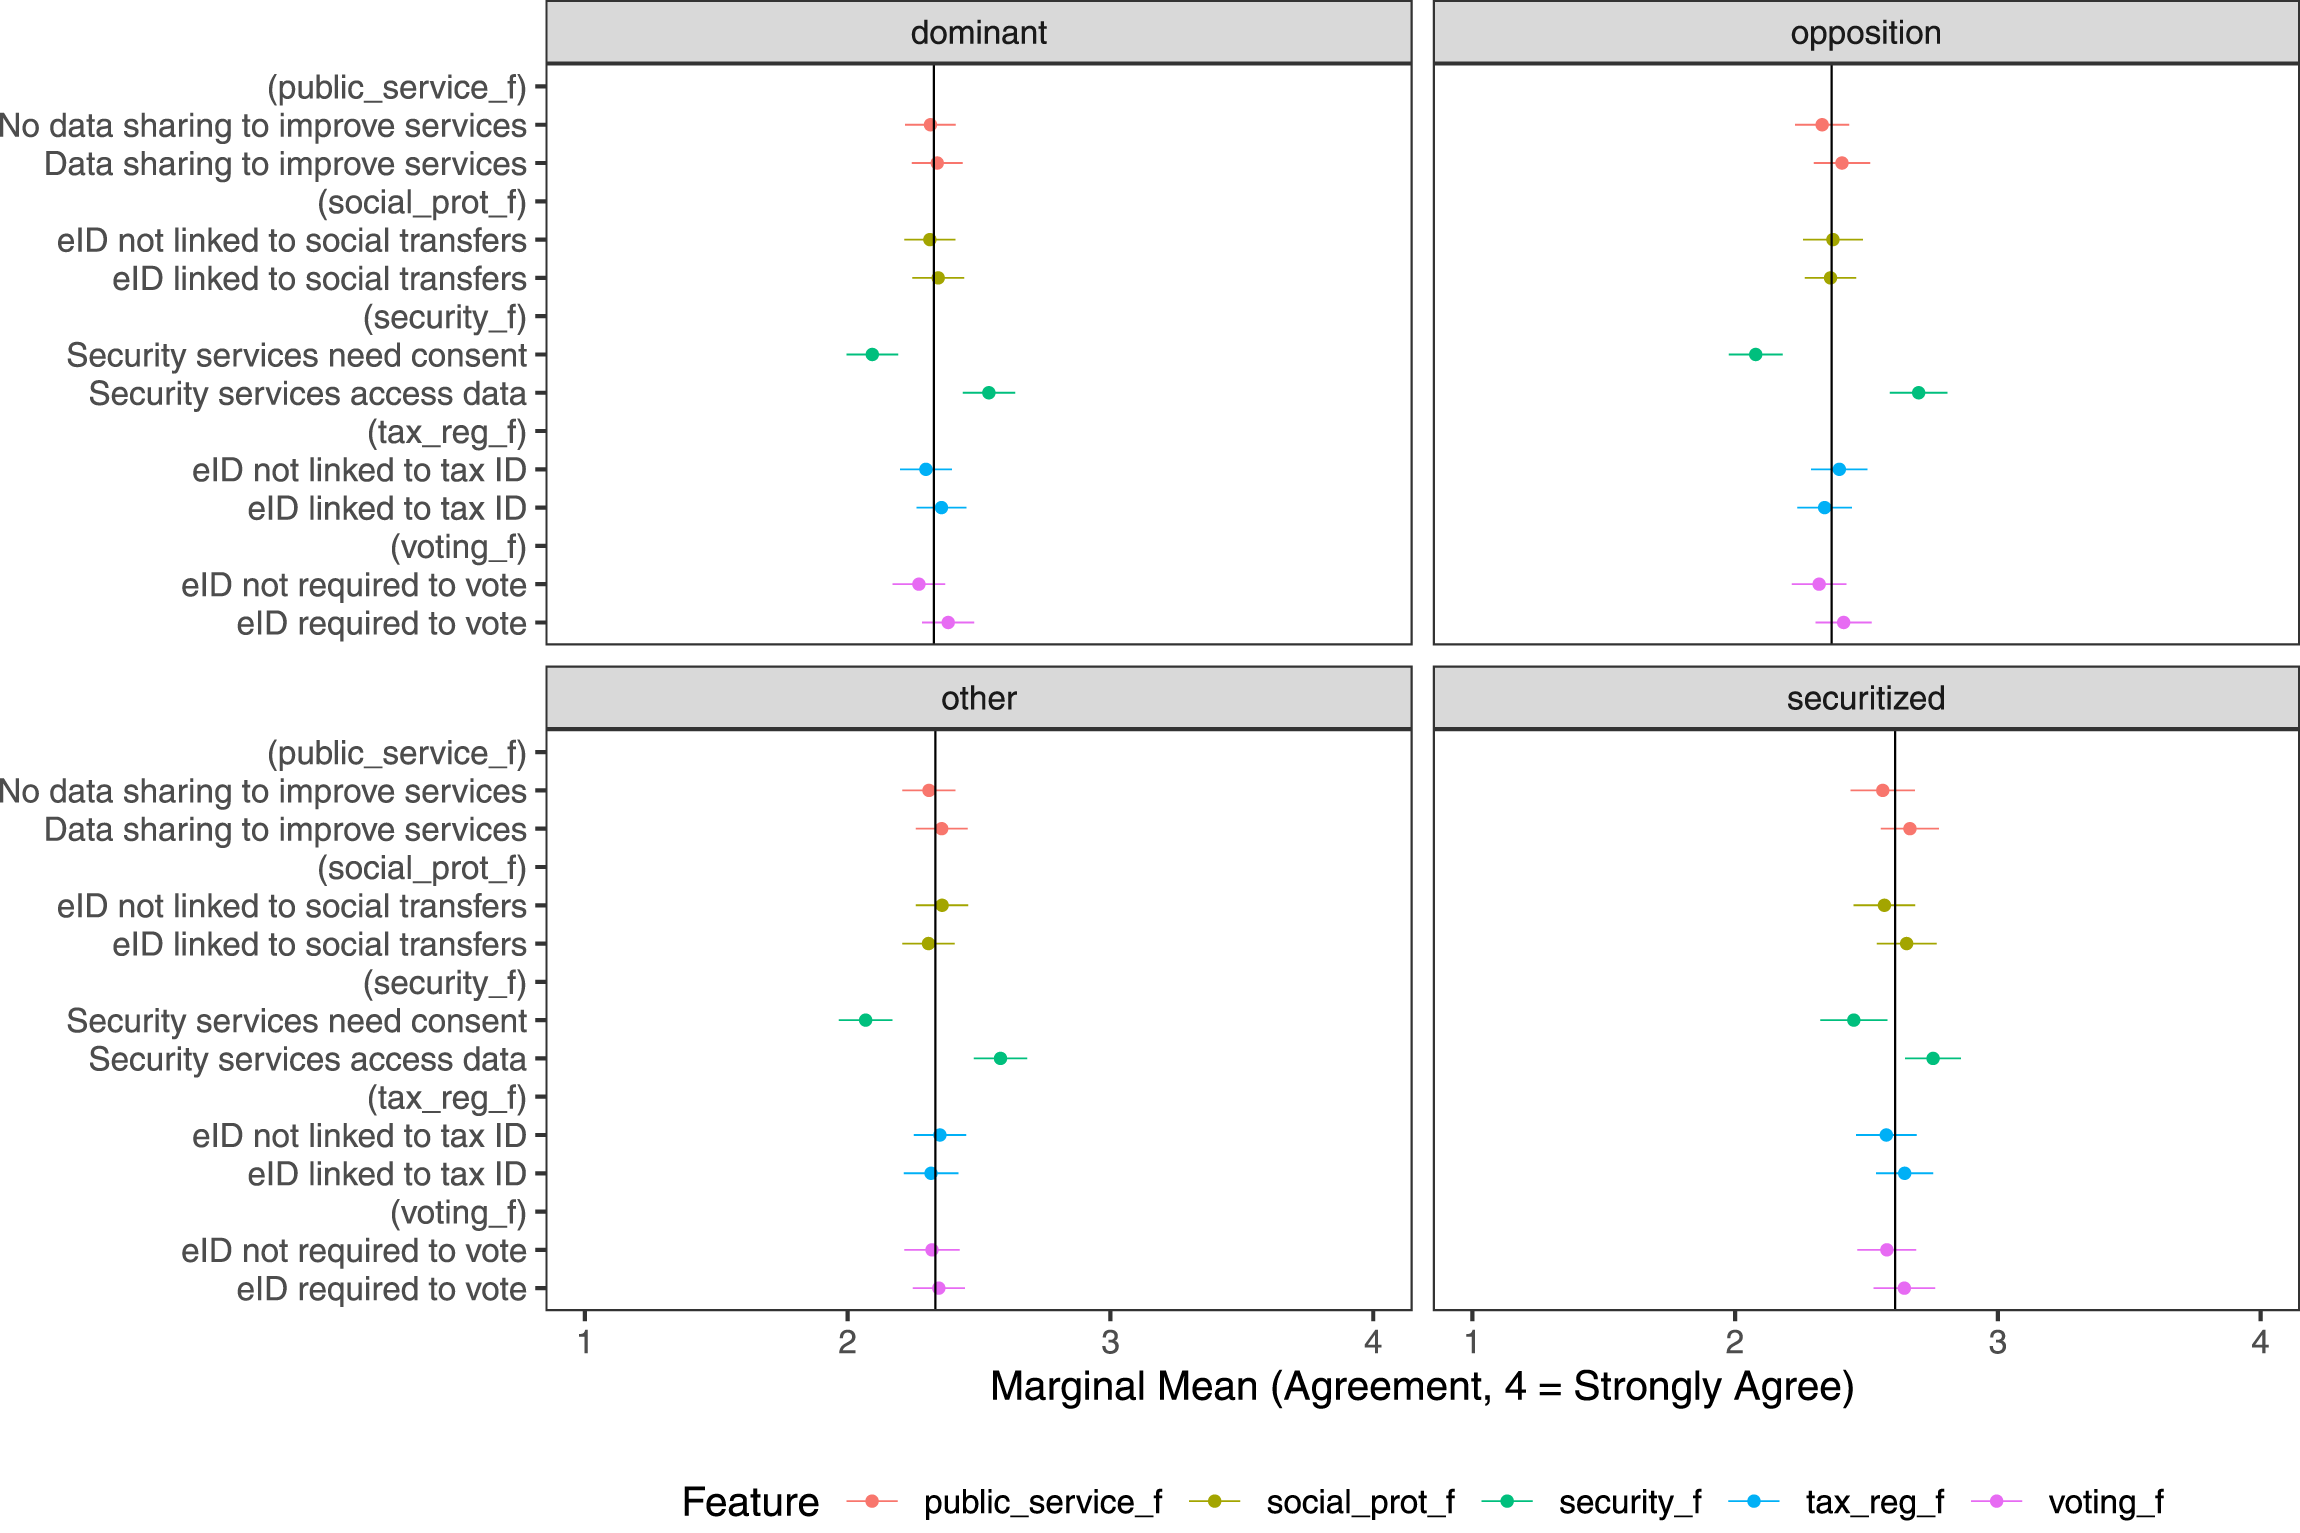
Author Biographies
References
Supplementary Material
Please find the following supplemental material available below.
For Open Access articles published under a Creative Commons License, all supplemental material carries the same license as the article it is associated with.
For non-Open Access articles published, all supplemental material carries a non-exclusive license, and permission requests for re-use of supplemental material or any part of supplemental material shall be sent directly to the copyright owner as specified in the copyright notice associated with the article.