
Abstract
Much of what we know about public support for democracy is based on survey questions about “democracy,” a term that varies in meaning across countries and likely prompts uncritically supportive responses. This paper proposes a new approach to measuring support for democracy. We develop a battery of 17 survey questions that cover all eight components of liberal democracy as defined by the V-Dem project. We then ask respondents from 19 national samples to evaluate these rights and institutions. We find considerable heterogeneity across countries in how our items cohere, especially in less developed contexts. Yet, those items that are more weakly connected with general support for liberal democracy tend to reveal the influence of political events and actors, arguably indicating weaknesses in political cultures. We further identify a concise subset of seven items that provide a reliable and valid measure of support for liberal democracy across our different samples.
Introduction
Democracies around the world face challenges from within. Elected leaders are attacking and undermining democratic norms and institutions, and winning re-election after doing so (Bermeo, 2016; Svolik, 2019; Waldner & Lust, 2018). This raises the question of whether public support for democracy matters for the survival and quality of democratic regimes, as many scholars have argued (e.g., Claassen, 2020; Dahl, 1971; Diamond, 1999; Gibson et al., 1992; Linz & Alfred, 1996; Lipset, 1959; Rose et al., 1998), or whether public opinion has little or no impact on the fate of democracy, as others have claimed (Fails & Heather, 2010; Hadenius and Teorell, 2005; Przeworski, 2019; Schmitter, 2010; Tai, Hu, & Solt, 2022).
Underlying and confounding this debate is the issue of how public support for democracy is conceptualized and measured. Most existing research relies on survey questions that ask respondents to rate democracy or express their preference for democracy over authoritarian regimes. These questions have several weaknesses. Public understanding of the concept of democracy varies across contexts and individuals (Bratton et al., 2005; Dalton et al., 2007; König et al., 2022) and the word “democracy” is also believed to induce uncritically supportive responses (Inglehart, 2003; Schedler & Sarsfield, 2007). It is little surprise that there is such disagreement among researchers as to whether support for democracy even matters at all.
Our goal in this paper is to advance the measurement of public support for democracy by developing and testing a new approach. Instead of asking citizens whether they support abstract and complex regimes like democracy, we ask them to evaluate the more granular and concrete rights, processes, and institutions that constitute liberal democracy. This approach has four advantages over the conventional one. First, it avoids the ambiguity and bias associated with asking questions about “democracy.” Second, it aligns the measurement of public support for democracy with the measurement of democracy itself (which is almost always based on indicators of the presence and quality of democratic institutions), thereby facilitating research into any links between support for democracy and democratic stability. Third, it allows for more nuanced and detailed insights into political cultures; in particular, the identification of potential vulnerabilities or threats to democracy that authoritarian actors may exploit. Finally, by tapping all aspects of the concept of liberal democracy, our approach has greater content validity (Adcock & Collier, 2001; Clifton, 2020).
To operationalize our approach, we follow the definition of liberal democracy used by the Varieties of Democracy project, one of the most widely-used sources of democracy indicators (see, e.g., Coppedge et al., 2016; Teorell et al., 2019). According to this definition – which rests heavily on Robert Dahl’s, 1971 classic formulation – liberal democracy consists of eight distinct clusters of rights and institutions, such as free and fair elections, freedom of expression, and judicial oversight of the executive. Bearing in mind the varying forms that liberal democracy takes across the world, we develop a set of 17 survey questions to measure public support for these eight clusters of rights and institutions. We then administer these questions to samples of citizens from 19 countries across different regions and levels of development. 1
Analyzing the extent to which the responses to these questions form coherent patterns of support for liberal democracy, we find that there is considerable variation in how citizens connect different aspects of liberal democracy. For example, in Hungary, which has experienced significant backsliding, we find that support for universal suffrage is not connected with support for the other institutions of democracy. Support for protest rights is similarly detached from support for other democratic rights in cases such as Peru and Chile, where significant, disruptive collective action has recently occurred. As such, our approach can potentially capture the impact of political events on democratic support, which scholars might find useful in identifying fault lines or weaknesses in political cultures.
For scholars more interested in a single measure of support for democracy than a diagnostic tool, we also provide a contribution. We identify a subset of seven of our questions that balance content and construct validity, by both spanning the conceptual breadth of support for liberal democracy and exhibiting enough coherence to justify combining into a single scale. We moreover demonstrate that this scale has convergent and divergent validity, by showing moderate to strong correlations with existing measures of support for democracy and weak correlations with unrelated constructs such as political trust and populist attitudes. As such, whatever the aims of researchers, we argue that our questions — and our broader approach — provide a springboard for future research on support for democracy, including studies of its causes and consequences.
Existing Survey Measures of Support for Democracy
The third wave of democratization, which started in the 1970s and crested in the early 1990s, prompted scholars to assess the public support for the newly established democracies (see Mattes, 2018 for discussion). For example, in 1985, Morlino and Montero surveyed people in four new democracies in Southern Europe, asking them whether they preferred democracy or dictatorship (Morlino & Montero, 1995). A version of their question was later included in the 1988 and 1992 Eurobarometer surveys:
Here are three opinions about political systems. Which one comes closest to your own way of thinking? (1) Democracy is the best political system in all circumstances. (2) In certain circumstances a dictatorship could be a good thing. (3) Whether we live in a democracy or under a dictatorship makes no difference to people like me.
After the fall of communism, scholars moved quickly to measure public support for democracy in Eastern Europe, with cross-national survey projects such as the New Democracies Barometer and the Consolidation of Democracy in Central and Eastern Europe project springing up (e.g., Rose et al., 1998). Along with the Morlino and Montero item, these projects fielded some new survey questions that asked specifically about support for various authoritarian alternatives to democracy. For example:
Our present system of government is not the only one that this country has had. Some people say that we would be better off if the country was governed differently. What do you think? • Best to get rid of Parliament and elections and have a strong leader who can quickly decide everything. • The army should govern the country.
2
By the late 1990s, the measurement of public support for democracy had “globalized” (Norris, 2009). The above questions spread, in one form or another, to the other regional “barometer” surveys which began appearing in Latin America, Africa, and Asia. The third wave of the World Values Survey (WVS), which was fielded between 1995 and 1998 in 55 societies, also started including questions about public support for democracy. In addition to two versions of the strong leader and army rule questions (but not the Morlino and Montero item), the WVS included questions asking specifically about support for democracy:
I’m going to describe various types of political systems and ask what you think about each as a way of governing this country. For each one, would you say it is a very good, fairly good, fairly bad, or very bad way of governing this country? • Having a democratic political system
The measurement of public support for democracy has continued apace since the 1990s, using the same set of basic questions (albeit with plenty of cross-survey variation), asked every few years in a growing list of countries. By 2020, more than 30 years after questions of support for democracy began to be included in cross-national survey projects, a vast trove of data had accumulated: more than 1,600 national surveys, fielded in more than 150 countries, with each survey including between one and five questions asking about support for democracy (see Claassen, 2019 for an overview).
Problems with Existing Measures
Although these questions are now ubiquitous, they are also heavily criticized. Most prominent among these criticisms is the view that survey respondents pay “lip service” (Inglehart, 2003) to questions about democracy or are mere “questionnaire democrats” (Dalton, 1994; Schedler & Sarsfield, 2007). In other words, respondents tend to uncritically endorse democracy when asked directly about it. Consistent with these arguments are the high levels of support for democracy that emerge when respondents are asked to evaluate a democratic system (i.e., the third question cited above): more than 90% of respondents in most countries report a favorable opinion. 3
Yet, even if respondents are answering these survey questions sincerely, they may not understand democracy in the same way as experts (Bratton et al., 2005; Dalton et al., 2007). One person might interpret democracy as involving civil liberties, a second might understand it to be about competitive elections, while a third might associate it with peace and prosperity. In addition, since national experiences with democracy vary considerably, questions about democracy might trigger very different associations in different countries (Ariely & Davidov2011). Such concerns have prompted a growing body of research into how the public understands the concept of democracy (Dalton et al., 2007; Davis, Goidel, and Gaddie 2022; Ferrín and Kriesi 2016; Miller et al., 1997). Although important, this research does not address the question of how we should measure public support for democracy.
Existing measures of support for democracy have also been criticized for lacking a solid conceptual foundation (König et al., 2022). These questions appear to measure evaluations of democracy and authoritarian alternatives, or perhaps preferences for democracy versus autocracy. Yet, it is not clear which aspect of democracy, or even which of the many theoretical models of democracy (e.g., Held, 2006) are involved. It seems an unpropitious point of departure to measure a variable shorn of its conceptual foundation. This incongruence between the concept and measures is especially striking considering that democracy is one of the most deeply theorized concepts in political theory.
Finally, standard measures of support for democracy may also be criticized for being too broad. As we have seen in recent examples of democratic backsliding (Bermeo, 2016; Svolik, 2019; Waldner & Lust, 2018), it is not “democracy” that is attacked by elected authoritarians, but specific features thereof, including opposition parties, judges, the media, and civil society organizations. Indeed, majoritarian features of democracy are often valorized by such leaders, but usually at the expense of minority rights, another value of (liberal) democracy. To allow further insight into whether support for democracy helps prevent democratic backsliding, we need to take a more granular approach to measuring the former, that is, by focusing on the components of liberal democracy itself. 4
Alternative Approaches to Measuring Support for Democracy
Although the cross-national comparative literature has been characterized by a focus on questions about democracy itself, political scientists studying particular countries have used more nuanced and finely-grained measures. As early as 1968, Max Kaase pioneered such an approach to measuring democratic support in Germany (Kaase, 1971; see also Dalton, 1994; Wuttke et al., 2020). Instead of asking about democracy in principle, he asked respondents for their views on different democratic rights (e.g., freedom of expression), values (e.g., individual vs. collective interests), and norms (e.g., an adversarial vs. collaborative opposition). A similar approach was used by Gibson in his studies of post-Communist Russia and post-Apartheid South Africa (Gibson, 2003; Gibson et al., 1992). Relying heavily on Dahl, Gibson developed measures tapping four institutions and processes of democracy: support for a multiparty system; political tolerance; the “relative valuation attached to individual liberty and social order”; and support for competitive elections. Both of these approaches are valuable improvements to the status quo. However, they fail to disentangle the constituent institutions of (liberal) democracy, with the values and norms that liberal democracy requires or is believed to instantiate, for example, individual versus collective interests and liberty versus order.
Another prominent alternative approach is that undertaken by Ferrín, Kriesi, and colleagues in a special module on “Europeans understandings and evaluations of democracy” fielded in the 2012 European Social Survey (Ferrín and Kriesi 2016). They distinguish a list of important rights and institutions that correspond to a liberal model of democracy (they do the same for models of social and direct democracy). They then ask respondents how important these rights and institutions are for democracy and how successfully these rights and institutions are implemented in the actual political system in which respondents live. By doing so, Ferrín and Kriesi (2016) allow the elusive concept of legitimacy to be measured. But their questions tap public understanding of the concept of democracy rather than public support for democracy itself. Recent research has shown that citizens shift their understandings of democracy to align with their partisan interests (Bryan, 2023; Krishnarajan, 2023). We therefore consider this research as supplementary to our goal of measuring support for liberal democracy.
Other scholars have developed measures that – in a similar fashion to our proposal – focus on measuring support for the constitutive institutions of democracy. The third wave of the Afrobarometer survey project introduced new questions that asked respondents about their support for “four key institutions that embody democratic rules: open elections, competing political parties, legal constraints on the executive, and legislative autonomy” (Bratton, 2010, p. 108). The 2006 AmericasBarometer included fifteen items measuring support for Dahl’s (1971) notion of polyarchy, an institutional conceptualization of electoral democracy (see Carlin & Singer, 2011). Recent studies by van der Brug et al. (2021) and Zaslove and Meijers (2023) have also measured support for democracy by asking respondents about multiple aspects of democracy. While drawing inspiration (and in some instances, survey questions) from these works, we seek to ground our measures more clearly in an operational definition of liberal democracy. We describe our approach for doing so in the next section.
Our Measurement Approach
We seek to measure public support for the rights and institutions of liberal democracy. The novelty of our approach is to align our measures as closely as possible with a conceptualization of liberal democracy, and indeed, with an operational definition thereof. Ensuring that our survey questions capture all aspects of the concept of liberal democracy – that is, “domain coverage” (Clifton, 2020) – helps ensure that any resulting scales have content validity (Adcock & Collier, 2001; Clark & David, 1995).
We are aided in this task by the work of the Varieties of Democracy (V-Dem) project. V-Dem measures the extent to which five varieties (or models) of democracy are present in national polities across time: electoral, liberal, participatory, deliberative, and egalitarian democracy (Coppedge et al., 2016). To do so, the V-Dem investigators disaggregate each variety of democracy into its constituent institutions and processes. They then develop specific indicators for these constituent institutions, before finally asking country experts to score particular countries on each of these indicators.
We focus here on liberal democracy, and specifically, on V-Dem’s definition thereof. Along with electoral democracy, this is the theoretical model of democracy most clearly in mind when political scientists consider transitions to democracy (i.e., democratization) as well as breakdowns in democracy (or backsliding). For V-Dem, liberal democracy is a combination of electoral democracy and the “liberal component” of democracy. 5 Electoral democracy follows Dahl’s (1971) concept of polyarchy closely, with the following five institutions and processes included: (1) freedom of expression, (2) freedom of association, (3) universal suffrage, (4) key decision-makers being elected, and (5) free and fair elections (Coppedge et al., 2016). The liberal component “embodies the intrinsic value of protecting individual and minority rights against potential ‘tyranny of the majority’ and state repression more generally” (Coppedge et al., 2016, p. 582). It has the following three constituent institutions and processes: (1) judicial and (2) legislative constraints on the executive, and (3) equality before the law.
Support for the Electoral Institutions of Democracy Questions.
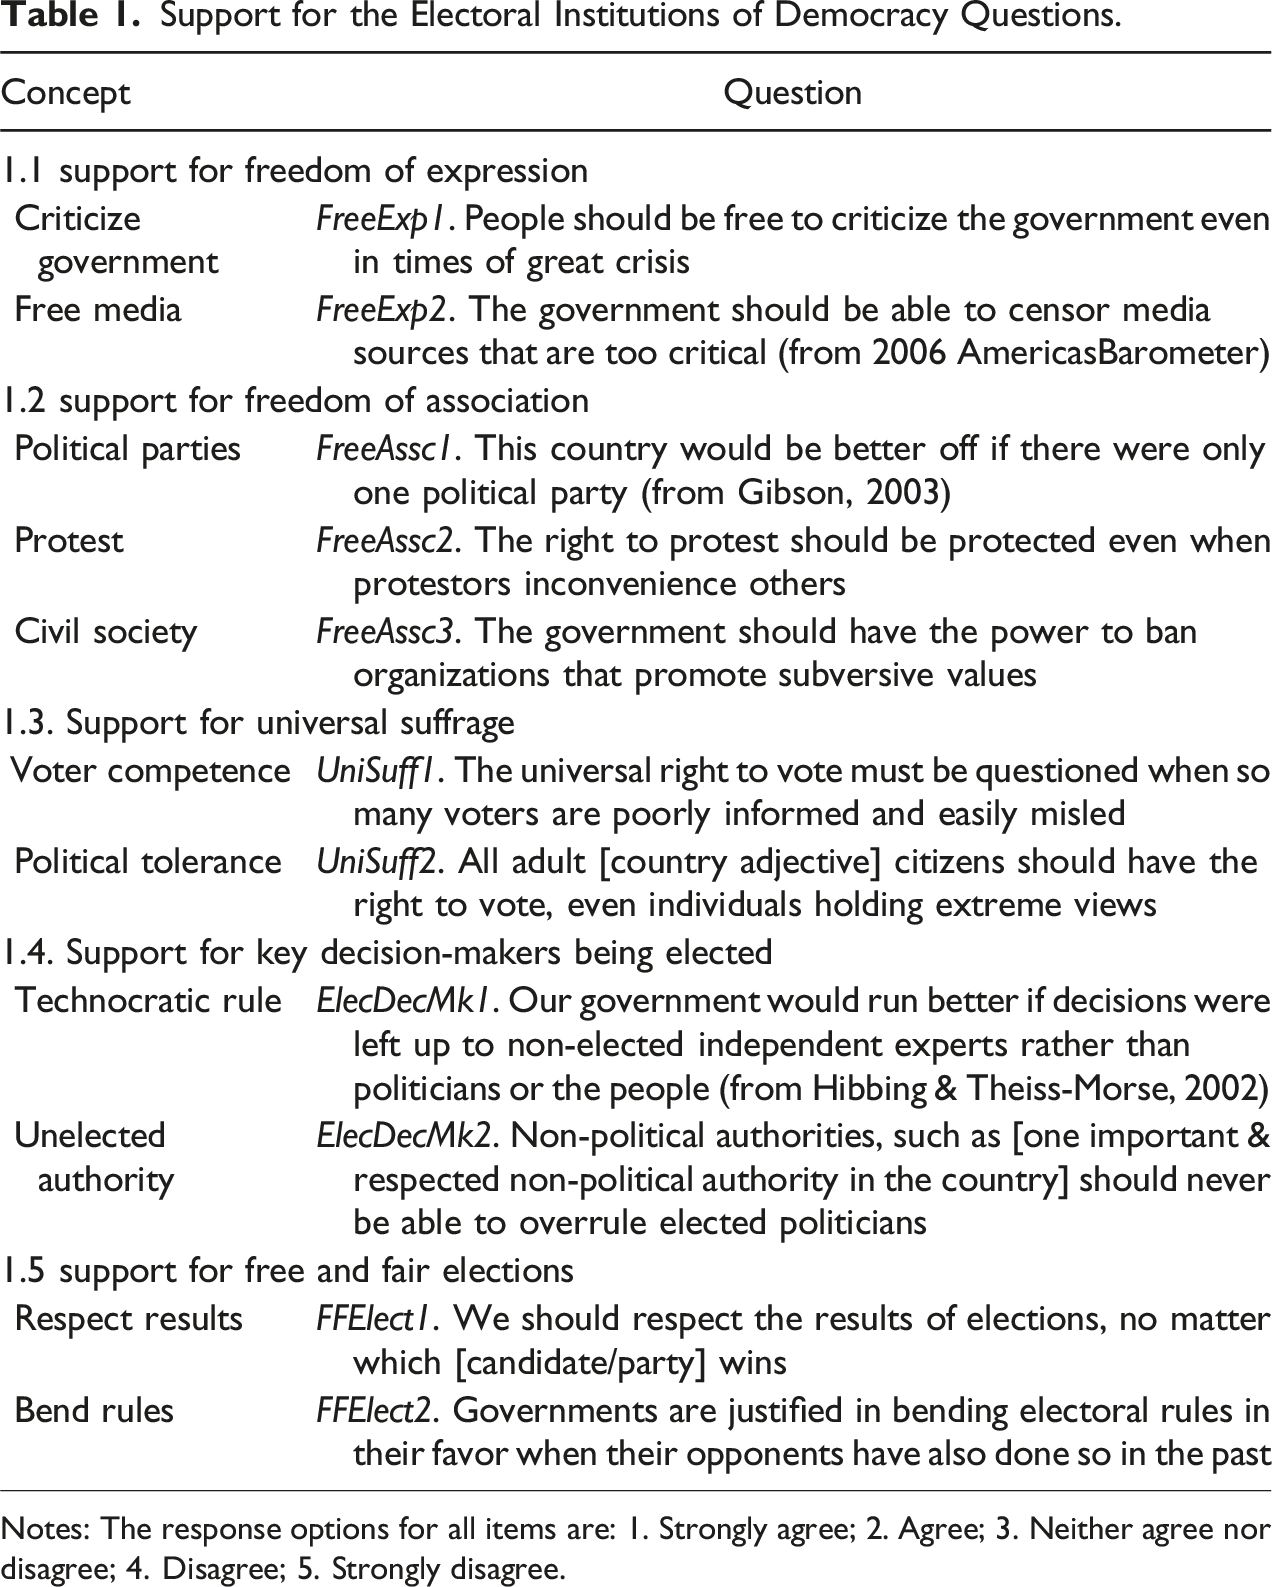
Notes: The response options for all items are: 1. Strongly agree; 2. Agree; 3. Neither agree nor disagree; 4. Disagree; 5. Strongly disagree.
Support for the Liberal Institutions of Democracy Questions.
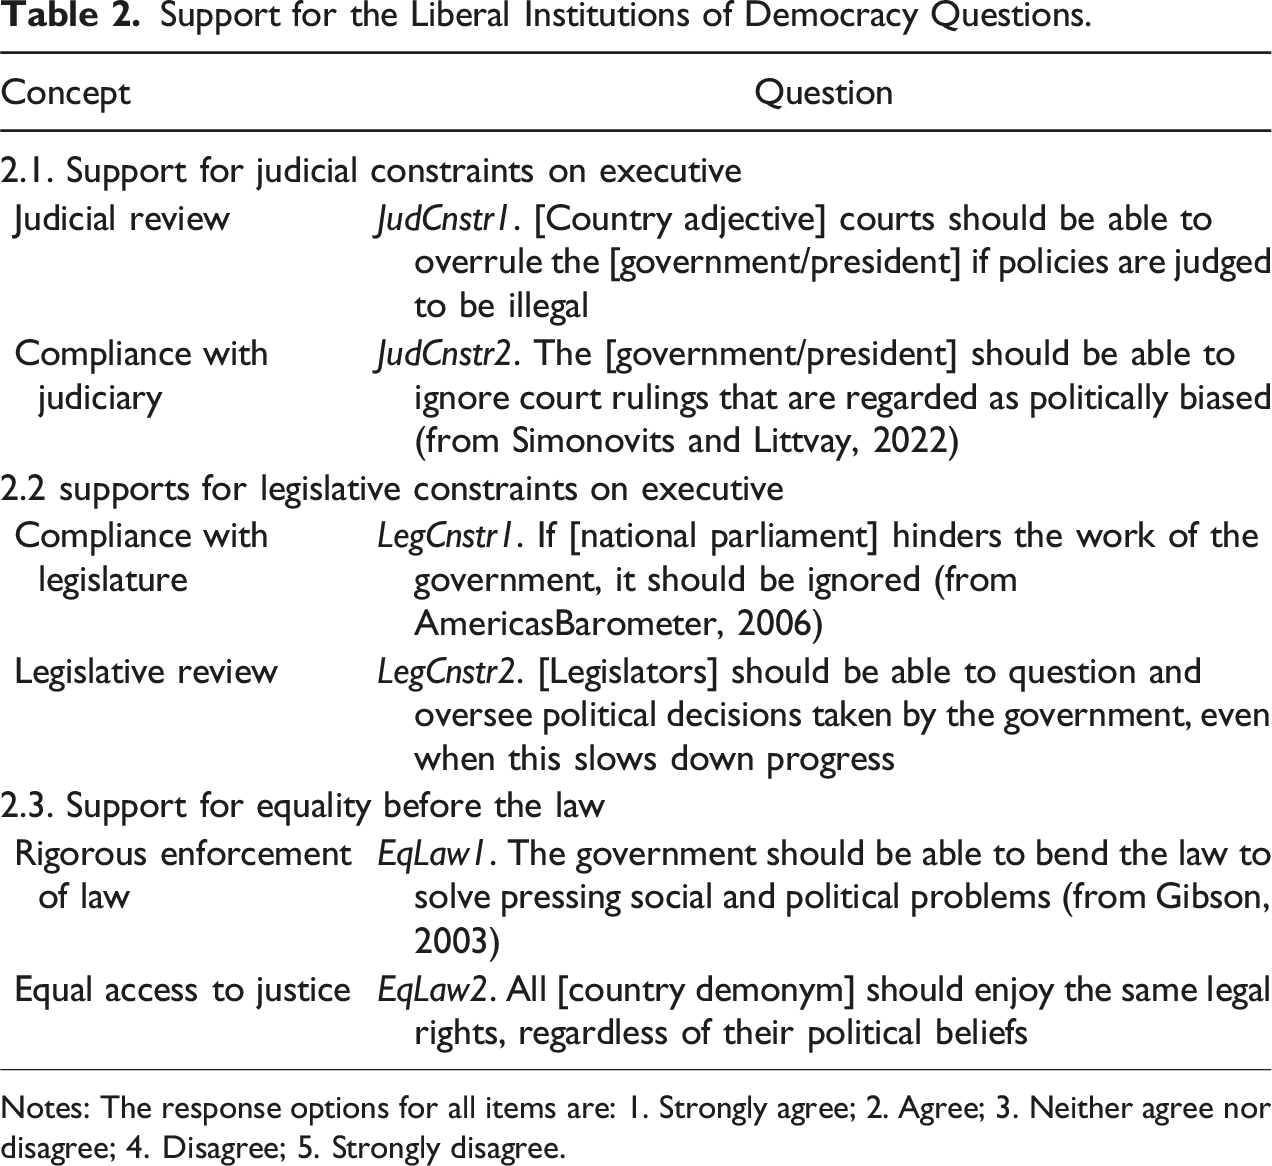
Notes: The response options for all items are: 1. Strongly agree; 2. Agree; 3. Neither agree nor disagree; 4. Disagree; 5. Strongly disagree.
We generally field two items for each of the eight dimensions, using these to capture some of the different aspects of each component as these are described by V-Dem. For example, support for freedom of expression includes questions relating to support for the right to criticize the government as well as support for free media. For one component – freedom of association – we employ three items, measuring support for three kinds of associational life: political parties, protests, and civil society organizations. Within each pair of questions (or trio in the case of freedom of association), we vary the valence of the questions to counteract respondent acquiescence effects (i.e., the tendency to agree with survey questions; see, e.g., Billiet & McClendon, 2000; Watson, 1992).
Within the ambit of our conceptual approach, we use three principles in designing questions. First, we employ existing survey questions that have been tested in past research, wherever these appeared to tap into one of the eight institutional clusters implied by the concept of liberal democracy. Second, we word questions in concrete or specific terms to mitigate the social desirability that might result from questions about such prima facie desirable rights such as for example, freedom of speech, by (e.g., Prothro & Grigg, 1960). For example, we avoid asking respondents whether they approve of free speech in principle, but ask them instead whether people should be “free to criticize the government” and whether “the government should be able to censor media sources.” Third, we aim to develop questions that would work across political systems. To do so, we allow for small variations in wording, such as “candidate” or “president” in presidential systems and “party” and “government” in parliamentary systems. In one of the questions relating to support for key decision-makers being elected, we name a salient non-political authority. The “military” is used in most cases (see supplementary information for further details).
Data and Research Design
Details of Samples.
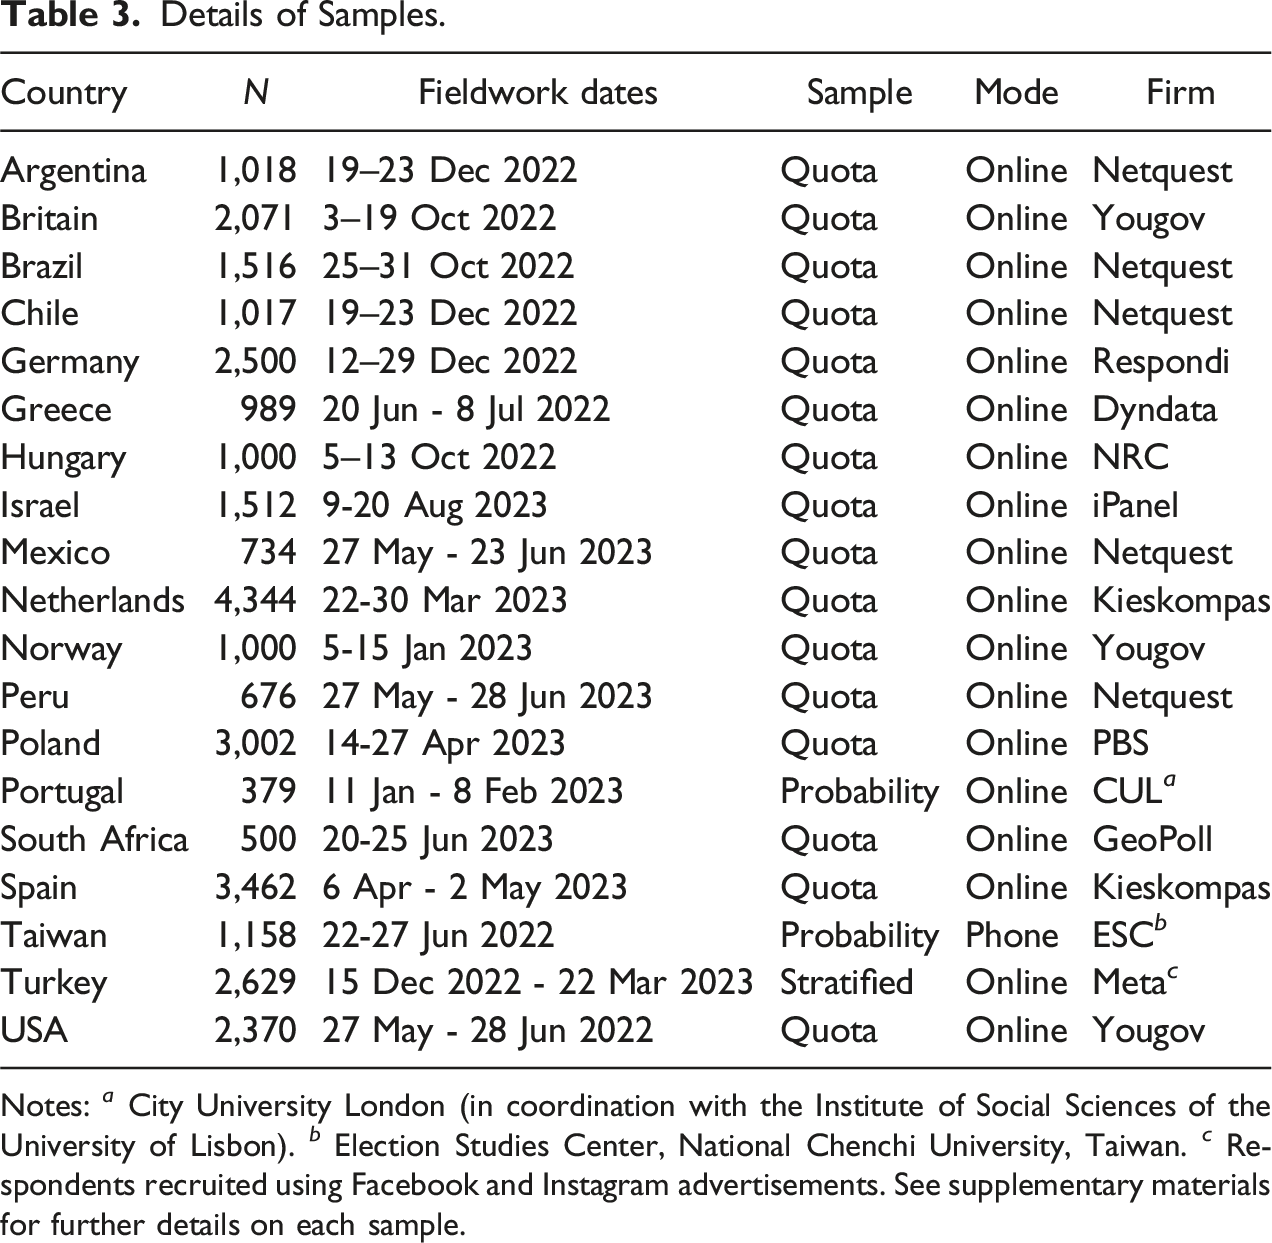
Notes: a City University London (in coordination with the Institute of Social Sciences of the University of Lisbon). b Election Studies Center, National Chenchi University, Taiwan. c Respondents recruited using Facebook and Instagram advertisements. See supplementary materials for further details on each sample.
Our analysis of these datasets proceeds in three steps. Having established the content validity of our approach by design, we next consider the construct validity (or nomological validity; Adcock & Collier, 2001) of the scale(s). In particular, we test whether the items cohere into conceptual models of (support for) liberal democracy. There are two models implicit in the V-Dem conceptualization: a unidimensional liberal democracy scale, and a two-dimensional model corresponding to the electoral and liberal components of democracy. We examine the correspondence between our data and these theoretical models using confirmatory factor analysis models for ordinal data, which we fit separately in each sample. Since we have items of varying valence, we also include an orthogonal methods factor to capture respondent acquiescence when questions are framed such that agreement indicates support for democracy (Billiet & McClendon, 2000). To the extent that our items cohere with one or both of these models, we can infer that our scales have construct validity.
Second, we examine more closely any heterogeneity in item fit, that is, items that do not fit as the conceptual model implies they should. Our approach rests on the assumption that liberal democracy can be defined as a cluster of several institutions and rights as proposed by experts. As we have argued, aligning our items with an expert-defined conceptual model of liberal democracy grants the resulting measures content validity. But citizens may see things differently: for example, they may approve of the universal right to vote but may disapprove of judicial review of their elected government’s decisions. By considering which clusters of institutions correlate in particular contexts, we gain insight into the particularities of national political cultures.
Third, we seek to identify a subset of our items that can reliably and validly be aggregated into a single scale. Such a concise scale would be of interest to other researchers, should it exist, especially if it can be measured with a modest number of items. In deriving this subset of items, we consider both the coherence of the subset of items (i.e., their construct validity) and also the breadth of coverage of the underlying concept of support for liberal democracy (i.e., the items’ content validity). We also test the convergent and divergent validity of this concise scale by examining its correlations with existing measures of support for democracy, as well as conceptually more distinct concepts like satisfaction with democracy and ideology. 8
Testing Model Fit
We begin by examining the extent to which our data fit the conceptual models of liberal democracy put forward by V-Dem and embedded in our 17 questions. We test both a unidimensional support for liberal democracy model and a bi-dimensional support for the electoral and liberal institutions of democracy model. Fit metrics are displayed in Figure 1.
9
Model Fit, 1- versus 2-Dimensional Support for Liberal Democracy. CFI: Confirmatory Fit Index; RMSEA: Root Mean Squared Error of Approximation; SRMR: Standardized Root Mean Square Residual. Unidimensional fit metrics are shown in teal and bi-dimensional metrics are shown in orange. Both treat the observed variables as ordinal indicators and include a separate, orthogonal acquiescence factor. For each plot, cases are listed from better to worse fit. Solid vertical lines indicate thresholds conventionally used to distinguish models that fit adequate or better from those that do not. The quality of fit increases with the CFI, but decreases with the RMSEA and SRMR metrics.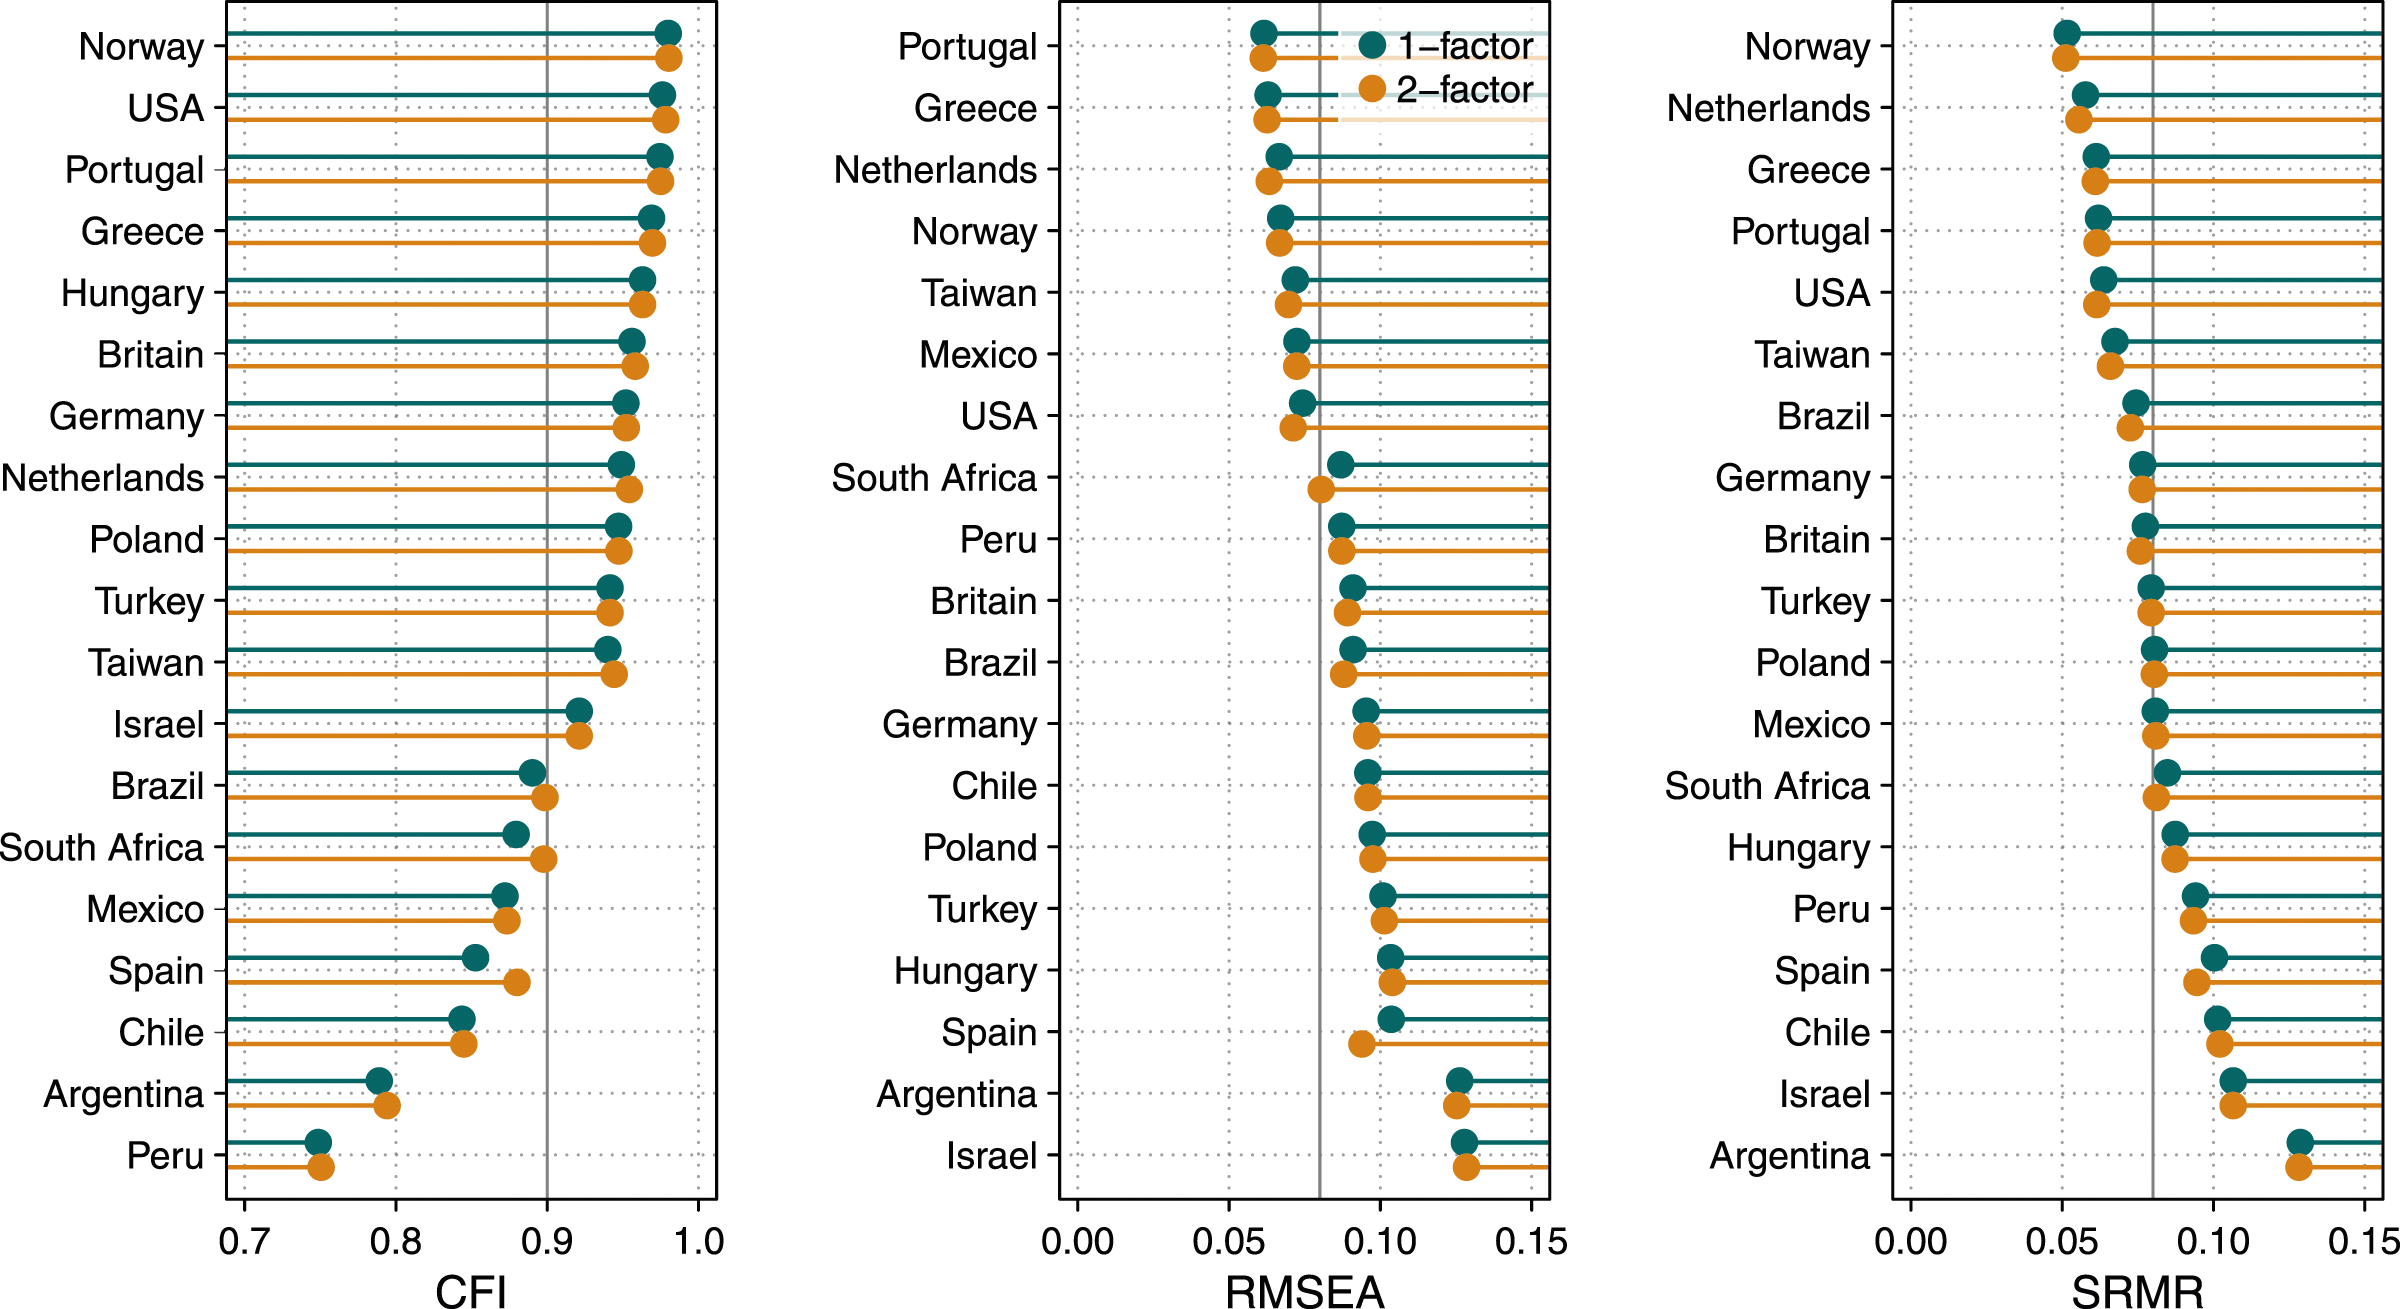
The unidimensional and two-dimensional models show similar fit across all samples, with the possible exception of Spain, where the latter fits slightly better. 10 Support for the electoral and the liberal components of democracy are moreover generally very strongly correlated in the bi-dimensional model, with correlations of around 0.9. As such, the evidence suggests that the additional complexity of the two-dimensional model does not markedly improve model fit across our 19 samples. We therefore focus on a unidimensional support for liberal democracy model in the remainder of this paper.
However, while the two models fit similarly in relative terms, they do not always fit well in absolute terms. In only six cases (Norway, the US, Portugal, Greece, the Netherlands, and Taiwan) does the unidimensional model of support for liberal democracy show at least an adequate fit across our three metrics. In some cases (e.g., Argentina), this model falls considerably short of this standard. To be sure, there are many fit metrics and various thresholds have been put forward for each, but it is clear that a single liberal democracy factor only fits adequately in around a third of our samples and fits poorly in one or two.
Finally, we note a pattern that is evident in how well either conceptual model fits across our cases. Our items cohere more readily into uni- or bi-dimensional measures of support for liberal democracy in samples from higher income countries. 11 In such contexts, if citizens support liberal democracy, they tend to support all its constituent institutions and rights. In less-developed settings, citizens are more likely to oppose certain of these rights and institutions even while they support liberal democracy as a whole. One of the features of our approach is that it allows respondents to express such heterogenous patterns of support for democracy. This is where our attention turns in the next section.
Examining Item Heterogeneity
In this section, we examine the extent to which our 17 items are connected to, or disconnected from, the underlying latent variable of support for liberal democracy. To carry out this analysis, we focus on the factor loadings from the one-dimensional ordinal CFA model discussed in the previous section. These factor loadings are presented in Figure 2, with short item descriptions in rows (see Tables 1 and 2) and two-digit country codes used to indicate the corresponding sample. To make the figure more digestible, we have recoded all items such that higher responses indicate greater support for democracy; all items should therefore – in principle – have positive factor loadings. Heterogeneity in item functioning. Factor loadings drawn from the one-dimensional CFA. Items annotated with (r) are reverse-coded such that higher values indicate more support for democratic institutions. See Tables 1 and 2 for item wordings. Results from each sample are indicated using a two-digit country label. A small amount of noise is added to the y-coordinates of each point to allow the country labels to be more easily distinguished. Greater (positive) loadings show items that are more closely related to the underlying latent dimension; zero loadings indicate items that are orthogonal to this latent dimension.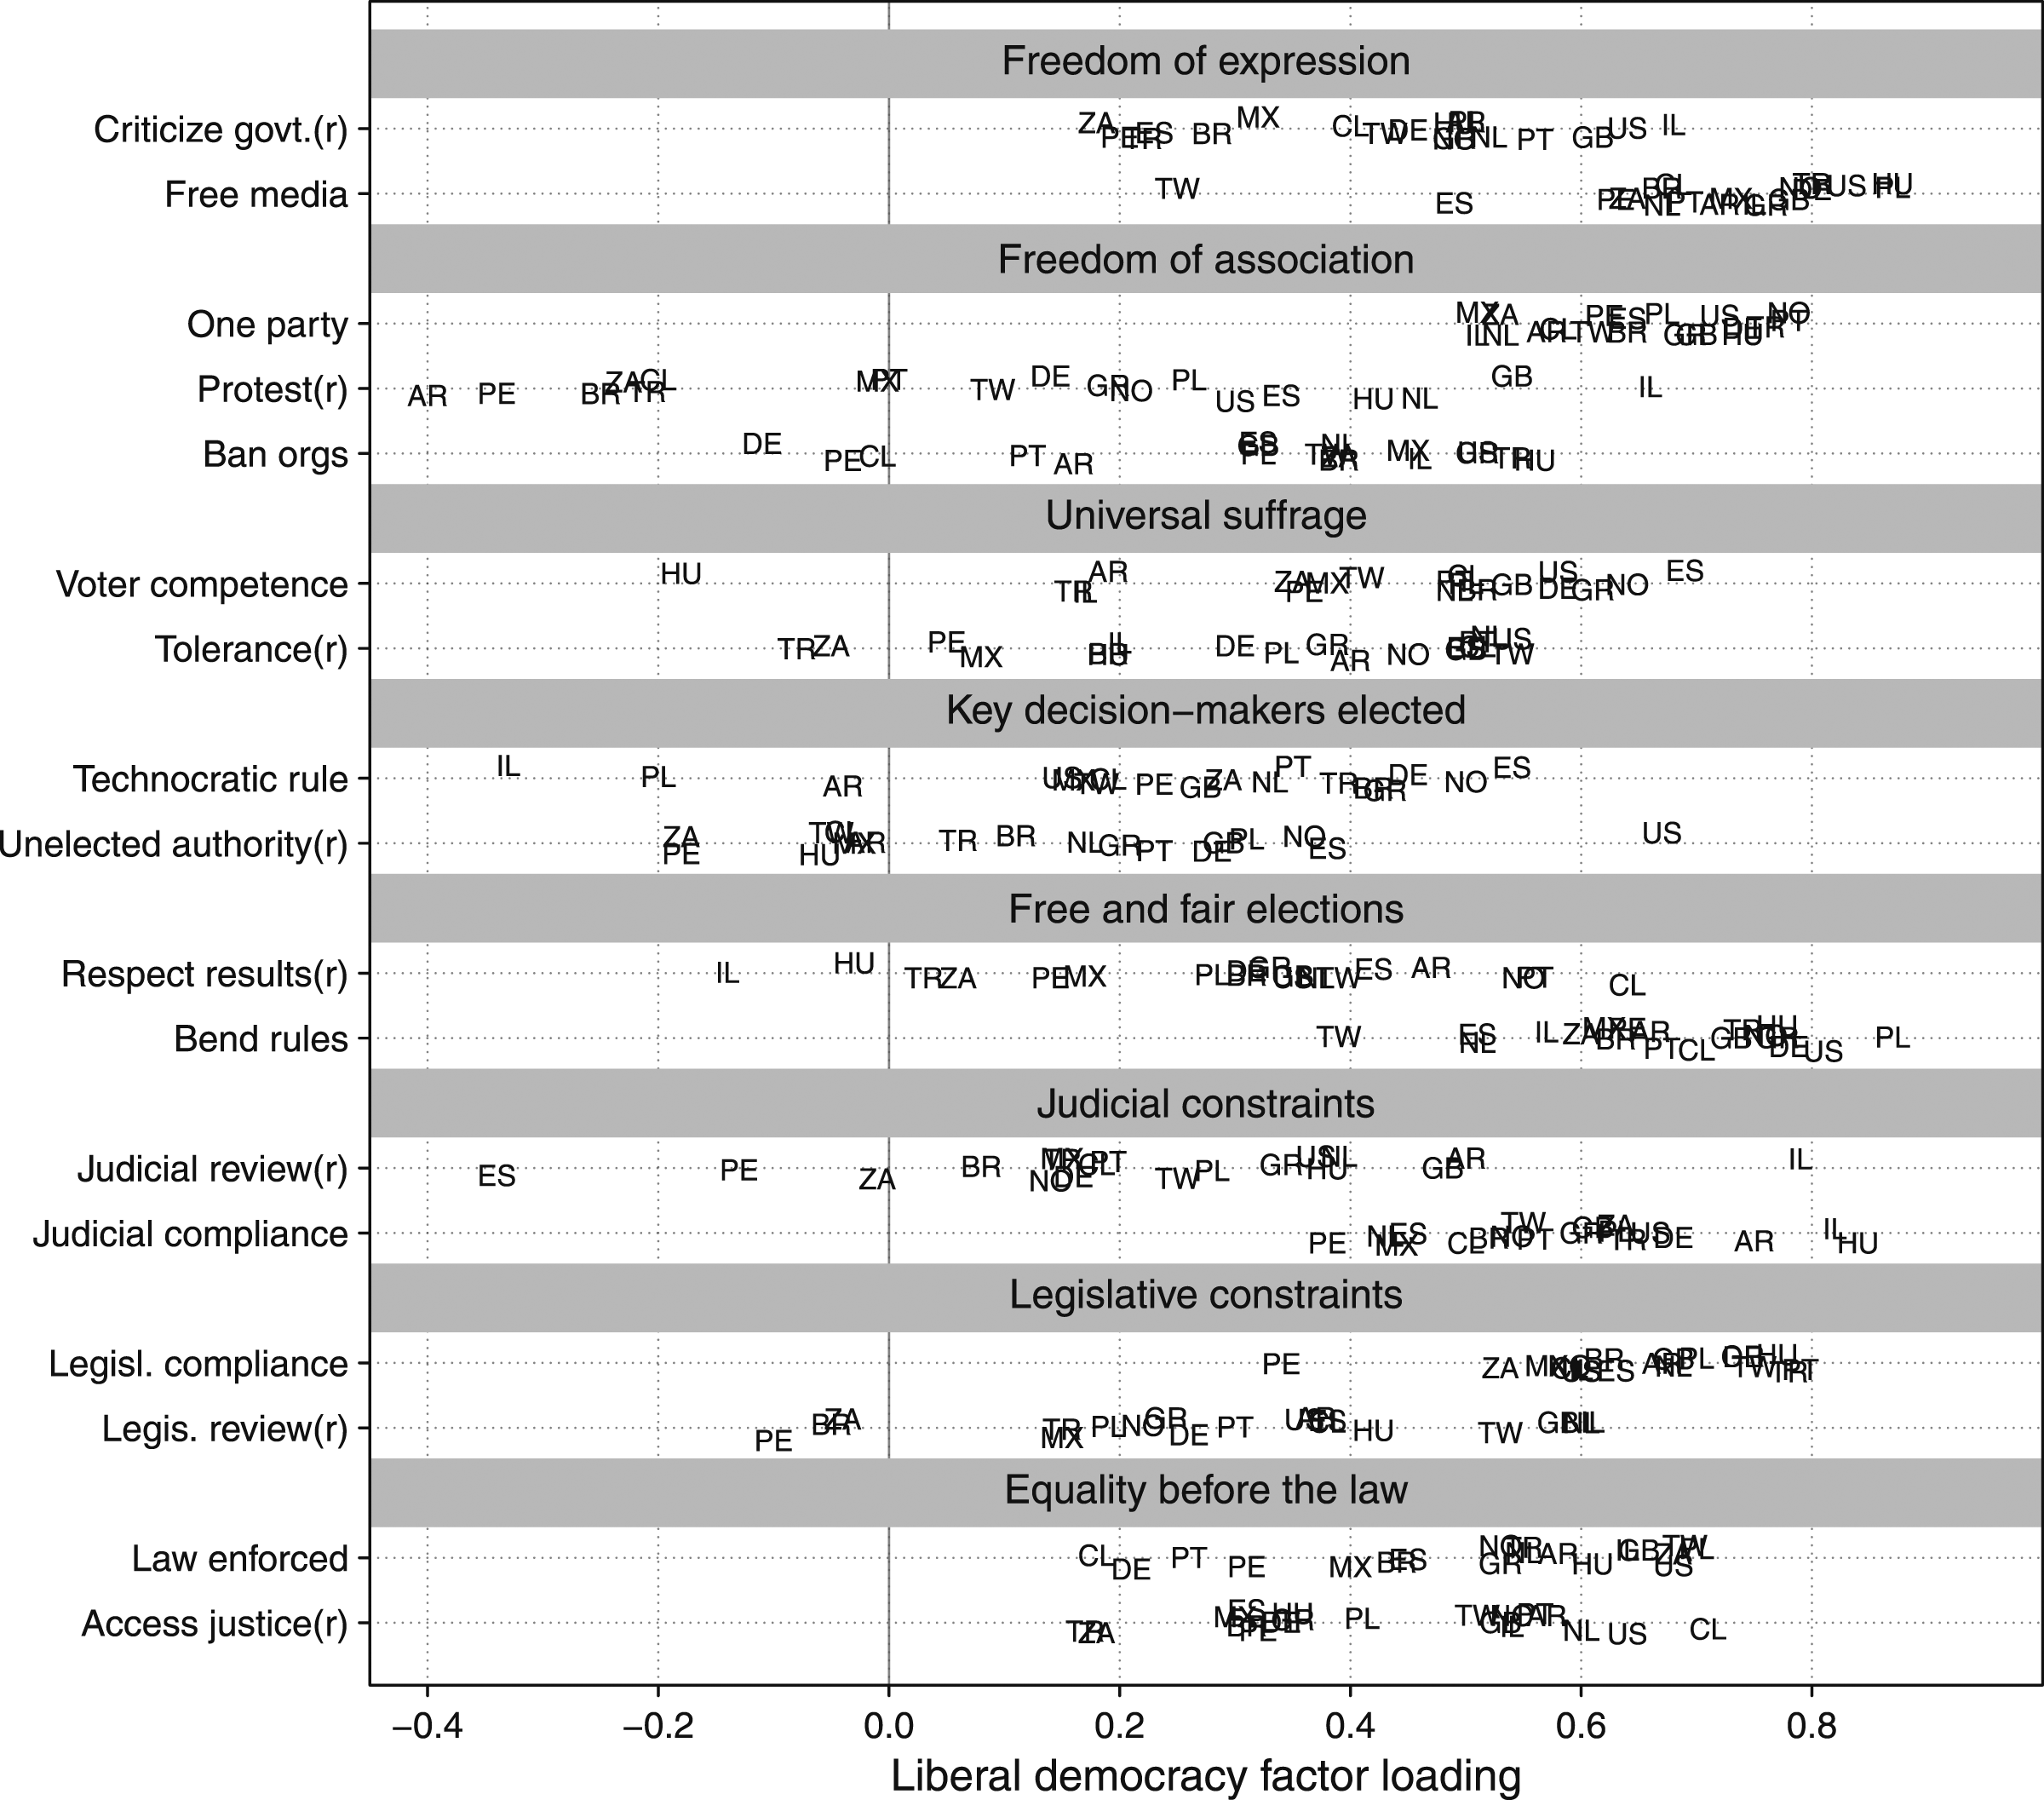
We can see that there is considerable heterogeneity in how items fit across both items and countries. Some items are always positively associated with a unidimensional construct of support for liberal democracy, for example, support for freedom of expression, equality before the law, government compliance with the judiciary and legislature, as well as opposition to bending electoral rules. Generally speaking, if an individual supports liberal democracy across our cases, they tend to support these particular institutions and processes.
Yet, other items show more varied associations with support for liberal democracy, for example, support for protest rights, judicial review, and opposition to technocratic rule. In some cases, estimated associations between these items and the latent variable are negative, indicating that respondents who support liberal democracy are less supportive of these particular institutions and processes.
Such divergences from a canonical understanding of support for democracy are perhaps in part due to the complexity of the concept of liberal democracy, which requires – among other things – endorsing both majoritarian and minoritarian institutions. Yet, the heterogeneity of results in Figure 2 likely also reflects the influence of recent, divisive political events. For example, the negative relationship between support for protest and support for democracy in Chile and Peru follows from widespread violent protests in both cases (e.g., Somma et al., 2021). Similarly, the negative correlation between support for judicial review and support for liberal democracy in Spain possibly reveals the politicization of the Spanish judiciary following the conflict over the Catalan independence declaration (e.g., Rodon, 2020). And in Hungary, where Orban and the Fidesz party have won a series of elections despite considerable democratic backsliding, supporters of liberal democracy are more likely than opponents of liberal democracy to agree that the “universal right to vote must be questioned when so many voters are poorly informed and easily misled.”
As such, we argue that our approach to measuring support for liberal democracy can be used as a barometer of the political culture. On the one hand, it provides a basis for theorizing about how political conflict could damage support for particular institutions of liberal democracy. On the other hand, negative associations between support for particular rights or institutions and support for liberal democracy as a whole suggest possible faultlines or pressure points that could be manipulated by authoritarian leaders while claiming to be defending democracy. Examples of institutions include, in Spain, Peru, South Africa, and Brazil, judicial and legislative review, and, in Turkey and South Africa, the right to vote for individuals holding extreme views.
Deriving and Validating a Concise Battery
The final step of our analysis is to identify and test a more concise battery. The goal is to balance content and construct validity by dropping weaker items (thereby improving construct validity) while retaining coverage across as many of the theoretical components of liberal democracy as possible (thereby retaining content validity). A concise battery of this kind is likely to be desirable in that it would consume less time in a survey.
Specifically, we propose a seven-item battery that includes a single item from seven of the eight components of liberal democracy. The component we omit is support for key decision-makers being elected. As is evident in Figure 2, our measures of this component did not universally correlate with latent support for liberal democracy. The notion that key decision-makers should be elected may be an obscure and complex dimension of democratic functioning for respondents to process in the course of an online survey. 12 Nevertheless, the seven remaining components of support for liberal democracy covered by our items span the breadth of the concept.
Within each of the components of liberal democracy, we select the item that coheres best with the underlying latent variable of support for liberal democracy across all samples. We use the loadings from our CFA for this task (see Figure 2). We include the following items in our concise battery: FreeExp2 (free media), FreeAssc1 (one party), UniSuff1 (voter competence), FFElect2 (bend rules), JudCnstr2 (judicial compliance), LegCnstr1 (legislative compliance), and EqLaw1 (law enforced).
We begin our testing of this concise battery by examining its construct validity. In Figure 3, we present the fit metrics for a unidimensional CFA model estimated using the seven items we have just described. The model fits considerably better when using the concise battery. In all samples, the CFI exceeds the threshold of adequacy; in most samples, the RMSEA and SRMR indices do so as well. These results indicate that the concise scale generally has adequate construct validity even while it retains content validity (i.e., breadth of coverage). Model fit, concise support for Liberal democracy scale. CFI: Confirmatory Fit Index; RMSEA: Root Mean Squared Error of Approximation; SRMR: Standardized Root Mean Square Residual. Unidimensional CFA fit to concise 7-item battery. Observed variables are treated as ordinal. No acquiescence factor is included. For each plot, cases are listed from better to worse fit. Solid vertical lines indicate thresholds conventionally used to distinguish models that fit adequate or better from those that do not. The quality of fit increases with the CFI, but decreases with the RMSEA and SRMR metrics.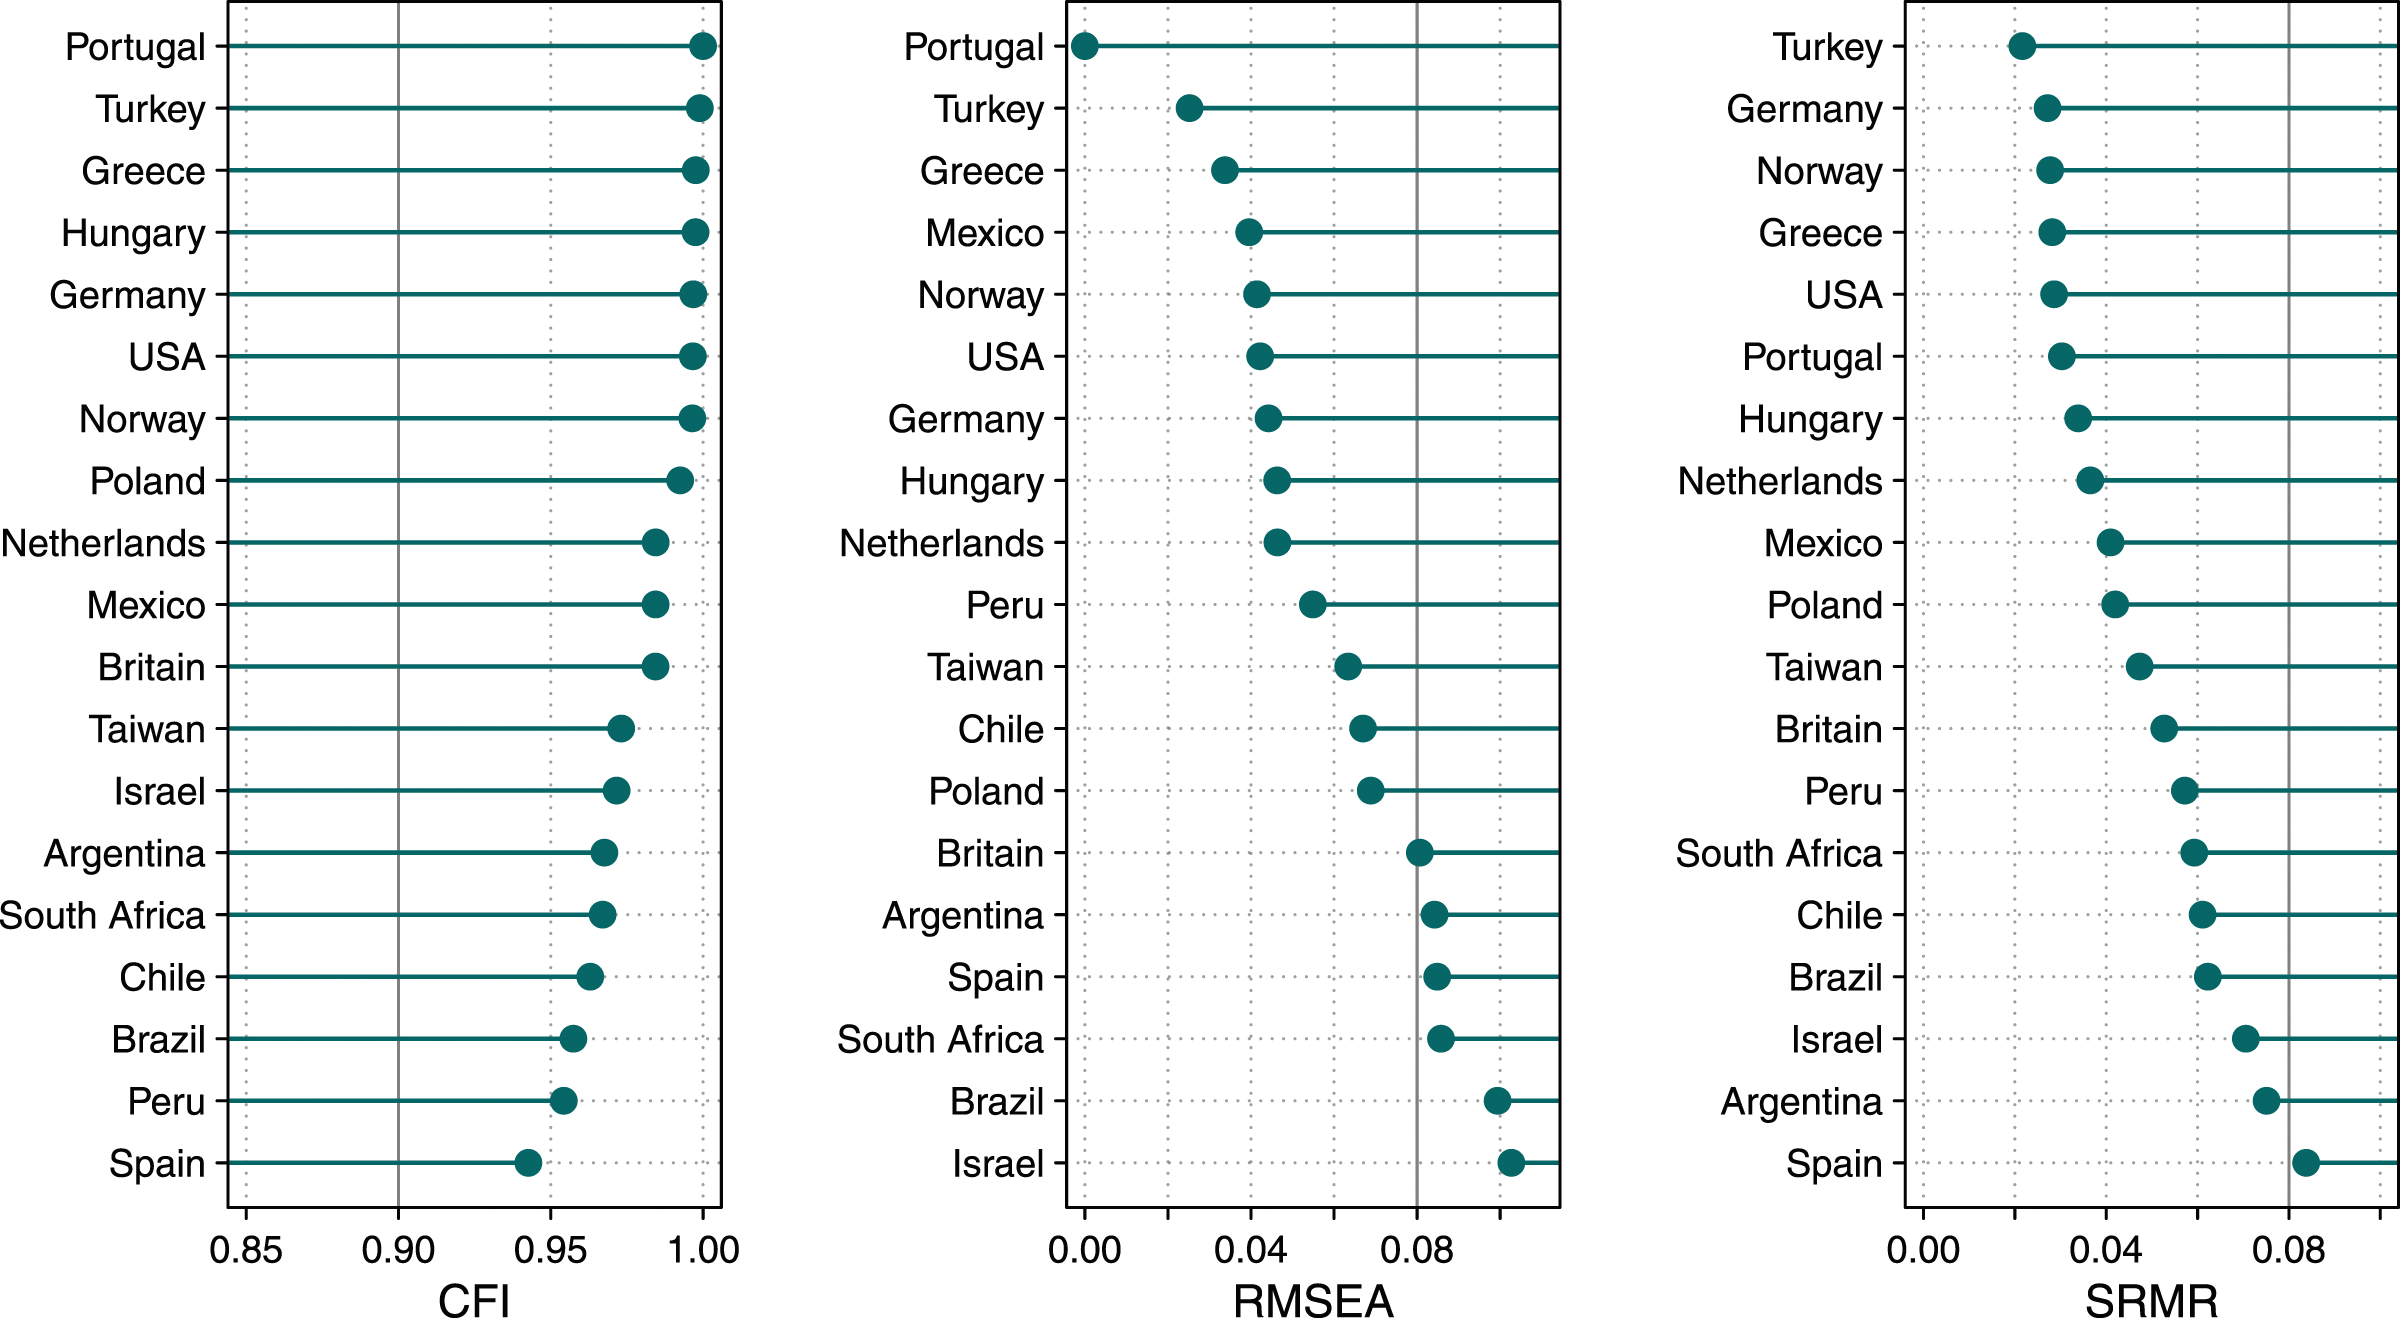
Next, we examine the validity of our measures by assessing the correlations between the concise scale and other opinion variables (left panel of Figure 4; see the supplementary materials for a table of correlations). The first set of variables we include are existing measures of support for democracy and rejection of authoritarian alternatives (first four rows of Figure 4). Although these existing survey measures of support for democracy have their flaws, for example, for using the word “democracy,” we nevertheless expect these variables to show moderate to strong correlations with our concise scale, given that the latter focuses on such familiar institutions of democracy as free and fair elections and freedom of speech. These are tests of convergent validity, in other words. Reliability, convergent and divergent validity of concise support for democracy scale. Left panel: Correlations between concise liberal democracy scale and various criterion variables. See supplementary materials for the wording of the criterion variables. Only certain criterion variables were included in each survey. Polyserial correlations are used if the criterion variable has fewer than eight response categories; Pearson’s correlations are otherwise used. Right panel: Cronbach’s alpha for the concise scale in each country, estimated using polychoric correlations. The solid vertical line indicates the threshold conventionally used to distinguish a reliable scale from one that is unreliable. Higher values indicate greater reliability.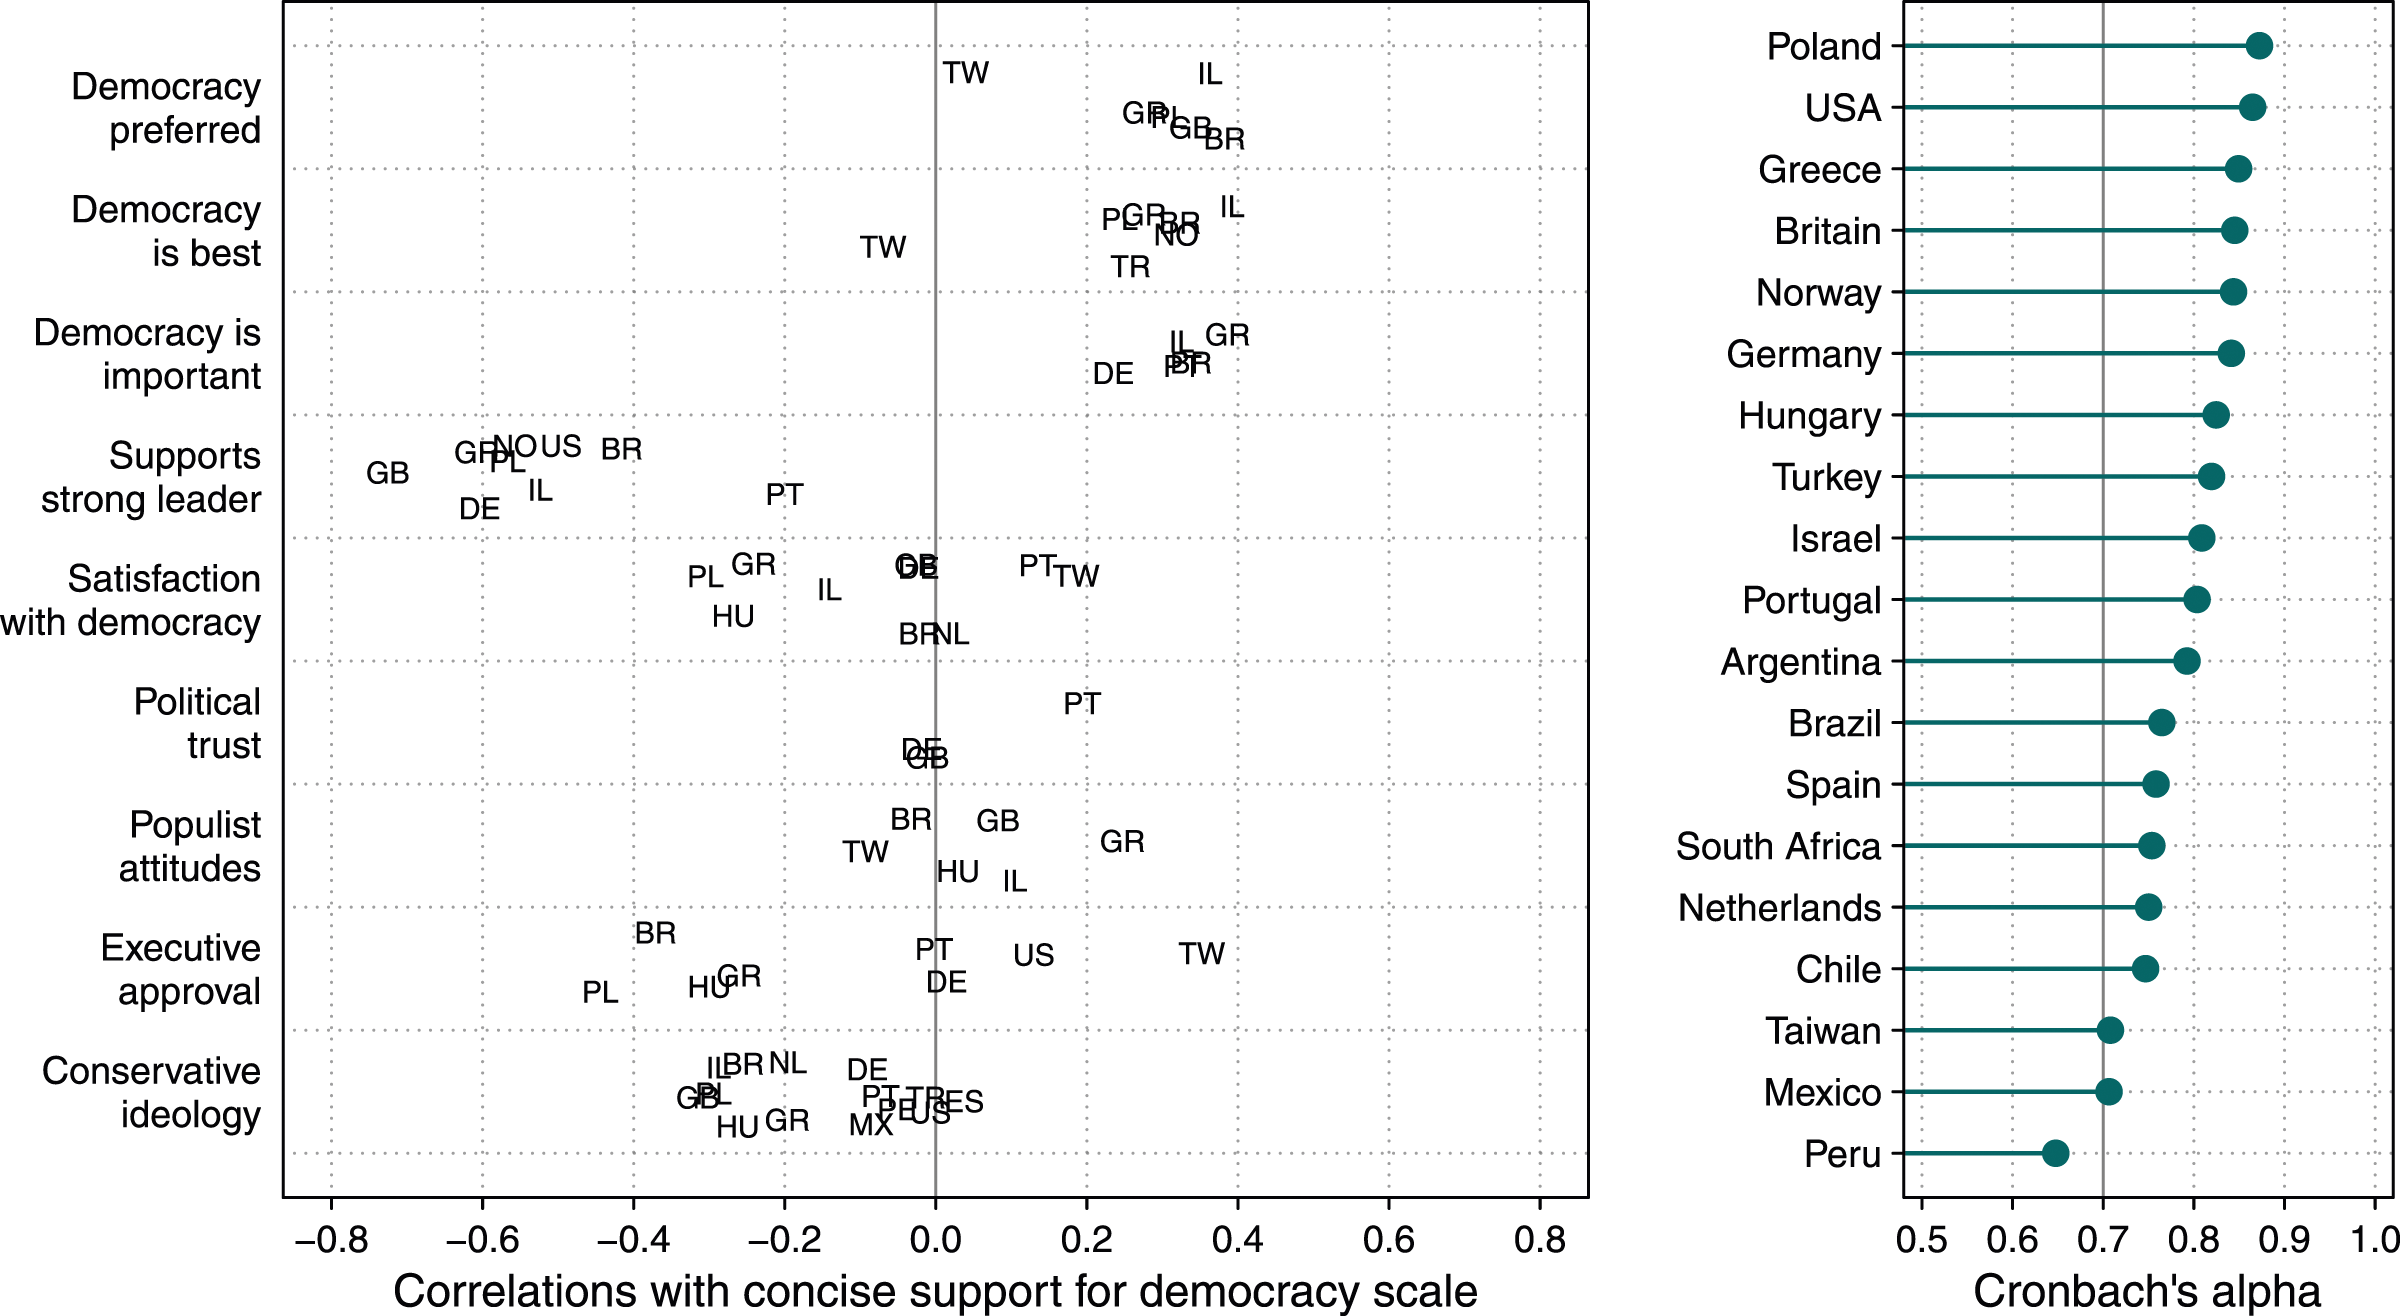
We generally observe correlations of this magnitude: the questions capturing preferences for democracy over authoritarian rule, beliefs that democracy is the best system, and evaluations of how important it is to have a democratic system show positive correlations with support for liberal democracy of .28, .25, and .33, on average respectively. 13 Even stronger correlations are observed between the concise scale and the question regarding support for a strong leader (which does not reference “democracy”): the average correlation across the samples in which such a question was fielded is −.52.
We test the divergent validity of the concise scale by comparing it to several variables that existing research suggests should not be strongly related to support for liberal democracy. We have up to five such variables: evaluations of the political system (satisfaction with democracy and political trust), populist attitudes, government or presidential approval, and ideological self-placement. Although satisfaction with democracy is sometimes used as a measure of democratic support, more careful analyses reveal that it is an ambiguous question that likely captures support for the way the political system appears to be working (Canache et al., 2001; Linde & Ekman, 2003). Indeed, we see weak correlations between satisfaction with democracy and support for liberal democracy (mean correlation = −.07). There are similarly weak correlations between our concise scale and political (institutional) trust (mean = .05) and populist attitudes (mean = .06); the latter consistent with previous research by Zaslove and Meijers (2023).
We observe weak to moderate correlations with political ideology (generally left vs. right self-placement; mean = −.15) and approval of the executive (mean = −.11). These correlations are perhaps stronger than that which we expect given the conceptual distinction between support for the institutions of liberal democracy and support for the government or president of the day. Where the governing party or president is from the political right, we usually observe a negative correlation with support for liberal democracy, particularly in Brazil, Poland, and Hungary, where the executives at the time of the survey were right-wing populists. The only exception to this pattern is Taiwan, where – as we have noted – politics is oriented mainly around a national identity cleavage. Conservative ideological views also tend to be negatively correlated with support for liberal democracy. As such, although ideology and executive approval have traditionally been orthogonal to support for democracy, these variables seem to have become connected in recent years, likely due to undemocratic or illiberal appeals from certain actors on the political right.
Finally, we consider the internal coherence of the concise scale across our samples. The estimates of Cronbach’s alpha are presented in the left-most panel of Figure 4. The scale is reliable in most samples except Peru, where the reliability falls just short of the benchmark of 0.70. It should be borne in mind that these reliability estimates are generated after selecting items that fit well in the larger battery; while reliability was not a criterion used in selection, retest reliabilities will likely be lower than those reported in Figure 4. At the same time, we selected items that cover the theoretical range of the concept of liberal democracy, so we would expect a modest degree of inter-item correlation.
In sum, our concise, seven-item battery can be used by scholars interested in measuring support for the rights and institutions of liberal democracy. A scale created using this battery has content validity (in its coverage of the rights and institutions of democracy) and adequate construct validity. It also exhibits convergent and divergent validity and forms a reliable scale. The concise battery should generally be used instead of the full battery when the research goal is to construct a unidimensional measure of support for liberal democracy. In addition, the nested definition of liberal democracy we adopt from V-Dem allows scholars to focus on measuring support for the electoral or liberal components of democracy should either be of interest; to do so, only the three or four items corresponding with each of those components need be included in a survey.
Conclusion
The question of how citizens relate to democracy is crucial for the survival and quality of democratic regimes. However, the standard survey measures of support for democracy are problematic, as they reference abstract and complex regimes such as democracy, which appear to be interpreted differently across contexts and individuals (Bratton et al., 2005; Dalton et al., 2007; König et al., 2022). To overcome this problem, we propose a more fine-grained and concrete approach to measuring support for democracy, based on the specific rights and institutions that constitute liberal democracy in practice. We develop a battery of 17 items that tap support for the eight components of liberal democracy described by the Varieties of Democracy project, and then field this battery in a diverse set of 19 national samples.
We find that public attitudes regarding the rights and institutions of liberal democracy are generally oriented around a main dimension of support for liberal democracy. However, people in less developed contexts tend to have more heterogeneous views on democracy than those in high-income countries, that is, their attitudes are less coherent. Yet, we propose that those items that are more weakly connected with general support for liberal democracy tend to reveal the influence of political events and actors. For example, we find that support for protest rights is weakly or negatively linked with support for liberal democracy, especially in cases like Chile and Peru which had experienced significant disruptive protests at the time of their surveys. As such, our battery may grant insight into the institutions and processes of democracy that are unpopular, or even threatened. This is particularly evident in the case of Hungary, where democracy has experienced substantial erosion, and where citizens now evaluate universal suffrage quite differently from the other institutions of liberal democracy.
Not all scholars will be seeking a battery of items that could be used to diagnose political cultures; many simply require a measure of support for democracy that improves upon the crude items that are currently available. To this end, we have identified a concise subset of seven of our items that can be used to create a unidimensional scale of support for liberal democracy. These seven items cover much of the breadth of the concept of liberal democracy but still form a coherent and reliable scale in all samples. The scale also shows evidence of convergent and divergent validity in its solid correlations with existing measures of support for democracy as well as weaker correlations with more distinct concepts like political trust.
We acknowledge that our approach is not the final word on this topic and that there is room for improvement and refinement in future work. We arguably did not manage to capture the component of support for key decision-makers being elected in our measures. More extensive analyses that use multiple items for each of the components of liberal democracy, and that cover more countries in the global South, would be welcome. It would furthermore be valuable to examine how clusters of citizens group together the rights and institutions of democracy (e.g., Bertsou & Caramani, 2022; Carlin & Singer, 2011; Schedler & Sarsfield, 2007) and to explore citizen support for other models of democracy, for example, direct democracy (König et al., 2022). We hope that this paper serves as a springboard for such future studies of public support for democracy, its causes, its consequences, and of course, its conceptualization and measurement.
Data Availability Statement
Replication materials can be found at Claassen et al., 2024
Footnotes
Acknowledgments
We appreciate the help and feedback provided by Claudia Landwehr, Robert Liñeira, Alex Wuttke, Lea Kaftan, and David Knoll. RC and RS acknowledge financial support from the Department of Political Science and Center for Human Rights and Democracy at Georgia State University. CC acknowledges financial support from the Leverhulme Trust, via a Philip Leverhulme Prize, and from the ESRC via the NORFACE Joint Research Programme “Democratic Governance in a Turbulent Age,” which is cofunded by the European Commission through Horizon 2020 under grant agreement No 822166. LB and EZ acknowledge financial support from the LAPOP Lab and Vanderbilt University. KA acknowledges financial support from the Excellence Strategy of the German Federal and State Governments at Heidelberg University as part of the project “Experienced solidarity: values, motives and practices in caring communities and social volunteering (EXPSOLIDARITY).” EB acknowledges financial support from Department of Political Science at the University of Zurich. SG and DO acknowledge financial support from the Centre for Social Sciences Budapest and the “Democratic Innovations and Hungarian Parties” Postdoctoral Excellence Program (PD_131408), National Research and Development Fund of the National Research, Development and Innovation Office. AC acknowledges financial support from the Institute for Liberty and Responsibility at Reichman University. DH and DS acknowledge financial support from Brigham Young University. MM acknowledges financial support from the Dutch Science Council (NWO) via a Veni grant awarded to MM, “Credible or Capricious: The Reputational Cost of Party Policy Change,” grant number VI. Veni.191R.018. SD acknowledges financial support from the Norwegian Research Council, via a Young Researcher Talent grant awarded to SD, “When will citizens defend democracy?” (DefDem). BS acknowledges financial support from the Polish National Science Centre (NCN) via the NCN OPUS 20 project “Partisan bias or indifference? Actually-Existing Democratic Values and their Consequences in Poland” under grant agreement 2020/39/B/HS6/00853. PM acknowledges the financial support of the Horizon2020 project: “Next Steps in Securing the Sustainability of the European Social Survey (ESS-SUSTAIN-2).” RM acknowledges the financial support of the School of Government and Public Policy Departmental Research Fund at the University of Strathclyde. TT acknowledges the financial support of the National Science and Technology Council, R.O.C., grant MOST 110–2410-H-004–079-MY3. AN and AO acknowledge the financial support of a European Research Council Consolidator Grant to AN, “Democracy under Threat: How Education can Save it” (DEMED), Grant number 865305. YL acknowledges the financial support of David Binder Research.
Declaration of Conflicting Interests
The author(s) declared no potential conflicts of interest with respect to the research, authorship, and/or publication of this article.
Funding
The author(s) disclosed receipt of the following financial support for the research, authorship, and/or publication of this article: This work was supported by the Multiple funders; see acknowledgements on p.2.