
Abstract
How do politicians allocate public resources? Despite the extensive literature on distributive politics, we have limited micro-level evidence for why and under what circumstances politicians choose various allocation strategies. India’s discretionary constituency development scheme (MPLADS) provides an excellent opportunity to study the spending choices of individual politicians. Drawing on an original dataset linking voting patterns across 227,507 villages in the 2009 general elections to MPLADS allocations 2009–2014, we find that politicians generally channel more projects and resources to villages that vote for them in higher numbers. We then leverage a natural experiment created by the delimitation (redistricting) of electoral boundaries in 2008 to provide causal evidence that spending choices are driven by short-term electoral incentives. Finally, we show that allocation patterns differ by the type of party that has brought a politician to power. Our findings contribute to the growing literature on heterogeneity in politicians’ distributional choices.
A sizable literature on distributive politics examines how politicians allocate the public resources under their control. There is a robust debate about whether politicians are more likely to direct resources towards their core supporters, or to competitive areas where they may attract new voters. 1 It may seem more strategic for politicians to focus on persuading “swing” voters to support them, but when coordination and voter mobilization are taken into account, the core-voter argument is strengthened (Cox, 2010). A review of empirical studies shows that most, though not all, parties and politicians seem to be allocating disproportionately to areas that vote for them in higher numbers (Stokes et al., 2013). However, we still have limited micro-level evidence for why and under what circumstances politicians choose different allocation strategies.
The emergence of constituency development funds over which politicians have considerable discretionary power makes it possible to study distributional choices more directly, and at a granular level (Tshangana, 2010). In this article, we examine the spending choices of 232 Members of Parliament (MPs) in India under the Member of Parliament Local Area Development Scheme (MPLADS). Under this scheme, MPs have access to yearly funds that they can allocate to any development activities they deem appropriate within their respective electoral districts (“constituencies” in India). 2 As MPs have total discretion over the allocation of funds under this scheme, it is ideal for studying the choices of individual politicians.
Drawing on original datasets manually linking both polling-station-level election returns and MPLADS projects to census villages, we identify three main patterns. First, across 227,507 villages we find a strong positive association between support for the winning candidate in the 2009 general elections and MPLADS allocations 2009–14. Although in the raw data there is a curvilinear relationship between support for the MP and funding allocation—a pattern indicating that MPs give more to competitive areas—when we examine the distribution of projects within constituencies and control for obvious confounders, such as village population size, the curvilinear pattern is weakened substantially. This contradicts spending patterns under a similar scheme in Kenya (see Harris & Posner, 2019), but is consistent with work on India by Bussell (2019), as well as the general expectation in India that politicians will provide resources to “their own” when they win an election.
Second, to shed light on why we find this positive association between village-level voting patterns and MPLADS spending, we turn to a natural experiment created by the delimitation (redistricting) of electoral boundaries in 2008. The redistricting resulted in many villages being moved from one constituency to another one. These changes were announced several years prior to the 2009 elections, in many cases rendering the affected villages electorally unimportant for the sitting MP. If politicians were distributing their MPLADS funds to build a long-term reputation in the community (Björkman, 2014; Piliavsky, 2014), in a non-contingent manner (Bussell, 2019; Chauchard, 2018), to reward brokers (Hicken et al., 2022; Stokes et al., 2013), or to benefit co-partisans at lower levels of government (Bohlken, 2018; Malik, 2021), without a view to their own next election, we might expect spending to continue in villages that lost their electoral importance. However, whereas these other motivations may well shape politicians’ choices in some circumstances, 3 we find—consistent with the assumption in most political economy models—that politicians maximize their chances of winning the next elections, and that all politicians dramatically reduced spending in villages that were to be moved out of their constituency after the new delimitation was announced.
Finally, we show that there is variation in politicians’ allocation strategies, depending on the type of political party that brings them to power. Whereas both electoral competition and partisan alignment have been shown to influence MPLADS spending at the constituency level (Bohlken, 2018; Keefer & Khemani, 2009), Indian politicians we interviewed emphasized that within-constituency allocation choices depend largely on the type of networks in which their political parties are embedded. Indeed, our data show that politicians from parties linked with social or religious networks (embedded parties) are more likely to spend in their electoral strongholds, whereas politicians from non-embedded parties—who are less constrained by social and religious ties—spend more in competitive parts of their constituencies. 4
Our work contributes to the literature in at least four ways. First, we corroborate the finding from other parts of the world that politicians are generally more likely to direct resources to core area, not swing ones. Second, using fine-grained data and a natural experiment, we show that electoral incentives, not other plausible motivations, dominate the allocation of the discretionary funds available to Indian politicians. Third, by focusing on the characteristics of political parties and not just the politicians’ individual characteristics or electoral incentives, our study contributes to the literature seeking to explain variation in politicians’ allocation choices (see Bahamonde, 2018; Bohlken, 2018; Corstange, 2018; Harris & Posner, 2019; Vaishnav & Sircar, 2012). Finally, we leverage a large new dataset of polling-station-level data manually linked to census village indicators, as well as original MPLADS data manually linked to villages across two election periods, data we hope will be a significant contribution to the study of Indian politics.
Politicians, Incentives, and Distributional Choices
The distributive strategies of politicians, the mechanisms by which resources are allocated, and to whom they are targeted has been the subject of much scholarly debate. The dominant theoretical perspective tying these elements together assumes that politicians in non-programmatic contexts will tend to distribute private goods and club goods to voters in strategic ways so as to maximize their chances of winning the next election (see, e.g., Besley, 2006; Kitschelt & Wilkinson, 2007; Stokes et al., 2013). Some predict that politicians and parties channel funds to their supporters in order to retain their support in the future (see Cox & McCubbins, 1986; Nichter, 2008); others argue that they also focus their efforts on swing voters (see Dixit & Londregan, 1996; Lindbeck & Weibull, 1987). 5
There is empirical evidence from across the world consistent with both of these arguments. As discussed in Stokes et al. (2013), politicians and parties tend to channel more resources to locations where they have greater voter support. For example, Ansolabehere and Snyder (2006) show that counties in the USA with a high vote-share for the governing party received larger shares of state transfers, and Carlitz (2017) shows that the distribution of new water infrastructure in Tanzania is skewed to favor localities with higher levels of support for the ruling party. In contrast, Bickers and Stein (1996), Herron and Theodos (2004), and Dahlberg and Johansson (2002) provide evidence that areas with more swing voters receive more benefits than do other areas. 6
The Member of Parliament Local Area Development Scheme
The large-scale governmental scheme known as the Member of Parliament Local Area Development Scheme (MPLADS) provides a unique opportunity to study the distributional choices of individual politicians in power in India. Each Member of Parliament (MP) may recommend the annual allocation of 50 million Indian rupees (Rs.)—some $700,000—to development projects of his or her choosing within their respective constituencies. 7 Proposed projects are to be sanctioned (approved) or rejected by the administrative district authorities within 45 days, and approved projects are to be implemented within 1 year (Government of India, 2012: p. 4).
The official objective of the MPLAD scheme is to “enable MPs to recommend works of a developmental nature […] based on the locally felt needs” (Government of India, 2012: p. 1). This means that, at least on paper, the MPs are meant to use these funds to meet local development needs. The focus is on creating “durable assets.” Typical MPLADS projects are hand-pumps, small stretches of road, community houses, or solar lighting. To ensure public awareness of how funds are distributed, each MPLADS project displays a plaque with the name of the MP sponsoring the project and information about the work that was done. This makes these project high-visibility and easy to use for political ends. Indeed, these funds have been referred to as “institutionalized pork.” 8
The few existing studies of the spending patterns under the MPLAD scheme have revealed interesting patterns: the MPs tend to “pass on pork”—i.e. spend less of their allocated money—in “safe” constituencies (Keefer & Khemani, 2009), and MPs tend to spend more in areas where they are politically aligned with the elected members of the state-level legislative assemblies (MLAs) (Bohlken, 2018). 9 These studies indicate that the electoral incentives for MPs at the constituency level influence how they choose to allocate their funds. Our study examines electoral incentives within constituencies. How do MPs decide which villages and towns within their constituency will get development projects?
Politicians’ Allocation Choices
To explore how politicians make their funding allocation choices, we interviewed MPs and MLAs from various parts of India. 10 Typical responses were consistent with the idea that politicians reward loyalty (including votes) with favors after an election. There is ample evidence in India that resources are channelled to the political supporters of those in power: village-level politicians use their power to distribute resources to the supporters of their party within the village (Dunning & Nilekani, 2013; Jha et al., 2009). Areas get more resources if they are aligned with the party of the MLA or MP in that area (Bohlken, 2018; Bussell, 2019) or with the ruling government in the state (Asher & Novosad, 2017). 11 States whose governments are aligned with the parties in the central government have been found to benefit in terms of fiscal transfers (Bhavnani & Lacina, 2017; Khemani, 2003; Rodden & Wilkinson, 2004).
The responses in our interviews are also in line with studies that emphasize the importance of activists and brokers in Indian politics. 12 It is easy to understand why intermediaries are so important: parliamentary constituencies in India generally have populations of almost 2 million, with about 1.3 million eligible voters. 13 These voters are spread across as many as 1000 or more villages and towns within each constituency. As politicians do not have the capacity or means to follow up on individual voters, they turn to intermediaries. In today’s India, the activists or brokers that politicians rely on are party members, local-level politicians, representatives of social organizations, or individuals with specific personal skills that make them influential (see Auerbach & Thachil, 2018; Krishna, 2003; Kruks-Wisner, 2018). These activists communicate between the politician and the voters, organize rallies or other events, and help campaign for the candidate. An MP from the Indian National Congress party (henceforth Congress) quite candidly stated that he directs a significant share of his MPLADS funds to the activists who help him win elections because that is what they expect. 14
Heterogeneity in Allocation Choices
Recent scholarship on distributive politics has increasingly turned to identifying and explaining variation in politicians’ choices—they may not always choose to target funds the same way (see Bahamonde, 2018; Bohlken, 2018; Corstange, 2018; Harris & Posner, 2019; Vaishnav & Sircar, 2012). Although all the politicians we interviewed explained how they distributed funds to their network of intermediaries, they also emphasized differences between politicians who relied primarily on personal networks and those who depended on activists from the pre-existing social or religious networks of the parties that brought them to power. A Congress politician in the southern state of Karnataka drew a clear distinction between Congress and parties such as the BJP. In his view, politicians from parties like the BJP could rely on pre-existing social networks to bring them to power—whereas he had to build his own network to succeed in elections. 15 A BJP MP we interviewed in Mumbai described Congress as a “party of voters,” in contrast to the BJP which is a party of activists. 16
This difference in party characteristics seems to affect the functions politicians feel obliged to fulfill. A BJP MLA in Karnataka was quite explicit about the constraints he experienced. As the BJP is closely linked to the powerful social organization Rashtriya Swayamsevak Sangh (RSS), he said he always responded to the concerns of the RSS cadre. He explained that citizens linked to the RSS are often connected to other politicians in the BJP (some of whom are senior to him) and would turn to those other leaders if they felt he was not responsive. These ties were, he felt, central to his reputation and his career as a politician. To be politically successful, he had to be responsive to the RSS. 17
The insights from these interviews indicate variation in the constraints that politicians face, depending on the type of party they are affiliated with. The BJP is an example of a party that is clearly embedded in a social group—the RSS. This organization, which predates the party, aims to use the party to capture the state. Similar to mass parties, embedded parties can be seen as the political agents of a social group (Neuman, 1986: p. 403), which uses the party to place its “own representatives in key offices” (Katz & Mair, 1995: pp. 6–7). Embedded parties are characterized by a mutual sense of obligation between the party elite and activists who emerge from a specific social group, which is often ethnic or religious. 18
In addition to the BJP, which has deep ties to the RSS, several other parties in India explicitly represent group and organizational interests and can therefore be considered embedded parties. The Bahujan Samaj Party (BSP) is closely linked to Jatav caste associations (Chandra, 2004); the Samajwadi Party (SP) emerged out of a Yadav caste association (Michelutti, 2004); the Shiromani Akali Dal is the political wing of the highest Sikh religious organization, the Shiromani Gurudwara Prabandhak Committee (Narang, 2014); and the Janata Dal (United) is closely linked to the Kurmi caste association (Kumar, 2018). As noted by Kitschelt and Wilkinson (2007, p. 34), such parties tend to have “dense organizational networks configured around particular interpretations of ethnicity.” For the groups associated with these parties, the party is a means to access state power.
However, not all parties in India are tied to specific groups or organizations in this way. Non-embedded parties tend to be more top–down; the party elite is not necessarily beholden to party members or activists, and party leaders act more as entrepreneurs and less as representatives of specific social identities. This description is apt for the formerly dominant Congress Party, 19 but also applies to most of the smaller parties in India (see Chhibber et al., 2014).
Data from the 1993 Political Elite Survey—the most extensive study ever conducted of political elites in India 20 —illustrates the difference between the parties we consider as embedded and non-embedded. Sixty eight percent of the respondents from the most stereotypically embedded party in India—BJP—said that their party’s strength came from having more committed party workers, a party cadre, and the organization. Only 30% of the activists from Congress felt similarly. This survey also gives clues as to whether connections to party leaders or the broader network matter most for politicians’ future careers: when asked what was required to obtain a nomination from the party to contest elections, only 25% of the BJP elites mentioned the importance of connections to leaders, as compared to 51% among those affiliated with Congress. 21
The clear empirical expectation from previous literature and interviews is that we should find that politicians channel more of their MPLADS funds to areas where they win a large share of the votes, as this is a high-visibility way of rewarding activists and brokers for their efforts. However, we should also expect a difference in the behavior by type of party, with politicians from embedded parties being more likely to respond to pressures from their party network by rewarding electoral strongholds. Politicians from non-embedded parties, by contrast, do not face similar pressures and are more likely to channel resources also to more competitive areas where they may persuade new voters to support them.
Data and Variables
The use of MPLADS funds is usually reported at the aggregate level—state or parliamentary constituency (PC)—but can also be accessed at the project level in PC-wise reports. 22 For each project, the reports include information about the type of project implemented, the village or town in question, the date it was approved and completed (if completed), and the sum of money allocated to the project by the MP.
Scraping the reports for each PC containing project-level details, we created a dataset with information about the projects implemented by all the MPs across eleven Indian states for the period 2009–2014. 23 We then used the location information provided in the reports to identify to which village or town the 90,799 included MPLADS projects were allocated. This was done manually, ensuring a high degree of reliability, and we were able to identify the census village or town of 99% of the projects.
The included politicians on average allocated Rs. 92.1 million of their MPLADS funds 2009–14. There was great variation, with some MPs spending more than Rs. 280 million and others proposing projects for less than Rs. 1 million. 24 On average, there were 385 projects in each PC (ranging from 1 to 2239 projects), so MPs on average allocated Rs. 239,000 to each project that they commissioned. Politicians could choose projects within the guidelines of the MPLAD scheme. Typical projects were the construction of a stretch of road, a part of a school or a community building, and the installation of a tube-well or a solar panel (see Table A.3). We also created a dataset for the expenditure in one state (Uttar Pradesh) for the period 2004–09, to analyze what happened when the new delimitation was announced. This is further discussed in Exploring Politicians’ Motivations.
Village-Level Voting Data
To examine the relationship between village-level voting patterns in India’s 2009 general elections and MPLADS spending, we linked the locations of the MPLADS projects to voting data. Voting data in India is accessible down to the level of polling stations, each with 300–1400 eligible voters. These polling-station-level data were parsed from PDFs available from the Election Commission of India and manually linked to census villages or towns using Electoral Rolls from the 2009 general elections in India. 25
Into this village-level dataset we then merged demographic characteristics from the 2011 Census of India Primary Census Abstract: village population, literacy rate, and the percentages of Scheduled Castes and Tribes. 26 We also included PC-level variables such as voter turnout and margin of victory (MoV) of each PC in 2009, as well as characteristics of each MP, such as party, gender, and caste category (Agarwal et al., 2021; Jensenius & Verniers, 2017).
We omitted from our dataset villages or towns where we could not reliably link the location of a project to the vote-share received by an MP from that location. The average population of the census units in the dataset is 2,112, and in the vast majority of cases, there are one or two polling stations in a village, or two or three villages share one polling station. In both instances, an MP will know which village supported her in the general elections. This is not possible in larger villages or towns, where there are many polling stations and these cannot be linked easily to particular geographies. Even individuals living in the same household may be allocated to different polling stations. This makes it impossible for MPs to precisely target MPLADS projects based on official election returns. For our purposes—looking at the association between voting patterns that the MP had information about and the placement of projects—including localities with multiple polling stations would add noise to our estimates. We therefore excluded all villages and towns that had more than three polling stations. 27 Our final dataset for the 2009–14 period includes information on 51,951 MPLADS projects across 227,507 villages and a few small towns in 232 PCs. 28
Outcome Variables
The first outcome variable we examine is whether a village was allocated at least one MPLADS project 2009–14 (Any Project). In some cases, villages got very small projects, but even a small project can be highly visible and have symbolic value. Some 29,630 (13%) of the villages in our data got at least one project. Of these places, 18,424 got just one project, 6,326 places got two projects, and the rest got more. To better capture the amount of resources channelled to a village, we look at the total sum of money allocated to projects in a village 2009–14 (Allocated funds). This ranged from Rs.0 to 35,402,154, with a mean of Rs.44,782. In the figures below, we show the absolute values for this variable, while in the reported regression models we use the log of the allocated amount (plus 1). The logged variable ranges from 0 to 17.4, with an average of 1.6.
Finally, we examine whether a village had at least one completed project during 2009–14 (Completed project). Whereas the other two variables measure publicly visible allocation choices, this variable may help to identify politicians’ distributional intentions, as it will reflect whether proposed projects were realistic and whether the politician made efforts to follow up on implementation (see Williams, 2017). 29 Some 16,081 of the villages (7%) in our data had at least one completed project—slightly more than half of those with an allocation.
Village-Level Electoral Support for the MP
The main explanatory variable of interest here is how much electoral support an MP got in a village, and—importantly—whether a locality is considered “safe” or “competitive”. This can be measured in at least two ways.
One intuitive operationalization is to look at the vote-share of an MP in a village (Village vote-share). This variable—which we create using polling-station-level data—ranges from 0 to 100, with a mean of 42.5%. 30 The MPs elected in 2009 in our 232 PCs won with vote-shares ranging from 21% to 79%. When looking at within-constituency voting and spending patterns, places with a higher vote-share can be considered to be “safer” parts of the constituency for the MP.
Another approach involves examining the village-level margin of victory for the MP (Village MoV). MPs do not “win” in villages, only at the constituency level, but having a much higher vote-share than other candidates gives an indication of how confident an MP can feel in a locality. Conversely, a village can be considered highly competitive if the runner-up receives almost as many votes as the politician with the highest vote-share. The village-level MoV for the MP in our data ranges from −100 to 100, with a mean of 4, where positive values mean that the MP was the candidate who received the highest vote-share in that village; negative values indicate the difference in the vote-share of the MP and the candidate who got the most votes in the village. 31
As activists and brokers working in villages are more likely to tout their efforts to the MP if the MP gets the highest vote-share in a village, and to emphasize the need to pay attention if the vote is evenly split with another candidate, we consider the village-level MoV the more relevant variable in the context of MPLADS funding allocations. In the tables and figures below, we use Village MoV as our main explanatory variable; robustness checks using Village vote-share as an alternative measure are reported in Online Appendix B.
Coding Indian Parties
Our other key explanatory variable is the type of party with which a politician is affiliated. We code the political parties included in our sample in two ways. Our first measure is qualitative, coded for all of India, relying on literature on India’s political parties. This coding yields a list of six parties in our embedded-party category: BJP, Bahujan Samaj Party (BSP), Janata Dal (United) (JD(U)), Rashtriya Janata Dal (RJD), Samajwadi Party (SP), and the Shiromani Akali Dal (SAD). The other twelve parties in the data are considered non-embedded parties. MPs running as independents are also included in the non-embedded category (see Appendix A.2 for details).
An alternative approach is to examine those who bring politicians to power: to what extent their party relies on voters that are active in the party and also in social organizations or networks. To see how this differs by party, we turned to the 2009 National Election Study (NES), a survey of about 36,500 eligible voters across India, representative at the state level. 32 The granularity of these data allowed us to create a continuous measure of how embedded a party is in pre-existing social networks. For each party in each state, we calculated the share of their voters among the survey respondents who were a member of the party and who also reported being a member of a caste or religious association (see Appendix A.2 for details). These two party measures are correlated at .34; we report on both of them in the analyses below.
Voting Patterns and Member of Parliament Local Area Development Scheme Spending
As the discussion above indicates, politicians may wish to use their funds strategically, to attract more voters in areas that are electorally competitive or to reward loyal supporters. To observe how voting patterns shape allocation choices, we examine the association between the village-level MoV for the MP and the location of MPLADS projects 2009–14.
This is shown in Figure 1. For values larger than 0 on the x-axes, the MP was the candidate who received the highest vote-share in the village; values below 0 mean that the MP got fewer votes than at least one other candidate.
33
Village-level support for MP in 2009 elections and MPLADS spending 2009–14.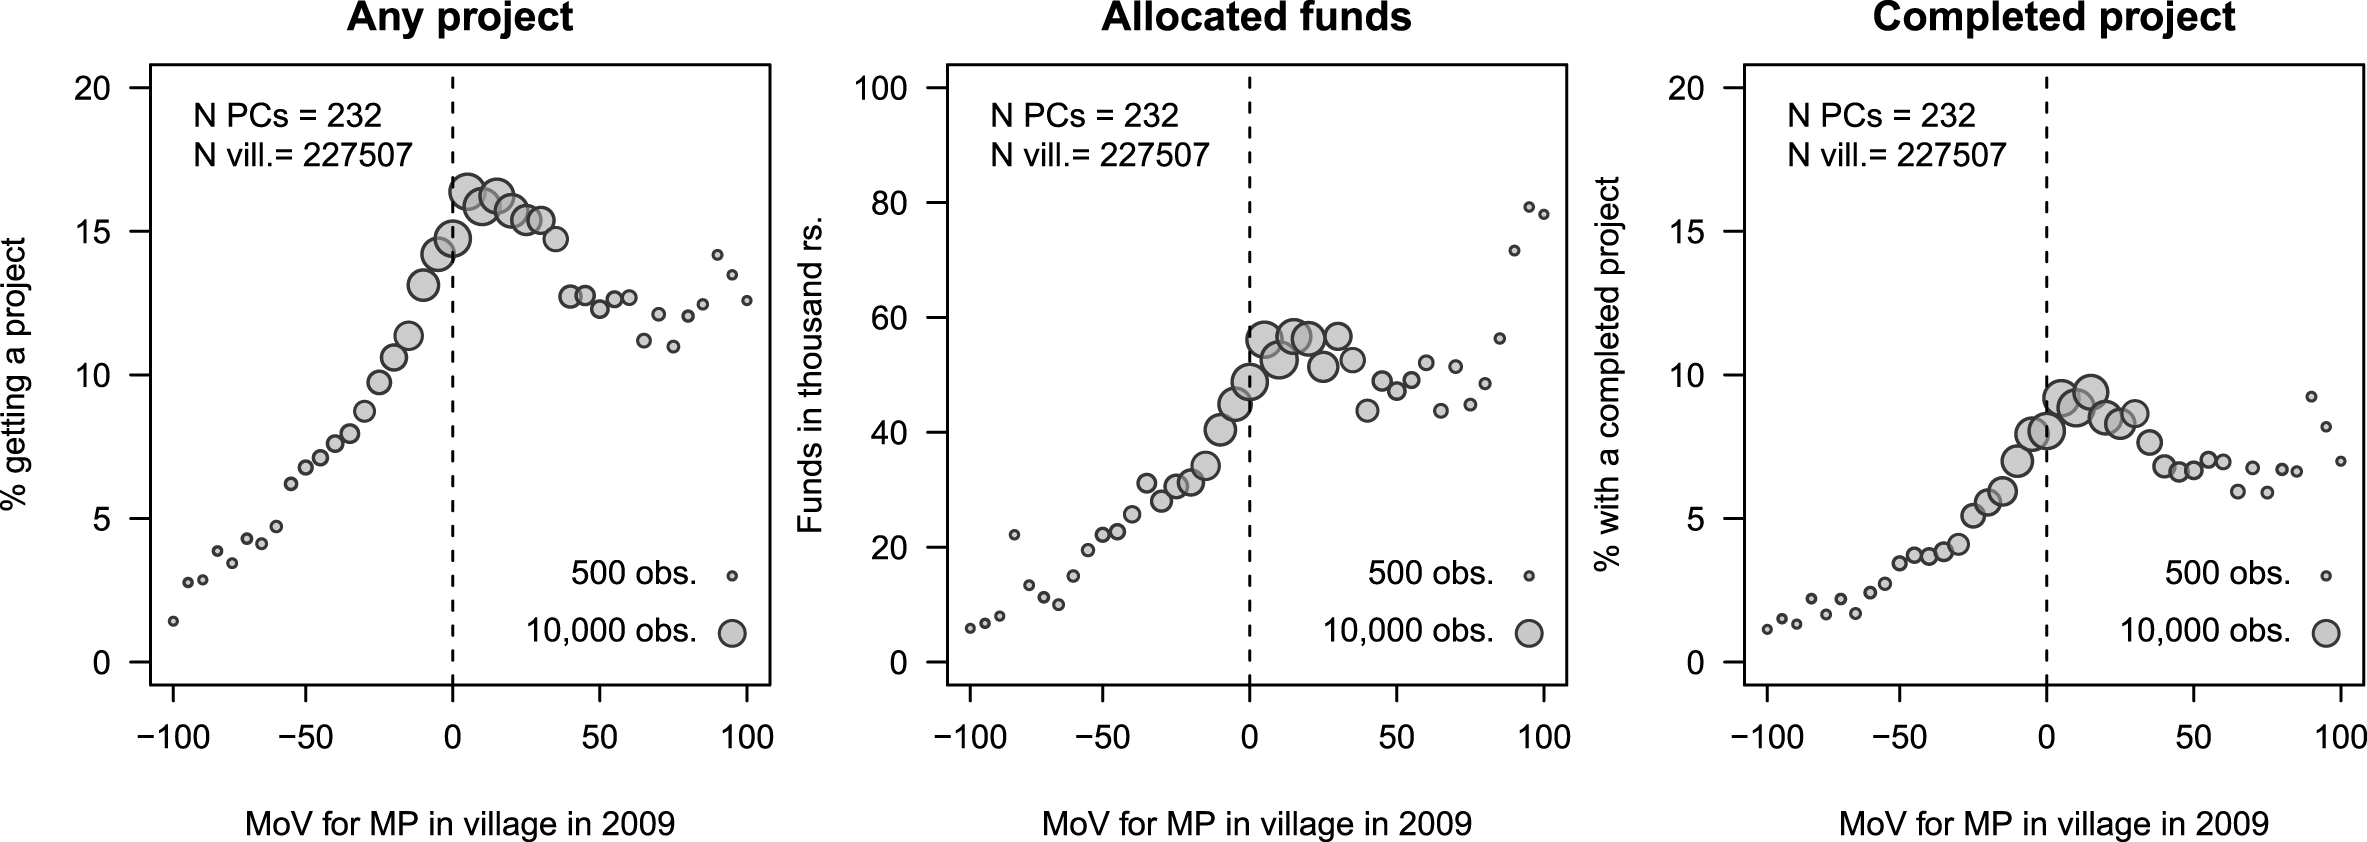
The left-hand panel in Figure 1 shows the share of villages that got at least one project 2009–14, plotted against the village-level MoV. Each gray dot indicates the share of villages that got at least one project (among the villages within a bin of five percentage points of MoV). The size of the dot reflects the number of villages in each bin: the first gray dot represents the 351 villages in the dataset where the incoming MP had a negative MoV between 100 and 95%—indicating no support or very little support. Among these villages, only 1.4% got a project (5 MPLADS projects were allocated). This stands in stark contrast to the right-hand dot in this panel, indicating that in the 424 villages where MPs won with an MoV of 95%–100%, about 12.6% got an MPLADS project (54 projects were allocated). The plot shows a clearly curvilinear pattern, indicating that competitive areas (those with a narrow MoV) received more projects than areas where the MP had won or lost with a larger margin.
The middle panel shows the same patterns for the funds allocated to villages within the same bins. Here too we see a curvilinear pattern. 34 In fact, it resembles the plot showing whether villages got any project at all, though with the highest values in the electoral strongholds. This indicates that the monetary size of projects allocated to these villages was greater than those allocated to other places. The right-hand panel shows the share of villages with at least one completed project. Here too we see a curvilinear pattern, indicating that villages with competitive elections were the most likely to get a project, though the curve is somewhat flatter than the one in the left-hand panel.
The patterns in Figure 1 indicate that there is an association between how villages voted and the allocation choices made by MPs. However, to what extent are these differences driven by other PC and village-level characteristics? It is, for example, likely that we would see less electoral competition in villages with a small population—as it is easier to get a high share of few votes—so we might expect more projects given to more competitive areas due to their population size rather than due to their electoral characteristics. There may also be differences in how much is accorded to areas with different socio-economic profiles.
Village-Level MoV 2009 and MPLADS Spending 2009–14.
Note. OLS regression models with standard errors clustered by PC in parentheses. All the explanatory variables are standardized by subtracting the mean and dividing by two standard deviations. Table B.1 shows these models using Village vote-share as an alternative measure of electoral support.
†significant at p < .10; *p < .05; **p < .01; ***p < .001.
In Models 2, 4, and 6 we include PC fixed effects, to account for PC-wise differences in overall spending, and village-level controls. 35 Our first control variable is village population size, as areas with larger populations have been found to receive more government funds (Harris & Posner, 2019). This is a strong, positive predictor of spending patterns across our three outcomes. Second, we include the literacy rate in the village, as literacy can be considered an indicator of the socio-economic standing of that village and is highly correlated with other development indicators (Banerjee & Somanathan, 2007). Whereas MPLADS funding is meant to fill development gaps, we actually find that literacy is positively associated with getting projects. Finally, we control for the share of Scheduled Castes (SCs) and Scheduled Tribes (STs) in the village—minority groups known to be poorer than the general population—as ethnic segregation has been found to be a key determinant of local public goods provision (see Ejdemyr et al., 2018). The share of STs in the village is negatively associated with getting a project, though this association is not significant when we look at completed projects. There is a weak association between the share of SCs in a village and getting a project (significant at the 10% level for any project and allocated funds).
The inclusion of fixed effects and village-level controls strengthens the linear positive association between Village MoV and spending. The curvilinear relationships, captured by Village MoV 2 , are weakened, but remain statistically significant. This analysis demonstrates that localities where the vote-share for the winning MPs was higher in the 2009 elections received more MPLADS projects and funds; there is also some evidence that competitive areas benefit as well.
Exploring Politicians’ Motivations
The fact that more MPLADS funding is channelled to areas that vote for them in higher numbers is not causal evidence of politicians responding in a strategic manner to village-level voting data. Does the pattern we observe indicate short-term electoral strategizing, or is it driven by other concerns? Politicians may be doling out resources to build a long-term reputation in the community, to reward brokers or co-partisans working in those areas, or they may be distributing projects in a non-contingent way to whomever contacts them (see Björkman, 2014; Bohlken, 2018; Bussell, 2019; Chauchard, 2018; Hicken et al., 2022; Malik, 2021; Piliavsky, 2014; Stokes et al., 2013)—all of which may end up benefiting core areas because the politicians have denser networks in those areas.
We provide evidence of a causal link between electoral incentives and funding allocations by exploiting a natural experiment created by the implementation of new electoral boundaries in the 2009 general elections. When the boundaries were redrawn, the new constituencies overlapped partially with old constituencies. 36 Thus, some towns and villages remained in the “same” constituency as before, where the incumbent politician could run for re-election, while other villages were moved to another constituency. Here we focus on whether villages were moved out of their prior constituency as a result of the delimitation; and we compare how many MPLADS projects the stayers and movers received after MPs learned about the changes, but before the new boundaries actually came into effect. 37
Delimitations in India are conducted by an independent Delimitation Commission and there is little political influence in the delimitation process (Iyer & Reddy, 2013; Jensenius, 2013). The 2009 changes to constituency boundaries were the result of the work of a Delimitation Commission established in 2002. The new boundaries were first drawn by civil servants in Delhi. Ten Associate Members from each state (MPs and MLAs) were then consulted in order to make adjustments to the first drafts (Delimitation Commission of India, 2008).
In Uttar Pradesh—the state in focus in this section—the first meeting with the Associate Members was held on March 30, 2005; the first official draft proposal was published in the Gazette of India on July 28, 2006; and the final delimitation approved on December 5, 2006 (Delimitation Commission of India, 2008: p. 1599). Thus, politicians certainly knew of the upcoming changes to their constituencies by the end of 2006—probably earlier, as drafts were shared with the Associate Members. 38
If MPs use MPLADS money strategically for short-term electoral gain, we should expect them to spend no funds in the areas that were to be moved out of their particular constituency. If, however, their distributional choices are based on other concerns, they may have continued to spend in those areas.
To examine changes in spending patterns when politicians found out about the delimitation, we collected MPLADS data for Uttar Pradesh (UP) for the period 2004–09. We scraped MPLADS data available online, and manually linked projects to villages. These data covered 17,638 projects allocated across 97,463 villages in UP. Similarly to the 2009–14 data, a large share of the projects went to the construction of roads (44%), educational facilities (18%), and infrastructure related to electricity (7%). We then identified in which constituency a village was before and after the delimitation by overlaying geo-coded maps of villages and constituency boundaries.
To capture situations where it was clear to MPs in which constituencies they would be able to re-run, we included only PCs that retained the same reservation status and where the new PC inherited at least 50% of the population from a previous one (51 PCs). 39 We also show results for the 24 PCs that had an overlap of at least 75% of the population, where it should be even more certain where the MP might run again.
Comparing all the villages (in PCs with at least a 50% overlap) that remained in the same constituency (N = 47,067) to those that were moved to a new one (N = 18,068) entailed comparing somewhat different groups of villages, as urban areas were more likely to remain in the same constituency. To address this concern, we matched up staying and moving villages on location (longitude and latitude), and on covariates (population size, literacy, and SC percentage from the 2001 census), as well as on the number of MPLADS projects they got in 2004. This greatly improved the balance on observable covariates (see number of matched villages in Table C.1 and balance statistics in Figure C.2 in the Online Appendix). 40
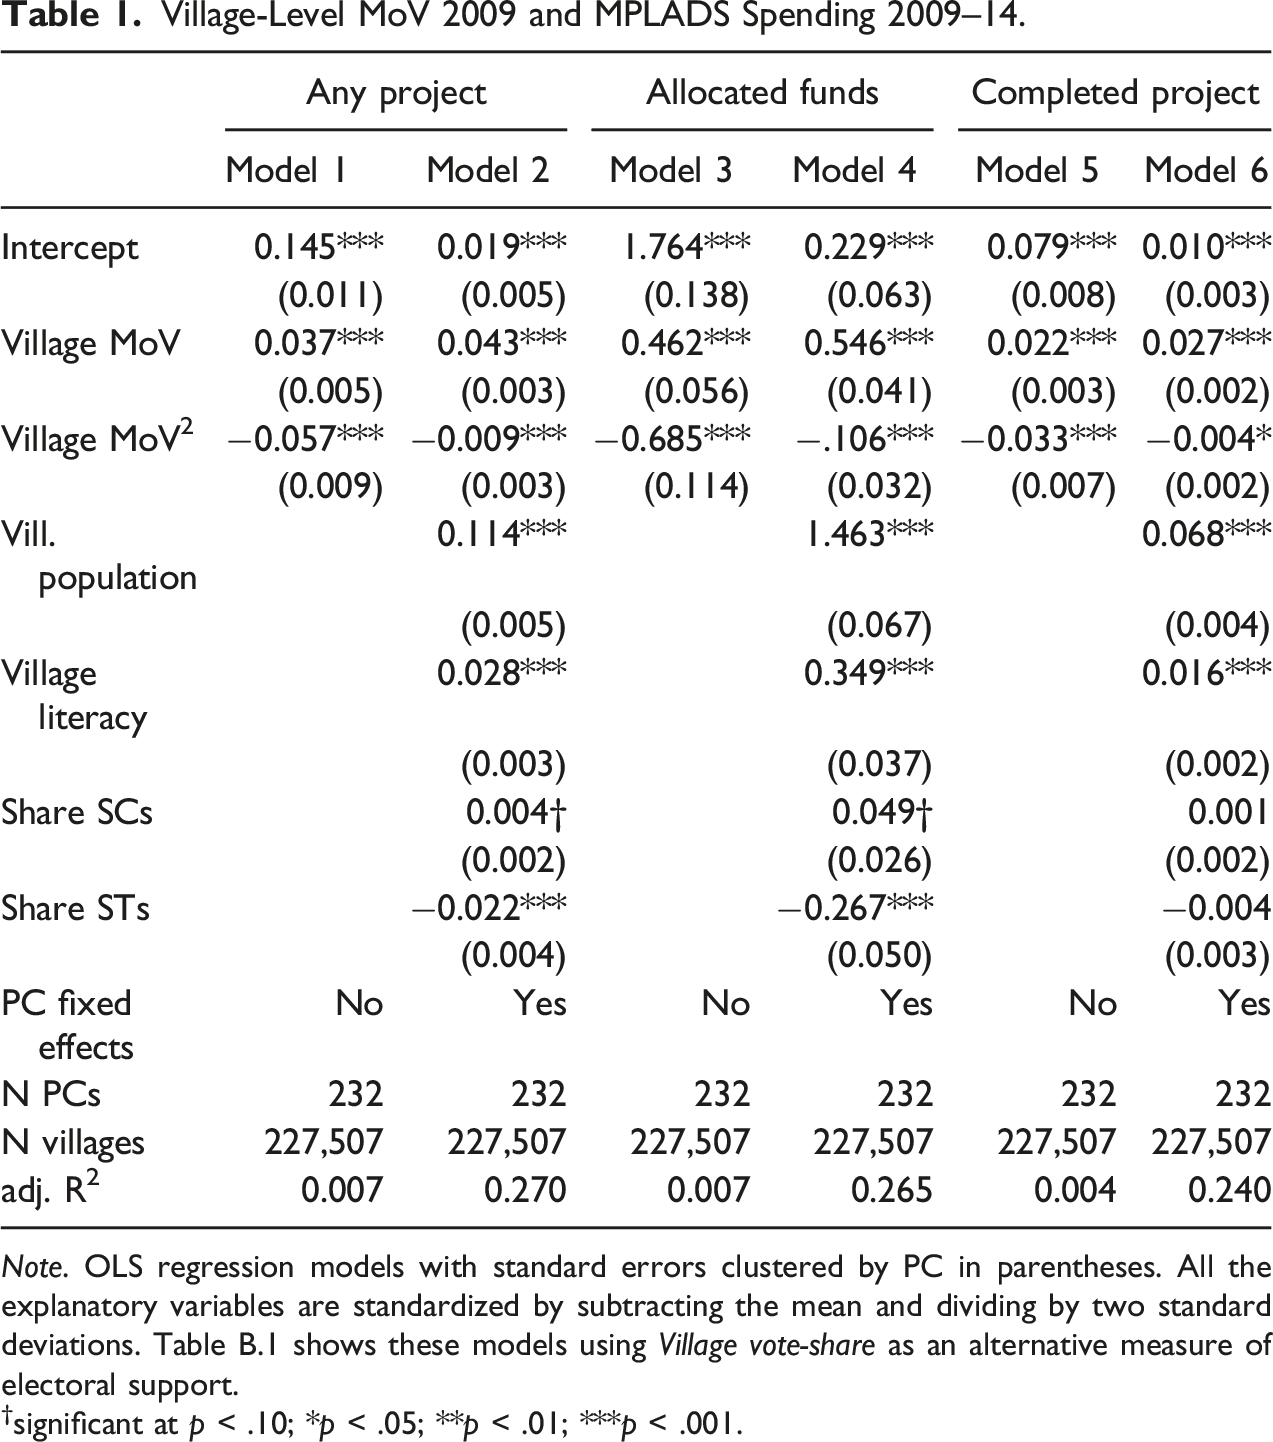
What happened to MPLADS spending in villages that were moved? Figure 2 shows the difference in the share of staying and moving villages that got at least one completed project between 2004 and 2009.
41
We show projects across three periods. First, before the new electoral boundaries were known (2004); second, in the years when the draft delimitation report was circulated but before it was finalized (2005–2006); third, after the delimitation report had been finalized (2007–2009). The matching estimate is the difference in means between each set of bars; a p-value based on standard errors clustered at the PC level is listed above each set of bars. The share of staying and moving villages with a completed project, 2004–09.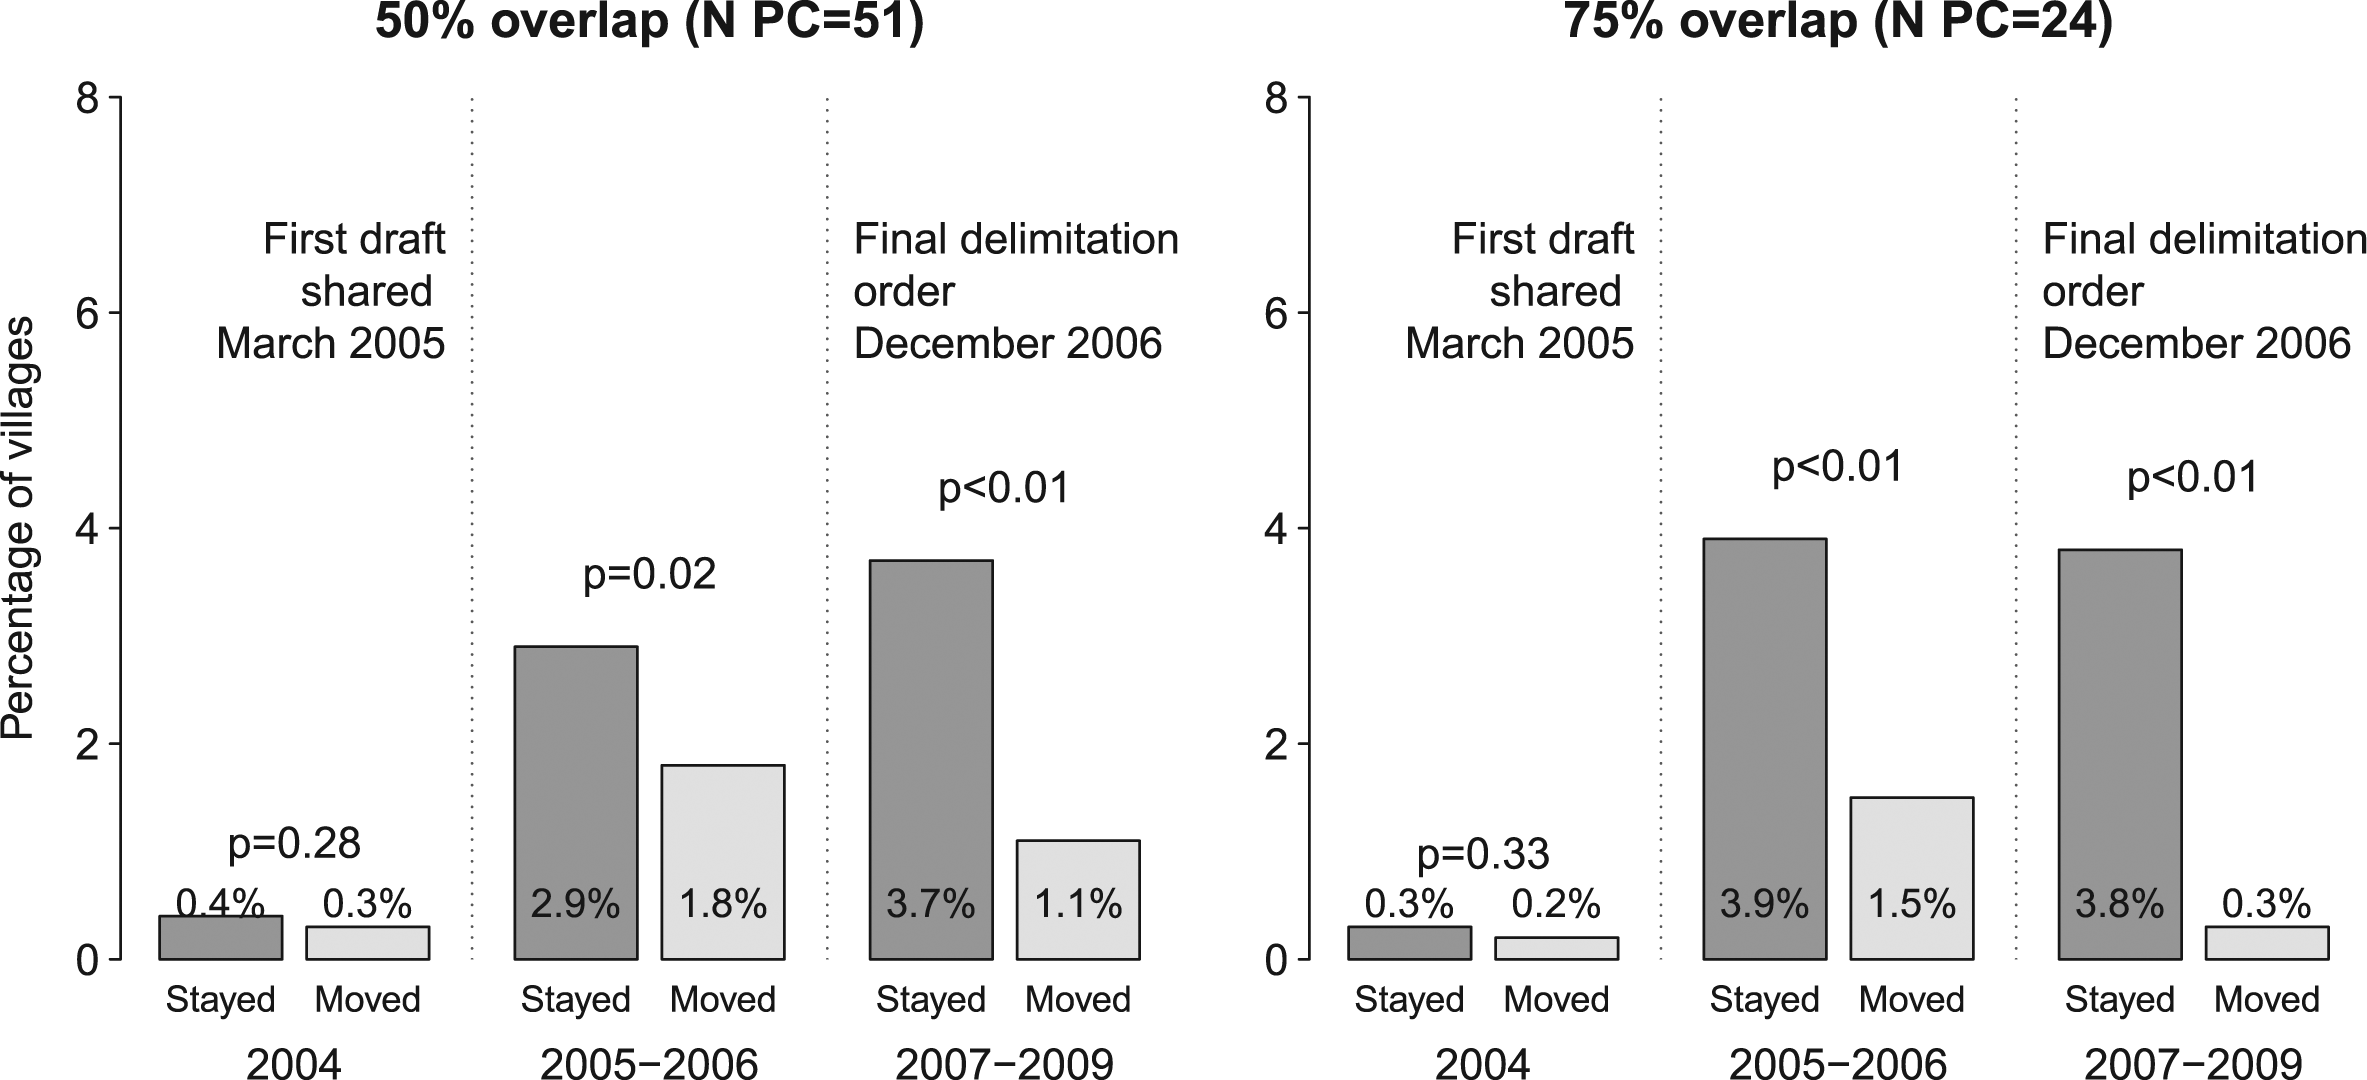
Few projects were completed in 2004, before the electoral boundaries were known, as this includes only allocations made by MPs elected that same year. 42 In the second and third periods, however, as the new boundaries became known, MPs spent much more in those villages that would remain in their constituency, particularly after the delimitation was finalized.
The left-hand panel in Figure 2 shows the difference in spending in staying and moving villages in PCs with at least a 50% overlap with a new constituency; the right-hand panel shows the difference in PCs with at least a 75% overlap. In both cases, there is a large drop in spending in villages that were moved out, but the drop in spending is greater in the PCs where there is a larger overlap with the new PC—where it was clearer in which PC the MP could run for re-election. These patterns indicate that electoral concerns dominate politicians’ allocation strategies.
Differences by Type of Party
Do we see differences in behavior by the type of party a politician is affiliated with? As discussed above, our expectation is that all politicians spend more in areas where they get more support, but that politicians from non-embedded parties will allocate more to competitive areas than MPs from embedded parties—in other words, that there should be a positive linear association between village-level support for the MPs from all parties, but also a curvilinear pattern in the data which should be stronger for politicians from non-embedded parties.
In Figure 3, we show the bivariate association between Village MoV and our three outcome variables for embedded parties and non-embedded parties, using our qualitative coding for party type.
43
The lines and 95% confidence intervals in the plots are from non-parametric regression models.
44
As expected, we find a stronger curvilinear pattern for non-embedded parties across all outcomes; they spend the most in competitive areas (understood as an MoV close to 0). MPs from embedded parties, on the other hand, spend more in areas where they get a higher vote-share than other candidates—and this “core-voter” pattern is particularly clear for the variable Completed project. Support for MP in the 2009 election and MPLADS spending 2009–14, by type of party (qualitative coding).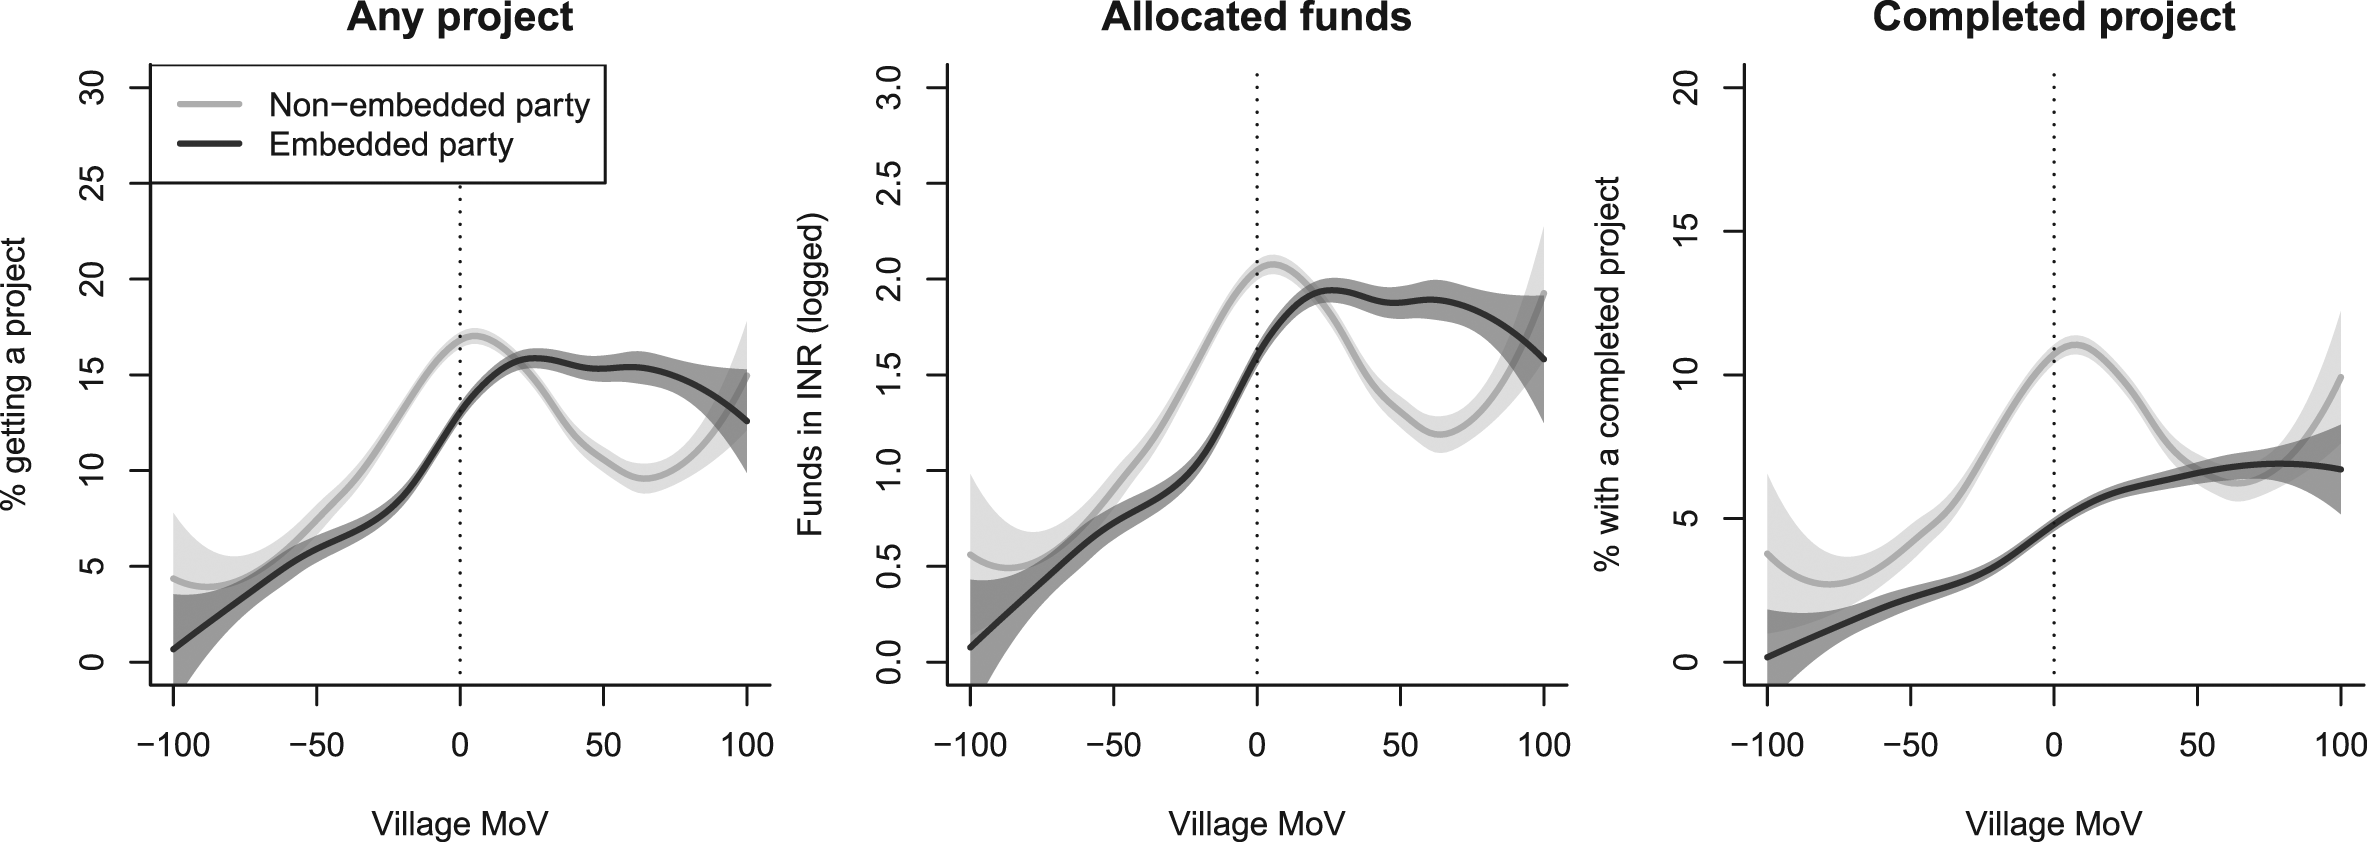
Multi-Level Regression Models of Party Type and MPLADS Allocations 2009–2014.
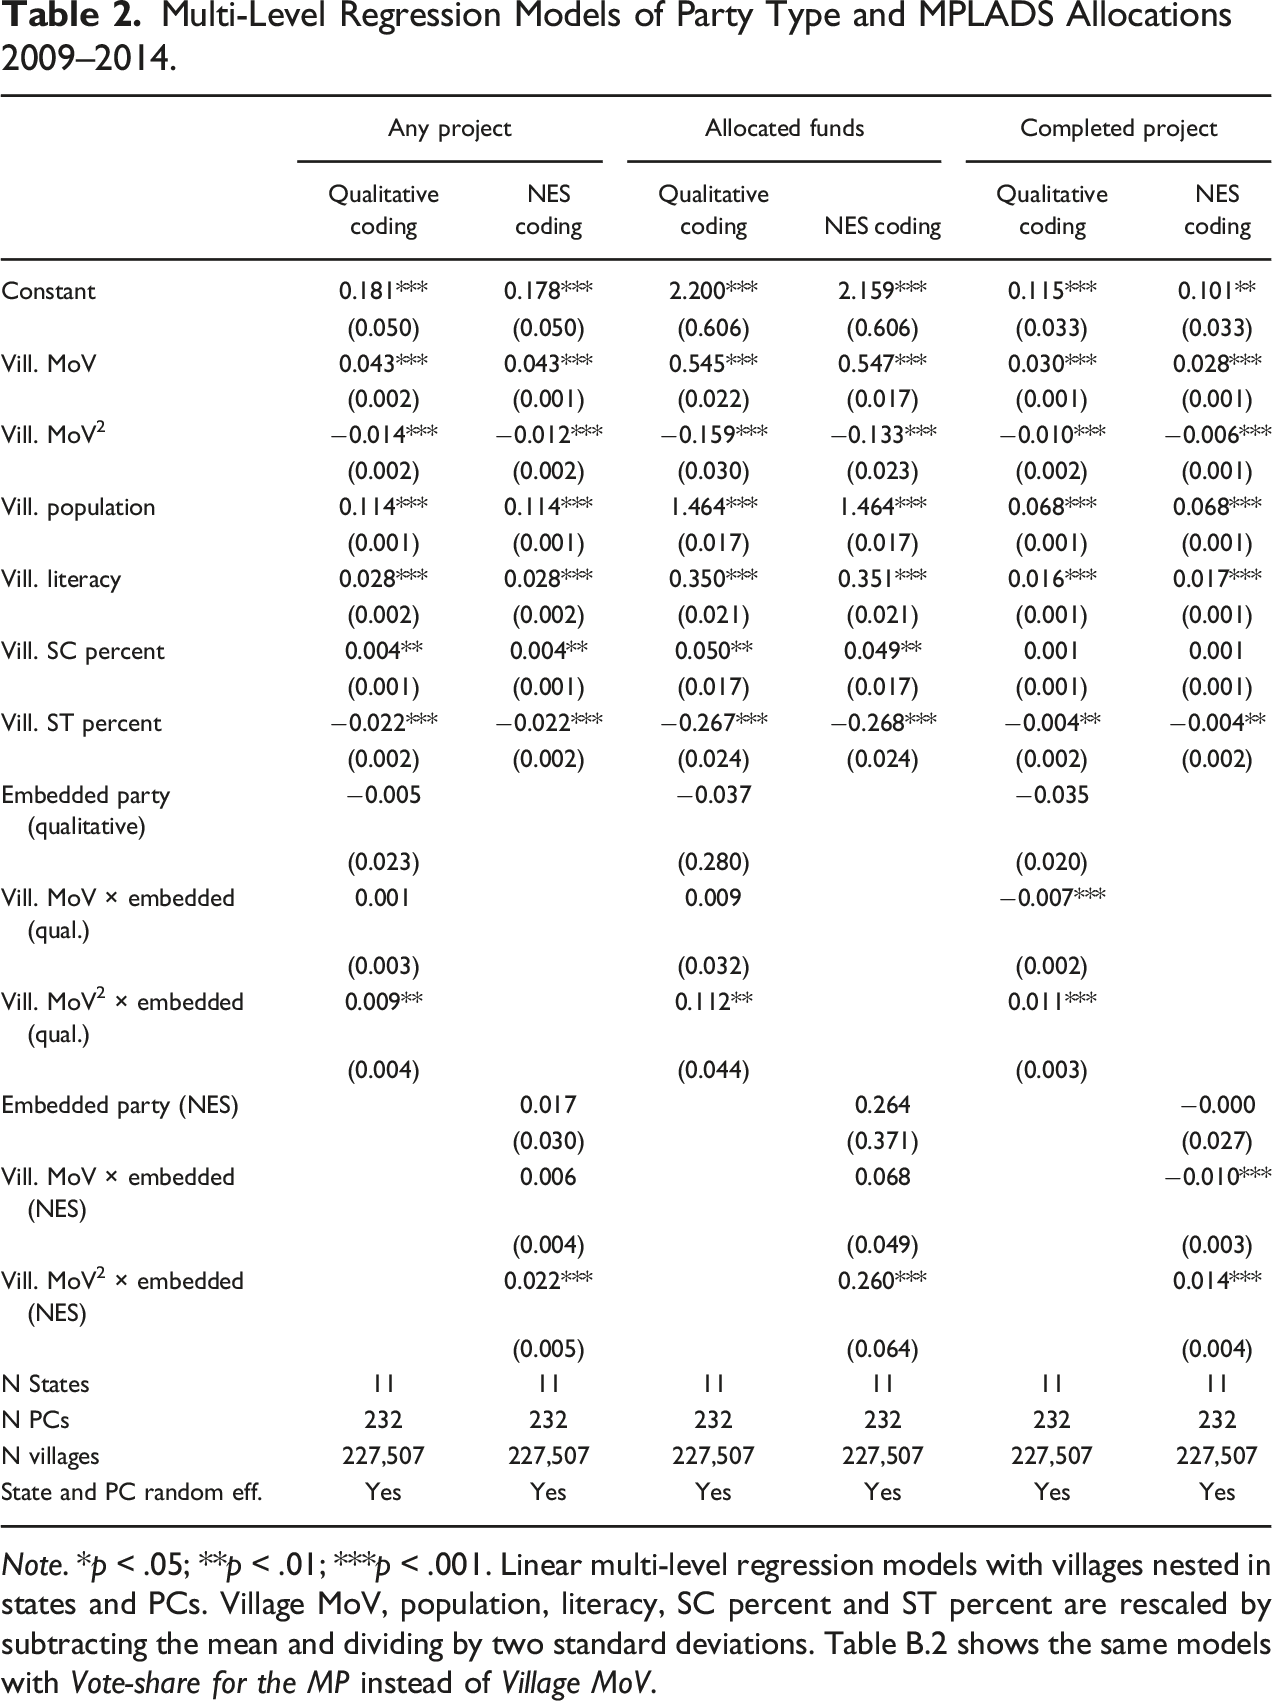
Note. *p < .05; **p < .01; ***p < .001. Linear multi-level regression models with villages nested in states and PCs. Village MoV, population, literacy, SC percent and ST percent are rescaled by subtracting the mean and dividing by two standard deviations. Table B.2 shows the same models with Vote-share for the MP instead of Village MoV.
What we see in Table 2 is that the differences by party type are robust to controlling for both PC-level and village-level characteristics. In the first two models, we show patterns for Any project across embedded and non-embedded parties. The first column uses our qualitatively coded measure of an embedded party, the second column uses the continuous measure that is based on NES data. For both our party measures, we see clear evidence of both a linear and a curvilinear trend for the non-embedded parties. 45 For embedded parties, however, the linear pattern is similar (no significant interaction between Village MoV and embedded party), but the curvilinear pattern is significantly weaker (the highly significant interaction between Village MoV 2 and embedded party).
We see similar patterns for Allocated Funds and Completed project in the third to sixth columns, with a similar linear pattern and a much weaker curvilinear pattern for embedded parties than for non-embedded parties across the models. 46
Conclusions
In this study we have examined how Indian MPs choose to allocate their discretionary development funds. Our findings corroborate patterns from other parts of the world, showing that politicians tend to spend more in core areas than in swing areas; further, we provide causal evidence that this is a form of electoral strategizing rather than a by-project of other motivations. India is often seen as the prototypical example of a patronage democracy, where it seems plausible that some politicians would choose to benefit “their own” when they are in office, even if that might lose them the next election. However, our findings indicate that the behavior of Indian politicians is quite in line with common expectations in the distributive politics literature.
We also show that the kind of party with which politicians are affiliated seem to shape their distributional choices. Some parties originate in, or have close ties to, social and religious networks. These networks have clear expectations that politicians will distribute resources to them once in power, and considerable leverage to ensure that they actually do so. In particular, we find that politicians from parties embedded in social or religious networks are more likely than politicians from non-embedded parties to favor their electoral strongholds in allocating funds. These findings contribute to the growing literature seeking to explain variation in politicians’ distributional strategies.
Empirical studies of politicians’ allocation of public resources have yielded somewhat contradictory findings. Further theorizing and testing of variation in politicians’ interests and incentives is probably the way to reconcile these findings. Some politicians may be more driven by electoral incentives than others: old age, term limits, and viable exit options are among the reasons why politicians might not seek to focus on re-election. Yet most politicians are likely to care about their electoral prospects, and we find that electoral incentives do seem to be the dominant motivation of the politicians in our sample. Still—and as our results indicate—even those who focus primarily on winning the next election are likely to strategize in different ways, and they are probably responsive not only to their voters, but also to their party, to activists, and to others in their networks. Learning more about how these individual-level, structural, and organizational incentives shape politicians’ actions seems a fruitful avenue for future research.
Supplemental Material
Supplemental Material - Privileging One’s Own? Voting Patterns and Politicized Spending in India
Supplemental Material for Privileging One’s Own? Voting Patterns and Politicized Spending in India in Comparative Political Studies
Footnotes
Acknowledgements
We are grateful all the comments we have received on previous versions of this article. Particular thanks go to Elin H. Allern, Ankita Barthwal, Carles Boix, Kanchan Chandra, Miriam Golden, Felix Haass, Andreas Kotsadam, Tanu Kumar, Irfan Noorduddin, Jas Sekhon, Jeremy Spater, Pavithra Suryanarayan, Milan Vaishnav, and Steven Wilkinson. We would also like to thank Tarun Kumar and Nirvikar Jassal for their help in collection of the MPLADS data.
Declaration of Conflicting Interests
The author(s) declared no potential conflicts of interest with respect to the research, authorship, and/or publication of this article.
Funding
The author(s) disclosed receipt of the following financial support for the research, authorship, and/or publication of this article: This article was supported by the Norges Forskningsråd (225905).
Notes
Author Biographies
References
Supplementary Material
Please find the following supplemental material available below.
For Open Access articles published under a Creative Commons License, all supplemental material carries the same license as the article it is associated with.
For non-Open Access articles published, all supplemental material carries a non-exclusive license, and permission requests for re-use of supplemental material or any part of supplemental material shall be sent directly to the copyright owner as specified in the copyright notice associated with the article.