
Abstract
We revisit the hypothesis that a Weberian bureaucracy enhances economic growth. Theoretically, we develop arguments for why such a bureaucracy may enhance growth and discuss plausible counterarguments. Empirically, we use new measures capturing various Weberian features in countries across the world, with some time series extending back to 1789. The evidence base from previous large-N studies is surprisingly thin, but our extensive data enable us to move beyond the problematic cross-country correlations used in previous studies. Hence, we conduct tests that control for country-specific characteristics while ensuring sufficient variation on the slow-moving bureaucracy variables to enable precise estimation. Our analysis suggests that previous cross-country regressions have vastly overstated the strength of the relationship. While this casts uncertainty on the proposition that there is an effect of Weberian bureaucracy on growth, our further analysis suggests that—if an effect exists—it may operate in the short term and be stronger in recent decades.
Weber (1978) outlined an ideal type of bureaucracy characterized by several features, including that employees are recruited based on merit and make decisions based on codified rules, in an impartial manner. While Weber proposed that economic and technological developments are prerequisites for bureaucratic development toward this ideal, subsequent research has focused on how features of the bureaucracy affect economic development. In-depth case studies suggest that a well-organized, knowledgeable, and rule-following public administration fueled the economic development of several East and South-East Asian countries from the 1950s and onward (Amsden, 1992; Evans, 1995; C. A. Johnson, 1982; Kohli, 2004; Wade, 1990). Conversely, bureaucracies displaying “neo-patrimonial” modes of governance instead of Weberian features are proposed as a key reason for the underdevelopment of many Sub-Saharan African countries (Goldsmith, 1999; Sandbrook, 1986). In this article, we question, re-assess, and nuance the notion that a Weberian bureaucracy enhances economic growth.
The notion that Weberian bureaucracy and growth are causally linked is widely held among scholars, and several case studies have linked features of the bureaucracy to the economic development of particular countries. Still, the evidence base for a general effect from Weberian bureaucracy on growth from large-N studies is surprisingly thin. The latter studies consist of cross-section regressions on a handful of countries or panel regressions on short time series employing proxy measures that do not capture the relevant theoretical concept. If we employ the standards of inference currently used for other relationships involving observable macro-variables (e.g., democracy and growth; see Acemoglu et al., 2019), we cannot yet claim to know with a reasonable degree of certainty that Weberian features of the bureaucracy, in general, enhance growth.
This situation, we surmise, results from the lack of data that directly tap into Weberian bureaucracy with extensive time-series and geographical coverage. We therefore employ several new measures from the Varieties of Democracy (V-Dem; Coppedge et al., 2018a; Knutsen et al., 2019) project, which capture various features of Weberian bureaucracy from 1789 to 2017, globally.
These long time series allow us to include relevant information from the early period of modern history—an era that saw the building of professionalized bureaucracies and the take-off of modern economic growth, especially in Western Europe and North America (Maddison, 2001). They also allow us to check for heterogeneity in the relationship across time; some studies indicate that state institutions were less important for growth in this earlier period (Chibber, 2006; Sylla & Toniolo, 1991). Finally, they enable us to control for country-specific features that may bias the relationship, while ensuring sufficient variation on the slow-moving bureaucracy variables to keep standard errors reasonably precise.
Our results suggest that previous estimates on Weberian bureaucracy and growth from cross-country regressions have vastly overstated the relationship. Our panel models typically report positive, but modest, point estimates, which are mostly statistically insignificant at conventional levels. We conduct a battery of robustness tests and, for example, vary measures, estimators, and length of the panel unit; the lack of a clear relationship does not result from a particular specification choice. Yet, further analysis suggests that—if it exists—the effect tends to operate in the short term and is stronger in recent decades. The latter finding could, for instance, stem from bureaucracies becoming more important for growth as production technologies have become more complex, but it could also, in part, reflect that it is inevitably harder to measure Weberian features precisely in early years.
Theory
The Weberian ideal type of bureaucracy entails hierarchical organization with clearly delineated lines of authority and areas of responsibility, that decisions are based on clearly codified rules and made in an impartial manner, and that bureaucrats are meritocratically recruited, have expert training, and advance in the organization based on objective criteria (Weber, 1978). Hence, Weberian bureaucracy is a description of how state administrations are organized and should be distinguished from outcome-centered concepts such as “state capacity” or “quality of government”. Whether having a Weberian bureaucratic organization promotes “good outcomes,” including good governance, are ultimately empirical questions (Dahlström & Lapuente, 2017).
So why would one expect Weberian characteristics to matter for economic growth? In this section, we elaborate on potential links but subsequently highlight important objections and qualifications pertaining to these proposed links.
Why Weberian Bureaucracies May Enhance Growth
The key proximate causes of per capita (p.c.) economic growth, as recognized by growth economists, are physical capital accumulation, human capital accumulation, and technological development (Acemoglu, 2009). Thus, a country’s public administration should matter for growth insofar as it incentivizes actors to invest in or otherwise enhance one of these “immediate determinants” of growth.
Any such relationship is presumably indirect. Institutional features typically matter for incentives to invest, educate, innovate, or adopt technologies developed elsewhere, because they shape how economic and other policies are formulated or implemented, which, in turn, incentivizes different economic actors to pursue particular courses of action (e.g., Bizzarro et al., 2018). Examples include particular education policies (e.g., recruitment of high-quality teachers) incentivizing young adults to stay in school, investment policies (e.g., transparent tax regulations) mitigating perceived risks for foreign investors, or intellectual property policies incentivizing entrepreneurs to invest in new technologies.
If Weberian features of the state bureaucracy enhance growth, they should therefore contribute to either the formulation of policies that incentivizes investments and/or better implementation of these policies. We elaborate on three such mechanisms through which different features of Weberian bureaucracy can promote growth: Weberian bureaucracy may contribute to (a) enforcement of property and contract rights, (b) increase competence among bureaucrats, and (c) increase predictability. All these mechanisms may contribute to the formulation and implementation of policies that incentivize public and private investments, primarily in physical capital.
First, the Weberian features of rule-following and impartial decision-making may contribute to property and contract rights’ enforcement. Several key markets, including insurance and capital markets, require “non-simultaneous transactions, in which the quid is needed at one time or place and the quo at another . . . [and where] gains from trade cannot be realized unless the parties expect that the contracts . . . [are] carried out” (Clague et al., 1999, p. 186). Potential investors also require a guarantee that the fruits of such transactions are not expropriated, later on, by the state or other actors (North, 1990). This is the straightforward theoretical case for the role of secure property rights in economic development.
Impartial bureaucracies enter the story through the problem of enforcement. Property and contract rights are not primarily important as paper constructs but through how they enter people’s minds. For contract rights to work, parties to a deal must be expected to hold their promises. For property rights to function, people must share beliefs about the boundaries that separate one’s property from another’s. The actual workings of contract and property rights are thus based on certain behavioral expectations (de Soto, 2001).
Nonetheless, if every non-simultaneous economic transaction would rely on the parties being certain that any future violation is detected and punished, transaction costs would be too high for any deal to be made. If, instead, these transactions could rely on expectations that a third-party enforcer will step in and arbiter potential conflicts impartially, transaction costs will be significantly lower. Thus, impartial bureaucracies can mold the long-term behavioral expectations that underpin economic transactions.
Moving to our second mechanism, Weberian bureaucracy may enhance competence among bureaucrats, which could (indirectly) enhance growth. Contrast a bureaucracy where recruitment and promotion are based on merit with one where they are based on familial ties, personal loyalty, or political connections. In the latter (“patrimonial”) administrations, bureaucrats have few incentives to develop their expertise. Empirical results corroborate that meritocratic-based recruitment contributes to better overall competence and performance of the bureaucracy (Krause et al., 2006; Lewis, 2008; Rauch & Evans, 2000), lower corruption (Dahlström et al., 2012), and less biased public policy knowledge (Boräng et al., 2018). Competent bureaucracies could also spur growth because they “can help individual entrepreneurs overcome coordination problems . . . [and] turn informational resources into public goods in ways that increase the likelihood and effectiveness of investment” (Evans & Rauch, 1999, p. 753). Public agencies staffed with competent people can promote growth by providing growth-enhancing public investments, such as roads or railroads, more efficiently, and by providing reliable information to potential private investors on, for example, local business partners.
Third, states can alleviate physical, economic, and social insecurity by making life more predictable, and making predictions are at the heart of any economic calculus, be it investing in a business or in education (Evans & Rauch, 1999). Two features of a Weberian bureaucracy—clearly delineated lines of authority/areas of responsibility with a certain bureaucratic autonomy and meritocratic recruitment/promotion—should increase predictability. An autonomous bureaucracy hinders arbitrary interferences by political leaders in bureaucrats’ decision-making. If so, prospective investors can more easily trust that the explicitly formulated laws and rules will be followed. Furthermore, a meritocratic bureaucracy enhances predictability because bureaucrats’ time horizons will be longer when their careers depend on their performance and not on political connections that may be less valuable after the next election (or coup). When bureaucrats anticipate a long career, short-term behavior, such as shirking or taking bribes, may be substituted for long-term behavior, such as working hard and following rules. Meritocracy and predictable career prospects thus contribute to an organization that is more apt at pursuing long-term goals (see also Evans & Rauch, 1999), which, in turn, influences how policies are implemented.
In sum, plausible arguments suggest that different components of a Weberian bureaucracy lead to policies that incentivize investments in physical capital, and, potentially, also in new technology and human capital.
Nuances and Counterarguments
There are, however, important nuances to the arguments presented above. First, if the effect flows mainly through physical capital accumulation, standard growth theory tells us that any effect of Weberian bureaucracy on gross domestic product (GDP) p.c. growth should materialize in the short to medium term, but have little bearing on long-term growth rates (Acemoglu, 2009; Solow, 1956).
Moreover, the effect of Weberian bureaucracy on economic development may depend on the time period under study. When reviewing research on the relationship between the state and economic growth, economic historians Johnson and Koyama (2017) point out that “[s]ustained growth began during the eighteenth century in England and in the nineteenth century in North America—prior to the development of a modern bureaucracy in either country” (p. 10). Other scholars have highlighted how an extensive, centralized state bureaucracy in prior centuries may have stifled political and economic dynamism, and thus long-term growth, via various mechanisms. For instance, centralized, non-European states were better able to resist pressures for colonization and “modernization” by European states (e.g., Acemoglu et al., 2002; Hariri, 2012), slowing capital accumulation and technology diffusion during the 18th and 19th centuries. However, the effects of having had early, centralized states may have changed following decolonization, predicting higher current state capacity and growth rates (Bockstette et al., 2002; Foa, 2017).
More generally, having a Weberian bureaucracy might have become substantially more important for growth later in modern history, with the development of more complex production technologies (which are harder to monitor and manage), information technologies, and other sophisticated tools that administrations can employ in their work. Kohli (2004), for instance, notes how state-directed development policies were relevant in post-colonial regimes, tying their varying success to differences in state capacity in different Asian, African, and South American countries. Moreover, Sylla and Toniolo (1991) argue that, except for state interventions in building railways, the state did not matter much for European industrialization in the 19th century. While playing indirect roles for economic development—for example, through protecting property rights and providing education—states were still fairly small relative to national economies, playing a negligible direct role, for example, in terms of public investments. Chibber (2006) compares early and late industrialization and argues that states mainly supported earlier (European) industrialization through tariff policies; state support was about “managing the effects” rather than “accelerating its pace.” In later years, states more actively developed “a more organized strategy of industrial policy and planning” (Chibber, 2006). Such strategies required more well-functioning bureaucracies to succeed than the policies pursued in earlier phases of industrialization. Furthermore, the size of the public sector in the economy has grown substantially in many countries, particularly after World War II (WWII). Hence, the Weberian bureaucracy-growth relationship may have increased in strength across modern history.
A related argument has been made about differences between countries during early industrialization in Europe. Gerschenkron (1965) proposed that 19th-century state institutions were vital for promoting industrialization in relatively more “backward” countries, serving as substitutes for other (absent) prerequisites for development. The countries that were backward because they lacked the other prerequisites, but nevertheless experienced increased growth, did so because they engaged in state intervention in key economic areas.
Some arguments above suggest important nuances on the expected relationship. Other considerations indicate that there may not be a strong net effect at all. For instance, growth—and especially long-term growth—may mostly result from total factor productivity change, induced by technological change, rather than physical capital accumulation (e.g., Helpman, 2004). If growth is not as clearly influenced by physical capital investments as several scholars who propose a relationship between bureaucracy and growth seem to presume, a key link in the causal chains laid out above is weakened or perhaps even obliterated.
Second, one key expectation linking Weberian bureaucracies to growth, as discussed, is the enhanced (de facto) protection of property rights, which, in turn, enhances investment. However, Greif (2006) and others have highlighted how other third-party enforcers than the state may serve similar functions, thus questioning the first link in the chain from Weberian bureaucracy via property rights to growth. Alternatively, various networks and other social arrangements may substitute for rule-of-law-based systems of property rights for safe-guarding investments, thus questioning the second link.
Third, we remind that a Weberian bureaucracy is about organization and not about which policies are pursued. By being coherent and streamlined organizations with rule-following and competent staffers, Weberian bureaucracies can, in principle, implement any policy impartially and effectively. Indeed, if politicians, for some reason, decide to pursue monetary, fiscal, or industrial policies that mitigate growth, having a Weberian bureaucracy may exacerbate the negative effect of the policy, due to its effective implementation. 1 This possibility extends beyond theory. Historical examples of countries pursuing growth-retarding policies abound, either because politicians have legislated from misguided beliefs about what causes development, or because incumbents have had strong incentives to pursue particular economic policies despite knowing that they retard development (see, for example, Acemoglu & Robinson, 2012; Bueno de Mesquita et al., 2003).
Finally, early work on bureaucracy and development focused on how bureaucracies, more generally, and in particular a sizable public sector, mitigate investments and efficiency—and thus growth—through different channels. These include incentives to promote red tape and excessive regulation, either by bureaucrats themselves or by politicians trying to control bureaucrats (e.g., J. Q. Wilson, 1989), opportunistic bureaucrats pursuing personal goals (e.g., maximizing size of their unit; Niskanen, 1971) that are incompatible with growth, and, more generally, information and delegation problems that create sub-optimal policies (e.g., Bendor et al., 2001; Gailmard & Patty, 2012).
To summarize, while Weberian bureaucracy may ensure the effective implementation of various economic policies, “[s]tates with high capacity can pursue destructive economic policies” (Johnson & Koyama, 2017, p. 11). Arguably, the combination of a policy’s design and its effective implementation is what determines whether the policy enhances growth; a Weberian bureaucracy is only likely to ensure the latter condition. Thus, we need to confront the data before concluding that Weberianness enhances economic growth.
Previous Large-N Studies
Evans and Rauch (1999) is, to our knowledge, the only previous study that directly tests the impact of Weberian bureaucracy on economic growth. 2 The study is also the first attempt to collect quantitative data on different features of the public administration using expert survey data to gauge the level of “Weberianness.” Employing cross-country ordinary least squares (OLS) regressions, they find a positive relationship between degree of “Weberianness” and growth, and the estimated “effect” is substantial. Despite the innovative data collection, however, there are several methodological shortcomings of their study. It includes only 35 (mostly semi-industrialized) countries and draws on cross-sectional comparisons, which precludes any analysis over time and the control for country-specific factors that may influence both growth and the bureaucracy. Yet, given the prominent role that this study has played and continues to play in the literature—as of December 9, 2019, it has 1580 Google Scholar cites—we will start our empirical analysis by replicating its results.
There are also sizable, related studies on how bureaucratic quality, governance, or “institutions,” more generally, affect growth (see, for example, Holmberg et al., 2009). Notably, Bockstette et al. (2002) construct a “state antiquity index” measuring historical existence of a state above tribal level, internal rule, and share of territory controlled by one regime. The measurement is done in 50-year increments, from Year 0 to 1950, and then aggregated up, discounting past experiences. This measure presumably correlates with current state capacity for different reasons, notably because state institutions take time to build. Running cross-country regressions, Bockstette et al. (2002) find that the index correlates positively with income in 1995 and growth from 1960 to 1995, suggesting a positive link between state capacity and current development. Subsequent work has used expanded versions of this measure. Putterman and Weil (2010) find a clearer relationship by measuring historical state presence at the location where current residents originate from (e.g., England for most Australians). Borcan et al. (2018) suggest a more complex, non-linear pattern; countries with very short state histories have slow growth, and very long state histories hinder development due to over-centralization and development of non-inclusive institutions.
The more general macro-literature on institutions and growth has advanced methodologically in recent years, from being based on cross-sectional data to employing time-series and instrumental variables to address unobservable confounders and reverse causality. However, cross-country tests on the economic effects of bureaucratic quality, more specifically, have been restricted by shorter time intervals, given the lack of long time series on measures directly capturing features of the bureaucracy. 3 For example, International Country Risk Guide’s Bureaucratic Quality measure starts in the early 1980s, and the much-used measures of corruption from Transparency International and World Bank Governance Indicators have even shorter time series.
Methodological issues notwithstanding, reported results are mixed. Many studies find a positive relationship between bureaucratic quality (Alesina, 1998; Nawaz, 2015; Olson et al., 2000), or specific aspects of bureaucratic quality such as corruption (Alesina, 1998; Mauro, 1995), and growth. Other studies yield more sobering conclusions. Huyn and Jacho-Chávez (2009) employ data from 1996 to 2005 and find that only some World Bank Governance Indicators (voice and accountability, political stability, and rule of law) relate positively to growth, whereas other indicators related to the bureaucracy (regulatory control, control of corruption, and government effectiveness) do not. Yet other studies underscore that any correlation may stem from the “reverse relationship” (Chong & Calderón, 2000; Goldsmith, 2007; R. Wilson, 2016; see also Kurtz & Schrank, 2007) or that the relationship is only strong in certain contexts (e.g., Hanson, 2015). In sum, the evidence base from extant large-N studies for a substantial effect of features of the bureaucracy on growth is rather thin.
A final cautionary note on overtly trusting results from previous studies on bureaucracy and growth relates to measurement error in the dependent variable (Fariss et al., 2017; Jerven, 2013; Martinez, 2018; Wallace, 2016). Assembling reliable statistics on national economic output over time is a complicated administrative task, and the reporting could be subject to strategic manipulation by political elites. A particular cause for concern is a possible relationship between Weberian bureaucracy and measurement errors in GDP. Let us assume, for example, that less Weberian bureaucracies are particularly vulnerable to elite manipulation and tend to over-report growth. If so, our independent variable is correlated with the error term, causing a downward bias in estimates of Weberian bureaucracy on growth. Alternatively, highly competent bureaucracies may be better at artificially inflating GDP figures so that manipulation is not easily detectable by data-collecting and processing organizations such as the World Bank and International Monetary Fund (IMF). This is consistent with recent speculation on bias in Chinese GDP figures (Wallace, 2016). If so, standard regressions may over-estimate the relationship between Weberian bureaucracy and growth. We return to these issues below.
Data and Benchmark Model
As Weberian bureaucracy is a multifaceted concept, we employ multiple measures, pertaining to different dimensions of the concept, from the Varieties of Democracy (V-Dem) dataset (Coppedge et al., 2018a).
Since V-Dem (as do Evans & Rauch, 1999) relies on expert surveys, data quality is a function of the quality of its experts. As detailed in their reference material, V-Dem applies high standards for recruiting their experts (see Coppedge et al., 2018b). They rely on multiple experts (at least five) per country-year and indicator; they draw primarily on domestic experts coming from or residing in the countries they code; they vet their prospective lists of experts substantially by standards of seriousness of purpose and impartiality; and, importantly, expertise in the particular field they are asked about is a key selection criterion. “This expertise,” according to V-Dem’s methodology document (Coppedge et al., 2018b, p. 20), “is usually signified by an advanced degree in the social sciences, law, or history; a record of publications; or positions in outside political society that establish their expertise in the chosen area.” Finally, V-Dem’s questionnaire consists of several sections, or “surveys,” including surveys on on elections, the executive or civil liberties. Experts are only assigned to provide answers for their particular field of expertise.
To address differential item functioning (different experts having different thresholds between response categories) and varying expert reliability, V-Dem transforms the raw ordinal expert ratings by a Bayesian item response theory (IRT) measurement model designed to improve cross-country and inter-temporal comparability (Marquardt & Pemstein, 2018; Pemstein et al., 2018). The end result is interval-level scores on the standard normal scale (with associated measures of uncertainty). Systematic assessments of the validity and reliability of V-Dem data also come to overall positive conclusions (e.g., Marquardt et al., 2019). For example, when meaningful comparisons can be made, the data correlate well with data from other sources. Furthermore, disagreement among experts is not egregious and correlates meaningfully with the complexity of the coding task. Although the assessments do not concern the exact indicators that we employ, several of these favorable validity and reliability assessments concern indicators of corruption (McMann et al., 2016), which, we surmise, should be even more difficult for experts to capture than the features of the bureaucracy that we attempt to measure. Nevertheless, we discuss and assess validity issues for our particular indicators below.
The partial exception to the recruitment rules and criteria concerns the historical (roughly pre-1900) part of the V-Dem time series. Given the relative paucity of historical experts—there are only a few true historical experts on, for example, 19th-century political history in Bavaria or Madagascar—these data mostly rely on one or two experts per country. These historical experts—who are often political historians—are also recruited based on documented expertise and seriousness of purpose, and questions pertaining to bureaucracies figured prominently in the historical data collection and recruitment decisions (Knutsen et al., 2019). Yet, one cannot exclude the possibility that some areas covered by the extensive survey are less well-charted territory for some particular experts. Combined with the relative lack of sources, especially for smaller countries, that will inevitably affect any historical data collection, this means that scores for the early years may be less reliable, even when relying on the expertise of historians. This, in turn, could contribute to attenuation bias; we return to this issue when discussing our results split by time periods below.
Our first indicator, which provides the most extensive time-series and country coverage, measures the extent to which countries have rigorous and impartial public administrations (v2clrspct, henceforth impartial bureaucracy). The question focuses on “the extent to which public officials generally abide by the law and treat like cases alike, or conversely, the extent to which public administration is characterized by arbitrariness and biases (i.e., nepotism, cronyism, or discrimination)” (Coppedge et al., 2018a, p. 157). The question wording relates to the de facto practice of public officials, not just de jure regulations. This is important because de jure changes are not necessarily followed by de facto changes in the bureaucracy (Schuster, 2017). This measure captures two key characteristics of Weberian bureaucracy—decisions abiding by clearly specified rules and decisions being implemented in an impersonal manner.
In Figure 1, we plot the relationship between impartial bureaucracy, averaged across 1970–1990, and the single score employed by Evans and Rauch (1999), assuming that the latter also applies to 1970–1990. For the 35 countries where the two measures can be compared, they are decently correlated (r = .60). Yet there are notable outliers, both countries ranking substantially higher on Evans and Rauch’s measure than V-Dem’s (e.g., Philippines, Democratic Republic of the Congo, Pakistan, and Haiti) and vice versa (Portugal, Israel, Costa Rica, Spain, and Hong Kong).
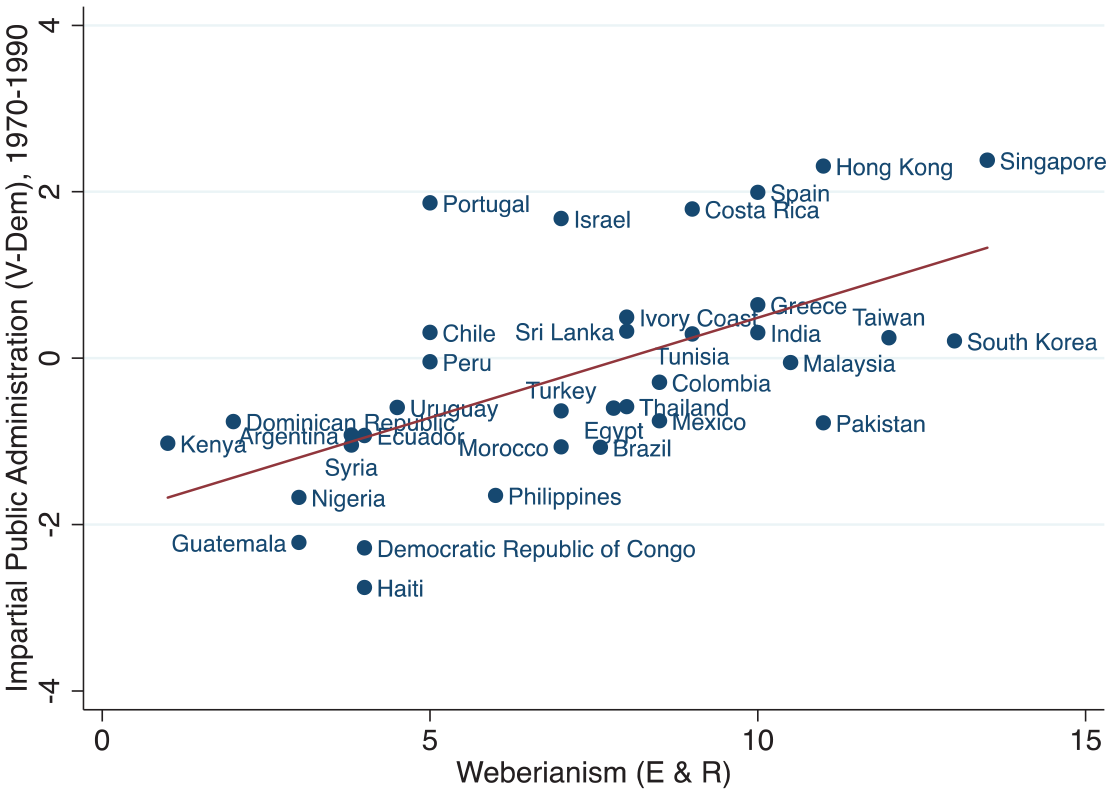
Evans and Rauch’s Weberianism and V-Dem’s impartial bureaucracy.
Our second measure taps directly into another aspect of Weberian bureaucracy, namely, meritocratic recruitment and promotion (v2stcritrecadm, henceforth meritocratic recruitment). The question asked to experts is as follows: “[t]o what extent are appointment decisions in the state administration based on personal and political connections, as opposed to skills and merit?” The clarification highlights that “[a]ppointment decisions include hiring, firing and promotion in the state administration. Note that the question again refers to the typical de facto (rather than de jure) situation obtaining in the state administration” (Coppedge et al., 2018a, p. 171).
This indicator is covered by the Historical V-Dem data collection (Knutsen et al., 2019), and thus extends back to 1789, but is only included in a random sample of 67 polities for the contemporary era (~post-1920) in V-Dem v.8. 4
Figure 2 shows the time series of impartial bureaucracy and meritocratic recruitment for two countries included in our benchmark panel regressions in Table 2, namely, the United Kingdom and Uruguay. These time series (Figure 2) not only illustrate some more general points but also serve to validate and illustrate the data with well-documented countries that we know and which have diverged on patterns of bureaucratic development.
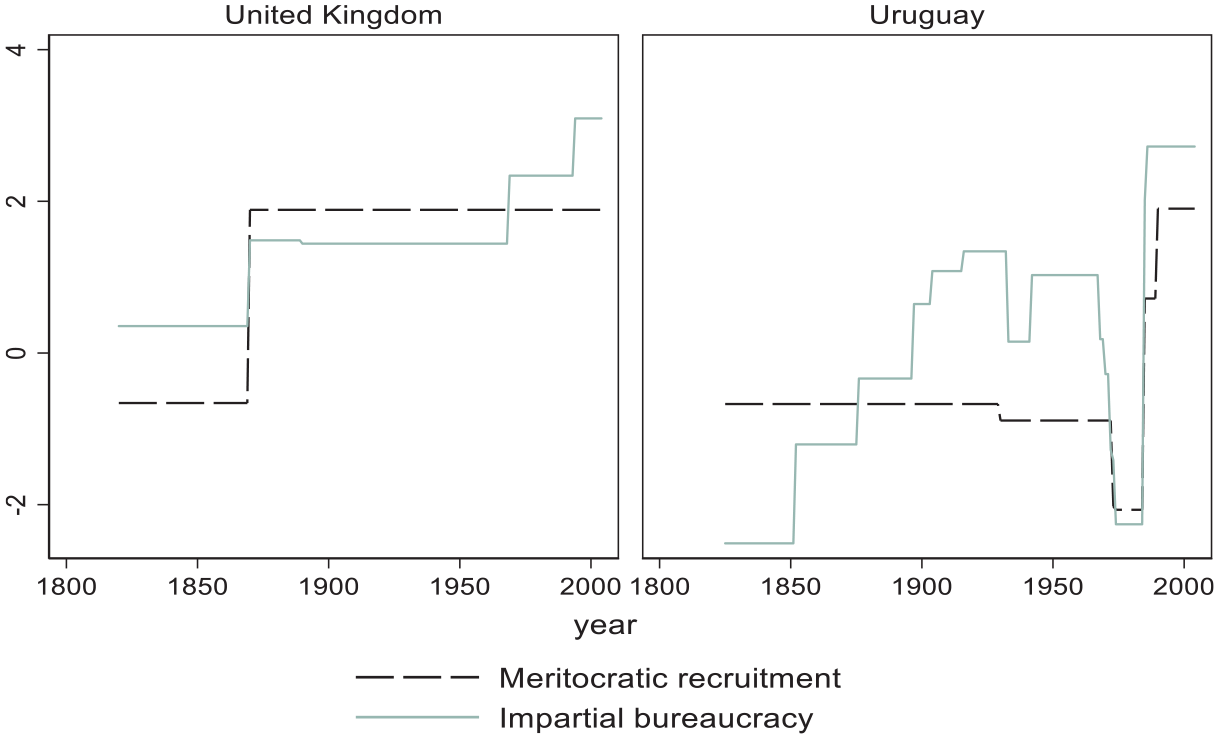
Two indicators of Weberian bureaucracy in the United Kingdom and Uruguay.
First, the major time-series shifts, for both cases, align with the “conventional wisdom” on when these bureaucracies were reformed or changed most rapidly. In the United Kingdom, the largest increase, for both measures, corresponds with the most significant change in the British public administration; in 1870, an Order in Council abolished patronage in the civil service by making competitive open examination mandatory for appointments (with some exceptions; see for example, Fry, 1969, pp. 34–69; MacDonagh, 1977, pp. 197–213; Silberman, 1993, pp. 350–397). Importantly, this reform was not only a declaration of intent on paper but resulted in changes also in practice. Data from the Civil Service Commission’s yearly reports show that the number of public offices that had open and competitive examinations increased substantially (Cornell & Svensson, 2019).
Second, countries often undergo periods of both “state building” and “state erosion” according to our two measures. While this is not captured by the United Kingdom’s (comparatively smooth) historical trajectory, it is well illustrated by Uruguay’s time series, which also fit well with historical accounts of bureaucratic development. The first upward shift in impartial bureaucracy concurs with the peace agreement after the “Guerra grande” in 1852 (López-Alves, 2000, pp. 81–84). Furthermore, the upward trend in 1876 coincides with the ascent of a military regime that modernized the state and strengthened property rights (Finch, 1981, p. 6; López-Alves, 2000, pp. 91–93), and the upward trend in 1897 coincides with the end of a rebellion, resulting in a power-sharing agreement between the Blancos and Colorados. The upward trend in 1904 marks the end of the last civil war, which implied further consolidation of the state, as territorial monopoly strengthened when the rebellion was defeated (e.g., López-Alves, 2000, pp. 71, 87). The year 1916 coincides with elections to a constitutional assembly, held in accordance with a new electoral law that guaranteed secret suffrage and universal male suffrage (Caetano & Rilla, 2005, pp. 159–160). According to Filgueira et al. (2003), the increasing influence of the opposition after the reforms of the political system in the beginning of the 20th century worked as a check against patrimonial practices.
As noted, our measure of impartial bureaucracy also displays dips in Uruguay, first in 1933 when democracy broke down after an autogolpe (there is then an upward shift that coincides with the “golpe bueno” in 1942; Caetano & Rilla, 2005, pp. 232–233). The next big dips in impartial bureaucracy come when state of emergency was declared in 1968 (Weinstein, 1975, pp. 117–118) and with the further curtailment of impartiality that occurred after the military coup in 1973. The measure also captures the increase in impartiality that came with the transition to democracy in 1985, implying, for example, the re-installment of 11,000 public officials who were dismissed during the military regime (Filgueira et al., 2002).
Third, Figure 2 illustrates that the different indicators, capturing different features of the bureaucracy, are far from perfectly collinear (they correlate at .59), sometimes displaying very different trends. In the United Kingdom, this is illustrated by further reforms of the functioning of the civil service in the late 1960s. These reforms followed in the wake of the Fulton report on civil service reform in 1968 (Fry, 1993), which did not change the pattern of meritocratic recruitment fundamentally. Similarly, the Uruguayan bureaucracy during the late 19th and early 20th centuries seems to have developed more impartial practices, despite the recruitment methods not changing much. The main parties did cooperate in enhancing politicization of the bureaucracy, which then possibly also had consequences for recruitment patterns (Filgueira et al., 2003). Notably, the famous pact in 1931 regulated, among other things, how the two main parties would share the right to appoint public employees (Caetano & Rilla, 2005, pp. 212–215; Weinstein, 1975, p. 69; V-Dem’s “meritocratic recruitment” registers an adverse change on December 31, 1930). The biggest upward shift in the indicator for meritocratic recruitment coincides with the democratization in 1985 and the related attempt to reform the system of civil service appointments (Filgueira et al., 2002, p. 12). In 1990, there were new reform attempts with a new law that foremost sought to decrease the number of positions but also to make recruitment more meritocratic (Guinovart, 2002). This law had a real impact in diminishing the number of public officials (Filgueira et al., 2003). There were reform attempts, also in the mid-1990s, for example as stipulated in the budget law of 1996, but these were largely unsuccessful in removing political criteria as an important feature of recruitment to the bureaucracy (Panizza, 2004). Thus, the Uruguayan case may illustrate that the indicator captures de facto and not only de jure changes.
We also assessed the V-Dem measures’ validity through convergent validation. One measure that is widely used for capturing concepts related to “Weberian bureaucracy,” such as “state capacity,” is Government Effectiveness from the World Bank Governance Indicators (Kaufmann et al., 2010). Our V-Dem measures correlate highly with Government Effectiveness; across 3,048 country-year observations from 1996 to 2016, the bivariate correlation with impartial administration is .83. The correlation with meritocratic recruitment is somewhat lower, at .74. Yet, it is unclear exactly what aspect of Weberian bureaucracy Government Effectiveness is capturing, as it is constructed from factor analysis on numerous variables.
Hence, for a more focused validation, we compare the V-Dem measures with measures from an expert survey conducted by the QoG Institute. The data are only measured in 2014, but, importantly, tap directly into relevant Weberian dimensions. Moreover, this is a specialized survey that recruits experts of public administration (Dahlström et al., 2015). Specifically, the QoG survey includes a question on impartial bureaucracy that should capture a similar concept as V-Dem’s impartial administration indicator from V-Dem (see Supplemental Appendix A). Indeed, these indicators are highly correlated (.77, V-Dem v.9; see Supplemental Appendix Table A-1).
The QoG survey also contains three indicators that closely tap into meritocratic recruitment. The first one refers directly to meritocratic recruitment, and the second and third ask whether recruitment based on political and personal connections, respectively, is common in a country’s bureaucracy (see Supplemental Appendix A). These indicators are all highly correlated (.74–.77, V-Dem v.9) with V-Dem’s Meritocratic recruitment (Supplemental Appendix Table A-1). Figure 3 presents scatterplots for, respectively, the indicators explicitly asking about impartiality in the administration and the indicators explicitly asking for meritocratic recruitment.
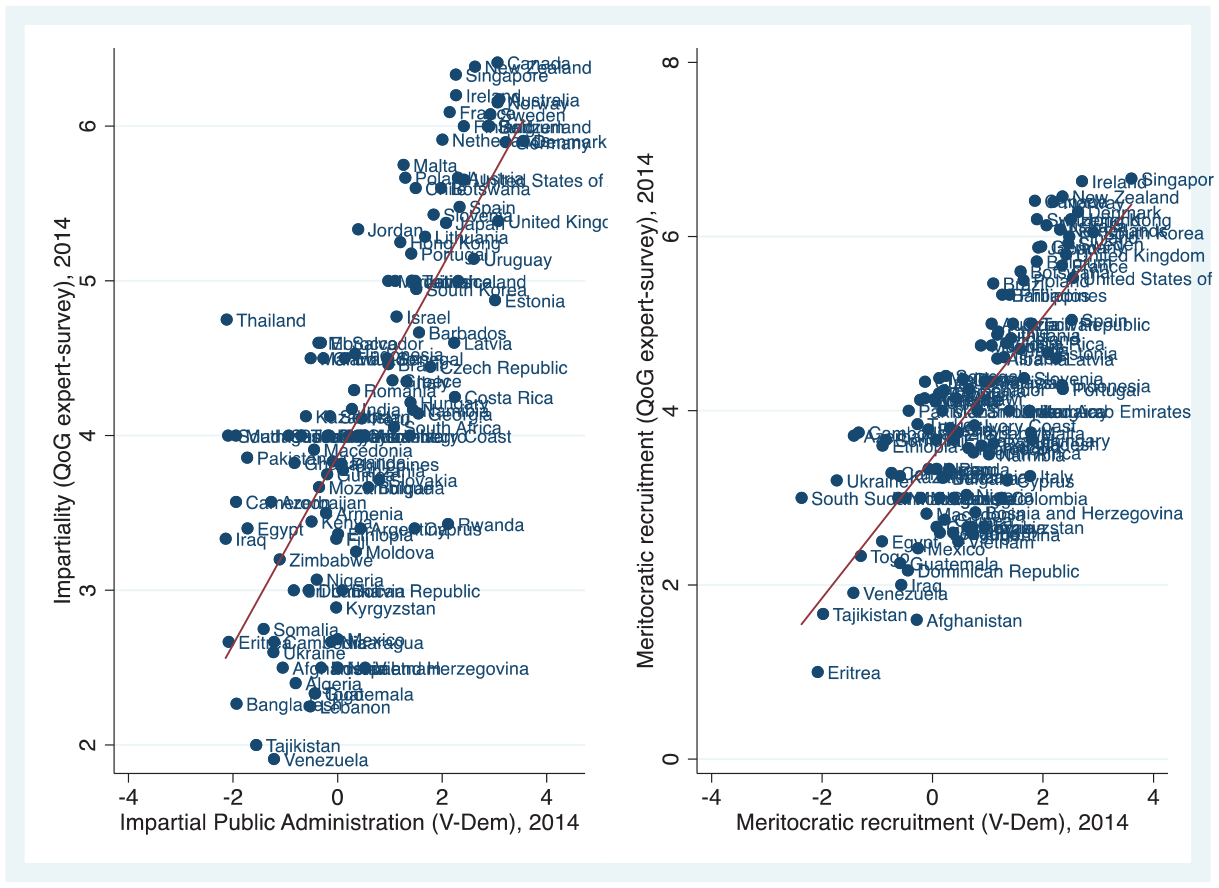
V-Dem and QoG expert survey indicators on impartiality (left) and meritocratic recruitment (right).
We also use two alternative measures from V-Dem, covering 1789–1920, for additional tests. These alternative measures capture distinct aspects of Weberian bureaucracy, allowing us to investigate in a more fine-grained manner which (if any) aspects of the bureaucracy are relevant for growth. One measure (v3struinvadm, henceforth autonomous bureaucracy) concerns rulers’ involvement in the state administration (Coppedge et al., 2018a, p. 217). The involvement of leading politicians in day-to-day administrative decisions signals that decisions are based on personal, politicized judgments rather than clearly codified rules—thus capturing similar aspects as the impartial bureaucracy indicator. Yet it also captures other key Weberian elements related to clearly specified areas of responsibility and a hierarchical organization with some autonomy. The second (v2strenadm, henceforth salaried bureaucracy) taps into the system of bureaucratic remuneration (Coppedge et al., 2018a, p. 171). As stressed by Weber (1978), this was not an evident feature of most state administrations in the 18th or early 19th century, when most officials instead “enjoyed the fruits of office, that is, to appropriate fees and perquisites flowing through it” (Mann, 1993, p. 446). During the 19th century, however, most European states started remunerating their state administrators by regular salaries.
For our benchmark specifications, we use GDP p.c. growth as dependent variable. We use the long time-series data from Miller (2015), extending back to the early 19th century. These (Purchasing Power Parity-adjusted, real) GDP data are based on data collected by the Maddison project and Gleditsch (2002). One concern is the particular endogeneity issue raised above, related to risks of systematic reporting bias in GDP, contingent on features of the bureaucracy. One way to assess this concern is to assume that satellite imagery of nighttime lights provides unbiased (though noisy) measures of economic output (Min, 2015). If true, the expectation that lower quality bureaucracies over-report their GDP figures should produce a negative correlation between bureaucratic quality and GDP, once controlling for lights.
As shown in Figure 4, however, this is not the case. Instead, when controlling for share of population living in unlit areas (in 2003), it seems that lower performing bureaucracies under-report GDP compared with higher performing ones. As GDP levels should not be equated with short-term growth, this is not foolproof evidence against the endogeneity bias sketched out above. The test does lend some prima facie evidence, however, to the effect that, if anything, our tests below risk over-estimating the effect of bureaucracy on growth.
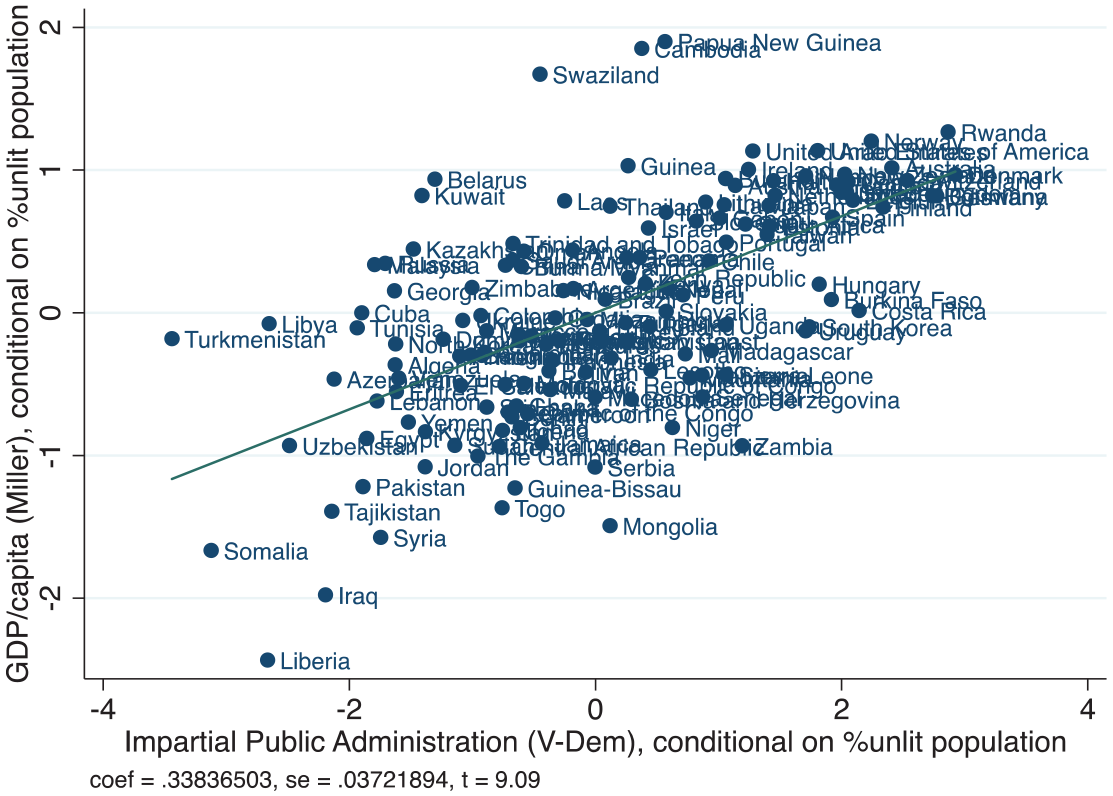
Partial regression plot, controlling for percent unlit population according to Min (2015).
Given the issue of potential reporting bias, we also test the imputed GDP time series of Fariss et al. (2017). These imputed data carry benefits of reduced measurement errors of various types, relative to extant GDP data, by being produced from a dynamic latent trait model on various data sources. The imputation of missing values—both for several countries and the early decades following 1789—should also mitigate sample-selection biases (Honaker & King, 2010), for example, if low-growth countries with non-Weberian bureaucracies more often miss GDP data.
Our benchmark is an OLS model including one of the above-described bureaucracy measures. We mainly use GDP p.c. growth as dependent variable but also estimate models using forward-lagged Ln GDP p.c. levels (note that this is equivalent to estimating GDP p.c. growth across the time period if we control for initial Ln GDP p.c.). The benchmark employs robust standard errors clustered by country to account for country-level serial correlation. We typically use year as time unit but also test versions with longer panel units (e.g., 5 years). We mainly lag independent variables five years behind the dependent variable to capture short- to medium-term effects but we also experiment with different lag-lengths.
We control for initial Ln GDP p.c., to account for income-convergence dynamics (Barro & Sala-i-Martin, 2004) and the possibility that economic development affects the makeup of the bureaucracy. We include time-fixed effects to account for global trends in the institutional makeup of administrations and global trends (e.g., due to technological change patterns) and shocks (e.g., global recessions) in GDP p.c. growth. We also include country-fixed effects to control for stable country-level features, including various cultural and geographic factors, which may simultaneously affect bureaucracies and growth.
We experiment with alternative controls in our robustness tests, adding, for example, democracy and natural resource dependence. Yet, we keep our benchmark parsimonious. We do so, first, to mitigate post-treatment bias—as discussed, a Weberian bureaucracy may affect growth via, for instance, strengthening property rights protection, and controlling for property rights would thus conceal a relevant indirect effect. Likewise, state building might influence subsequent attempts at democratization and democratic survival (e.g., Fukuyama, 2014), and we thus exclude democracy from the benchmark. Second, several potentially relevant controls, used only for robustness tests, have limited time-series coverage; including such measures therefore reduces our sample.
Empirical Analysis
We start out by replicating Evans and Rauch (1999), the only study that focuses on the specific relationship between Weberian bureaucracy and growth.
Replicating Evans and Rauch
Evans and Rauch (1999) collected data between 1993 and 1996 on their Weberian bureaucracy measure for 30 “semi-industrialized” and 5 “poorer” countries (pp. 753–754). The authors propose that these data capture Weberian bureaucracy in the decades prior to the data collection, given the presumed persistency of bureaucratic features and inclusion of retrospective questions in their expert surveys. Hence, although they measure their dependent variable, growth, from 1970 to 1990, before their core independent variable was measured, they argue that “it was clear from [the experts’] comments that the bureaucratic structures they described antedated 1970–1990 economic growth” (p. 755). The controls—level of GDP p.c. and average years of schooling—are measured in 1965.
When employing income data from Miller (2015) and schooling data from Barro and Lee (2013) in Table 1, we replicate the strong positive correlation between Evans and Rauch’s Weberian bureaucracy measured in the mid-1990s and (annualized) growth rate from 1970 to 1990, based on data from 32 countries (three countries miss data on covariates). According to Model 1, a cross-country OLS specification, going from the empirical minimum (1; Kenya) to maximum (13.5; Singapore), is associated with 5.5 percentage points higher GDP p.c. growth. Not only is Weberian bureaucracy highly significant, the estimated “effect” is enormous.
Replicating Evans and Rauch: Cross-Country Regressions with (Average Annual) GDP p.c. Growth, 1970–1990, as Dependent Variable.
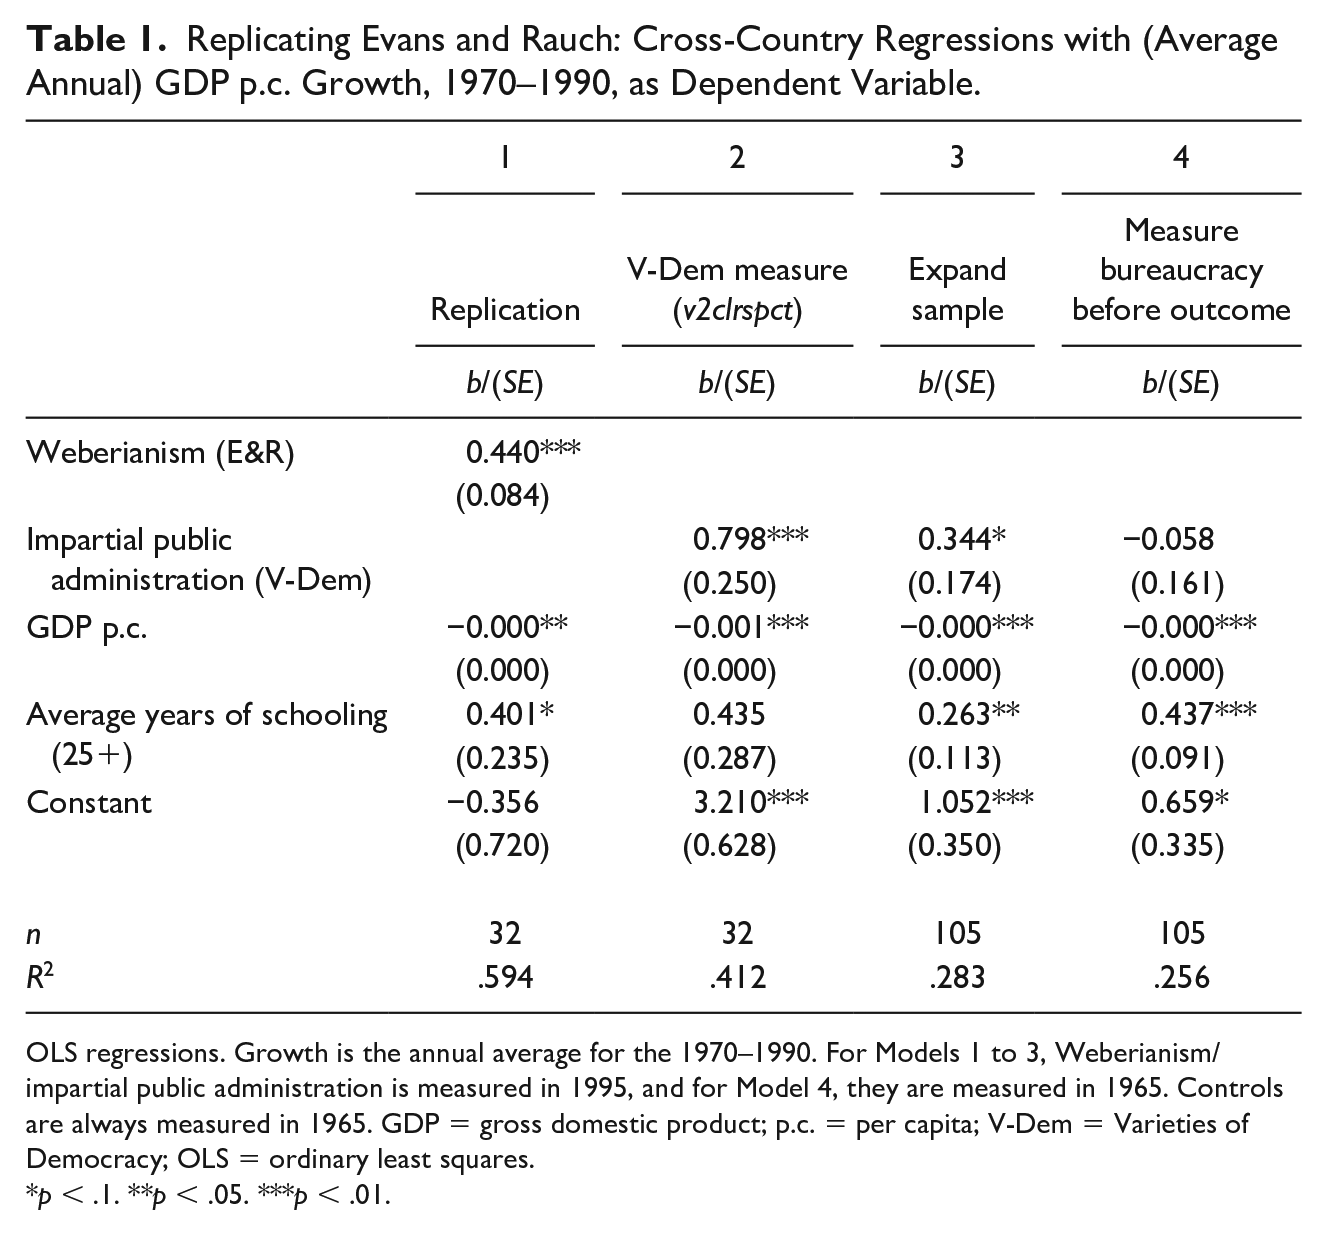
OLS regressions. Growth is the annual average for the 1970–1990. For Models 1 to 3, Weberianism/impartial public administration is measured in 1995, and for Model 4, they are measured in 1965. Controls are always measured in 1965. GDP = gross domestic product; p.c. = per capita; V-Dem = Varieties of Democracy; OLS = ordinary least squares.
p < .1. **p < .05. ***p < .01.
Model 2 replaces the Evans and Rauch measure with V-Dem’s impartial bureaucracy. The correlation between the two measures is .49 (35 countries) when impartial bureaucracy is measured in 1995, around when Evans and Rauch constructed their measure. This modestly high, positive correlation arguably reflects that the two measures capture slightly different features of the bureaucracy. 5 Nonetheless, Model 2 shows a positive and statistically significant (t = 3.2) correlation between growth rate from 1970 to 1990 and impartial bureaucracy in 1995. Going from the minimum to the maximum value among the 32 included countries—from Democratic Republic of the Congo (–2.65) to Costa Rica (3.02)—increases predicted growth rate by 4.5 percentage points, close to the predicted relationship from Model 1.
Yet, Models 1 and 2 are based on 32 countries, and various sample-selection biases may influence the correlation pattern. Evans and Rauch consciously selected 30 (out of 35) countries that were “semi-industrialized,” examples being Singapore, South Korea, and Taiwan. This selection criterion is presumably correlated with growth in the 20-year period they are investigating. Model 3 expands the sample to all 105 countries with available data on impartial bureaucracy (in 1995), growth (average for 1970–1990), and controls (in 1965). The coefficient drops to 43% of its original value, and the relationship is now only significant at the 10% level.
Model 4 adds a final, and important, correction. Keeping the “full sample” of 105 countries, it changes the year of measurement of impartial bureaucracy from 1995 to 1965, the same year as the controls. Although Evans and Rauch ascertained that their measure should not be affected by reverse causality, we question that assumption and conduct a stricter test. Measuring the independent variable before the outcome turns out to have a very strong influence on the estimated relationship. The coefficient for impartial administration turns insignificant at all conventional levels and even flips sign.
This finding is not driven by us choosing a particular bureaucracy measure. Also when we run the same tests with the V-Dem measure of meritocratic recruitment, an initially significant relationship is rendered statistically insignificant once measuring the independent before the dependent variable (see Supplemental Appendix D).
The results in Table 1 thus have important implications for our interpretations of the most widely cited piece of evidence—the cross-country regressions reported in Evans and Rauch (1999)—for a positive relationship between “Weberian bureaucracy” and growth. First, the strong, positive relationship seems partly attributable to sample-selection biases. Second, the result is also driven by the independent variable being measured after or simultaneously to the outcome. Our findings, altering the lag structure, suggest that the correlation may be partly attributable to economic development affecting Weberian bureaucracy, that is, the reverse relationship.
Yet, Table 1 should not be the final word on whether or not there exists a relationship between Weberian characteristics and growth. First, data are from one particular year/time period, thereby disregarding the extensive time-series information available. Second, alternative bureaucratic features could influence growth differently, which we can investigate with alternative Weberian indicators. Third, some additional issues with the Evans and Rauch’s specification need to be corrected. We thus turn to panel regressions using the benchmark discussed above.
Benchmark Panel Regressions
Our benchmark differs from the specification in Table 1 in important respects. First, we exclude years of schooling, as human capital is a well-known immediate determinant of growth (Mankiw et al., 1992) and education outcomes are likely post-treatment to features of the bureaucracy. Second, we follow standard convention and transform GDP p.c., a highly skewed variable, by the natural logarithm. Third, we include country- and year-fixed effects. The cross-section regressions did not account for stable, unobservable differences in national political cultures or geographic location that may influence both the bureaucracy and growth.
Even this specification is associated with some drawbacks; no single specification is optimal in all regards. While the country-year setup allows us to aggregate across much relevant information and capture even short-term effects, the short time period might exacerbate autocorrelation problems (despite us clustering errors by country) and open up for more random measurement error in the dependent variable. Our solution is to run several alternative specifications to assess sensitivity. For example, we aggregate across 5- and 10-year panel units, and test System Generalized Method of Moments (GMM) specifications (Blundell & Bond, 1998), which are attuned to capture relationships involving slow-moving variables such as bureaucratic features (see Supplemental Appendix F). We also run tests with different controls and data sources for GDP.
Nonetheless, Table 2 presents OLS regressions on our benchmark. Due to missing GDP data, the maximum time series is reduced to 180 years. Country-year is unit of analysis, covariates are measured from 1820 to 1999, and the outcome, GDP p.c. growth, is measured 5 years after the covariates. Errors are clustered by country to mitigate concerns of panel-specific autocorrelation.
Cross-Section Time-Series Regressions with GDP p.c. Growth Measured in t + 5 as Dependent Variable (All Independent Variables Measured in t).
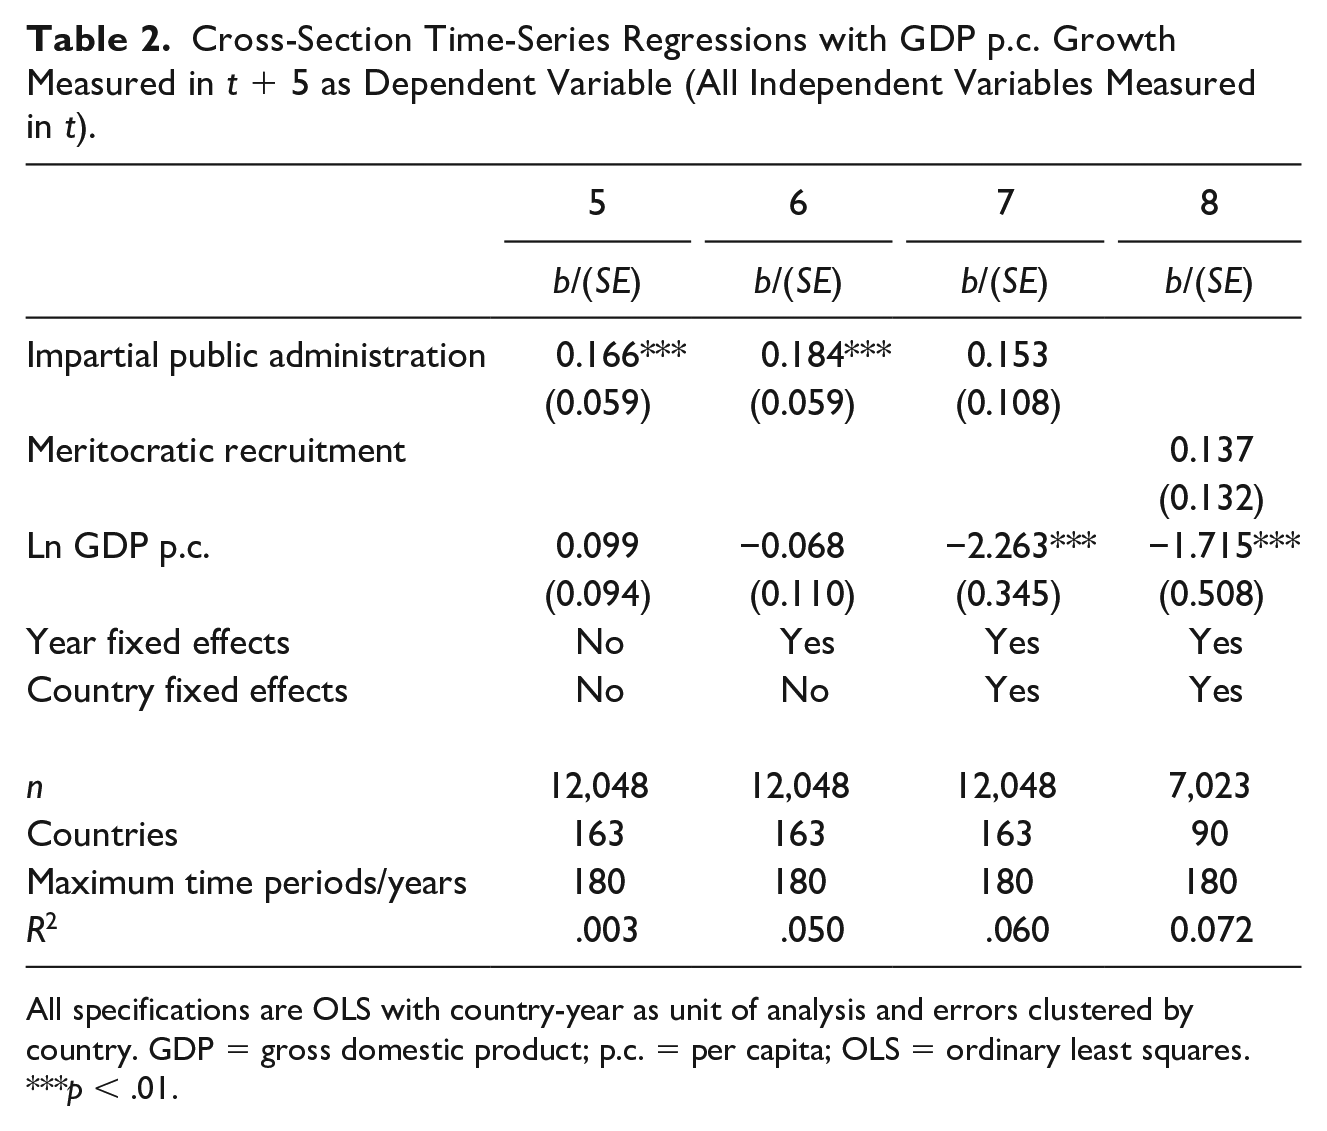
All specifications are OLS with country-year as unit of analysis and errors clustered by country. GDP = gross domestic product; p.c. = per capita; OLS = ordinary least squares.
p < .01.
Model 5, Table 2, presents a specification that omits both the country- and year-fixed effects, only controlling for initial income level. In this specification, which draws on 12,048 country-year observations, the impartial bureaucracy indicator is statistically significant at 5%. 6 Yet, the coefficient is less than half of that in Model 3, Table 1, and one fifth of that in Model 2, Table 1. To use the same illustration as above, going from the value of Democratic Republic of the Congo-1995 (–2.65) to Costa Rica-1995 (3.02) is, by Model 5, predicted to increase growth 5 years later by 0.9 percentage points, which is much smaller than in the cross-section regressions. The point estimate increases, but only slightly, when adding year-dummies in Model 6.
Model 7 includes both year- and country-dummies, and adding the latter weakens the result. The point estimate drops by 17% from Model 6 to Model 7, and impartial bureaucracy turns insignificant (t = 1.4). Hence, when we account for the possibility that time-invariant characteristics of countries influence both the public administration and growth, there is no longer a clear relationship.
Model 8 replicates Model 7, but uses V-Dem’s meritocratic recruitment, a feature of Weberian Bureaucracy that is widely hypothesized to enhance growth (e.g., Evans & Rauch, 1999). To repeat, the measure has extensive coverage before 1920 but is coded for only a random sample of 67 countries for recent decades in V-Dem v.8. Nonetheless, the result in Model 8, covering 7,023 country-years, resembles that of Model 7; we find no clear relationship between meritocratic recruitment and growth. The point estimate suggests that going from lowest (–2.67) to highest (3.35) score on meritocratic recruitment in the sample increases growth 5 years later by 0.8 percentage points, but the t-value is only 1.0.
Supplemental Appendix D reports tests using measures of the two alternative aspects of Weberian bureaucracy, salaried bureaucracy and bureaucratic autonomy, covering 1789–1920. No specification yields a positive relationship that is significant at conventional levels.
Finally, we tested variously composed indices of Weberian bureaucracy, drawing on the four indicators pertaining to impartiality, meritocratic recruitment, bureaucratic autonomy, and salaried bureaucrats. Measurement error or substantive interactions between the different features of Weberian bureaucracy might make the regressions reported so far fail to pick up the true relationship. For instance, recruiting the best qualified people may only ensure growth-enhancing policies if the administration works impartially and day-to-day decision-making is left to these competent officials without political leaders interfering. Thus, we created a multiplicative Weberian bureaucracy index to capture the described logic of complementarities (Goertz, 2006). We also created an additive index (to capture potential partial substitutability) and an index based on the first component from a principal components analysis (treating Weberian bureaucracy as a latent concept for the four indicators). None of these indices bear any statistically significant relationship with growth, even at 10% (Supplemental Appendix D).
Robustness Tests
We conducted several robustness tests of the benchmark (Model 7, Table 2), focusing on the impartial bureaucracy measure. First, we assessed sensitivity to including other plausible controls. We added, respectively, V-Dem’s Polyarchy measure of electoral democracy, mineral and fuel income as share of total income (“resource dependence,” Miller, 2015), and the log of population (Miller, 2015), and tested a model including all controls simultaneously.
Second, we substituted the GDP (and population) data from Miller (2015) with the imputed data from Fariss et al. (2017). This change extends our sample back to 1789 and increases the number of countries from 163 to 186 (country-year observations from 12,048 to 19,063). Figure 5 provides a coefficient plot for impartial administration across the five different control variable specifications, estimated both when using Miller and Fariss et al. data. 7
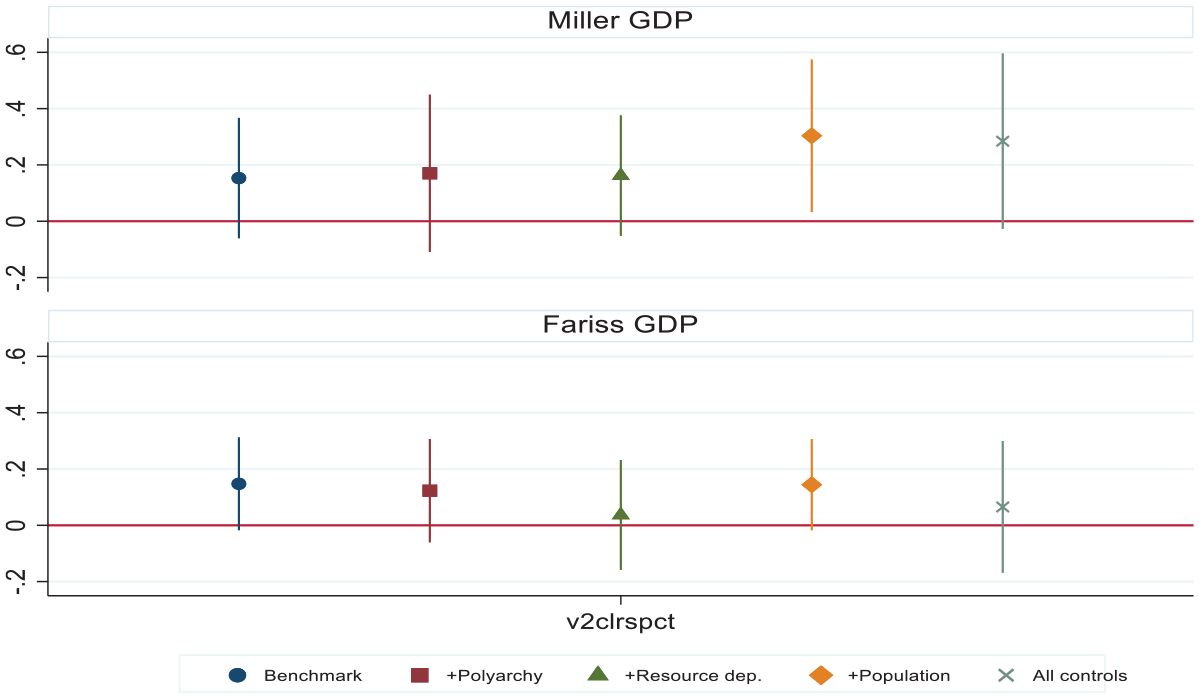
Coefficient plots with 95% CIs for impartial bureaucracy from the benchmark (Model 3, Table 2) and alternative specifications.
The point estimate for impartial bureaucracy is relatively stable, typically between 0.1 and 0.2, suggesting a modest, positive relationship with growth measured in t + 5, although the coefficient rarely achieves significance at conventional levels. When using the data from Fariss et al. (2017), the point estimates are often lower, although standard errors are also reduced in these specifications. Results are very similar when we restrict the various Miller and Fariss et al. models to be run on identical samples (Supplemental Appendix H). Finally, we note that the relationship turns somewhat stronger when controlling for the log of population, but weakens when controlling for natural resource dependence.
Overall, these additional tests provide mixed findings and at best only weak suggestions of a relationship. When running the same battery of tests on meritocratic recruitment, the relationship is even weaker (Supplemental Appendix G).
Different Panel Units and Lag-Lengths: Short-Term Versus Long-Term Effects
We have so far only tested specifications that measure growth 5 years after the independent variables, and there may be short- or long-term effects not captured by these specifications. Hence, we test specifications with alternative temporal lags or panel structures.
To begin with, we run fixed effects OLS regressions resembling those above, but with 5-year periods as panel units measuring growth 5 years after covariates. While leaving out relevant information, 5-year panels are often preferred by growth economists as they mitigate autocorrelation. The results, in Supplemental Appendix F, suggest that—independent of using the benchmark or the “full” model, or the Miller or Fariss et al. GDP data—there is no clear relationship between impartial bureaucracy (or meritocratic recruitment; see Supplemental Appendix G) and growth 5 years after. Yet again, the pattern is one of modestly sized coefficients that fail to achieve conventional significance levels.
We also tested specifications employing forward-lagged Ln GDP p.c. instead of growth. This allows us to capture growth in income across the entire period, say 5 years, after the measurement of bureaucracy, rather than only growth at the period’s end. In the theoretical section, we noted reasons to suspect that the effect of Weberian bureaucracy operates mainly in the short term (pertaining to capital investment being the main channel). If improvements to the bureaucracy lift growth for the first couple of years, but growth then returns rather quickly to its “normal trajectory,” the models discussed so far would fail to pick this up. However, serial correlation is a greater issue when using Ln GDP p.c. rather than GDP p.c. growth as dependent variable, and this specification also fails to similarly model potential convergence dynamics (see Barro & Sala-i-Martin, 2004)—GDP p.c. growth is no longer a straightforward linear function of past income levels. Thus, there are reasons to be skeptical of these specifications.
Nonetheless, we do find some evidence that increases in impartial bureaucracy relate to increased Ln GDP p.c., 5 years later. While not entirely robust to choice of controls and source for GDP data, the impartial bureaucracy measure is significant at 5% in most specifications (Supplemental Appendix F). The pattern that results are somewhat stronger for Ln GDP p.c. in t + 5 compared with GDP p.c. growth in t + 5 is consistent with a situation where growth changes over the first few years after changes to the bureaucracy, but then quickly returns to its prior rate.
Past dynamics in income could, however, affect both the bureaucracy and future growth rates. Results may be biased upward if reforms that engender improvements to the bureaucracy are more likely after economic crises, as post-crises periods are often characterized by high (rebound) growth. Yet, results do not change much when we add multiple lags of the dependent variable as covariates (following Acemoglu et al., 2019) in order to account for such temporal dynamics (Supplemental Appendix F). Once again, results are stronger (though not robust) when substituting GDP p.c. growth with Ln GDP p.c. (in t + 5) as dependent variable.
The mixed result pattern is also replicated for System GMM models (Supplemental Appendix F). System GMM is a dynamic panel estimator well-suited to model sluggish variables (Blundell & Bond, 1998). It also opens up to modeling impartial bureaucracy as an endogenous regressor, by using lags of differences as instruments for current levels and lags of levels as instruments for current differences in the variable. These models, which pass various specification-test criteria for generating consistent estimates, thus enable us to account for the dependent variable being affected by factors correlated with current growth (such as past growth). 8 Also for the different GMM models, we find stronger evidence of a relationship for Ln GDP p.c. than for GDP p.c. growth.
In sum, the above findings are consistent with the possibility that improvements to the bureaucracy (only) have a transitory, short-term effect on growth. This notion is further supported by tests that consider an even longer time window than 5 years between the independent and dependent variables. Short-term changes to growth are less important for explaining variation in income levels after, say, 10 or 20 years than after 5. Results remain significant for the benchmark when measuring Ln GDP p.c. in year t + 10 but are then consistently insignificant when adding controls. When measuring Ln GDP p.c. in t + 20, results are always insignificant (as are all results using GDP p.c. growth, in t + 10 or t + 20; see Supplemental Appendix F).
Other tests that support the interpretation of (only) a short-term relationship pertain to variations on the benchmark on GDP p.c. growth, but using various lag-lengths. Figure A-6 in Supplemental Appendix I reports coefficients and 95% confidence intervals when using Fariss et al. data. Coefficients are relatively similar, and statistically insignificant at 5%, when we measure growth 3, 5, or 10 years after the covariates, although the coefficient flips sign (but remains insignificant) when growth is measured in t + 25. While we cannot exclude a possible long-run effect on growth—especially if it works with variable lags in different contexts, making it harder to identify—our tests do not yield any positive evidence of such a relationship (see also Supplemental Appendix B). Regarding the short-term relationship, the impartial bureaucracy coefficient is positive and significant at 5% for growth in t + 1. Yet, we also highlight that the relationship is statistically significant when growth is measured 1 year before v2clrspct. This reminds us that—given the difficulty of isolating the effect from the reversed causal relationship—a positive short-term relationship could partly stem from higher growth leading to a more Weberian bureaucracy. 9
Assessing Causal Heterogeneity
The mixed results above—which, at best, suggest a (far) weaker and shorter term relationship between Weberian bureaucracy and growth than those predicted by previous cross-country studies—may, however, partly stem from non-modeled heterogeneity. Weberian bureaucracy might enhance growth in certain contexts, but not in others. One prominent candidate for moderator variable is initial level of development. As discussed above, the most developed countries and “latecomers” could observe divergent growth benefits from, for example, having an impartial bureaucracy. Bureaucratic structures may matter more for latecomers than early developers. However, our empirical tests do not indicate that this is the case. 10 When interacting impartial bureaucracy with GDP p.c. or distance (in Ln GDP p.c.) from the richest country in that particular year, which arguably better reflects the latecomer-interaction hypothesis related to Gerschenkron’s (1965) work, we fail to find any systematic effect (Supplemental Appendix J).
In the Theory section, we also discussed potential temporal heterogeneity in the relationship. An additional reason to check for this is the possibility of variable measurement error; if, as discussed, historical estimates of the bureaucracy are less reliable, there could be attenuation bias for the earlier time periods. If so, this also predicts that we should find a stronger relationship for later periods. To assess this possibility, we first reran the benchmark on split samples. The sample splits were chosen a priori. The first period runs from the French revolution (1789) to the revolutions of 1848. The second period starts in 1849 and ends in 1870. The third period runs from German unification (1871) to the year before World War I (WWI) (1913). The fourth period, 1914–1945, covers the two world wars and interwar period. The fifth period runs from 1946 to 1972, whereas the sixth period starts with the OPEC oil embargo in 1973 and runs to the present. 11 Except for a fairly sizable and significant coefficient on impartial administration for 1789–1848 when using Fariss et al. data, the time periods that stand out in terms of coefficient size are the two more recent ones (Supplemental Appendix J).
Next, we run models where we interact a temporal dummy with impartial administration. Since the more detailed split sample results show fairly similar coefficients for the two time periods, we merged 1946–1972 and 1973–into one post-WWII period and all other periods into a pre-WWII period. For the benchmark, the interaction term has a t-value of 2.5 when using Miller data and 1.8 when using Fariss et al. data. 12 Hence, while not completely robust, and although we cannot truly separate time-varying measurement error from time-varying effects, so-called Chow tests do find evidence of temporal heterogeneity.
Regarding predicted effects, there is no evidence of a positive relationship whatsoever before WWII, as displayed in Figure 6 (upper panel). In contrast, the estimated post-WWII effect is positive and statistically significant both when using Miller and Fariss et al. data. 13 The coefficient sizes suggest that going from minimum to maximum score on impartial administration increases growth by about 1.5 percentage points.
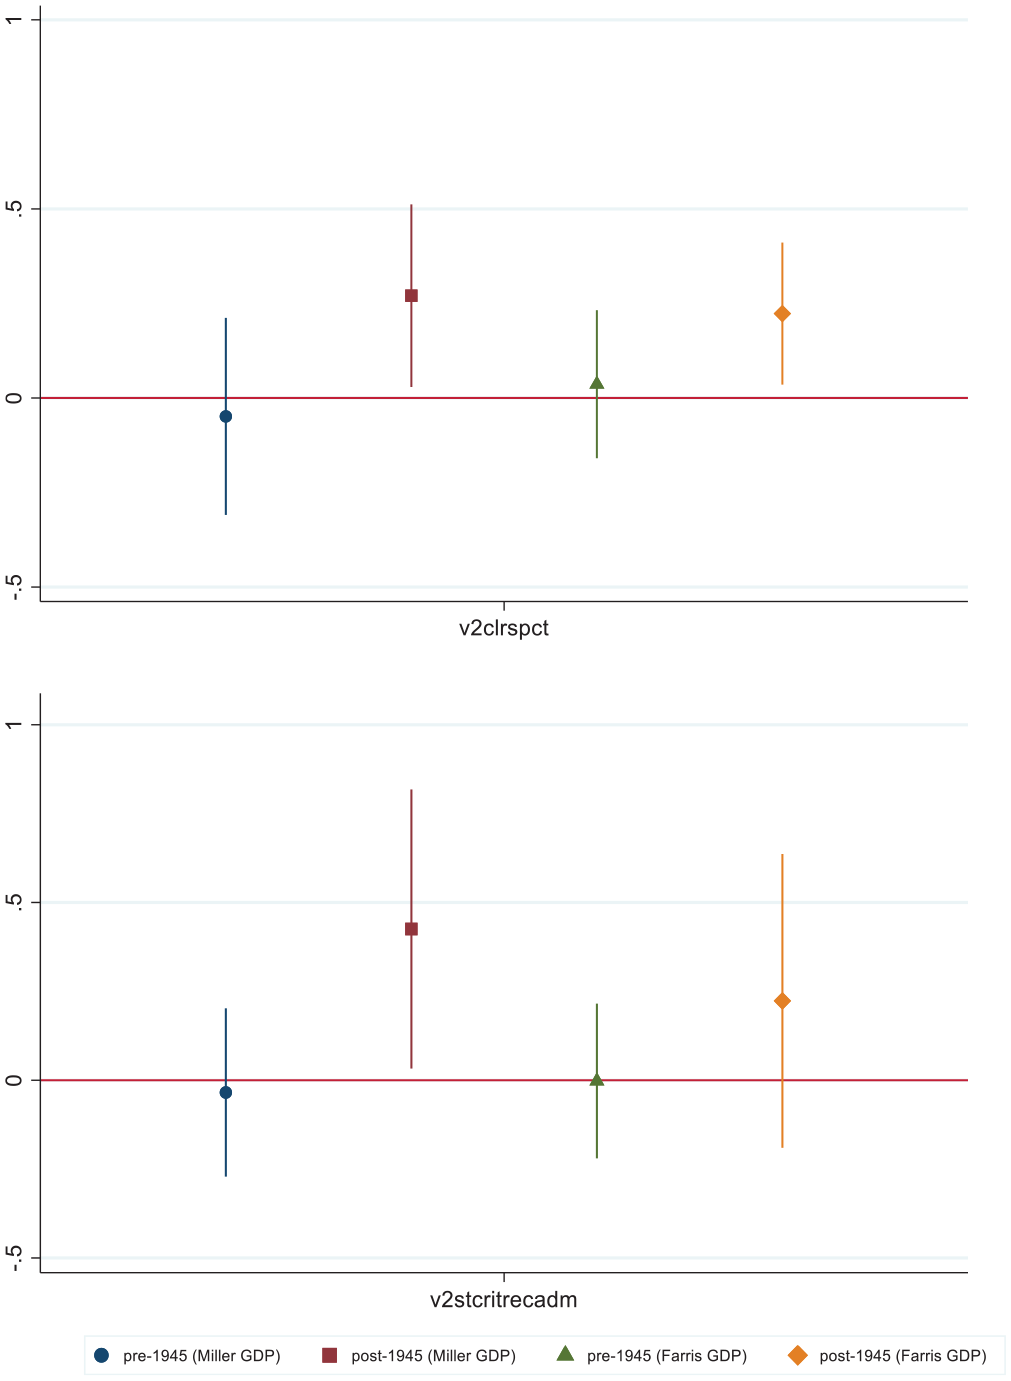
Results from benchmark specifications (with interactions) assessing temporal heterogeneity of relationships between impartial bureaucracy (top)/meritocratic recruitment (bottom) and GDP p.c. growth in t + 5, 1789–1945 vs. 1946–1999 (Miller)/2010 (Fariss et al.).
The bottom panel in Figure 6 shows the same pattern for meritocratic recruitment, although it is not as clear when using the Fariss et al. data (and disappears when restricting the Fariss et al. analysis to Miller’s sample; Supplemental Appendix H). But, when using the Miller GDP data, the estimated effect of meritocratic recruitment is positive and significant at 5% post-1945, but virtually zero pre-1945.
Conclusion
We have discussed and tested for a potential relationship between Weberian features of the bureaucracy and economic growth. Our empirical analysis suggests that previous estimates drawn from cross-country regressions have vastly overstated the strength of the relationship. Our various panel models report modest, though typically positive, point estimates, but these results are often statistically insignificant at conventional levels.
While this casts some uncertainty on the proposition that there is, indeed, an effect of Weberian features of the bureaucracy on growth, further analysis on our measure of impartial and rule-following administrations suggests that—if it exists—it tends to operate in the short term and it is stronger in recent decades. More specifically, the correlation is strongest and clearest when growth is measured between 1 and 5 years after the independent variable, and various split-sample regression and Chow tests suggest that it is apparent after WWII, but not before.
Future research should delve further into the mechanisms explaining why the effects are only short term and limited to recent decades. Do improvements in the “Weberianness” of the public administration only affect physical capital investments? How come that the state bureaucracy seems to matter more in the post-WWII period than in earlier periods of economic development? We have pointed to both methodological and substantive explanations that require further scrutiny by using additional data and alternative designs: Is this time-variant relationship due to greater measurement error for early decades? Or, was there, for example, a shift in the role taken by the state during this time period, or is the shift mainly due to advancement in technology and more complex modes of production and markets, which require state coordination to function? Finally, the strong cross-country correlation between Weberian bureaucracy and income level, combined with the results presented in this article, suggests the possibility of a “reverse relationship.” This is even indicated by our analysis measuring growth prior to Weberian features. Future theory development and careful empirical work could examine how and why high income levels, or even growth, facilitate the development of Weberian bureaucracies.
Supplemental Material
Appendix_Bureaucracy_growth_December9_RR – Supplemental material for Bureaucracy and Growth
Supplemental material, Appendix_Bureaucracy_growth_December9_RR for Bureaucracy and Growth by Agnes Cornell, Carl Henrik Knutsen and Jan Teorell in Comparative Political Studies
Supplemental Material
Replication_Code_Bureaucracy_Growth – Supplemental material for Bureaucracy and Growth
Supplemental material, Replication_Code_Bureaucracy_Growth for Bureaucracy and Growth by Agnes Cornell, Carl Henrik Knutsen and Jan Teorell in Comparative Political Studies
Research Data
Replication_data_Bureaucracy_Growth – for Bureaucracy and Growth
Replication_data_Bureaucracy_Growth for Bureaucracy and Growth by Agnes Cornell, Carl Henrik Knutsen and Jan Teorell in Comparative Political Studies
Footnotes
Acknowledgements
The authors thank Sindre Haugen for excellent research assistance. They are grateful for the valuable comments from three anonymous reviewers and the editors of Comparative Political Studies (CPS), Sirianne Dahlum, Imke Harbers, Suthan Krishnarajan, Magnus Bergli Rasmussen, as well as participants at the “State-Building and Regime Change in a Historical Perspective Workshop” at Aarhus University, April 26 and 27, 2018; the “Historical Varieties of Democracy Workshop” at University of Oslo, February 1 and 2, 2018; a seminar presentation at University of Barcelona, May 17, 2018; the “V-Dem Conference,” University of Gothenburg, May 28 and 29, 2018; and the “ECPR Joint Sessions,” Mons, April 8–12, 2019.
Declaration of Conflicting Interests
The authors declared no potential conflicts of interest with respect to the research, authorship, and/or publication of this article.
Funding
The authors disclosed receipt of the following financial support for the research, authorship, and/or publication of this article: Swedish Research Council, grant number 2014-1283, Research Council Norway, “Young Research Talent” grant number 240505, and Riksbankens jubileumsfond, grant number M14-0087:1.
Notes
Author Biographies
References
Supplementary Material
Please find the following supplemental material available below.
For Open Access articles published under a Creative Commons License, all supplemental material carries the same license as the article it is associated with.
For non-Open Access articles published, all supplemental material carries a non-exclusive license, and permission requests for re-use of supplemental material or any part of supplemental material shall be sent directly to the copyright owner as specified in the copyright notice associated with the article.