
Abstract
This article presents new evidence on the efforts of states to collect and process information about themselves, their territories, and their populations. We compile data on five institutions and policies: the regular implementation of a reliable census, the regular release of statistical yearbooks, the introduction of civil and population registers, and the establishment of a government agency tasked with processing statistical information. Using item response theory methods, we generate an index of “information capacity” for 85 states from 1789 to the present. We then ask how political regime changes have influenced the development of information capacity over time. In contrast with the literature on democracy and fiscal capacity, we find that suffrage expansions are associated with higher information capacity, but increases in the level of political competition are not. These findings demonstrate the value of our new measure, because they suggest that different elements of state capacity are shaped by different historical processes.
When the term “statistics” was first used, in the 18th century, it referred to scientific knowledge about the state. In this article, we present a statistical analysis (in the current sense of the word) of statistical knowledge (in the original sense of the word): We demonstrate when, where, and how states began to gather and organize basic information about themselves, their territories, and the populations they govern. 1
Our article contributes to the literature on state capacity, which is a matter of increasing concern to economists, political scientists, and sociologists. State capacity has been defined as “a government’s ability to make and enforce rules, and to deliver services” (Fukuyama, 2013, p. 350), the “institutional capability of the state to carry out various policies” (Besley & Persson, 2011, p. 6), and the “degree of control that state agents exercise over persons, activities, and resources within their government’s territorial jurisdiction” (McAdam, Tarrow, & Tilly, 2001, p. 78). Scholars typically treat state capacity as “a function of state bureaucracy, the state’s relations with social actors, and its spatial and societal reach” (Soifer & vom Hau, 2008, p. 220).
Among the resources states use when they “make and enforce” rules, “carry out” their policies, and “control” persons, activities, and resources, one of the most important is information. Our article, therefore, develops a new measure of the information that states collect, store, retrieve, and process about themselves. We rely on comparative, historical data on five information-gathering and information-organizing activities: the introduction and regular implementation of a national census, the introduction of civil registers the introduction of population registers, the establishment of a permanent state agency tasked with processing statistical information about a country’s territory and population, and the regular publication of statistical yearbooks. We then analyze the empirical relationships among these institutions and programs with item response theory (IRT) methods, generating a combined numerical measure of “information capacity.”
In the final part of the article, we examine the relationship between the development of democratic institutions and the development of information capacity from the 1790s onward. We find that suffrage expansions are associated with increases in information capacity, whereas changes in the level of political competition are not. Interestingly, the development of fiscal capacity, another important element of state capacity, has been shaped by different historical processes. This demonstrates the value of our new measure and the importance of distinguishing among the different resources that contribute to higher state capacity.
Information and State Capacity
Scholars often infer the level of state capacity in a polity from data on policy outputs and policy outcomes. For example, Soifer (2012), one of the world’s leading scholars of the state, bases one of his measures of state capacity on data on its expected outcomes, including low violent crime rates and low private security expenditures (“coercive capability”), high vaccination rates (“administrative capability”), and a high share of the population working in the formal sector (“fiscal capability”). Hanson and Sigman (2013), to take another prominent example, mix more direct evidence, such as survey-based estimates of the efficiency of bureaucratic institutions, with outcome variables, such as data on tax evasion. 2 In fact, there are few available measures of state capacity that do not rely, at least in part, on data on policy outputs and outcomes.
The drawback of this approach is that all arguments about the effects of state capacity on policies and outcomes risk becoming tautological. It is preferable, in our view, to concentrate on the “inputs” of state capacity—the resources states use to enhance their capacity—and not the “outputs.”
At the most general level, the term “state capacity” refers to the ability of a state to produce the outcomes political leaders attempt to achieve, whether to “make and enforce” rules, to “carry out” policies, or to “control” populations and territories. To fix ideas, we can refer to these “attempts to achieve” something as a vector of policies,
High-capacity states are better able to produce the outcomes their governments want to achieve because they deploy resources, denoted
Because state capacity, in this framework, is a causal effect, it cannot be measured directly; it can only be estimated. But the resources that states deploy—the elements of
Most of the things states do require information of some sort. Consider first what Scott (1998) calls the “classic state functions of taxation, conscription and prevention of rebellion” (p. 2). As argued by Soifer (2013), the power needed to “assess and collect taxes” (p. 9) depends on information about the population, such as the information collected through a census or through cadastral maps (D’Arcy & Nistotskaya, 2017). Similarly, to effectively implement the draft, authorities need information on which members of the population are eligible and where to find them. According to Fearon and Laitin (2003), finally, a state’s capacity to avoid civil war (“prevent rebellion”) depends on an effective counterinsurgency strategy, a critical component of which is information about “goings-on at the local level” (p. 80).
But the key role of information in explaining the success of state policies goes beyond these core functions. For example, states can help to promote growth by providing reliable information about possible business partners (Evans & Rauch, 1999). Similarly, successful public service delivery depends on reliable information about social needs, and on knowing when these needs are not being met (Hanson, 2015; Lee & Zhang, 2017).
As these examples show, states are only able to gather reliable information if they have spatial reach (Herbst, 2000; Soifer, 2008, 2012). That makes information different from other resources that mainly pertain to the central state in the capital, such as the financial resources that are available to state leaders or the number and quality of the civil servants who work for the central bureaucracy (Lee, 2018; Zhang & Lee, 2018).
To sum up, collecting and processing reliable information about a country’s population and territory are necessary for effective state administration. In the words of Anthony Giddens (1985), the “administrative power generated by the nation-state could not exist without the information base that is the means of its reflexive self- regulation” (p. 180). Many other scholars have discussed this relationship. Laurence Whitehead (1995), for instance, has written about the importance of information in the context of Latin American states. He defines “cognitive capacity” as the sustained organization to collect, process, analyse, and deliver the types of information about society needed for a modern state to monitor and interpret the impact of its measures, and to adjust them or reformulate them when they prove ineffective or counter-productive. (pp. 46-47)
Similarly, in the prolegomena to his great study of social power, Michael Mann noted that one of the most important elements of the state’s infrastructural power is information, observing that the state “stores and can recall immediately a massive amount of information about all of us” (Mann, 1984, p. 189).
The World Bank has gathered data on the “statistical capacity” of contemporary states since 2004. The Bank defines statistical capacity as “a nation’s ability to collect, analyze, and disseminate high-quality data about its population and economy,” noting that high-quality statistics “are essential for all stages of evidence-based decision-making” (datatopics.worldbank.org/statisticalcapacity). Its Statistical Capacity Indicator is based on a diagnostic framework that assesses the methodology, data sources, and periodicity of reported official data.
Apart from the World Bank measure, our project is most closely related to that of Lee and Zhang (2017), who have recently introduced a new measure of state capacity that is based on the accuracy of age data in national population censuses between 1960 and 2014 (see also Lee, 2018). Lee and Zhang draw on the pioneering work of Scott (1998), who identified the relationship between the growth of the modern state and the efforts of state officials to render societies “legible” by producing standardized information about territories and populations.
Our contribution to this contemporary empirical literature is twofold. First of all, our article develops a measure that spans a much longer time period than other available data sets. Our data contain yearly observations of 85 contemporary and historical polities over a period of 230 years, from the French Revolution to the present day. Lee’s and Zhang’s data set, by contrast, covers approximately half a century (1960-2012), and the World Bank statistical capacity indicator is only available from 2004 onward. The 85 countries in our sample were chosen to include all countries that were (a) sizable (>250,000), (b) sovereign in the pre-1900 era (either in the formal juridical sense or the de facto sense), and (c) match present-day state units, using Gleditsch and Ward (1999) as our main point of departure. 3 Second, our approach to conceptualization and measurement differs from that of Lee and Zhang. Put simply, we prioritize breadth over depth. Lee and Zhang use innovative methods to estimate the underlying capacity of states to conduct accurate censuses from statistical discrepancies in reported age distributions. We aggregate information about a broader array of policy instruments: We include censuses, but we also take civil and population registers, statistical agencies, and statistical yearbooks into account.
The Census
Population counts are one of the oldest and simplest technologies of information gathering available to rulers. They do not require major infrastructural resources, technical sophistication, or political coordination. Archeological evidence of population counts for fiscal or military purposes goes as far back as the Sumerian civilization (3800 BC) and has been found in ancient Egypt, Israel, China, Greece, and Rome (Alterman, 1969, pp. 17-35).
By contrast, the modern census is a sophisticated technology that only emerged in the 18th century. A census can be defined as “a direct enumeration, preferably on a set date and by name, of each individual in a census area” (Wolfe, 1932, p. 357). Modern censuses differ from other forms of population accounting because they involve the individual enumeration of every person in a territory within a bounded period. Through these enumerations, each individual is uniquely identified. Modern censuses, therefore, produce tabular data sets where rows represent individuals and columns represent individual-level characteristics, not mere summary statistics about the population.
Our empirical indicator of “first modern census” identifies the year in which each country implemented, for the first time, an enumeration that satisfied four conditions, as suggested by Goyer and Domschke (1983): (a) Universality—The census sought to cover the entire population and not just a sample. (b) Individual enumeration—The census produced tabular data sets with disaggregated information for each individual. (c) Defined territory—The census clearly specified the territory covered. (d) Simultaneity—Each person was enumerated as closely as possible to one well-defined point in time.
This new technology for “reading” populations emerged as the relationship between rulers and subjects was changing in territorial states. In contrast to the extensive power of empires, territorial states sought to exert more intensive power over their subjects, regulating their behavior in many areas of social life (Mann, 2012, pp. 6, 81, 489). In this context of political transformation, modern censuses were both a consequence of the intensification of political power and an instrument that states could use to further enhance their power.
Figure 1 presents a time line of the adoption of the modern census in our sample of countries, covering the period from the middle of the 18th century to the present. For presentational purposes, we exclude the German and Italian principalities that ceased to exist with Italian and German unification, with the exception of Piedmont-Sardinia, which represents preunification Italy, and Prussia, which represents preunification Germany. The enumeration of New France in 1666 and the Icelandic census of 1703 are not included because they covered fairly small jurisdictions (3,215 in New France and approximately 50,000 in Iceland) under the authority of foreign powers (France and Denmark). These enumerations are typically not counted as “national” censuses (Goyer & Domschke, 1983, p. 5).
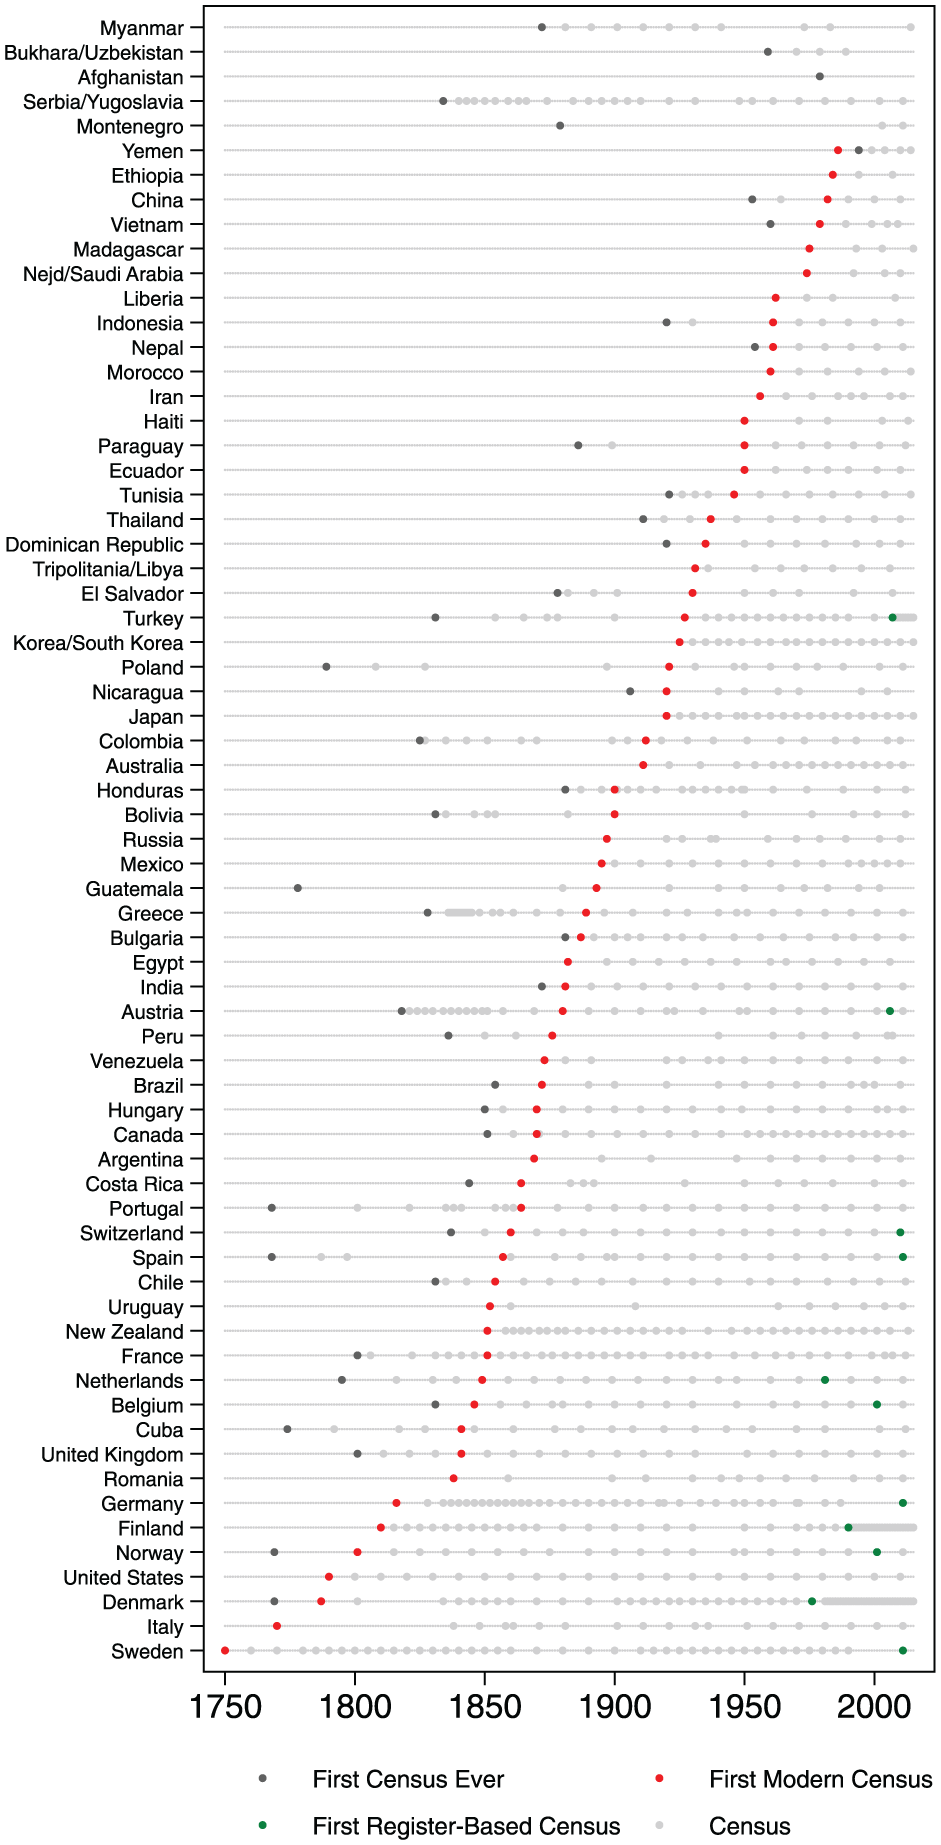
Introduction, census.
Sweden’s census of 1749 represents the first modern census of a populous nation. There is some controversy on this point, because it was not based on door-to-door canvassing or self-enumeration methods, but rather relied on ecclesiastical registers of vital statics (births, deaths, marriages; Goyer & Domschke, 1983, p. 5). Nevertheless, we treat it as a “modern” census because parishes produced tabular compilations that followed the principles of individual enumeration and universality (SCB, 1969). By contrast, although the proto-census of the Kingdom of Denmark and Norway in 1769 mirrored the decentralized administrative strategy of its Swedish predecessor, the parishes did not produce tabular compilations, only summary data that did not record individual characteristics (Goyer & Draaijer, 1992, p. 361). It was only with the census of 1787 that both of the principles of individual enumeration and universality were met in Denmark.
By the end of the 18th century, the modern census gained popularity through the diffusion of democratic institutions in the context of the American and French revolutions. The first census in the United States was implemented in 1790, with the goal of defining the apportionment of political representation. Many European countries followed in the 1840s and 1850s.
The first countries outside of Europe and its English-speaking offshoots to implement a modern census were Cuba (1841) and Uruguay (1852). In Chile, two failed attempts in 1831 and 1843 that yielded incomplete results preceded the census of 1854, which finally achieved a fairly complete coverage of the population (although indigenous peoples and inhabitants of remote areas were excluded; Goyer & Domschke, 1983, pp. 115-117). Most other Latin American countries carried out their first comprehensive enumerations during the 1860s and 1870s. Although by the turn of the 20th century, most countries in our sample had already implemented a modern census, several states were only able to carry out a full enumeration after World War II, particularly poorer countries in Latin America (such as Haiti, Ecuador, and Paraguay), Africa (such as Liberia, Madagascar, and Ethiopia), the Middle East (such as Saudi Arabia and Iran), and Asia (such as China and Vietnam).
Civil Registers and Population Registers
Civil registers, which record key events in the life trajectories of individuals (especially births, marriages, and deaths), were also one of the earliest tools that rulers used to gather information about their populations. Contrary to the census, which provides a snapshot of the population at specific points in time, civil registers record changes in the legal status of individual citizens over the course of their lifetimes.
Prior to the French Revolution, civil registers were typically administered by ecclesiastical institutions, which relied on them not only to monitor parishioners but also to generate revenue, through fees charged for baptisms, weddings, and last rites (Krogness, 2011, p. 91). Civil registers were also meant to provide a valuable service to the population by providing documentation that could be used to solve disputes over inheritances, taxation, and succession rights.
In countries with state churches, such as England and the Nordic states, the information contained in civil registers was available to state rulers from an early date. As Figure 2 shows, these countries had already established parish registers prior to 1750: England in 1538, Sweden in 1571, Finland in 1628, and Norway in 1685 (Poulain, Herm, & Depledge, 2013, pp. 185-186).
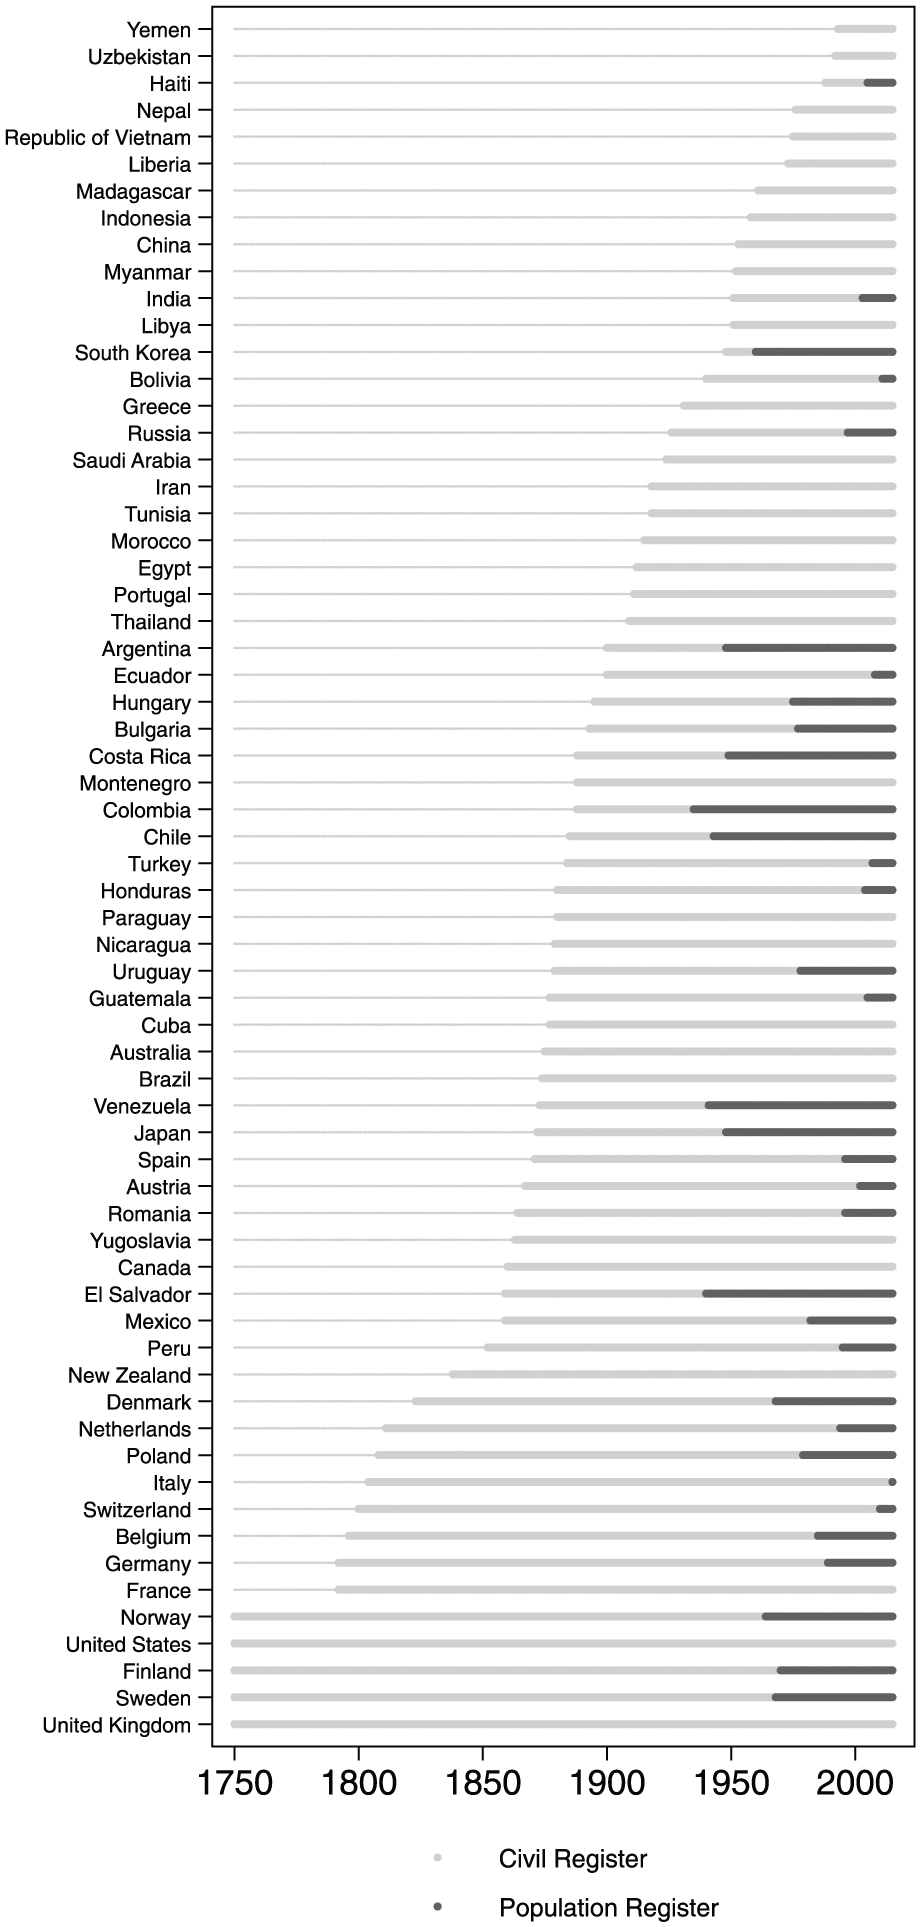
Introduction, civil and population registers.
In the Catholic world, the Church also established parish registers as early as the 17th century—not only in Europe but also in many of the Spanish colonies in the Americas. However, these sources of information were not under the control of the state and sometimes caused conflict between secular and religious authorities. Indeed, the secularization of civil registration was at the center of the conflicts between liberals and conservatives in Latin America during the 19th century, and became a priority for state-building elites at the time (Savage Carmona, 2015).
We have coded the date of the first implementation of a state-run system of civil registration. In cases where this information was not available, we coded the date for the first legislation ordering the establishment of such a system. For countries with state churches, we took the date for the implementation of the first parish registers.
Central population registers are a more sophisticated type of information technology that only developed after the Second World War, thanks to rapid technological advances in computer-aided data analysis. Efforts to maintain population registers can be traced back to the French Revolution, but we concentrate here on the development of centralized, comprehensive, national registers, which we regard as indicators of particularly high levels of information capacity. Central registers of this sort combine the functions of civil registers and censuses by keeping detailed and permanently updated records of every person in the territory. They are usually part of a national system of personal identification, which issues official identification cards and assigns to each individual a unique identification code that is necessary for legal and administrative procedures (and often even for private transactions). This allows state authorities to record not only snapshots of demographic data (as censuses do) and major events in the lives of individuals (as civil registers do) but also detailed and up-to-date information related to every person’s current residential address, employment, property, income, health, education, usage of public services, international travels, and criminal records.
Figure 2 highlights two important aspects of the cross-national variation in population registers. 4 First, they tend to be present in developed democracies in Continental Europe and East Asia, along with a handful of middle-income countries, especially in Latin America. The coverage of population registers varies a great deal, however. Some high-capacity states—such as Sweden and Norway, where the population registers cover almost every person in the territory—stopped carrying out regular censuses in the 2000s. This level of confidence in the coverage of population registers is quite rare; most countries with population registers have consequently continued to carry out enumeration-based censuses (Kukutai, Thompson, & McMillan, 2015, p. 14).
Second, population registers involve a major encroachment of the state into the private lives of individuals, which makes them politically controversial. This explains why some advanced democracies—such as the United Kingdom, the United States, Canada, Australia, New Zealand, and France—have actively refused to establish them (Poulain et al., 2013, pp. 188-189). In many of these cases, municipal or voluntary registers have existed at various points in time, but every effort to centralize those repositories of information has faced fierce resistance from societal actors, local authorities, or both (Poulain et al., 2013, p. 187). These states probably have the underlying technical capacity that is needed to establish centralized population registers, but the fact that they do not currently have them means that all else equal, their information resources are inferior to those of states with comprehensive population registers.
Statistical Agencies and Yearbooks
To collect, organize, preserve, and ultimately publish official statistics, states needed to develop dedicated bureaucratic organizations. The establishment of an official statistical agency is perhaps the most directly observable sign of a state’s investments in information capacity. Of course, some numerical information about people, land, and production were often collected long before statistical offices were established, but the very fact that a specialized agency with the sole task of performing statistical activities is created is evidence of increased ambitions when it comes to gathering information.
Figure 3 presents an overview of the timing of the introduction of statistical agencies, as well as the publication of official statistical yearbooks, which we discuss in detail below. For the purposes of this article, we concentrate on the creation of the first official government organization that is instructed to gather numerical information on a variety of topics. We do not include periods where such tasks were absorbed by several government offices that mainly performed other functions.
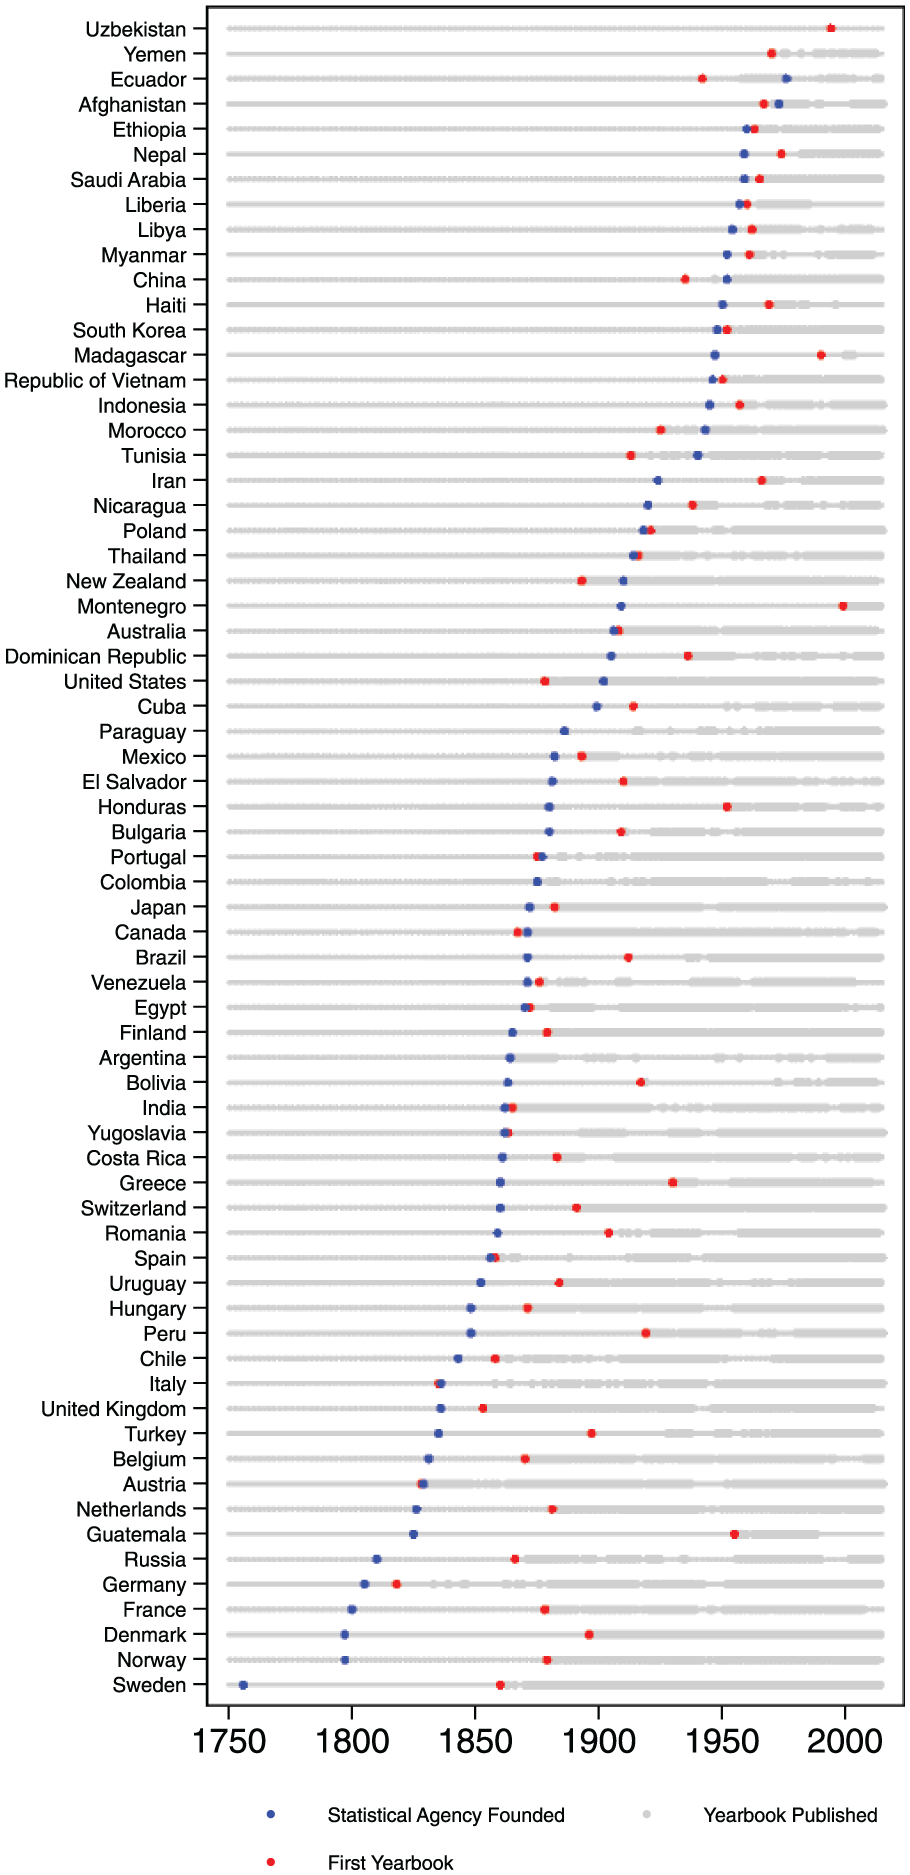
Introduction, agencies and yearbooks.
The Swedish Tabellverket was probably the first official statistics institution in the world, created in 1756 by Pehr Wilhelm Wargentin (Arosenius, 1918, p. 742), only a few years after the first nation-wide census was conducted in Sweden in 1749. 5 Denmark–Norway established a Tabulating Office in 1797, but the poorly staffed office was unable to live up to the high expectations, in particular, with the failure to complete the enumeration of 1801, and it was abolished in 1819; in 1834, however, Denmark again set up a Tabulating Commission, consisting of high-ranking administrators from various departments, which helped to establish a respected office and facilitated cooperation across agencies. The commission was replaced in 1850 by an independent central Statistical Bureau, further professionalizing its services (Jensen, 1918). In Norway, which Denmark ceded to Sweden in 1814, an independent Statistical Bureau was set up within the finance ministry in 1837 (Kiær, 1918).
In France, Napoleon’s drive to rationalize the government by creating an authoritarian–centralist but modern and efficient state was a perfect moment for the development of statistical capacity (Prévost & Beaud 2015, p. 68). France established a Bureau de Statistique in 1800. But with the start of the Napoleonic wars and the French invasion of Russia in 1812, the appetite for statistical analysis vanished—the French statistical agency was closed down and was not reestablished until 1833 (Westergaard, 1932, p. 114). In Prussia, the king urged the establishment of a statistical office in 1805, the first in German lands. After a crushing defeat against Napoleon’s forces at the Battle of Jena in 1806, however, the office was shut down and statistical publications were banned (Westergaard, 1932; Würzburger, 1918). The central statistical office was reestablished in 1810, with the explicit aim to aid the reconstruction of the shattered Prussian state and to provide statistical analyses that could be “put to immediate use by the highest administrators in the land” (Hacking, 1990, p. 30). In Russia, the first statistical office was founded in 1811 as a division within the newly created Ministry of Police—itself a conspicuous choice for the Tsarist autocracy (Kaufmann, 1918).
In the 1830s and 1840s—sometimes called the “era of enthusiasm” in the literature on statistics (Westergaard, 1932, pp. 136-171)—many official statistical agencies were newly founded or reestablished. Their work was buttressed by new statistical societies. Following the opening of new statistical offices in the Netherlands (1826), Austria (1829), and Belgium (1831), a major development was the establishment of a statistical department at the Board of Trade in the United Kingdom in 1832. But statistical offices did not only open in Europe. Guatemala (1825), Chile (1843), Peru (1848), and Uruguay (1852) are early Latin American examples.
Official statistical agencies are commonly meant to serve a dual purpose: to provide statistical information for the state administration and to allow the public to access information collected by government agencies. Most countries in the world (and all countries in our sample) have at one time or another achieved part of the latter purpose by publishing an annual statistical yearbook. In general, statistical yearbooks compile available statistics on demographic, social, and economic conditions and activities in a country, often including information on the regional as well as the national level.
Westfall (1986) defines statistical yearbooks as recurring publications of national statistical offices published annually or semi-annually or less frequently which contain statistical tables in more than one of the following categories: 1. physical environment; 2. demography; 3. economic affairs; 4. political affairs; and 5. social and cultural affairs (p. ii).
We follow this definition with one major exception: We do not require that the yearbook is published by a “national statistical office” because that would make the relationship between this and our indicator on statistical agencies tautological; we only require that the yearbook is published by some government agency.
The publication of a statistical yearbook requires a high level of sophistication in several government agencies, because more than one agency typically contributes to the collection, processing, and aggregation of statistical information. As discussed above, many countries established a dedicated statistical agency precisely to aid with the task of combining statistical information across government agencies. We assume, therefore, that the ability to produce a statistical yearbook is a further, useful measure of a government’s information capacity.
Beyond the ability to produce a statistical yearbook—that is, to collect the necessary information and process it—governments need to have the willingness to disseminate such information publicly. Thus, unlike the establishment of the census and a statistical agency, providing statistical accounts to the public may not be unequivocally beneficial for rulers: Governments can have an interest in obtaining and systematizing such statistical information for internal use, but still hesitate to provide such information transparently to the public—including to domestic and foreign adversaries.
But Figure 3, which provides information about all published yearbooks of the countries in our sample, suggests that there is no “pro-democratic bias” in the data. The first country to publish an official statistical yearbook was the Austro-Hungarian empire with its 1828 publication Tafeln zur Statistik der österreichischen Monarchie, which was followed a year later by the establishment of a central statistical office (Statistisches Bureau, later Statistisches Zentralamt). Other relatively early adopters of statistical yearbooks were Russia and the Ottoman Empire, which were hardly bastions of transparency at the time.
Unsurprisingly, we observe the establishment of an independent statistical agency before the first publication of a statistical yearbook in most countries; Austria was an exception.
Information Capacity Since the French Revolution
Figure 4 summarizes the information in Figures 1 to 3 in a single graph, describing the share of countries in our sample (in percent) that had introduced the census, established civil and population registers, established a statistical agency, and released statistical yearbooks. As this figure shows, these information-gathering and information-organizing institutions were introduced in a particular order: The census and civil registers came first, agencies and yearbooks came later, population registers came last.
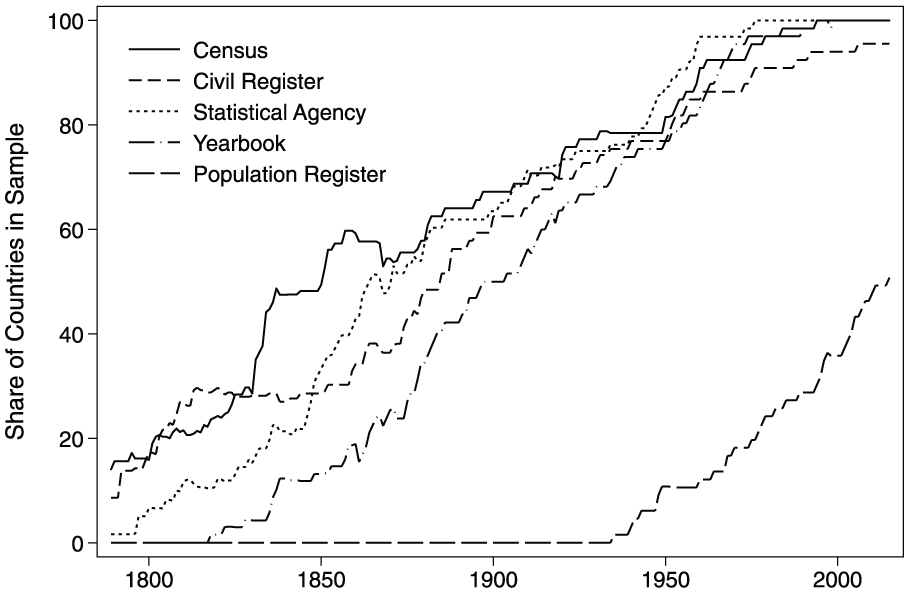
Order of introduction, all countries.
There is an interesting over-time pattern in this sequence, however, that becomes apparent in Figure 5. Figure 5 shows when the first census was conducted in each country (the red Cs), when each country’s national statistical agency was introduced (the blue Ss), and when a statistical yearbook was first released in each country (the black Ys). Among early adopters—countries in which the first census was conducted in the 18th or early 19th century—there was typically a big gap between the first census and the establishment of a statistical agency. Among states that had not introduced any of these things until the middle of the 19th century or later, however, the gaps are smaller: Those states often did all of these things at once. It seems likely that the intensification of collaboration among statisticians and administrators in the middle of the 19th century contributed to this development (Randeraad, 2010): over time, it became the norm among states to have both censuses and statistical agencies.
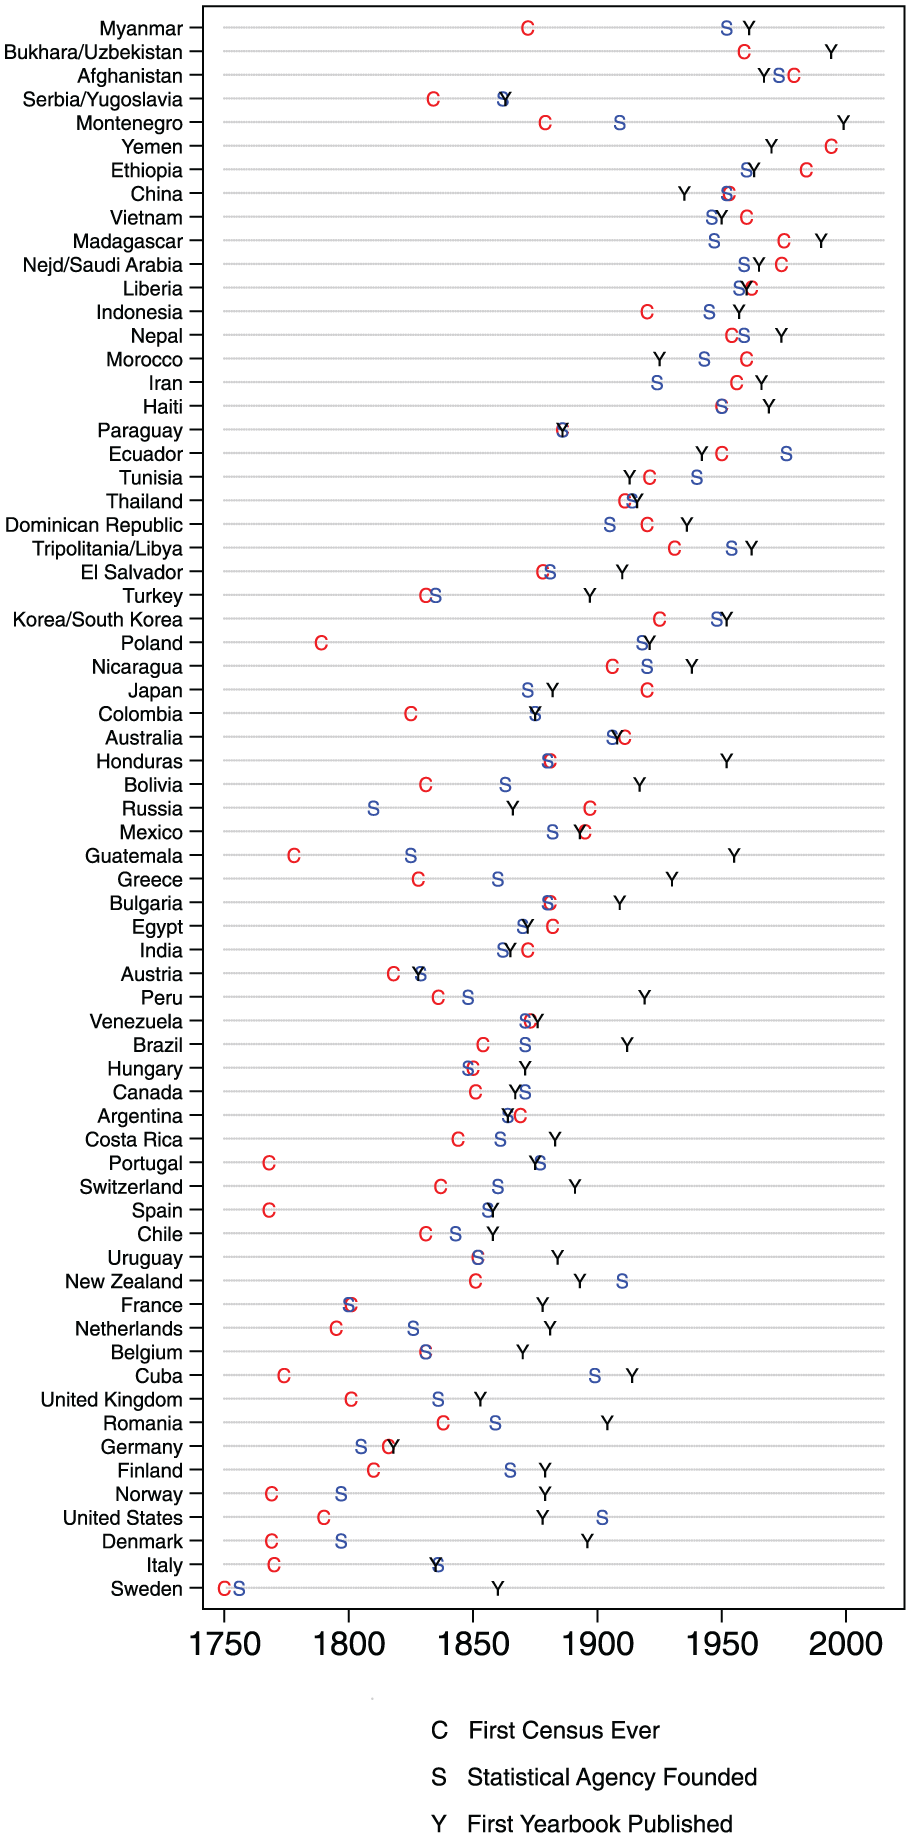
Order of introduction, by country.
The individual indicators of information-gathering and information-organizing institutions that we have identified are of interest in their own right, but we are ultimately interested in generating a combined measure of information capacity for all country–years in our sample. To be able to compare the level of information capacity across countries and over time, we, thus, need to aggregate the five separate indicators. Simply summing the binary indicators, the simplest method of aggregation, is unsatisfactory, because it introduces strong assumptions that are unlikely to be met: Ad hoc scaling through simple summation assumes that each of the binary variables is an equally good indicator of a single underlying unidimensional continuum. In other words, this procedure would assume that all the information-related activities we have described have equal weight when it comes to determining aggregate information capacity.
Instead, we rely on a simple unidimensional IRT framework that helps to relax that assumption (we regard the assumption of unidimensionality as relatively unproblematic given our theoretical setup and the measures we have obtained).
We want to estimate the latent level of information capacity, θ i , for all countries i in our sample, where i = 1,…, n. The latent level of θ i is unobserved, but we observe the responses for individual items j, where j = 1, . . ., J. Given that our five indicators are binary responses, we start with the simplest one-parameter logistic IRT model (1pl), which is known in the literature as the Rasch model (Rasch, 1960). In the Rasch model, the probability of a positive response for item j given a level of information capacity θ i is defined as
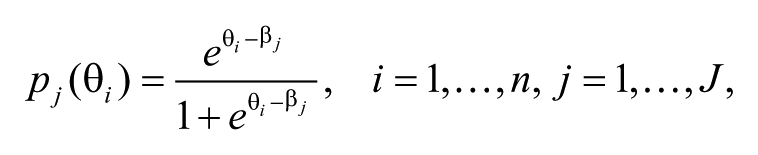
where β j is a measure of difficulty for item j. Importantly, both θ i and β j are measured on the same scale, allowing a direct comparison between information capacity and the difficulty of the items.
All IRT models discussed in this article make the following three assumptions (see Bartolucci, Bacci, & Gnaldi, 2015, pp. 66-67 for details): (a) Unidimensionality—The latent trait information capacity θ
i
is assumed to be unidimensional. In other words, we assume that for each country i, the responses to the J items depend on the same latent trait level θ
i
, which is unidimensional and belongs to the real number series (
The results for the one-parameter logistic model are presented in Table 1. All models are estimated for the time period from 1750 to 2012. Model 1 presents the results for the Rasch model. The common discrimination coefficient λ of the model is presented in the bottom panel of the table. Only the difficulty parameters for population registers and yearbooks are significantly different from zero and thus contribute to distinguishing countries with respect to their aggregate information capacity.
IRT Models of Information Capacity (1750–2012).
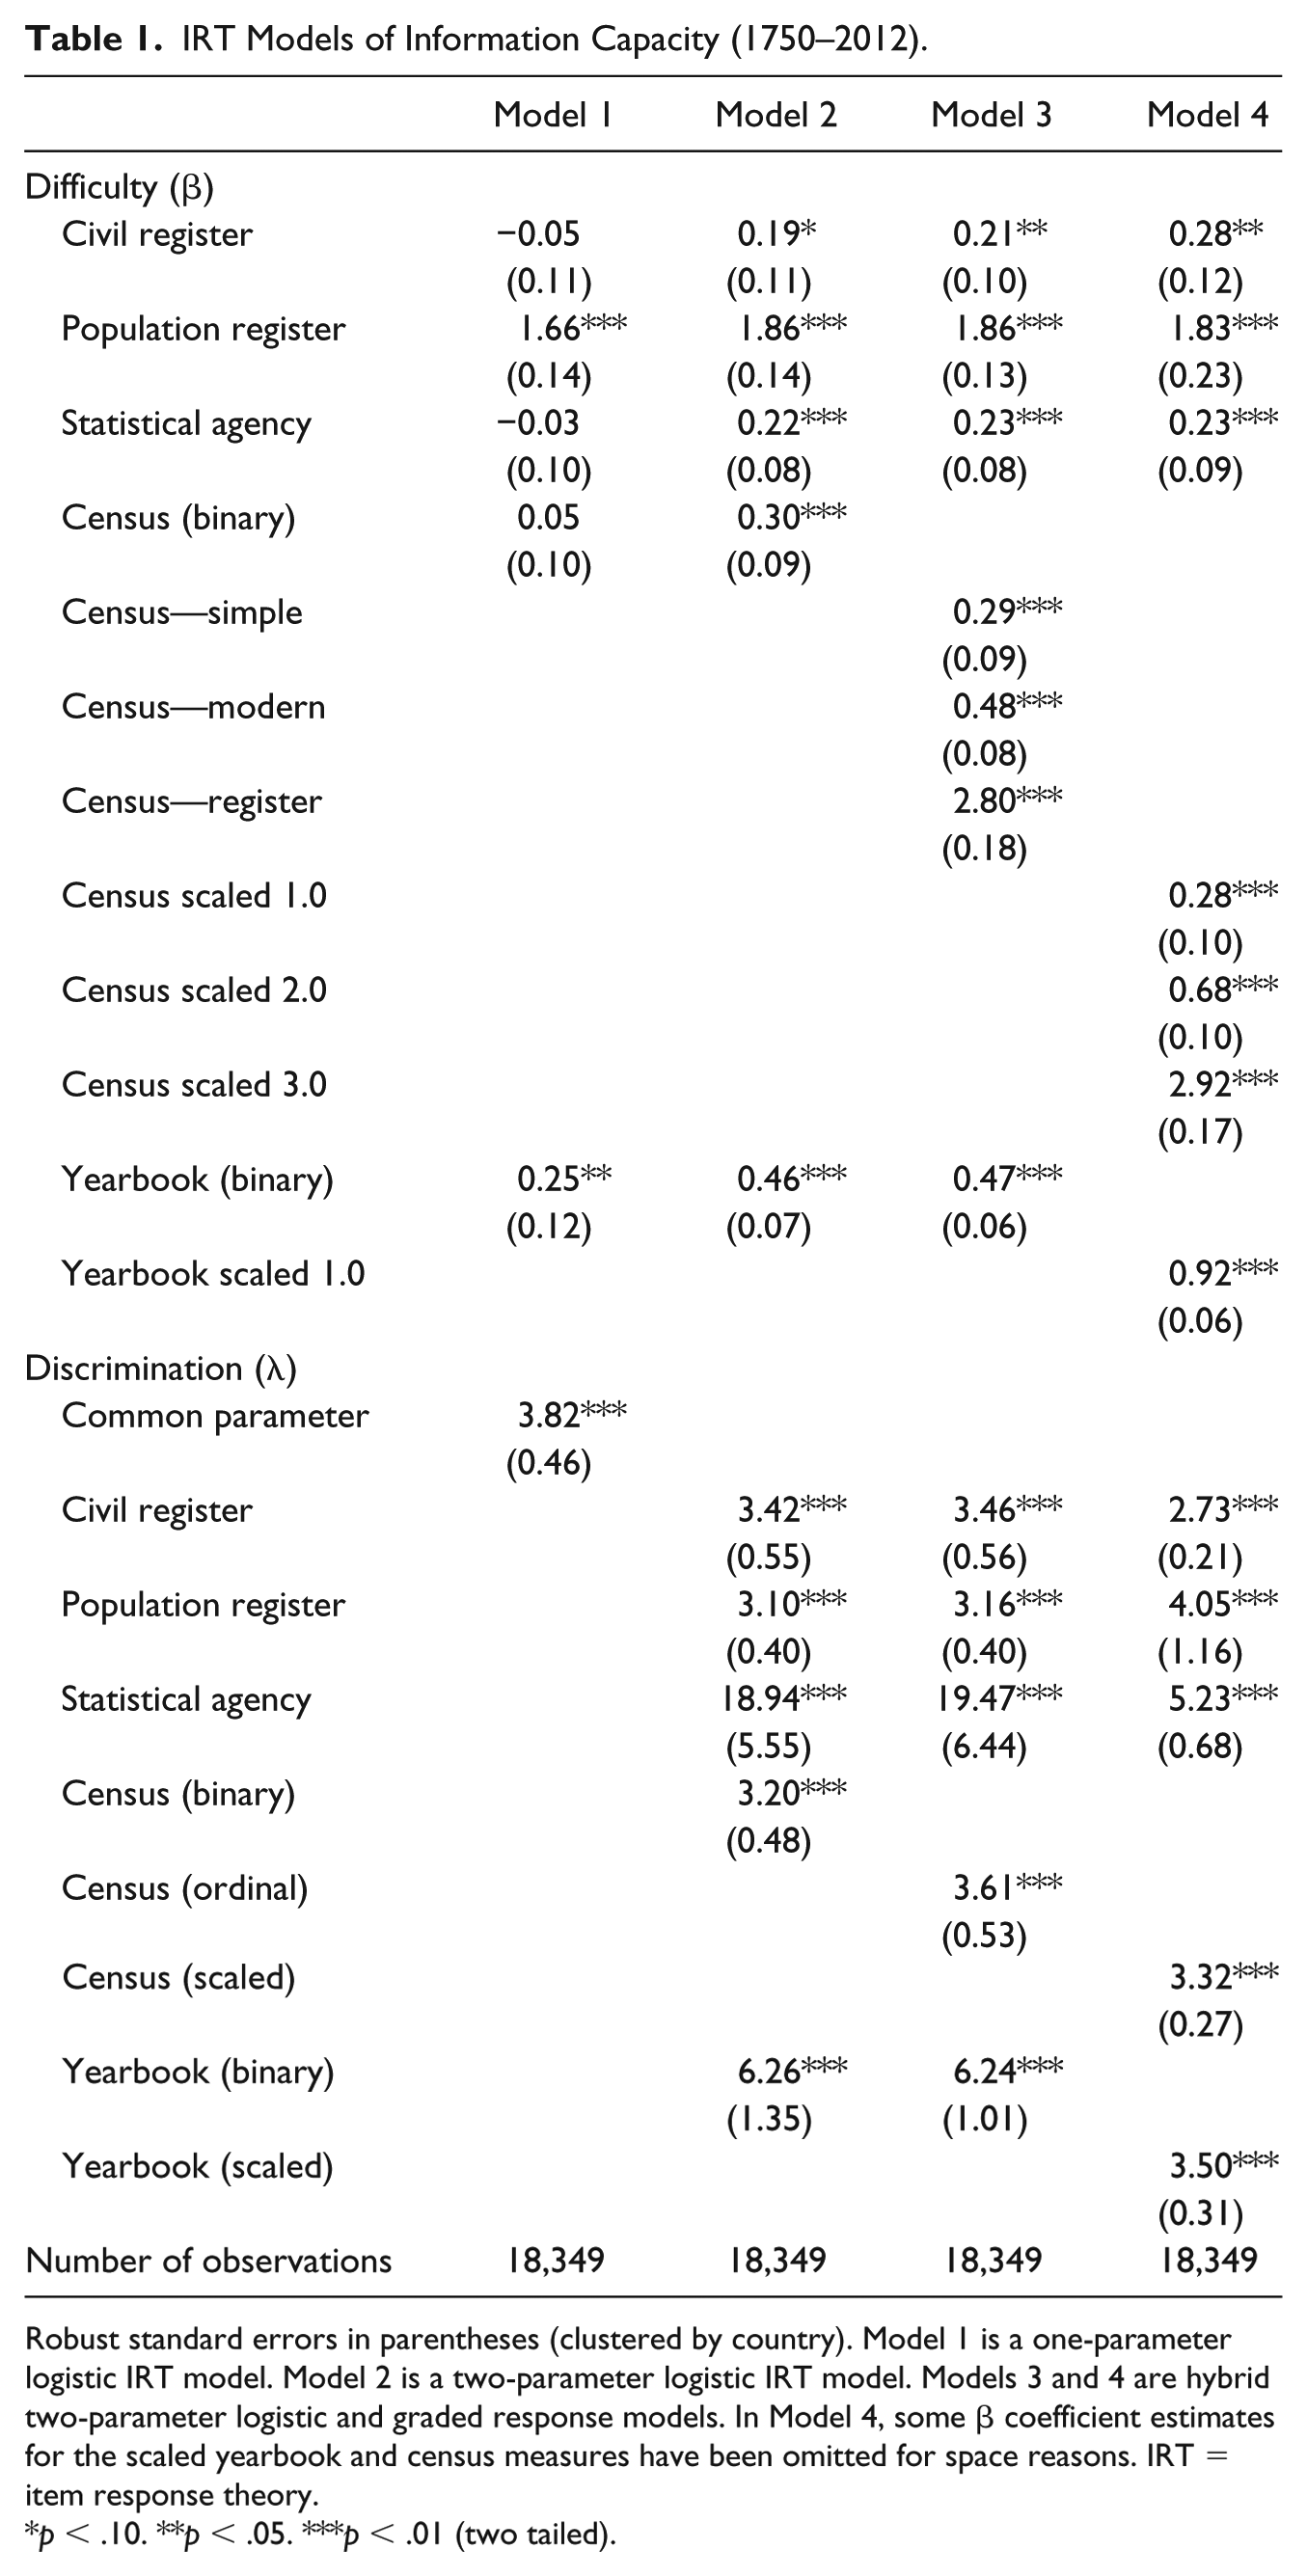
Robust standard errors in parentheses (clustered by country). Model 1 is a one-parameter logistic IRT model. Model 2 is a two-parameter logistic IRT model. Models 3 and 4 are hybrid two-parameter logistic and graded response models. In Model 4, some β coefficient estimates for the scaled yearbook and census measures have been omitted for space reasons. IRT = item response theory.
p < .10. **p < .05. ***p < .01 (two tailed).
While appealing for its simplicity, the Rasch model makes the strong and implausible assumption that each of the items can discriminate equally between high- and low-capacity states across the same range of information capacity. Model 2 in Table 1 relaxes that assumption by allowing each item to have its own discrimination parameter λ i rather than constraining them to a single, common discrimination coefficient. Judging by the variation in the estimated discrimination parameter λ for the different indicators (in the bottom panel of the table), we find that the two-parameter model fits the data significantly better.
In Model 2, we now find that all our suggested indicators—running a census, having civil and population registers, publishing a yearbook, and creating a statistical agency—can significantly distinguish levels of information capacity across countries. Running a census and registering births in a civil register are, perhaps not surprisingly, found to be significantly “easier” than running a continuously updated population register. The publication of a yearbook is estimated to be a medium-difficulty task.
We can differentiate the type and quality of census taking further. Specifically, we created an ordinal variable indicating whether the census was a (a) simple census, (b) modern census, or (c) census based on a population register. We also assume that if for more than 10 years no census has been run or no yearbook has been published, the ability of a country to execute a census or publish a yearbook lapses back to zero—an assumption we revisit and refine in Model 4.
In Model 3, we use a graded response model to include this ordinal census measure into our IRT estimation. Adding the parts of this ordinal census measure separately as binary indicators would technically be possible but would almost certainly violate the local independence assumption. In Model 3, all coefficients remain significant and almost unchanged compared with Model 2, except the now more differentiated assessment of the census categories.
We find that the difficulty estimates order the indicators from the easiest—establishing a civil register, running a simple census, and creating a statistical agency—followed by the medium difficult—running a modern census and publishing a yearbook—to the most difficult—establishing a population register and running a population register-based census. This ordering tracks well with the earlier impressions we got from the descriptive statistics discussed above.
If we do not observe a census or a yearbook for a long period of time, we can infer that the quality of the information that a state has about its population starts to become obsolete. However, our initial assumption (for Models 1-3) of a complete lapse back to zero after 11 years is quite blunt. Instead, we create scaled versions of our census and yearbook measures in which the quality of the information declines more slowly. More specifically, if the yearbook or the census is not observed on their regular cycle—a year for the yearbook and a decade for the census—then we assume an annual depreciation of 0.1 from the previously attained score. For example, a country that had previously run a modern census (coded a 2 out of 3 on our ordinal scale) would decline 0.1 per year starting at 11 years after the previous census. After 10 years, the country would, thus, be coded as being on par with a country running simple censuses (coded 1 on our ordinal scale), and after 20 years (i.e., a total of 30 years of no census activity), the indicator would have declined to zero.
In Model 4, we use a hybrid two-parameter and graded response model to include these scaled measures in our IRT estimation. Due to space constraints, we have only included the three difficulty parameters that correspond to the ordinal measures of the census in Model 3 (i.e., the ones corresponding to the breaks at 1.0, 2.0, and 3.0). The estimated parameters are quite similar to Model 3, which suggests that the choice between an abrupt or a gradual depreciation of census and yearbook abilities does not affect the results much.
For simply reducing the data to a single unidimensional scale, an underlying latent measure of information capacity, we could also simply have relied on principal component analysis. Given that all of our information–capacity subindicators are binary or ordinal; however, IRT analysis is the appropriate choice. Nonetheless, for robustness checks, we also estimated information capacity using principal component analysis. We find a very high correlation of the predicted measures of information capacity from this alternative model with our preferred IRT measure of information capacity (ρ = .98). We, therefore, focus on our preferred IRT measure of information capacity, based on Model 4 in Table 1, for the subsequent analyses.
Figure 6 uses the estimates of Model 4 in Table 1 to generate predictions for the estimated level of information capacity. In accordance with our historical descriptive sections above, we find that countries such as Sweden, Austria, France, Germany, and the United Kingdom developed high information capacity relatively early in the 19th century. Interestingly, we find a drop in the estimated information capacity around the time of the Second World War in many countries in our sample, because censuses were often postponed and yearbook publication sometimes ceased during the war.
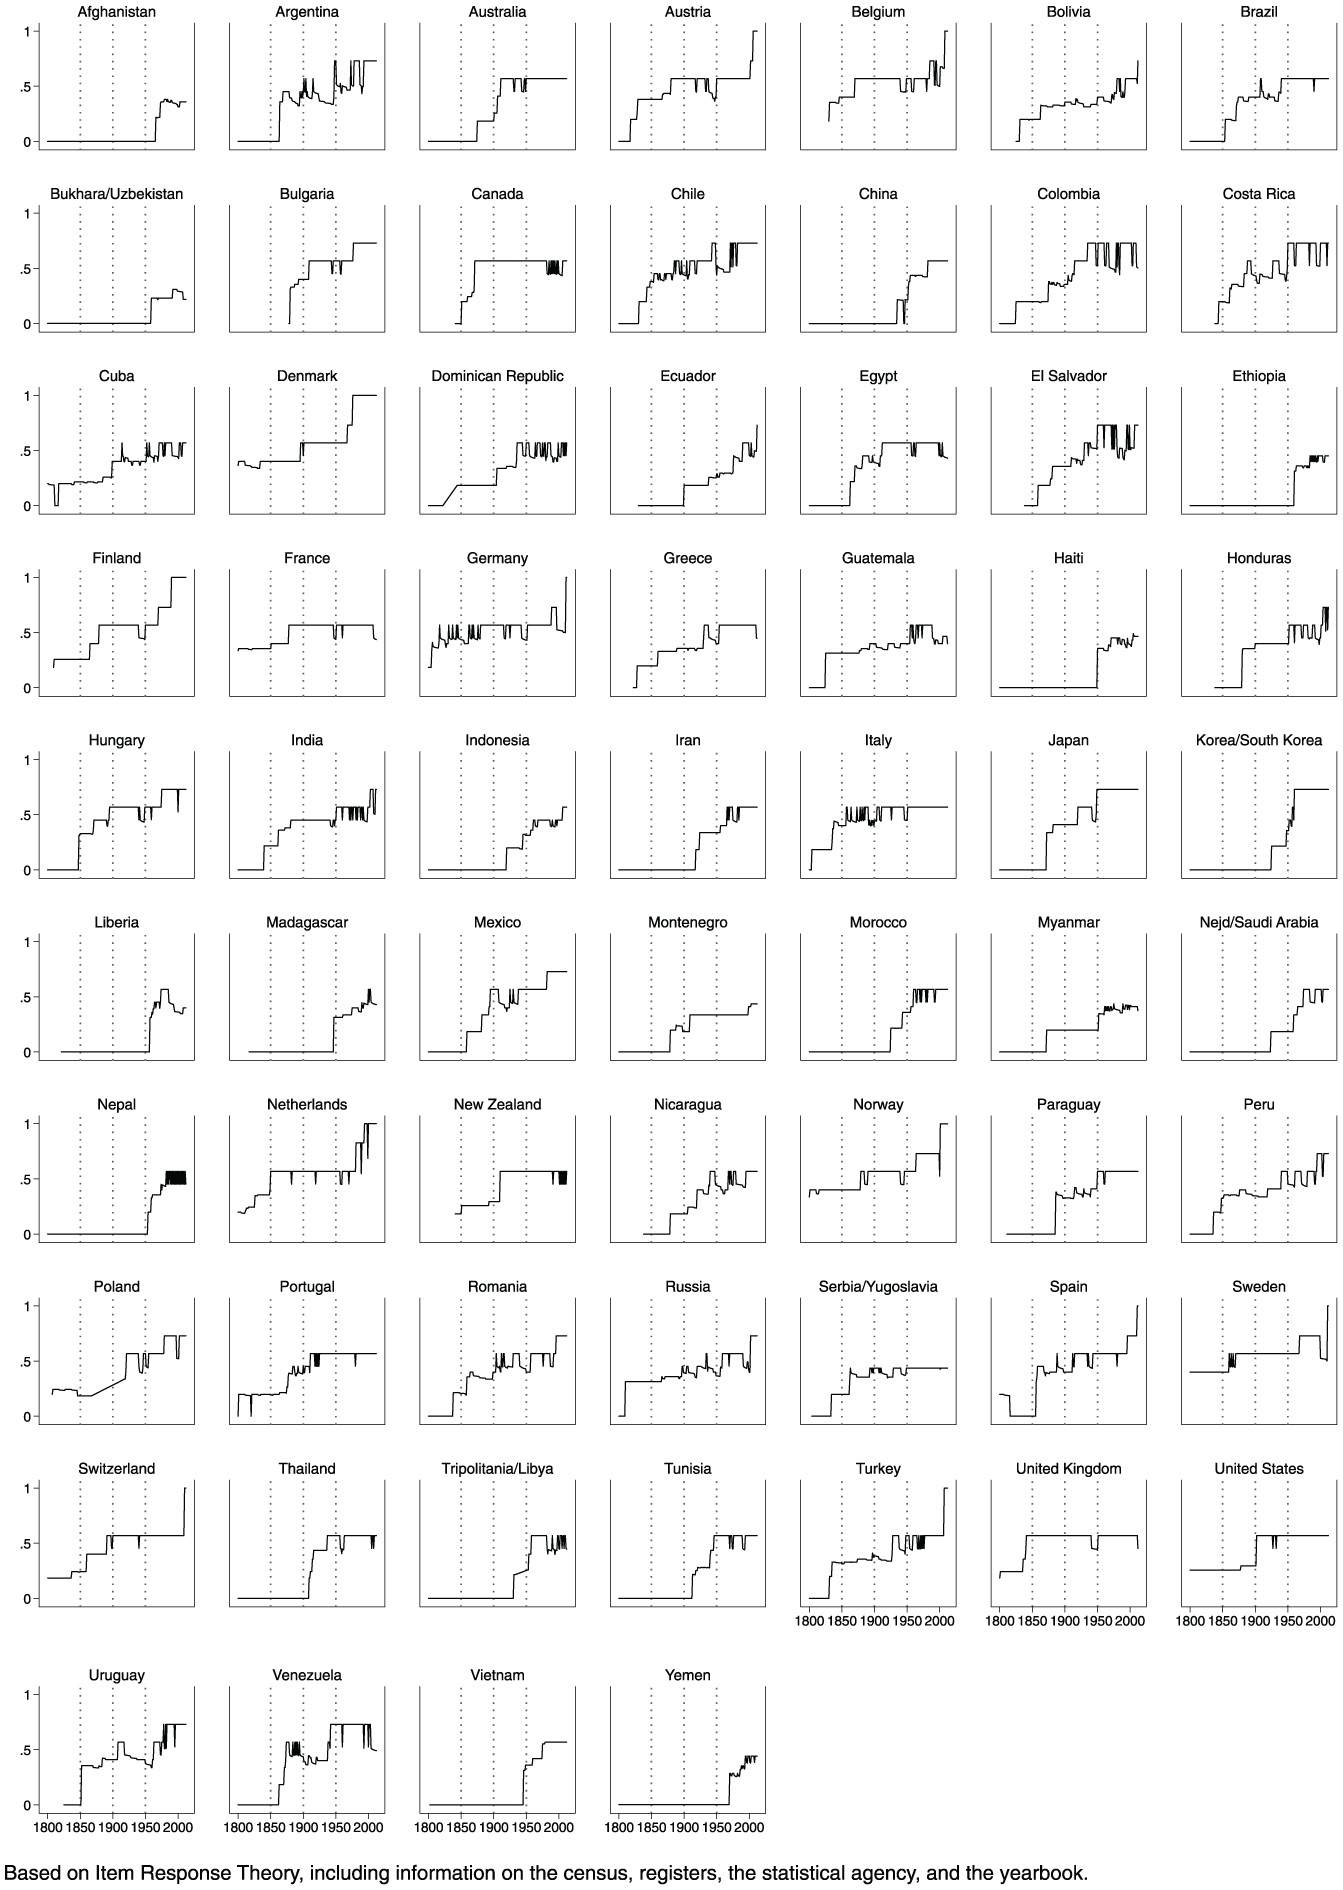
Estimated information capacity by country.
Figure 7 describes the average level of information capacity in the world’s regions. As the figure shows, information capacity increased earlier in Europe than in other parts of the world. The Americas came next, catching up with Europe around the time of the Second World War. The Middle East–North Africa region and the rest of Asia have followed each other closely ever since the middle of the 19th century. In Africa, finally, information capacity increased rapidly during the decolonization period, but remains slightly lower than in other regions to this day.
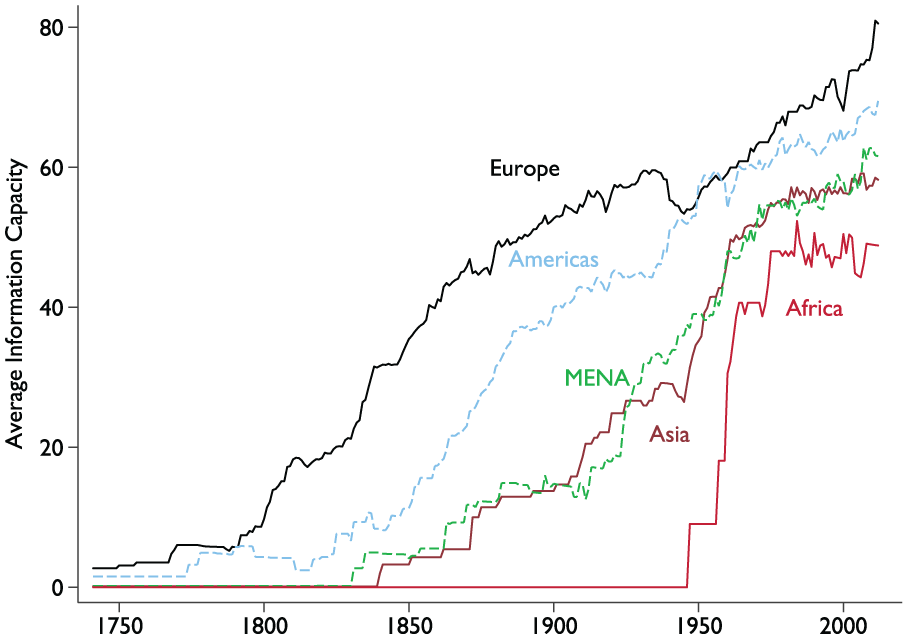
Information capacity in the world’s regions.
This new measure of information capacity helps us to provide a fine-grained assessment of specific cases. Take, for example, the evolution of information capacity in Chile, Colombia, Mexico, and Peru, the countries discussed in Hillel Soifer’s magisterial study of state capacity in Latin America (Soifer, 2015). The patterns in Figure 6 are consistent with Soifer’s characterization of the Chilean state as strong and of the Peruvian as weak. But our index picks up some nuances in the Mexican and Colombian cases. Even if the Colombian state has historically been weaker in many other respects than its Mexican counterpart (when it comes to territorial control and fiscal extraction, for instance), our data show that it has historically been more effective in one specific regard: keeping track of its population. Colombia carried out regular censuses from 1825 to 1870 and—after a 30-year interruption—has continued to do so regularly since 1899. By contrast, the first modern census in Mexico was only implemented in 1895. Colombia established a statistical agency and began publishing a statistical yearbook in 1875, a few years before Mexico did (1882 and 1893, respectively). As a result, Colombia reached higher levels of information capacity earlier in the 19th century. Similarly, Mexico only passed legislation concerning the creation of a population register in 1980. Despite repeated efforts to centralize the task of keeping track of the population under a National Population Registry (RENAPO), citizen registration and identification remain divided between the National Electoral Institute, the military, and the population and civil registers (Figueroa Campos, 2001; Molina-Medina & Cervera-Flores, 1989). Colombia first established a centralized system of citizen registration in 1934 under the authority of the National Police. In 1948, Law 89 established a specialized population register—the Registraduría Nacional del Estado Civil—as part of a new electoral authority (Acuña & Yanet, 2003, p. 17). The early adoption of a centralized population register explains Colombia’s increase in our measure of information capacity in the second half of the 20th century.
In Figure 8, we compare our measure of information capacity with three other prominent empirical data sets that tap into similar constructs for the contemporary period: Hanson and Sigman’s (2013) latent-variable index of state capacity (1960-2009), Lee and Zhang’s (2017) measure of census accuracy (1960-2012), and the World Bank’s Statistical Capacity Indicator (2004-2012). The correlations are all in the expected direction (note that the Myers’ index developed by Lee and Zhang (2017) is scaled so that lower values correspond to higher census accuracy). Reassuringly, the correlation with the World Bank index, which is conceptually most similar to ours, is also the strongest. These correlations provide further support for the view that our new measure describes a key resource that states can employ to enhance overall state capacity. 6 The most likely explanation for the fact that the correlations are not stronger is the time period covered by the other indices: After 1960, as Figure 4 makes clear, most countries in our sample had already installed all the institutions we are capturing, except a population register. Our estimates, therefore, discriminate less well in this period, which should be kept in mind when using the new measure in empirical work; the main point of our new measure is that it captures variations in information capacity over a much longer time period than comparable measures.
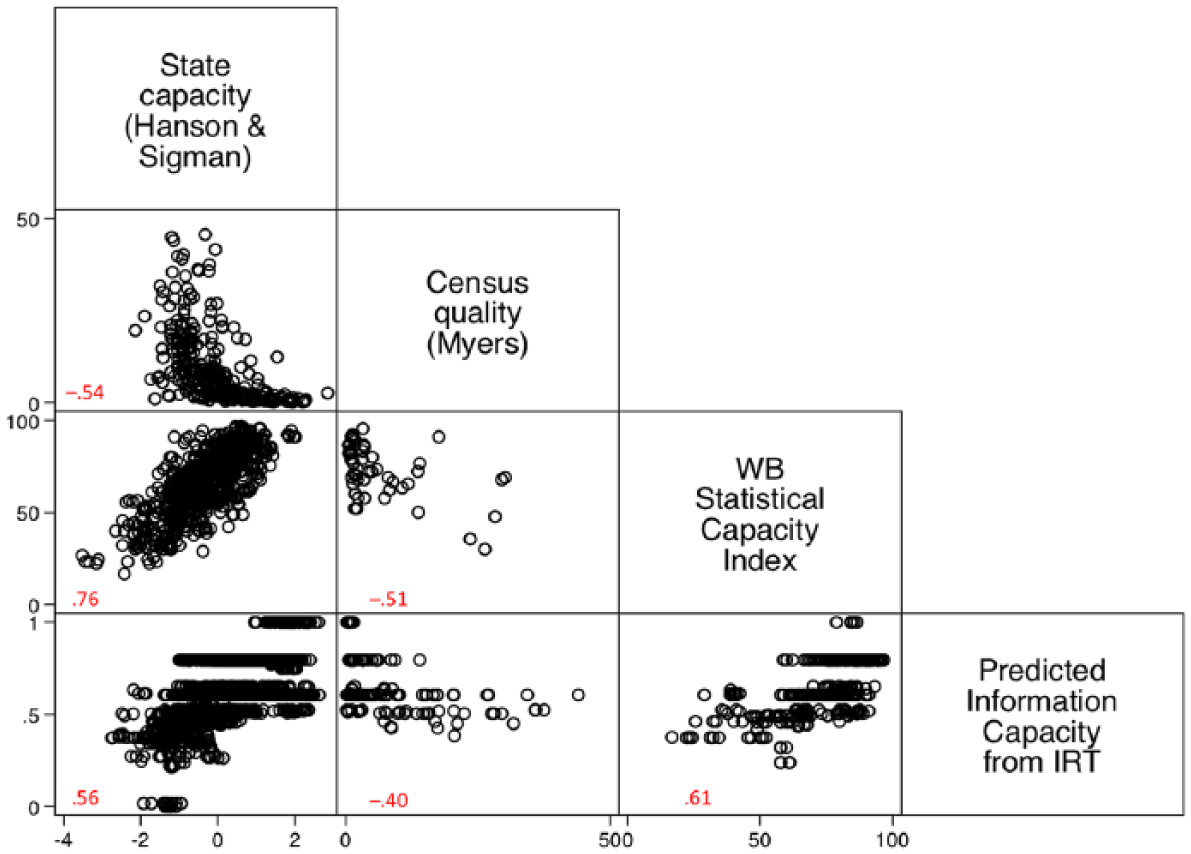
Correlations with similar measures.
Democracy and Information Capacity
In this section, we use our new data to examine the relationship between democratic institutions and information capacity. The question whether democracy is associated with high levels of information capacity is important in itself, but the answer to that question also tells us something about the answer to a deeper question: whether information capacity and other resources that states use to enhance their overall capacity, such as the capacity for fiscal extraction, are shaped by the same underlying historical processes. We are guided by three competing hypotheses derived from the literature on democracy and state capacity (see Mazzuca & Munck, 2014, for an overview).
First, neoinstitutionalist theories of political economy suggest that democratic institutions increase state capacity because they facilitate fiscal extraction. Political competition and constraints on the executive allow rulers to credibly commit to use public revenues to provide valuable public goods, which makes taxpayers more likely to acquiesce to higher taxation (Besley & Persson, 2009; Dincecco, 2011; Levi, 1988; North, 1990). If extracting information is similar to extracting financial resources, this fiscal contract theory can be extended to the case of information capacity: Citizens might be more willing to provide information to the state if they can monitor and punish public officials who use that information against their interests. This idea of “no information without representation” suggests that political competition should be associated with higher levels of information capacity, because it increases the legitimacy of the state and inspires compliance.
Second, other scholars have noted that democracy leads to higher state capacity because mass popular participation puts logistical pressures on the state (see especially Slater, 2008). Running elections with broad popular participation requires that states collect fine-grained information: States use censuses and population registers to draw the boundaries of electoral districts and allocate legislative seats. States also rely on civil and population registers to register voters. Statistical agencies allow states to identify social problems and respond to the needs of different groups. Statistical yearbooks help states publicize the performance of the government. Moreover, building on selectorate theory (Bueno de Mesquita, Smith, Siverson, & Morrow, 2003), one might expect rulers who need broad support to remain in power to have stronger incentives to gather information about who those supporters are, where they are located, and what they want from the state. Regimes that rely on smaller groups are less information-intensive, because rulers can more easily keep track of their supporters and competitors without having to collect information about the entire population. These ideas suggest that, rather than political competition, the broadening of popular participation through suffrage expansions should be associated with higher levels of information capacity.
Finally, many sequential arguments about political development suggest that democratic institutions may in fact hinder the development of state capacity. In this view, states need to eliminate internal rivals, build professional bureaucracies insulated from popular pressures, and foster strong national identities before they democratize; if not, electoral competition fosters factionalism, creates incentives for societal actors to capture the public administration, and empowers the population to resist the expansion of the state (Huntington, 1968; Shefter, 1993). Based on these arguments, one would expect autocracies to gather information more effectively; in democratic states, by contrast, citizens are empowered to deny the state access to information that can be used for surveillance, repression, and invasions of privacy. In sum, democratic institutions should be associated with lower levels of information capacity.
To examine these alternative explanations, we use two different measures of democratic institutions: one measure of the proportion of the population that had the right to vote (range = 0-1) and one measure of democratic competition (range = 0-1). Both measures come from the Historical V-Dem project (Knutsen et al., 2019). The competition measure corresponds to a minimalist conception of democracy that goes back to Joseph Schumpeter (1950), or, in other words, what Dahl (1973) calls “contestation”: In a system with electoral competition, political leaders are chosen in free and fair elections. 7 The suffrage measure and the competition measure are correlated—as one would expect—but they are theoretically distinct, because it is quite possible for a country to have a high level of competition and a limited suffrage, just as it is possible for a country to have universal suffrage but restricted electoral competition.
To give a feel for the data, we begin by examining the bivariate relationships between our two measures of democratic institutions and our measure of information capacity. In Figure 9, the x axis describes the magnitude of decade-to-decade changes in democratic competition, whereas the y axis describes the magnitude of decade-to-decade changes in information capacity (we have taken decade averages of the competition measure and the information capacity measure, and then we have calculated changes from one decade to the next). The bivariate relationship between changes in competitiveness and changes in information capacity is flat. There does not seem to be much evidence of a positive effect of electoral competition per se. But there is a positive relationship between the right to vote and information capacity. As Figure 10 shows, decade-to-decade increases in the proportion of the adult population that has the right to vote are positively associated with decade-to-decade increases in information capacity.
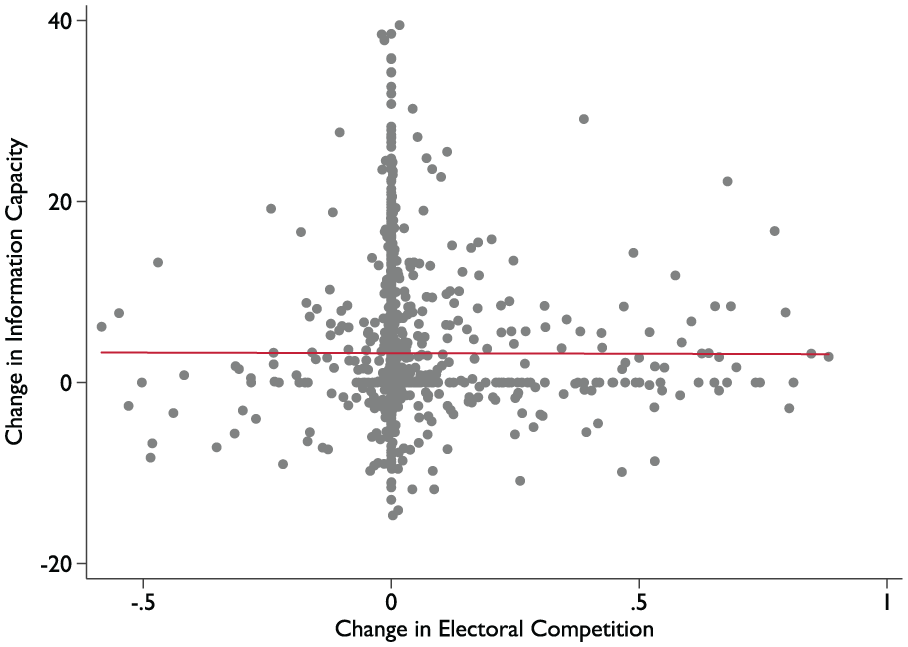
Electoral competition and information capacity.
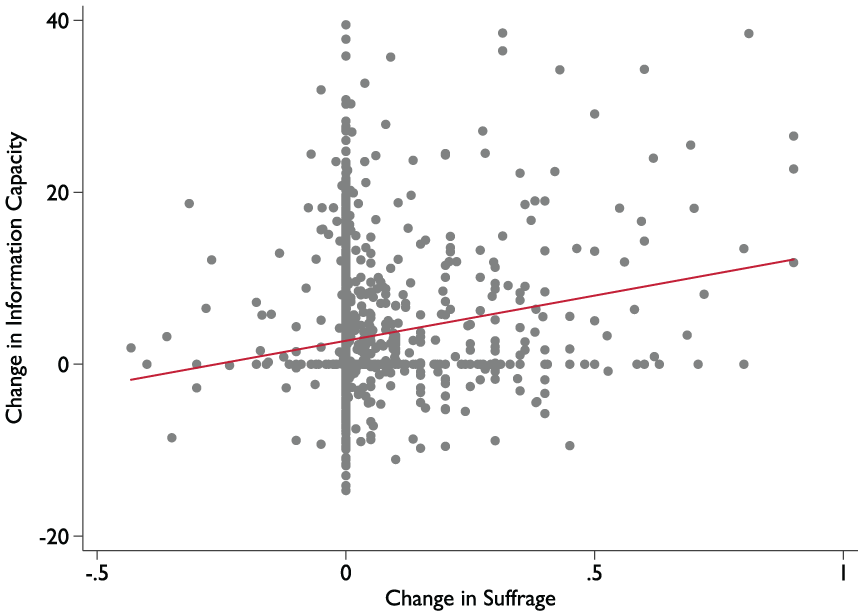
The right to vote and information capacity.
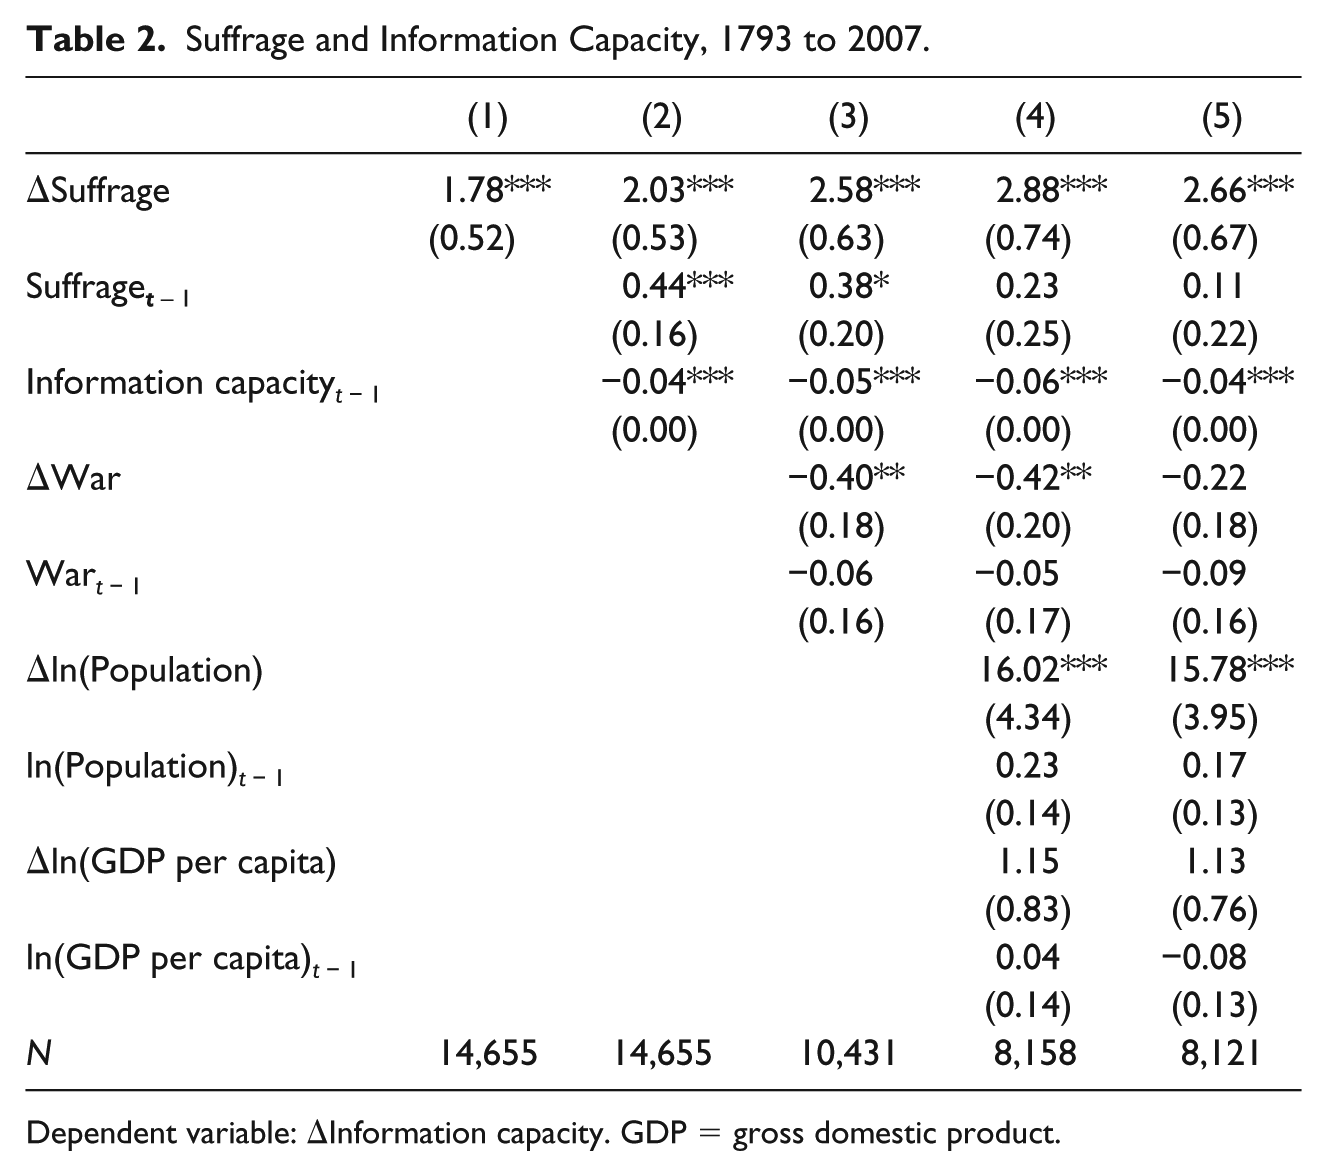
The positive relationship between suffrage extensions and increases in information capacity also holds up in a statistical analysis. In Table 2, we analyze the relationship between suffrage and information capacity with regression methods, using our main measure (produced by Model 4 in Table 1) as the dependent variable in the first four columns. In the first column, we estimate a simple first-difference model, regressing yearly changes in information capacity on yearly changes in the franchise. In addition to controlling for common trends by including year dummies, all models control for country-specific trends by estimating a model with unit-level fixed effects. 8 To make the coefficients easier to interpret, we have redefined the information capacity variable so that it ranges from 0 to 100. An increase in the proportion of the population that has the right to vote from 0% to 100% is thus associated with an increase in information capacity of just less than 2 on a scale from 0 to 100. That may not seem like much, but as in the other models in the table, it is important to keep in mind that this is an estimate of the short-run effect: The relationship between a change in the suffrage and a change in information capacity in the same year. Note also that the range of information capacity in the world at any given time is significantly smaller than 0 to 100, because 0 corresponds to the lowest level of information capacity in the beginning of the period and 100 corresponds to the highest level of reform capacity more than two centuries later.
Suffrage and Information Capacity, 1793 to 2007.
Dependent variable: ΔInformation capacity. GDP = gross domestic product.
In the second column, we add some dynamics by estimating an error correction model instead of a simple first-difference model, regressing yearly changes in information capacity on the yearly change in the suffrage, the previous year’s suffrage level, and the previous year’s level of information capacity. As before, we include year-fixed effects and estimate the model with country-level fixed effects (which control for country-specific trends). In the third column, we add a control for war, because Figure 6 shows that wars appear to be associated with lower information capacity and because wars are likely to increase the likelihood of franchise extensions. 9 We lose quite a few observations by including the war variables, but the estimated coefficient is, if anything, greater than in Model 2.
War is not the only confounder to consider when studying the relationship between extensions of the franchise and information capacity. It is also possible that underlying time-varying factors such as economic development simultaneously increase the likelihood of franchise extensions and increases in information capacity. Regrettably, historical data on economic development are even more scarce than historical data on wars, but we, nevertheless, estimate a model that includes two time-variant control variables: economic development (GDP [gross domestic product] per capita) and the size of the population, both of which come from the Maddison’s (2011) data set (see column 4; we include the natural log of both variables in the model and we linearly interpolate the data when there are gaps in the series to avoid losing too many observations). The estimate of the short-term effect remains largely unchanged, but the estimated long-term effect of having a high level of suffrage is slightly smaller and less precisely estimated, suggesting that the estimate of the short-term effect is more robust.
Finally, to demonstrate that our results do not depend on the particular measure of information capacity that we get from our IRT model, we reestimate the model in column 4 with an alternative dependent variable, which is calculated through a simple principal component analysis. The estimates in column 5 are similar to those in columns 1 to 4, suggesting that the results are not sensitive to the measurement model used. We present additional robustness checks in the supplemental material, including models where we drop one region at a time, where we explore period-specific effects (pre- and post-1900), and where we generate the index of information capacity only for censuses and registers and excluding statistical agencies and yearbooks. In all these models, the estimates of the short-term effect, as captured by the term ΔSuffrage, remain very similar; the estimates of the long-term effect vary more across models, which is consistent with our interpretation of Model 4 above.
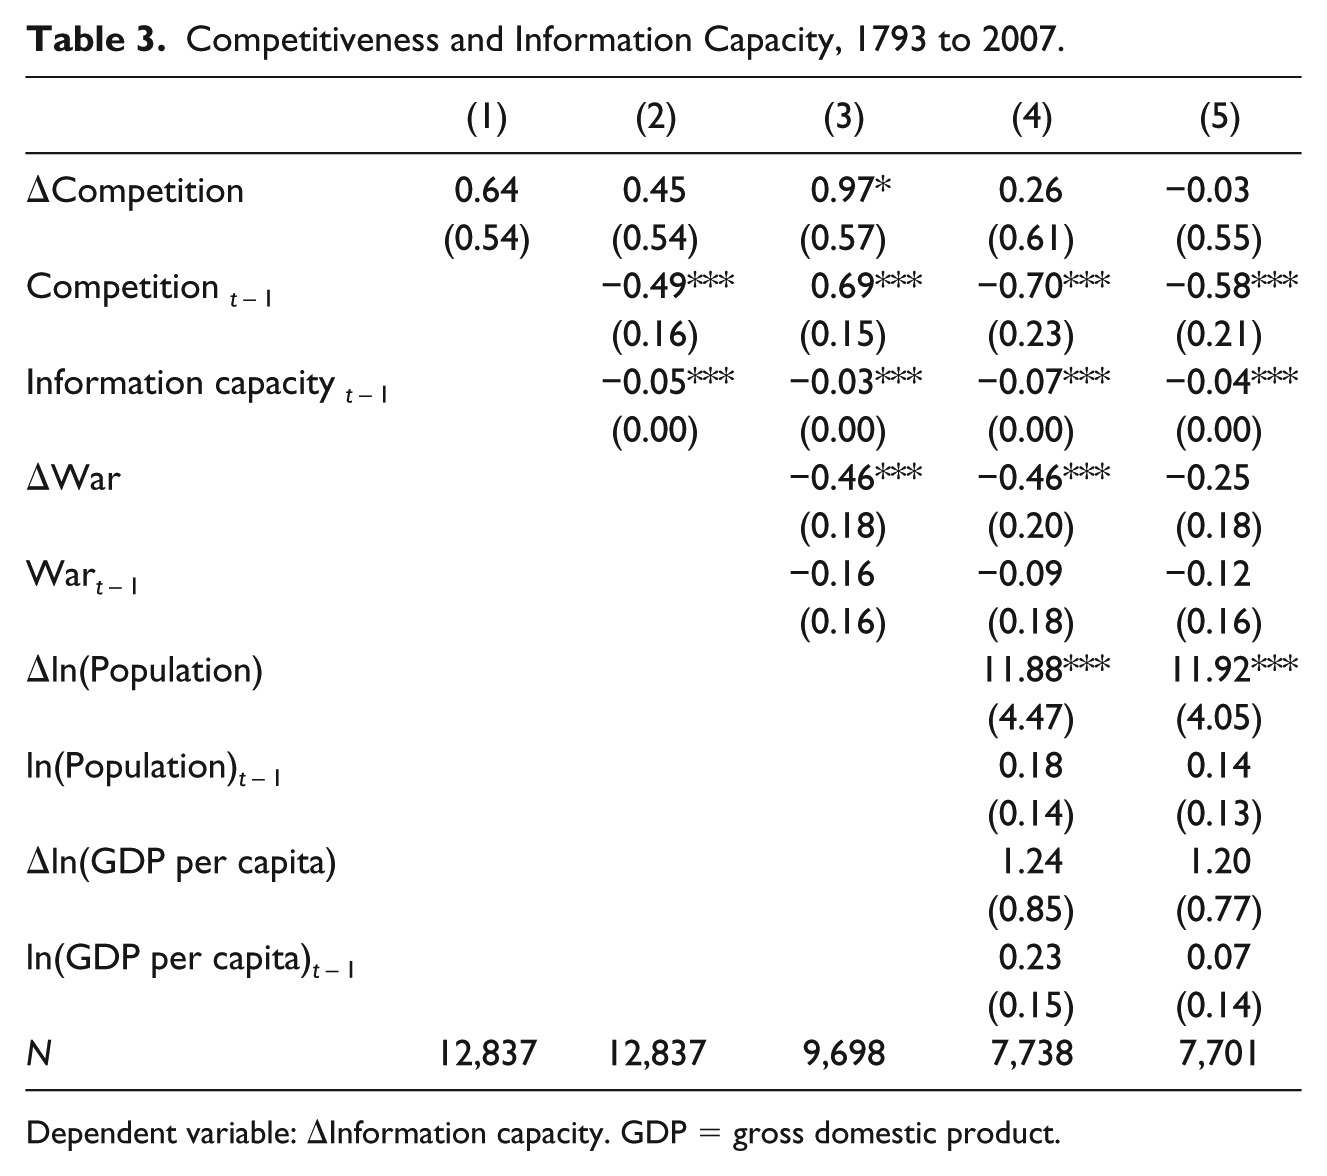
Table 3 repeats the same setup and models as Table 2, but replaces suffrage with electoral competition as the main explanatory variable. As the descriptive evidence suggested, the multivariate statistical analysis shows that competitiveness is not robustly linked with information capacity. The main conclusion that we draw from this evidence is that it supports a “logistical” interpretation of the relationship between democracy and information capacity: States expand their capacity to collect information when political participation becomes more broad-based, not when the level of democratic competition increases.
Competitiveness and Information Capacity, 1793 to 2007.
Dependent variable: ΔInformation capacity. GDP = gross domestic product.
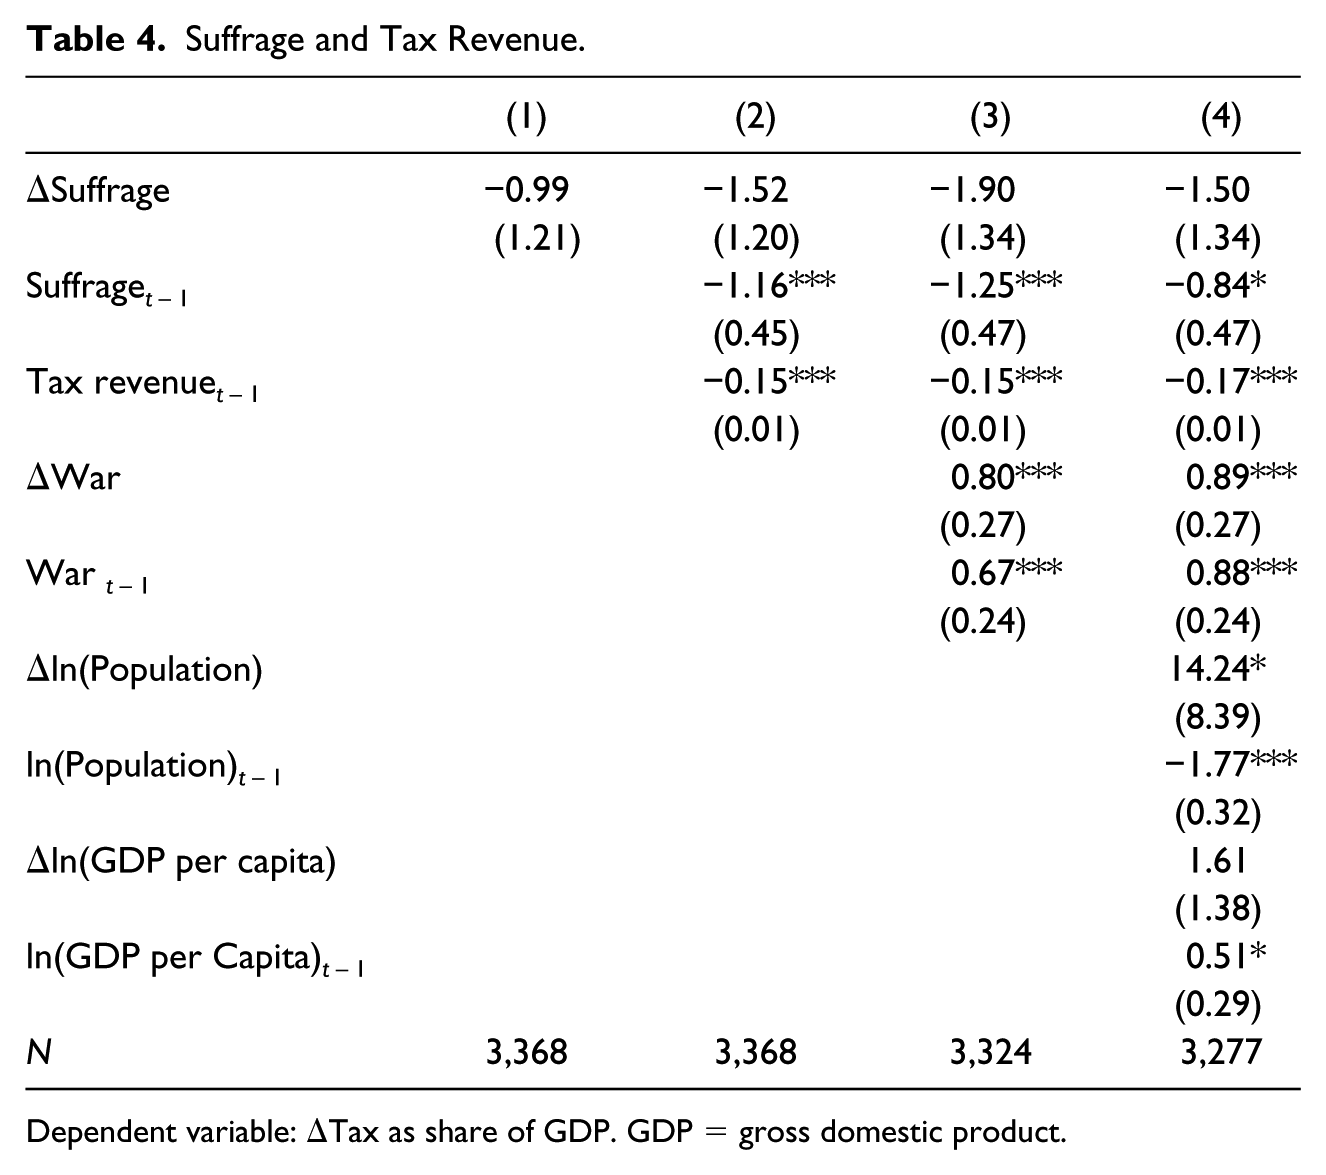
This logistical effect of extensions of the suffrage appears to be specific to the particular element of state capacity that we study in this article: information capacity. In Table 4, we again use suffrage as the main explanatory variable, but we now use a measure of central government taxes as proportion of GDP from Cagé and Gadenne (2018)—a commonly used indicator of fiscal capacity—as the dependent variable (Beramendi, Dincecco, and Roberts 2016; Besley & Persson, 2009; Kurtz, 2013; Lieberman, 2002; Soifer, 2012; Thies, 2006). As the table shows, suffrage extensions are, if anything, negatively related to “fiscal capacity,” as defined by aggregate central government tax revenue. It is also interesting to note that war, which was negatively related with information capacity, is positively related with tax revenue. Again, it seems clear that factors that contribute to state capacity are shaped by different historical processes.
Suffrage and Tax Revenue.
Dependent variable: ΔTax as share of GDP. GDP = gross domestic product.
When we examine cases in which increases in information capacity coincided with suffrage expansions more closely, we find two types of “information capacity builders”: 19th-century liberal regimes in Europe and the Americas that granted small suffrage expansions while also investing in early information technologies (mostly censuses and civil registries), and 20th-century mass-mobilizing regimes in Latin America and East Asia, which combined mass popular participation with limits on political competition.
In Latin America, the nationalist–populist regimes that rose to power in the 1930s and 1940s invested in information-gathering technologies and institutions, creating population registers to administer voter registration and regularizing the publication of censuses and yearbooks. We have already referred to such reforms for the Colombian case in the previous section. We find similar patterns in Bolivia, where the Movimiento Nacional Revolucionario of the 1950s undertook the first census since 1900, and in Brazil, where the government of Getúlio Vargas instituted the regular publication of statistical yearbooks in a context of popular mobilization and administrative rationalization (Souto de Oliveira, 2003). In Argentina, Juan Domingo Perón’s regime pushed for the creation of the national population register in 1948, months after the extension of suffrage for women. The new agency concentrated the tasks of citizen registration and electoral enrollment, relying on partisan and civic organizations associated with Perón’s regime to aid with these tasks (Barry, 2014, p. 25).
Mass-mobilizing regimes in East Asia, which dramatically expanded popular suffrage while restricting political competition, also invested in information capacity during this period. In China, the publication of the first yearbook (1947), the creation of the statistical agency (1952), and the first enumeration-based census (1953) followed the expansion of universal suffrage with the constitution of the Republic of China in 1947 (Goyer & Domschke, 1986, p. 601; Westfall, 1986, p. 130). In South Korea, the statistical agency was created in 1948 and statistical yearbooks began to be published in 1952, both in the aftermath of the partition of the peninsula and the suffrage expansions introduced in 1949 (United Nations Statistics Division, 2014). In Indonesia, the constitution of 1955 introduced universal suffrage. Shortly thereafter, the state implemented its first modern census and began publishing statistical yearbooks (in 1961 and 1957). The regimes that followed—Sukarno’s “Guided Democracy” (1959-1965) and Suharto’s “New Order” (1966-1998)—were far from competitive, but both relied on mass mobilization. As a result, they continued to invest in information-gathering technologies and institutions that could help them monitor and mobilize a large and diverse population (Slater, 2008, p. 264).
These findings speak to the added value of our new measure. A differentiated assessment of the resources that contribute to state capacity makes it possible to go beyond broad-stroke claims about states as “strong” or “weak” states. This allows us to better understand the historical processes that give states access to new resources. Whereas neoinstitutionalist arguments have suggested that competitive political institutions favor the long-term development of institutions for fiscal extraction, it seems to be the expansion of political participation, not competition, that shapes the information-gathering and information-organizing activities of states. The expansion of information capacity is, at least partly, a product of the logistical imperatives that mass-mobilizing regimes need to overcome: They are pushed, for practical and political reasons, to invest in the adoption of more sophisticated information-gathering techniques and institutions.
Conclusion
This article has introduced new data on the “information capacity” of 85 historical and contemporary polities from the French Revolution to the present. Among the resources states use when they implement their policies, information is one of the most important. We have, therefore, developed a new, quantitative measure of state efforts to collect, store, retrieve, and process information, relying on systematic comparative and historical data on five information-gathering activities: the regular implementation of a national census, the introduction of civil registers and population registers, the establishment of a permanent statistical agency, and the regular publication of statistical yearbooks.
The new data, which are publicly available, are likely to be useful for scholars in several disciplines, including political science, economic and social history, economics, and sociology. In our view, the most promising way forward for the empirical literature on state capacity is to measure the resources that contribute to high levels of state capacity, as opposed to attempting to measure state capacity per se. In some circumstances, it may be possible to use information capacity as a proxy for overall state capacity. Our main advice for those who use the new data, however, is to combine them with data on other key state resources, such as the state’s ability to generate revenue.
Scholars who use the new set of data may also want to consider other ways of aggregating the detailed data on censuses, civil registers, population registers, statistical agencies, and statistical yearbooks. For example, the estimates of “information capacity” that are reported in the article reflect the amount and quality of current information about the population and territory that is available to governments, but for other applications, it may be more appropriate to estimate the “stock” of information that governments have accumulated over longer periods of time.
In addition to compiling evidence on censuses, civil registers, statistical agencies, statistical yearbooks, and population registers and aggregating that evidence into a combined, numerical measure of information capacity, this article has demonstrated the usefulness of the new data by describing the historical development of information capacity in different parts of the world and by identifying important nuances in the characterization of individual countries. We have shown, for instance, that some states that are traditionally regarded as “strong” have, at times, had relatively low information capacity, whereas other states that are traditionally regarded as “weak” have, at times, had high levels of information capacity.
We have also analyzed the empirical relationships between democratic institutions and the development of information capacity over a period of more than 200 years, showing that different resources that contribute to overall state capacity are shaped by different historical processes. We find a robust relationship between extensions of the franchise and increases in information capacity, but no such relationship between political competition and information capacity. If there is a link between democracy and the ability of states to gather and organize basic information about themselves, their territories, and the populations they govern, it is, therefore, likely to be because political regimes that depend on mass mobilization and broad-based political support have logistical needs that push them to improve their ability to collect, store, retrieve, and process information.
Supplemental Material
Replication_Brambor_Goenaga_Lindvall_Teorell – Supplemental material for The Lay of the Land: Information Capacity and the Modern State
Supplemental material, Replication_Brambor_Goenaga_Lindvall_Teorell for The Lay of the Land: Information Capacity and the Modern State by Thomas Brambor, Agustín Goenaga, Johannes Lindvall and Jan Teorell in Comparative Political Studies
Supplemental Material
Supplementary_Materials – Supplemental material for The Lay of the Land: Information Capacity and the Modern State
Supplemental material, Supplementary_Materials for The Lay of the Land: Information Capacity and the Modern State by Thomas Brambor, Agustín Goenaga, Johannes Lindvall and Jan Teorell in Comparative Political Studies
Footnotes
Acknowledgements
We are grateful to Moa Olin and Dragana Paunović for excellent research assistance. We are also grateful to participants at the APSA 2017 Annual Meeting and the EPSA 2018 Annual Meeting; seminar participants at Lund University, Harvard University, University of Gothenburg, Stockholm University, University of Southern Denmark, and University of Vienna; Mark Dincecco; Anna Grzymala-Busse; Lucas Leemann; Yuhua Wang; and three anonymous reviewers for their comments and advice. The data used in the article are available as replication files and at the website: ![]() .
.
Declaration of Conflicting Interests
The authors declared no potential conflicts of interest with respect to the research, authorship, and/or publication of this article.
Funding
The authors disclosed receipt of the following financial support for the research, authorship, and/or publication of this article: Research for this article was made possible by funding from Riksbankens Jubileumsfond, Grant M14-0087:1, which financed the project “State-Making and the Origins of Global Order in the Long-Nineteenth Century and Beyond” (STANCE).
Notes
Author Biographies
References
Supplementary Material
Please find the following supplemental material available below.
For Open Access articles published under a Creative Commons License, all supplemental material carries the same license as the article it is associated with.
For non-Open Access articles published, all supplemental material carries a non-exclusive license, and permission requests for re-use of supplemental material or any part of supplemental material shall be sent directly to the copyright owner as specified in the copyright notice associated with the article.