
Abstract
The leaders of business are a continued focus of interest in management research and in the broader society. Their attributes speak to social mobility, inequality, and who holds positions of power and influence in society. This article examines the attributes of the ten highest-ranked executives of the largest corporate enterprises in the United States—the Fortune 100—and compares how they have changed over the past 40 years, a period when many assumptions about businesses and the people who run them have changed. While there has been significant change in some areas, such as the increase in the proportion of women and foreign-born executives and the rise in outside hiring, there is no evidence of an increase in younger leaders who advance faster than their predecessors and spend an ever-shorter time with their employer. In fact, top executives now are as old as their peers were in the 1950s, and their tenure with their employer is rising.
Knowing what the attributes of the executives actually are and whether these claims and others like them are true informs management scholars about social mobility, inequality, and more generally about who holds the power and influence in society. For example, knowing whether today’s top executives are from a broader spectrum of socioeconomic backgrounds than in the past can tell us something about the accessibility of these positions to a wider population. The changing characteristics of top executives can also inform us about organizational outcomes. For instance, if it is true that younger CEOs are less risk-averse, it matters for understanding business whether they are getting younger. Changes in the characteristics of those who lead corporations can also inform us about how the needs of the corporations have changed over time. Research as to how business decisions are affected by who their leaders are is also informed by knowing how those attributes have changed.
We document the attributes of the leaders of the largest corporate enterprises—the Fortune 100 and roughly 4,000 executives in all—over the past 40 years, a period when many assumptions about businesses and the people who run them also changed. We address two main questions. First, how have the demographic characteristics of those who got to the top changed across the years? We use changes in the overall U.S. population as a baseline to understand whether the changes we observe in the attributes of top executives are simply a reflection of the changes in the population. Our results support some of these assertions—for example, corporations are becoming more inclusive in terms of the type of individuals who have access to top jobs, at least in terms of including women and immigrants. But they also contradict others, such as the belief that executives are getting younger.
Next, we explore the question of “How did they get there?” by comparing attributes related to the career paths individuals took to get to the top. Our findings provide strong support for the claim that the lifetime employment model is over even in the biggest corporations. Over the decades, for example, experience and time in other companies have become more important in getting to the top. But other evidence suggests that many of our assumptions about changes in top leaders are not true. For example, they are no longer getting to the top jobs faster. Overall, the biggest changes were in the early 2000s, and there have been some important reversals in other changes since then. Finally, we attempt to explain why those changes occurred, drawing on the notion that they were tied to changes in the needs of those companies across the 40-year time period we explore.
Related Literature
Research on the Evolution of Executive Attributes
The attributes of top corporate leaders changed considerably over the first half of the twentieth century and in retrospect suggested conclusions about how business needs drove those changes. To get to the more recent period, it is first useful to examine the historical record to see the conclusions about prior changes.
Gregory and Neu 8 looked at the business leaders just before the beginnings of the modern corporation in the 1880s and found that most of them had inherited money, which allowed them to start companies or invest in them and become their leaders. Miller 9 examined the backgrounds of 190 of the most elite executives—Presidents and Chairmen of Boards of Directors of the largest companies in the most important industries—two decades on in 1900-1910 and found that most were now professional managers. But Joslyn and Taussig 10 examined 7,371 corporate directors, a broader and slightly different group arguably less engaged in actually running businesses and more in overseeing them. They found that in the 1920s the vast majority had fathers who were also businessmen. This suggested less social mobility than in the Miller 11 study. They also found that 11% had fathers who were laborers. In a classic illustration of assuming the conclusion, they asserted that the finding about laborers showed that the system was meritocratic in that it was possible to work one’s way to the top: there were simply more good candidates in the upper classes.
A simple explanation for these changes and the shift away from owners to professional managers begins with the obvious point that U.S. corporations soon outlived their founders, which forced succession events, and competent family members were not always waiting in the wings to take over. More important, corporations grew so fast that they outstripped the ability of owners to run them alone. These studies informed the classic conclusion by Berle and Means 12 that ownership became separated from control with the rise of professional management.
In the 1950s, when large corporations were fully established, Warner and Abbeglan 13 documented in detail the attributes of these professional managers by looking at the background and careers of 8,300 corporate executives. They found roughly half of the executives were college graduates (three-quarters had attended college), and 20% had gone on to graduate school in an era where only about 5% of the population had college degrees. They were not just professional managers, they were educated, typically in fields like engineering that had practical relevance for business. Newcomer 14 undertook a systematic comparison of the very top executives—Presidents and Board Chairmen—for the largest companies over time, in 1900, 1925, and 1950. She found a sharp decline in nepotism, especially where sons worked for their fathers, from 26% to 10%, and a shift over time to the internal development of leaders: only 20% of these very top leaders were lifetime employees in 1900 but by 1950 that number had risen to 80%. The percentage who retired in the company rose from 10% to 47% over the same period, which suggested something new, the issue of planned succession.
The shift from outside hiring to the internal development of executives documented in the above studies reflected the shortage of leaders after WWII when so many retired, when any internal “pipeline” was disrupted by men being away during the war effort, and when corporations boomed after the war, creating the need for more executive roles to oversee them. 15 Arguably, the last major study of executives and their attributes was Kanter’s 16 investigation of the pseudonymous “Indisco” corporation. It documented this internal pipeline model at its peak, how the bureaucratic processes of internal development and planned succession for all executive roles replicated the attributes of the prior generation of executives in the next wave such that little changed.
Since then, studies as to who are the corporate executives have largely paused. The few exceptions focus only on CEOs 17 or the three highest executives 18 and the data stopped in the early 2000s. 19 Our evidence is unique in that it extends from 1980 to 2021 and goes down into the organization to the top ten executives in the 100 largest U.S. corporations. It also includes aspects of their prior experience before becoming an executive. Again, our goal is to see how the attributes of those in top executive roles changed over time, focusing on changes in their demographics and career trajectories, and then reflect on what those changes might reveal about changes in business throughout the period.
Contemporary Research Related to Leader Attributes
The literature on succession planning
As noted above, questions about the attributes of executives in corporate roles appear settled or moribund from the 1950s onward: executives were grown from within according to the needs of each company. Attention shifted to the process of internal advancement: “succession planning.” Virtually, all recent studies have bemoaned how little new information we have about how succession actually works, particularly understanding the factors that determine who advances. 20 Howard and Bray’s 21 detailed account of AT&T’s career development and succession planning system that followed executives from 1956 was a major exception in focusing on the psychological attributes used to predict advancement in that one company. Since then, the limited literature has focused mainly on CEOs and specifically on whether they were internal or external hires. 22 Wiersema, Nishimura, and Suzuki’s study 23 is one of the few to include a look at the attributes of CEOs in those internal versus external decisions.
The brighter spot in research was the shift toward topics associated with business strategy that came after 1980 with the increased hiring of CEOs from outside. Here the studies focused on how company needs shaped succession events for individual CEOs. Among the first of these studies in management was Chagant and Sambharya 24 on how the different business strategies of companies in the tobacco business affected their use of outside hiring and whom they hired. The recent literature review by Nyberg, Cragun, and Schepker 25 finds evidence for a wide range of organizational factors specific to individual companies that influenced who got to the CEO job, such as corporations with greater ethics priorities disproportionately advancing leaders with degrees from religious schools. We still know little about executives below the CEO, however, and nothing systematic about the attributes of the population of top executives since the 1950s.
The literature on strategic leadership
Another literature reversed the causal arrow and asked how the attributes of the executives per se affected how the corporations acted. This literature takes the attributes of top executives as given and asks how the variance in their attributes might affect their behavior. This would not seem to be a particularly interesting question if executives were groomed to fit the needs of the companies. But the post-1981 economic restructuring, widespread industry deregulation, and other changes that were not anticipated when the current leaders were promoted represented new challenges and something like a natural experiment: How did the attributes of those leaders affect their decisions on these new challenges and, in turn, influence what their corporations did?
Hambrick and Mason 26 legitimized and organized thinking about the notion that the attributes of leaders and leadership teams had an independent effect on business strategy. This new literature highlighted the importance of CEO attributes on business outcomes. For example, the age of the CEO was associated with risk-taking and other decisions. 27 The formal education of the business leaders, both the level of their degrees and the subject matter, was associated with their decisions 28 as was their social class as measured by their affiliations, 29 their tenure in their roles, 30 the functional aspects of their career experience, 31 and their international experience and exposure. 32 Subsequent studies under the upper echelons heading saw causation running both ways, from business needs to leader attributes and from those attributes to subsequent decisions. 33
The extensive body of research using top leaders shows that the attributes of CEOs reflect the needs of corporations and that the attributes of CEOs can shape organizations. In this article, we complement these studies by taking a careful look at the evolution of executive characteristics over time and in the process raise new questions for future research.
Our Research Agenda
Changing Business Context
We use a consistent approach to identify equivalent executive roles across equivalent companies over the past 40 years including periods when important changes in business and society occurred. We do so by hand-coding information about the background and experiences of the top ten executives in the Fortune 100 companies as determined by their organizational charts in 1980, 2001, 2011, and 2021, for a target pool of 4,000 executives. Our research agenda is to understand changes in a much longer period than what has been covered by other researchers. 34 Companies during this period experienced very different challenges (as we describe below), which suggests that we may see different executive profiles. Many companies were featured in the Fortune 100 ranking at all the four time points, which enables us to explore changes in executive attributes within companies as well as across them.
There are many contemporary histories of business that focus on corporations and their actions. 35 Most of them recognize that the 1980s represented a fundamental break in corporate practices in part because it followed important changes such as the deregulation of core industries (transportation, parts of finance), rising foreign competition in manufacturing (especially from Japan), and a particularly steep recession in 1981. Arguably, the biggest change was the rise of the shareholder value movement as a guiding principle for operating corporations and away from the stakeholder model of equal responsibility to employees, customers, and the community. 36 We therefore begin our study by examining the executives in place in 1980, just before these developments began, when the era of bureaucratic practices for internal succession of leadership was firmly in place.
The shareholder value mission also helped kick off a related development, which was a much more serious approach to corporate governance. Before the 1980s, corporate boards were mainly made up of officers from that corporation, and the arrangement with the company leaders was clubby and accommodating. After that period, boards were much more likely to contain outsiders who increasingly advocated for shareholder interests in the form of better financial performance. 37
Perhaps, because of the shareholder value push for more profits, corporations sought out a new avenue for competitiveness in corporate strategy, which involved acquiring operations through mergers and acquisitions, joint ventures, and also divestitures and the selling off of operations that no longer fit the apparent competitiveness of the corporation. The pressure to change businesses in the pursuit of better financial returns—in a more dynamic competitive environment that included more international competitors—led to the first widespread layoffs of white-collar workers in the 1980s, the widespread shutting down of some operations, and the creation of new ones, a development referred to as “restructuring” as opposed to simply shrinking down.
Administering the vast bureaucracy of complex conglomerates before the 1980s (where size was an explicit goal) was certainly a challenging exercise, but it was quite different from the post-1980s pursuit of profit relentlessly through new approaches like corporate strategy and restructuring to chase opportunities in different markets. It would not be too surprising if the pre-1980s leaders, who had been prized for their loyalty and experience with their company, were not well-suited to this new context. The post-1980s tasks of focusing on shareholder value in the context of more aggressive corporate governance (relying more on corporate strategy and restructuring for competitive advantage) appear to remain important through the present period. We therefore expect to see continued differences in the attributes of executives post-1980 from those in 1980. We examine executives next in 2001, a long enough period to observe important changes since 1980.
Given that the pressure for shareholder value and corporate restructuring has not changed, we should expect that the pressure to have leaders suited to meet them will continue. The more challenging question is what—if any—unique differences we might expect to see in the next decade, from 2001 to 2011. There were many important world events in the period 2001 to 2011 such as the 9/11 terrorist attacks, but in business, the most persistent and influential challenges arguably came from financial crises. The beginning of the decade saw the Enron and WorldCom financial fraud debacles, the associated collapse of the Arthur Andersen accounting firm, and evidence of widespread fraud among research analysts. This led to new and tougher regulations, including the Sarbanes-Oxley Act, which mandated much more stringent corporate governance standards. The end of the decade saw the 2008-2009 banking crisis, also associated with financial malfeasance, trigger the worst economic recession since the Great Depression. 38 How much influence the post-2008-2009 “Great Recession” had in shaping new executives in place between then and 2011 is not so clear, but the common theme of a concern about financial oversight, risk management, and corporate governance carried across the entire decade.
The period from 2011 to 2021 featured less trauma, at least until the 2020 COVID-19 pandemic. There is no evidence that the pandemic led to a push for new leadership in 2021, however, as most organizations were struggling for stability. Slow but reasonably steady recovery from the financial crisis appeared to be the dominant theme in the economy. On the social front, though, bigger changes were afoot, noticeably the push for greater gender equity, for greener operating practices, and for greater social responsibility generally. Greater challenges might well be associated with a perceived need for different leaders with different attributes and skill sets. Companies might have moved toward showing more diversity at the top in terms of at least visible attributes such as women or immigrants. In addition, companies might have moved toward having more MBA graduates who come to the organization with a skill set that arguably changes over time faster than what typical non-MBA executives might have had.
The Fortune 100 Companies
Our executives come from the Fortune 100, the largest companies based on their total revenues for the previous year. Table 1 includes information on the characteristics of the Fortune 100. We examined the top ten executives within each company. Because organizational charts are not identical, we work down each company’s organizational chart to identify what the top ten roles are. The appendix contains a detailed description of the data and how we compiled it.
Characteristics of the Companies in the F100 List.
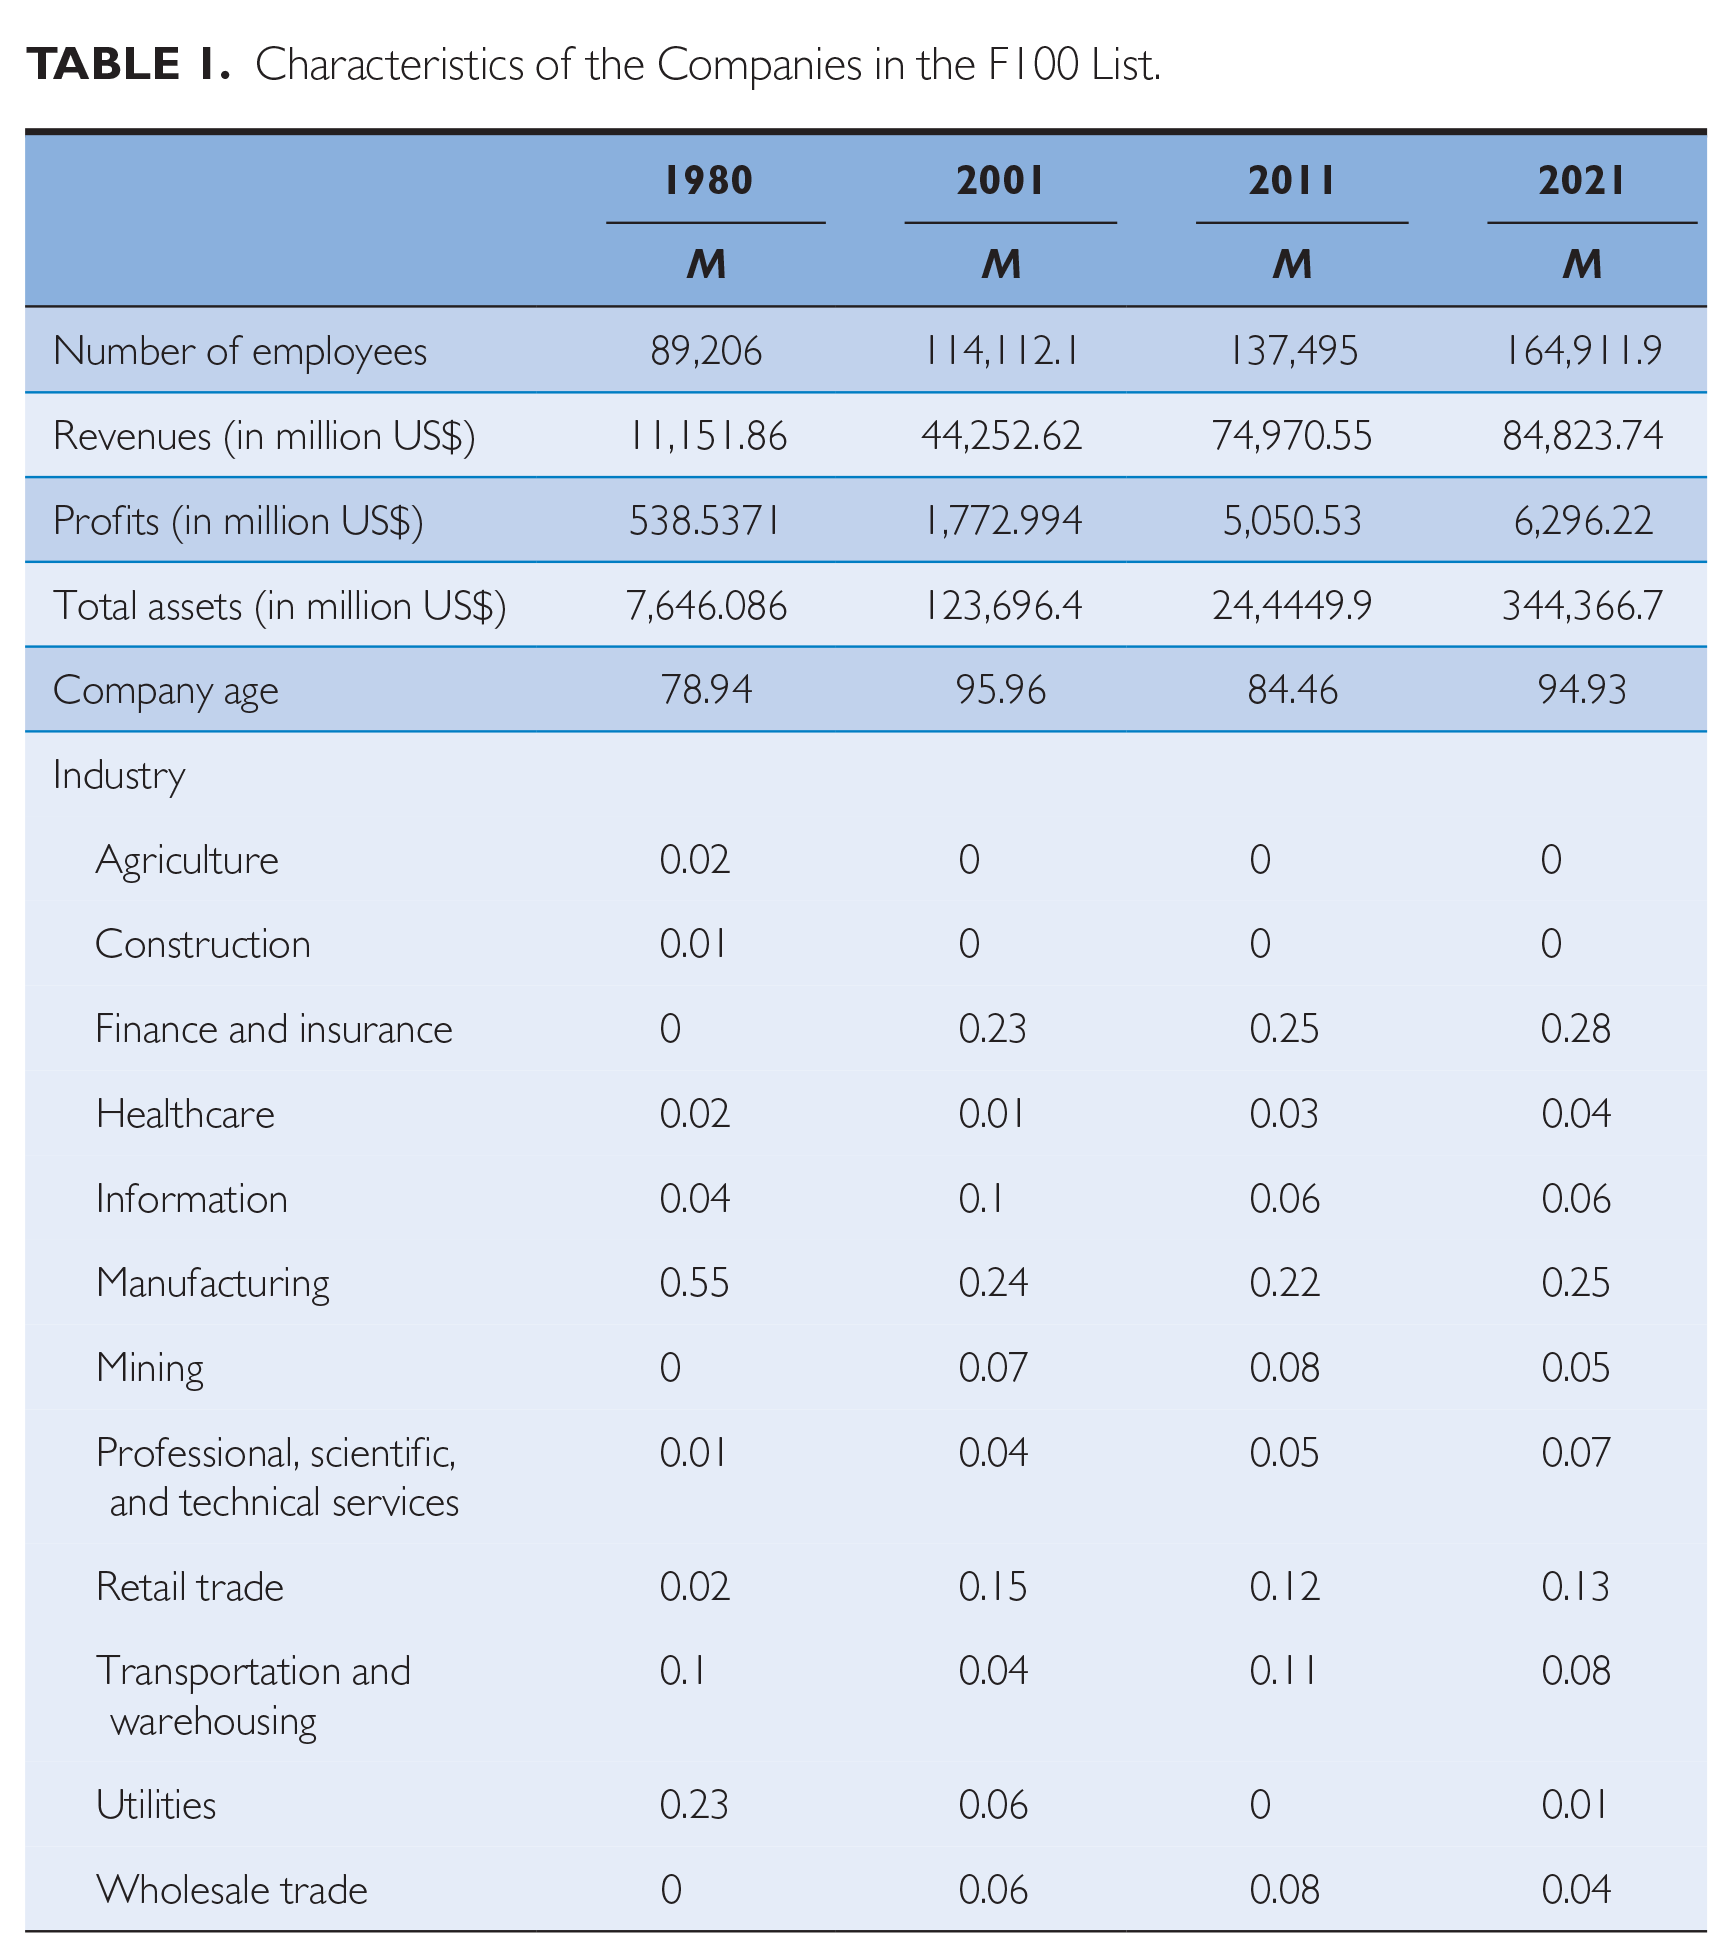
An issue to address here is the index number problem: Because the companies on the Fortune 100 list change somewhat each year, to what extent are changes in the attributes of executives due to changes within each company versus changes in the nature of the companies represented in each period? Specifically, there is a common assumption that tech companies are increasingly dominating the Fortune 100 company list, that the Fortune 100 companies should be on average younger as a result, and differences in the attributes of the top 1,000 leaders may well reflect differences associated with young companies.
That is not the case. The Fortune 100 in 2021 are on average 16 years older than in 1980 (95 vs. 79 years). Nor have they shrunk over time because of divestitures and outsourcing, at least in terms of revenue and profits. They have on average almost twice as many employees in 2021 as they did in 1980 and are three times more profitable in real terms. Nor have tech companies come to dominate the list. Finance and insurance and manufacturing are the most prominent sectors. 39
Who Got to the Top? Exploring Changes in Demographic Attributes
We examine the attributes of executives next, beginning first with the basic demographic characteristics of these top leaders and whether they differ over time. The attributes of top executives are related to the broader populations from which they come such that changes in those populations over time are likely to reflect changes in the attributes of the top executives as well. A simple explanation for any change in the attributes of the executive population, therefore, might be that the attributes of the overall population from which they are drawn changed. If that is not the case, then any changes we see in executives are more suggestive of something specific to the needs of the business driving the changes.
The aspect of demographics among top executives that in recent years has gotten the most attention is arguably gender. The fact that women are a much smaller proportion of the executive ranks, especially the top executive ranks, than they are of the workforce as a whole is well known. Our interest here is to look at how the proportion of women executives changed across our four time periods.
One of the explanations as to why the proportion of women in the top executive ranks is so low is the “pipeline” problem. The smaller number of women in corporate jobs in the levels below the top executives (from which top executives are drawn) made it more difficult to promote more women into those top jobs. Why that population is not larger is, of course, a different and important question as it is within the control of the organization. But in the absence of those efforts, we might imagine that the proportion of women in the executive ranks is at least affected by the proportion of women in the ranks below.
If we look at the proportion of women in management roles in the United States in the early 1980s, it was 23%, while the proportion in any executive role, a much broader category than the top executive ranks we examine here, was 11%. 40 By the early 2000s, those proportions increased by roughly one-third to 31% and 15%, respectively. The Census categories changed somewhat in the 2020s and no longer report data separately for executive roles, but women account for 40% of all management occupations, which appears to represent another one-third increase over 2011. 41
When we look at our top executive data, it is no surprise to find that the percentage of women in the top executive ranks in the Fortune 100 rose considerably in 2001 given that it started at zero in 1980, even though, as noted above, 11% of executive roles across the economy were held by women. From 2001 to 2011, the proportion of women in our Fortune 100 top executive ranks rose by about the same percentage as the proportion of women in all management roles, about one-third. But something changed between 2011 and 2021. The proportion of women in all management ranks again rose by one-third, but the increase in the proportion in our top executive positions was substantially greater, roughly double that at 60%. This suggests that these companies felt special pressure to do something to improve their gender distribution.
Next, we consider the proportion of foreign-born business leaders among the executives, which perceptions noted above suggest changed. Is that true? We might expect that it should have done so simply because of the increase in the proportion of the U.S. population that is foreign-born. The lowest proportion in U.S. history was in the 1970s at 5% of the population, roughly the same level in 1981. By 2001 that had doubled to 10%, and by 2011 it was just under 14% where it remained in 2021. 42 If foreign-born top executives in the Fortune 100 matched the population, we would expect their proportion to double to 10% between 1980 and 2001 and then to rise to 14% or so in 2011 and stay constant in 2021. In fact, the percentage was only 2% in 1980, and it jumped fourfold to 8% in 2001. The increase in foreign top executives from 2001 to 2011 (from 8% to 11%) was actually smaller than the rise in the population (from 10% to 14%). In 2021, though, the percentage of foreign top executives continued to increase to 15% while the foreign-born population remained unchanged. Something important appeared to happen before 2001 and between 2011 and 2021 that made the numbers of foreign-born executives jump up.
Education levels are arguably the most important attribute of human capital in research studies, and in the world of business. The MBA degree has probably been the marker for education that is uniquely tailored to meeting business needs. If we look at the incidence of MBA degrees in the population, degrees are typically counted in the year when they are awarded. For our executives, that might be 25 years before they attained their executive role: assuming for convenience that MBA students graduate at roughly age 25 and top executives have an average age of 50 years, then our 1980 executives were drawn from a population that would have received MBA degrees roughly around 1955. Each of the other cohorts would be drawn from a population that received their degrees roughly 25 years before as well, that is, 1976 for the 2001 cohort, 1986 for the 2011 cohort, and 1996 for the 2021 cohort.
When we look at our top executives, educational credentials in the form of MBA degrees increased far more slowly from 1980 to 2001 than in the relevant population: they rose 14 times in the population (again measured from 1956 to 1980 when the relevant executives would have earned them) but only modestly in the executive ranks, from 13% to 29%. 43 From 2001 to 2011, MBA degrees overall increased by 50% (this time from 1956 to 1980), but their increase in the executive ranks was again more modest, only three percentage points from 29% to 32%. Top executive MBA grads in 2021 once again grew modestly compared with 2011, up only three percentage points from 32% to 35%, whereas their numbers in the population rose five percentage points. These Fortune 100 companies appear to have been less interested in MBAs for executive roles than the increase in the broader economy suggests.
But where those MBA degrees were earned mattered more. The Ivy League business schools, associated with higher social class in terms of the income and social status of their students, had a long head start on other MBA programs. There were five Ivy MBA programs in 1955 (Columbia, Cornell, Dartmouth, Harvard, and Wharton). It is difficult to trace back the size of those Ivy League programs in that period, but it is not too difficult to imagine that they accounted for a considerable share of the 3,300 total degrees that year: If the Ivy programs were even half the size that they are now—they total 3,680 graduates in 2021 (with the addition of Yale, which added an MBA degree later)—they would still account for more than half of all MBA degrees around 1955 when the 1980 cohort would have access to them. But they should be a trivial share by the end of the period given the massive growth in MBA programs that came from new programs at other schools.
Even if we assume that the Ivy programs were the same size in 1980, 1991, and 2001 as they are today, they would have represented only 8% of MBAs in the 2001 population, 5% in 2011, and 3.6% in the 2021 population. What we see instead, though, is striking. In 1980, the elite MBA programs associated with Ivy League institutions accounted for 45% of those degrees for the executives in our sample, roughly in line with our guess as to their percentage of all MBA degrees 25 years earlier. By 2001, however, Ivy degrees represented less than 8% of all MBA degrees (calculations based on 1976 data) and yet they still accounted for 25% of the MBAs for the top executives in the Fortune 100. In 2011, Ivy degrees accounted for 5% of all MBA degrees awarded in the United States and 23% of MBA degrees in the Fortune 100 executive ranks. In 2021, the share of Ivy degrees dropped to 3.6% but remained at 23% in our sample. (The decline in elite MBA degrees among the top executives was mostly offset by a rise in the percentage of MBA degrees from state universities in the United States, from 18% in 1980 to 31% in 2021.) In short, even though the share of Ivy MBA grads declined, the preference for them had to have increased dramatically given how much rarer they were in the population.
How Did They Get to the Top? Exploring Changes in Career Trajectories
We turn now to examine the career paths of the top 1,000 executives in each decade. The attribute of executive careers that arguably received the most attention is the perception of job-hopping, more literally employer-hopping, and the view that the path to the top is now much more likely to come by changing employers than staying with the same one.
The percentage of employees who were lifetime employees dropped in every period in our data, especially between 2011 and 2021. Interestingly, lifetime employees now constitute the same percentage of top executives as Newcomer (1950) found in 1900. Hopping directly into an executive role from outside rose in every period but not for the most recent one, 2011 to 2021. The number of different employers where these executives worked also rose each decade, especially in 2021 over 2011: from 2.2 in 1980 to 3.3 in 2021, a 50% rise. The number of years the executives were working elsewhere before being hired at their current company jumped by a third over that same period, from ten to 15. These results strongly support the view that job-hopping had and continues to increase.
Another common perception is that employees with real ability rise to the top faster now, or put differently, spending time in jobs is less important for advancement. From 1980 to 2001, the average time it took for an executive to get into a top ten executive role from their first full-time job fell from 28 years in 1980 to 26 years in 2001. That decline was due to current employees being promoted into the executive suite within their company faster—by about four years—even though they had worked elsewhere a year longer than in 1980. That fact seemed consistent with the notion that merit may be leading to faster promotion. But in 2021, the time to the top is back close to 28 years, where it was in 1980. Similarly, executives also got younger as the average age fell considerably from 56 years in 1980 to 51 in 2001, much as some observers thought (see Table 2, Panel A). But it has completely reversed since then and is back up to 55 in 2021 even as the talk about needing younger leaders is intense with claims about needing “digital natives” who would have grown up with IT, who have views more aligned with new “generations,” and so forth. 44 Interestingly, age 55 for the current top executives is almost identical to the average age that 45 found among corporate executives soon after WWII. Comparisons across years using a t-test with Bonferroni correction indicate that age was significantly lower in 2001 and 2011 than in 1980, but not in 2021.
Demographic Characteristics of Top Executives in F100 Companies Across Years.
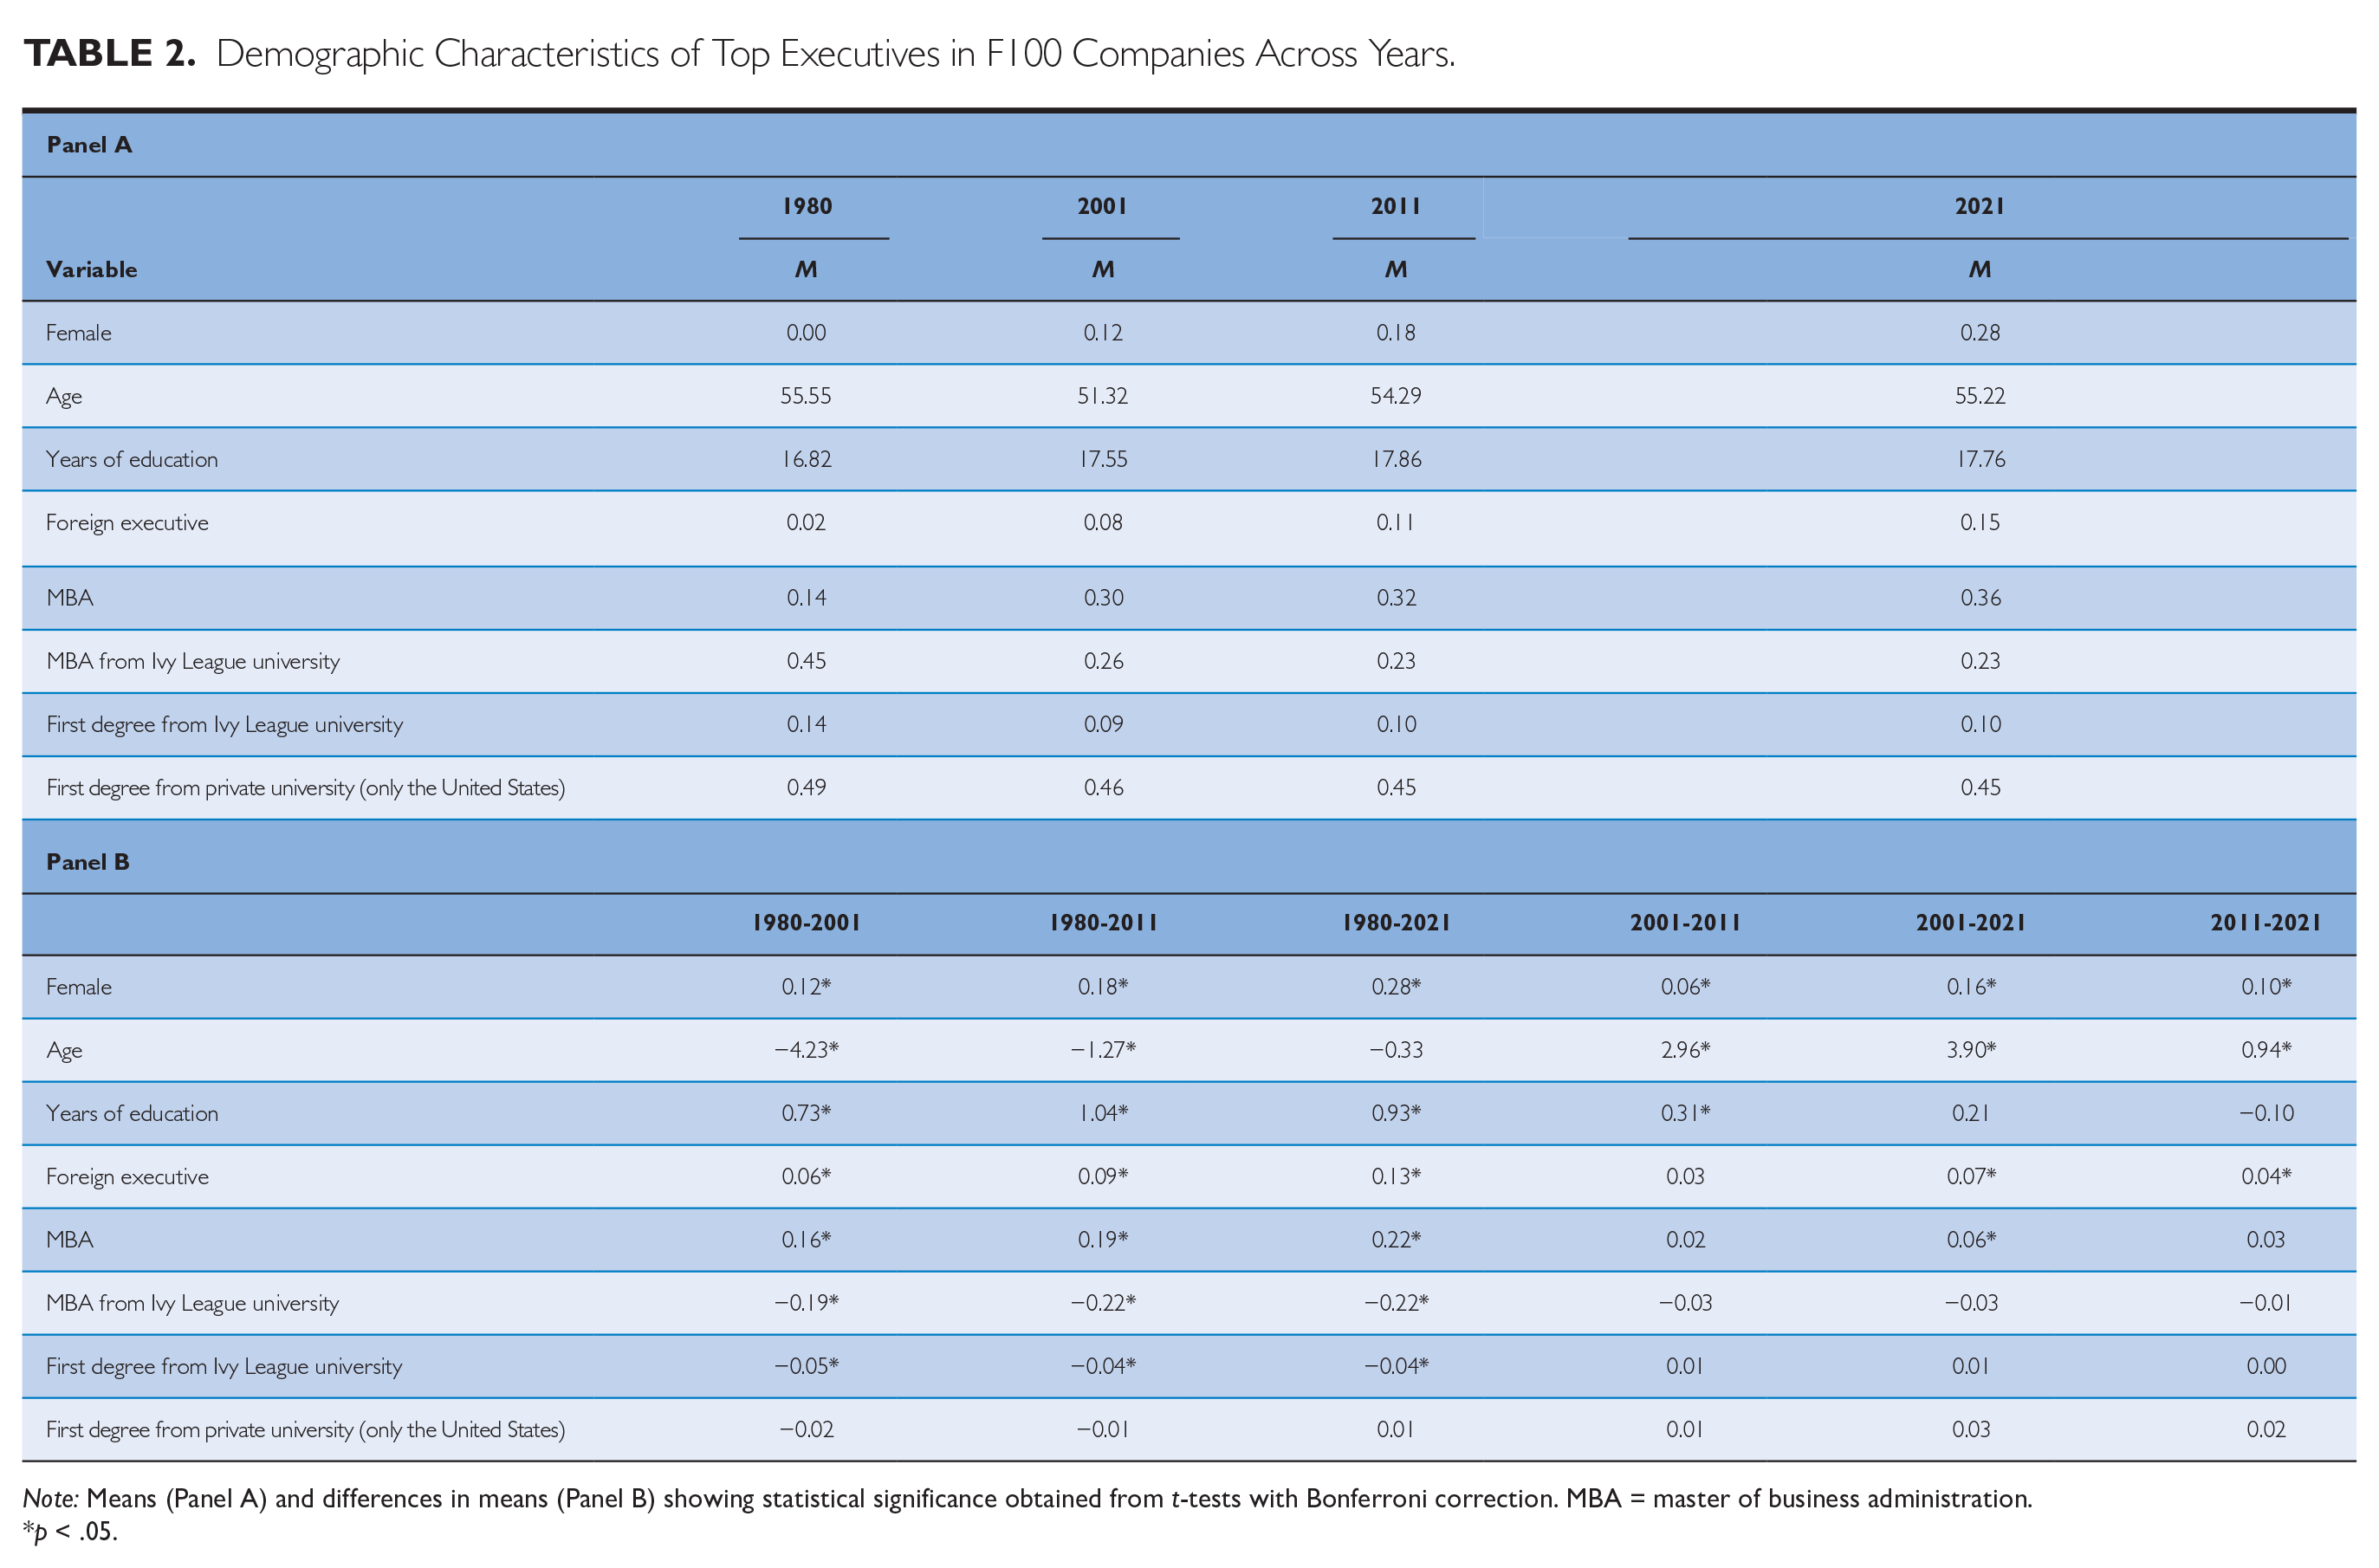
Note: Means (Panel A) and differences in means (Panel B) showing statistical significance obtained from t-tests with Bonferroni correction. MBA = master of business administration.
p < .05.
Table 3 displays information on executive career trajectories. Tenure with one’s current employer declined from 1980 to 2001, as we might have expected, but appears to have stopped declining in 2011. Tenure in the current role fell by half from 1980 to 2001 but rose again in 2011 near where it had been in 1980. The main difference in 2011 is that executives spent more time elsewhere and less time in their current company before becoming an executive. Job-hopping may be up, but executives are not cruising through their prior jobs the way they did in 2001. The fact that they have 50% more years of experience elsewhere now than in 1980 suggests that companies are less interested in finding candidates with potential and developing them and more interested in finding outsiders who can move into executive jobs sooner.
Career Trajectory Characteristics of Top Executives in F100 Companies Across Years.
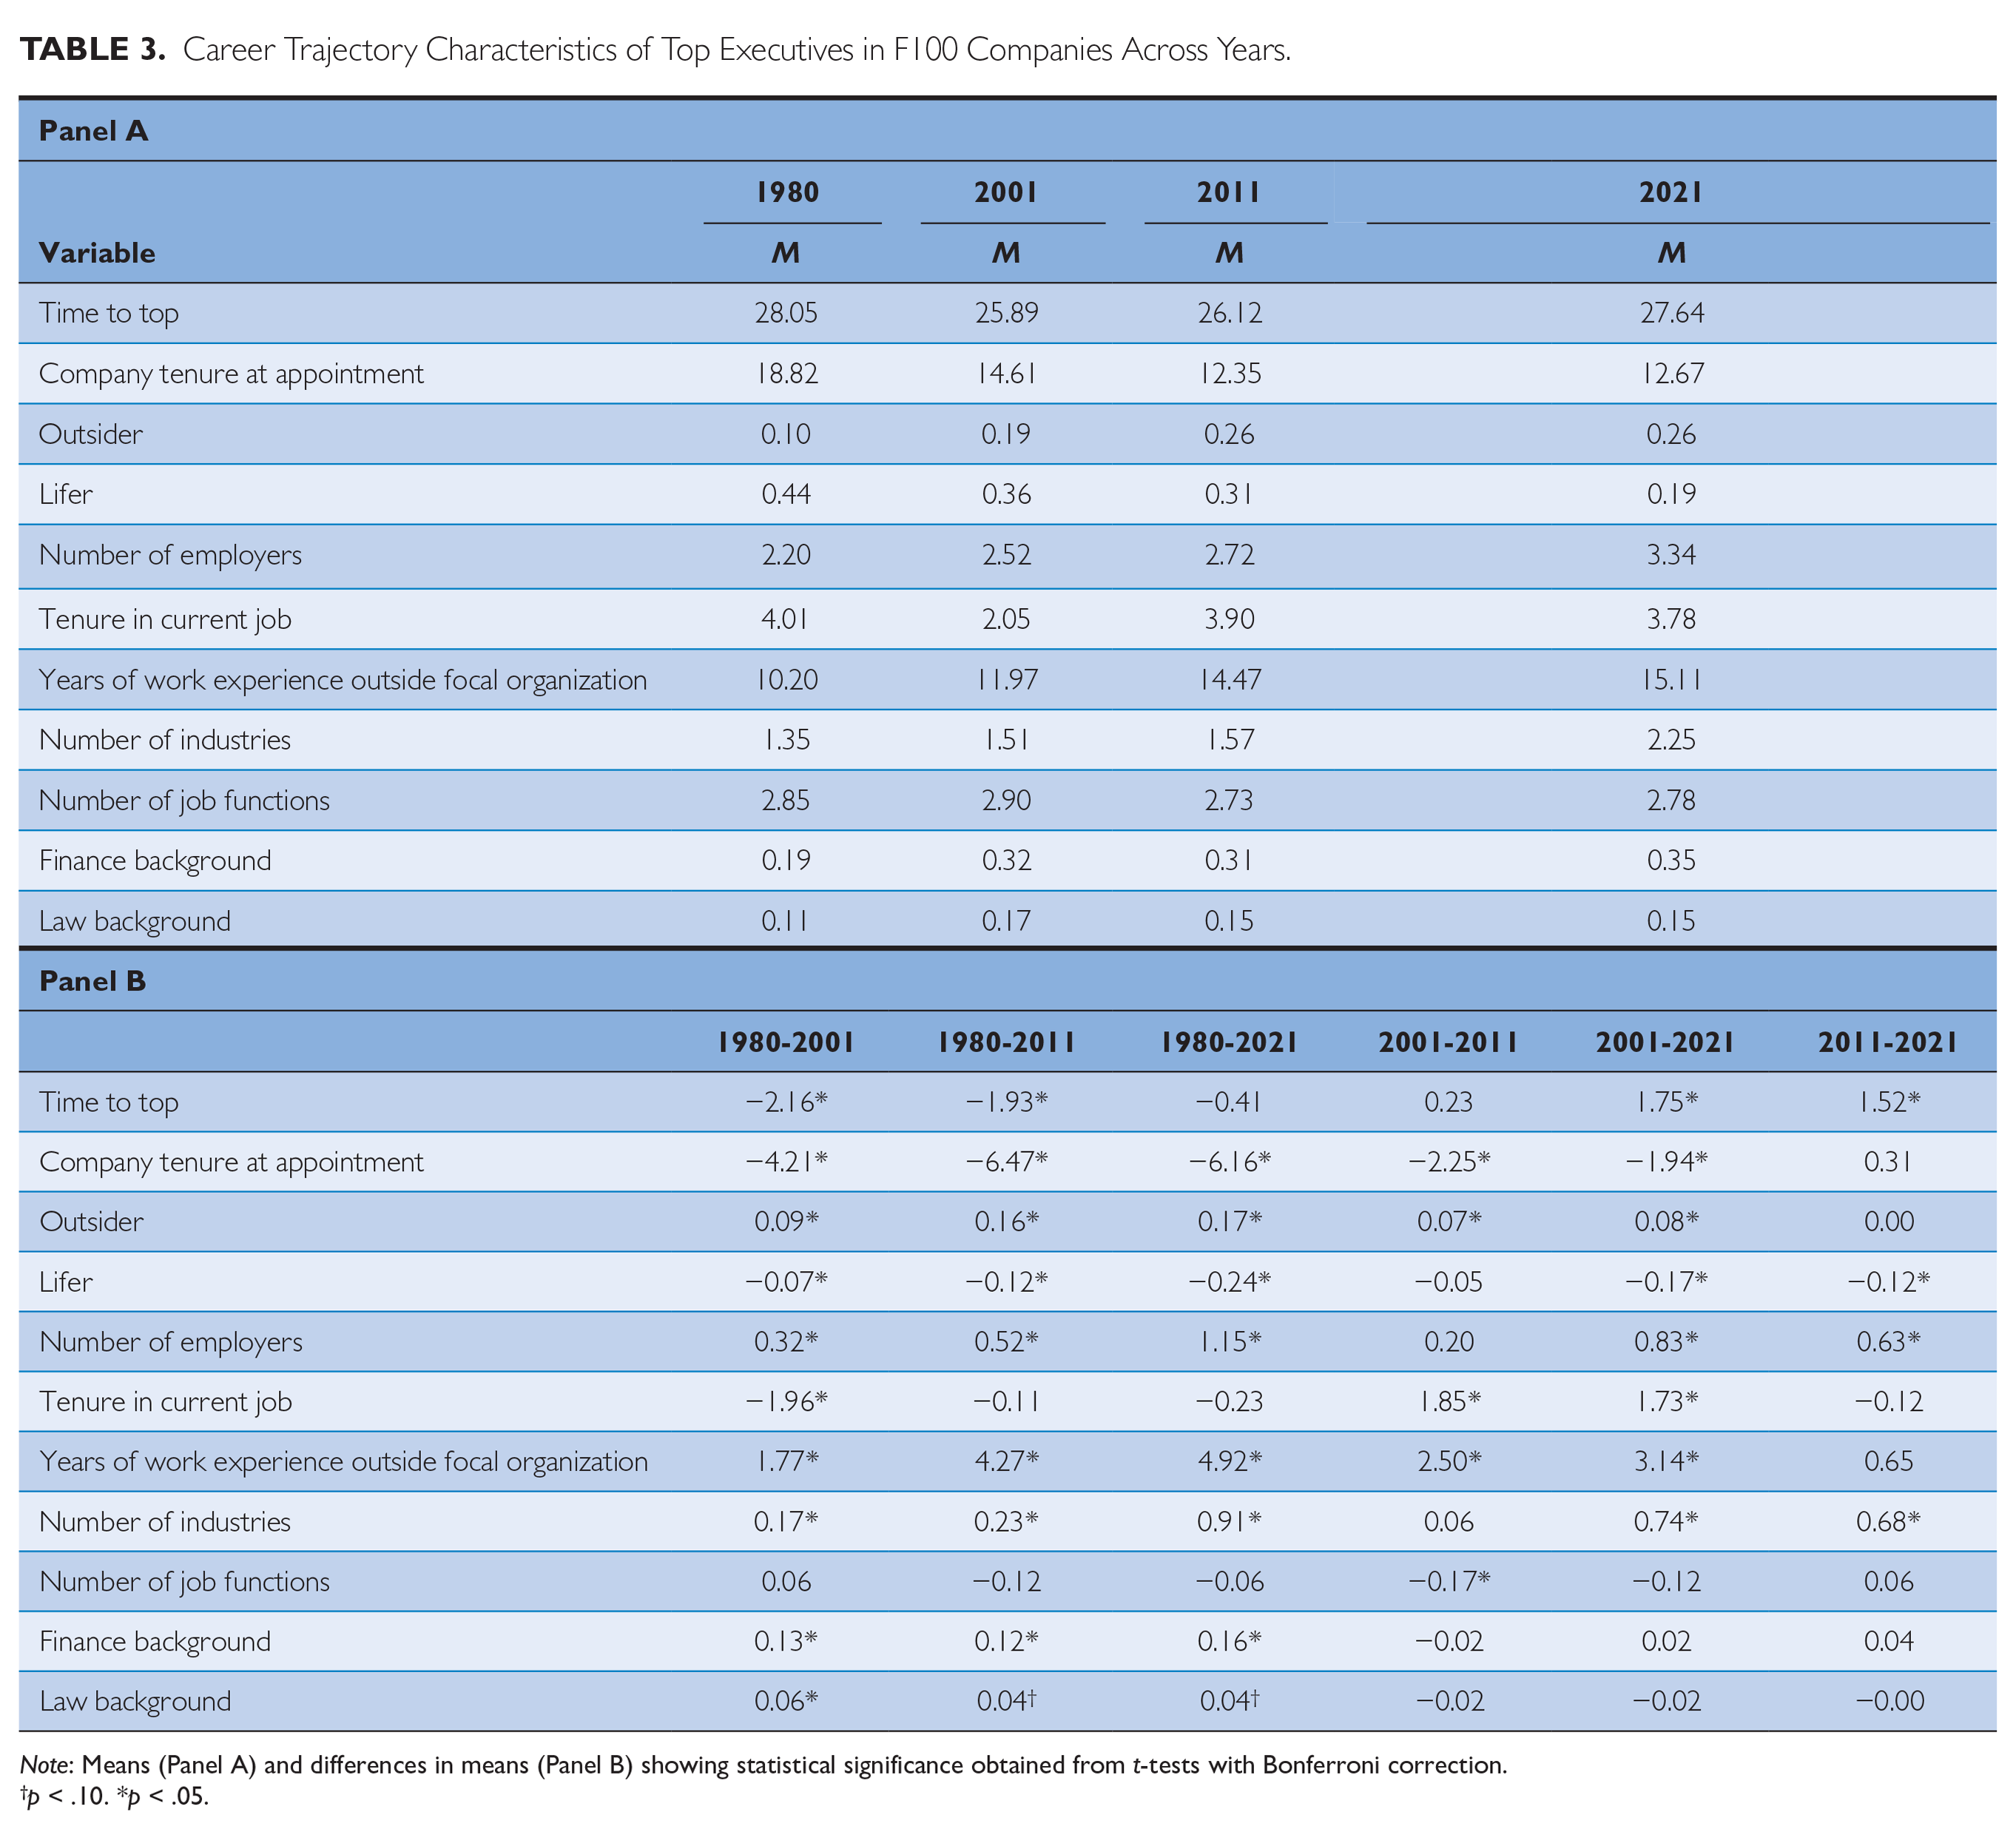
Note: Means (Panel A) and differences in means (Panel B) showing statistical significance obtained from t-tests with Bonferroni correction.
p < .10. *p < .05.
A second issue in career paths is the breadth of experience. It had been common in corporate life to have “rotational” programs where promising candidates for executive roles would receive experiences across functional areas. We can measure that by the number of different functional areas where they worked. That attribute increased from 1980 to 2001 among our top executives but declined since then. With the exception of the comparison of the number of functions between 2001 and 2011 that shows a decline in the number of functions, tests of the differences in the number of functions in other periods are not statistically significant. While functional diversity has not shown significant changes across the years, the type of functional experience possessed by executives did change. Most notably, we see a sharp increase in the proportion of executives with a finance background: 19% of executives had work experience in the finance function in 1980, which rose to 32% in 2001, and stayed above 30% for the rest of the years. We also see an increase in the proportion of executives with a law degree, which went from 11% in 1980 to 17% in 2001 and stayed at this level post-2021. Movement across industries, however, has risen steadily since 1980 and especially in 2021. Employers seem to be more interested in learning from experience in other industries possibly as industries experience similar challenges at different times.
Differences within Companies
Finally, we address the extent to which the changes we see resulted from changes within existing companies and changes in the mix of companies.
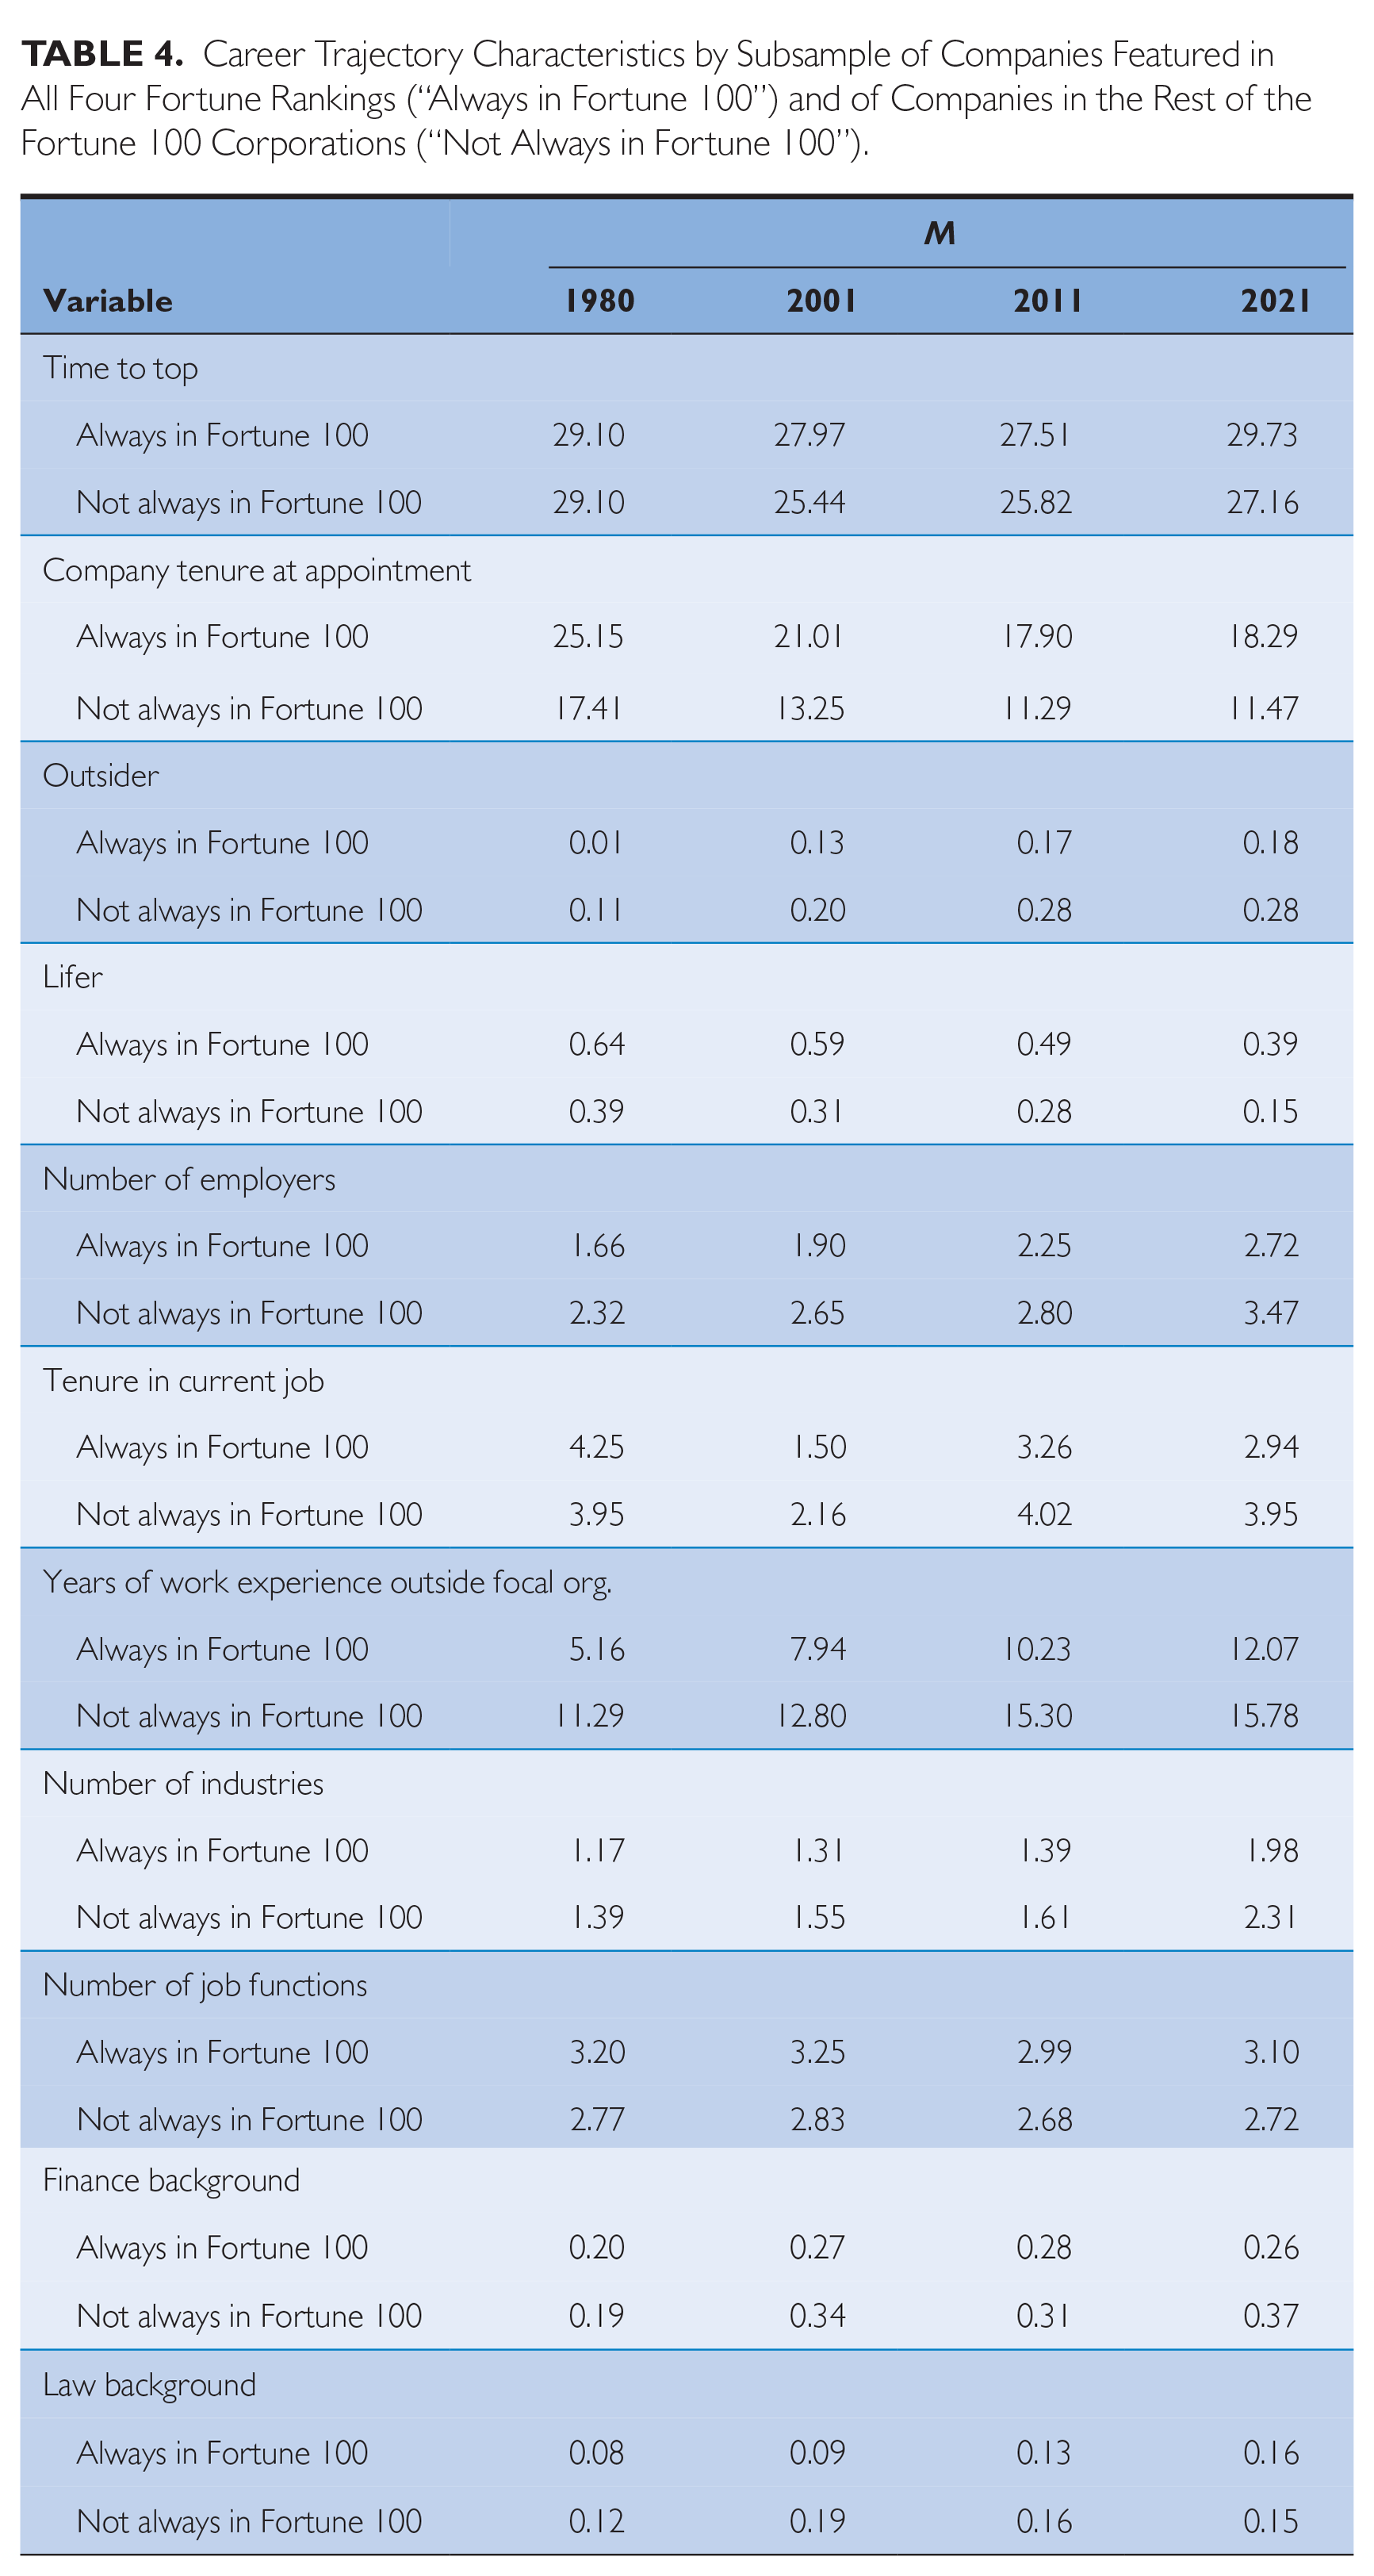
There are several ways to address this question, but the simplest may be to examine the 17 companies that have been in the Fortune 100 since 1980 and see whether their experience is different from the overall change for the 83 companies that were not in the Fortune 100 the entire time. We might expect older, more established companies that make up the 1980 cohort to lag changes of any kind because they have invested more in older markets, in previous processes, and so forth. Indeed, that is the case. They do experience the changes we find overall, though, just at a reduced rate.
For example, if we look at the percentage of “lifers” in those companies in Table 4, we saw it drop considerably but unlike the other companies, not until 2011. Now it is down to 39%, which is still more than twice as high as in the rest of the Fortune 100. The percentage of executives with MBAs took a huge jump in 2001, held steady through 2011, and then took another big jump in 2021. The proportion with MBAs from Ivy universities has always been lower at these established companies. The most continuous changes have been in the decline of “lifers” and the rise of foreign executives. Tenure in the organization till promotion to the current job declined remarkably after 1980. Outside hiring into the executive ranks was basically non-existent in 1980—1%—and now it is at 18% of the top executives. The big jump came in 2001, before the big decline in lifetime employees, no doubt driving the latter. In short, as we might have anticipated, these older companies experienced the same changes but started at a much lower base and remain lower in them now.
Career Trajectory Characteristics by Subsample of Companies Featured in All Four Fortune Rankings (“Always in Fortune 100”) and of Companies in the Rest of the Fortune 100 Corporations (“Not Always in Fortune 100”).
Analysis and Discussion
A challenge in explaining the evidence we present above is that there was little in the way of prior research or theory to examine how the attributes of top executive careers have changed over time. Attempting to explain changes in society-level populations is difficult with our usual tools of statistical inference. Instead, we assert the following tentative conclusions about the developments over time outlined above where explanations were not obvious.
First and most generally, the fact that the biggest changes in many of the attributes we described above took place between 1980 and 2001 (far bigger than 20-year changes from 2001 to 2021) reinforces the view that the 1980s were the watershed period in modern business.
Second, in terms of basic demographic changes, one of the most noticeable is the disproportionate jump in the proportion of women in top leadership roles from 2011 to 2021. The fact that political and social pressures to improve gender balance—especially in the top jobs—increased in that decade is consistent with the view that those pressures were responsible for the bigger increase.
The sharp increase of foreign-raised leaders may also have a straightforward explanation, this one associated with a “pipeline” argument: the percentage of the leaders we count as foreign-raised rose much faster than the foreign-born population in the United States, but not necessarily faster than the rise in foreign graduate students who were disproportionately in the most employable technology fields. In the 20 years from 1995 to 2015, for example, the foreign student population in engineering fields like computer science grew by 480% against only a 45% increase in the U.S.-born students in those fields. 46 Even more important may have been the introduction of the F-1 visa program, which allowed foreign students to stay in the United States after graduating to secure work experience.
An explanation for the lag in the use of MBA graduates, most prominently in the oldest companies, is likely associated with the fact that those companies had extensive management training programs, many of which lasted for years, that taught the same content as MBA programs. Those programs began to be dismantled after the 1980s, 47 which meant that 20 years or so on we saw these companies shifting toward “buying” versus “building” such capabilities.
The third and arguably most important set of facts concerns career paths. The jump in outside hiring, faster advancement, and shorter tenure is consistent with the notion of corporations needing to find leaders with new attributes after the 1980s and having to look outside to get them. The increased interest in experience outside each company’s industry reflects a similar need to find new skills and also suggests that this change was common across each industry: it will not yield as many insights to hire from competitors in the same industry who are still wrestling with the same problems you face. The fact that top executives got younger does not imply that there was any demand for younger executives. It is more easily explained by the relative scarcity of people with the right skills in the market, which caused companies to dig deeper into the pool of candidates and take those with less experience. These results also reinforce the notion that the post-1980s period was a watershed time in contemporary business.
Arguably, the most surprising findings are the reversal of trends that many thought were inexorable: top executives have not continued to be younger, they are not more likely to be hired from outside directly into executive roles, and tenure in their roles is not declining. Some of those changes actually reversed. Specifically, the fact that top executives are now back to the average age of their peers in the 1950s seems remarkable. The likely explanation for the reversal is that the supply of executives who know how to manage in the more competitive environment after the 1980s and through restructurings was no longer in such short supply: it may have been difficult to find top executives who had managed important restructurings a generation ago, but after that, the experience pool caught up.
Given that, it may not be surprising that in the period 2001-2011, average tenure began to increase again, through to the present. This was a period of relative stagnation, especially following the financial crisis of 2008-2009. Favaro, Karlsson, and Neilson 48 concluded that CEO turnover fell sharply afterward, which increased tenure. The pandemic years of 2020 and 2021 were also ones where simply staying afloat was a priority: changing leaders then seemed unlikely. As the need for new leaders declines, time to the top slows, and the average age grows.
An important conclusion from this set of results is to challenge the popular conceit that we are always in a time of unprecedented change. Sometimes change may actually slow down.
A different set of assertions about executive careers suggests that they need broader skills than in the past. 49 We do not see evidence for the importance of broader skills as traditionally defined across functional areas of the kind that rotational assignments produced. There is little change in this dimension. The fact that rotational assignment programs seem to have declined in corporations reflects the relative lack of interest in those skills. To be fair, functional breadth was mainly a concern for operating executives—CEOs and division presidents—not heads of functions such as chief financial officers (CFOs) and chief human resource officers (CHROs). We do, however, see evidence that experience across industries has grown considerably reflecting a different kind of breadth, knowing how similar functions are handled in different contexts.
One specific example of the need for different skills, as noted above, arguably came after the many financial scandals of the late 1980s and 1990s: Ivan Boesky’s insider trading, the Savings and Loan collapse, Long-Term Capital Management’s derivatives explosion, then spilling over with WorldCom and Enron fraud cases. We then saw a spike in the number of executives with legal and CFO experience in 2001 who may have been more equipped to spot and head off financial fraud cases.
In summary, we see the evidence we present here as being a basis for new work on the fundamental and neglected question of who gets the top jobs in corporations. The practice of succession planning is fundamentally about that question, although by default and lack of evidence our knowledge of it has devolved into simple descriptions of “best practices.” The explanations we present here for the most important changes strike us as plausible but also point the direction for more systematic efforts: for example, looking in more detail inside individual corporations, to see whether they hold up and to see whether new explanations and possibly new theoretical stories are more important.
Footnotes
Appendix
Notes
Author Biographies
Peter Cappelli is the George W. Taylor Professor of Management and Director of the Center for Human Resources at The Wharton School, University of Pennsylvania (email:
Rocio Bonet is an associate Professor at IE Business School, IE University in Madrid (email:
Monika Hamori is an associate Professor at IE Business School, IE University in Madrid (email: