
Abstract
We analyze investors’ perception and long-term effects of board gender diversity on firms’ stock market performance in an international setting. Our results, controlling for the endogenous nature of board compositions, indicate that female board representation neither improves nor reduces firms’ long-term stock performance. Hence, we argue that it is imperative to go beyond the conventional thinking in terms of the business case for gender diversity and broaden the perspective also to incorporate societal and ethical aspects in the strive to board gender equality. Even more so, as our results show that it does not entail reduced shareholder value, which the literature on mandatory gender quotas commonly seems to suggest.
There is a wide range of stakeholders (e.g., national governments, politicians, employees) and shareholders (e.g., sovereign wealth funds, pension funds, large institutional investors) continuously demanding a higher degree of female board representation. Such desires are mostly based on the notion that women on boards affect corporate governance outcomes (Fondas, 2000) and firms’ financial performance (Carter et al., 2010; Deszö & Ross, 2012). While most prior studies find a positive association of female representation with corporate governance and board activities (Adams & Ferreira, 2009; Nielsen & Huse, 2010a, 2010b), there are inconclusive results with respect to its impact on firms’ accounting performance. More recent studies argue that these inconclusive findings can be attributed to an overall indirect association of board gender diversity with firms’ accounting performance (Galbreath, 2018; Gregory et al., 2013). Given that more and more governments adopt mandatory policies to increase the number of female board members, the issue is still meaningful nowadays.
While there are a lot more studies on the accounting performance of firms with female board representation (for meta-analyses, cf. Pletzer et al., 2015; Post & Byron, 2015), which yield aforementioned inconclusive results, we engage an even more underexplored phenomenon. There is limited evidence on the association of board gender diversity with market performance. In this context, it is equally important to analyze how outsiders (e.g., investors) perceive the quality and ability of female board members and their contribution to firms’ performance (Gregory et al., 2013). To this day, there are only a few studies analyzing short-term market effects of female board and CEO appointments (Farrell & Hersch, 2005; Kang et al., 2010; Lee & James, 2007; Schmid & Urban, 2016). To our surprise, previous studies have neglected the long-term market performance attributable to female board representation.
Taking a longer term perspective is valuable for multiple reasons. First, short-term market reactions proxy for the expected impact of female appointees on shareholder value. Hence, these expectations might be biased in the short term (Gregory et al., 2013; Wolfers, 2006). We are more interested in the actual association of gender diverse boards with long-term changes in shareholder wealth. Second, new board appointees require some time to enact organizational changes and changes in firms’ investment patterns (Pan et al., 2016). The market also undergoes an adjustment period in which it evaluates the appointees’ quality (Pan et al., 2015; Wolfers, 2006). In this context, role congruity theory provides a theoretical framework for prejudices that women are less favorable candidates for leadership roles, leading to a perceived incongruity between female roles and (managerial) leadership roles. If a negatively stereotyped (i.e., role incongruent) person rises to a top position, investors may react negatively to firms because they deviate from social expectations. Nevertheless, it might also be possible that the (negative) stereotypes persist into the future. Third, there are calls for increased board gender diversity from a wide variety of stakeholders, such as institutional investors (Byoun et al., 2016; Coffey & Fryxell, 1991), stock exchanges (Terjesen et al., 2016), as well as regulators (Securities and Exchange Commission (SEC), 2009). Building on catering theory, this external pressure might result in firms catering to the market demand for board gender diversity or being punished if they fail to do so. In sum, there is a lack of evidence on the “relationship between board diversity and long-term stock price performance which is the ‘gold standard’ measure of shareholder value” (Rhode & Packel, 2014, p. 391). 1
Therefore, it seems important to analyze how investors perceive corporate board participation in the long term. As a result, we attempt to answer the following two research questions:
We provide several important contributions to current research. First, our study contributes to the social and economic debate regarding female board representation by analyzing how stakeholders (e.g., investors) perceive female board members and their contribution to the firm. In addition, we investigate whether aforementioned societal pressures result in firms catering to these expectations or, if they fail to “comply,” whether they are punished by investors. Second, corporate board composition and its association with performance is profoundly endogenous (Hermalin & Weisbach, 2003), which is largely ignored by the majority of previous studies. We explicitly address this gap in the literature by employing propensity score matching (PSM). Third, prior empirical studies have mainly focused on single countries (i.e., predominantly the United States). However, prior cross-country research shows that female board representation differs significantly between countries and that there are still global differences in overall gender equality (Grosvold, 2011; Grosvold et al., 2016; Loy & Rupertus, 2018; Terjesen & Singh, 2008). Hence, we test our research questions in an international setting.
Based on our analyses, we provide some interesting new insights into the relationship of female board participation and long-term market performance. Across a comparable set of firms, our results indicate no significant differences in annual stock returns. Moreover, we fail to document significantly reduced stock returns for firms that deviate from the expected ratio of female board membership. While female appointments may have the reported (mostly negative) short-term effects (Kang et al., 2010; Lee & James, 2007; Schmid & Urban, 2016), it seems that the market corrects this (negative) mispricing over the long run. In sum, our results suggest that improvements in gender equality are a societal imperative for reasons of fairness, ethics, and participation (Grosvold et al., 2007), and do not harm investors in the long term.
We structure our article as follows. First, we develop our theoretical framework, discuss prior literature, and develop our hypotheses. Second, we explain our empirical methods. Third, we present the data and descriptive statistics. Fourth, we exhibit and discuss our multivariate results. Fifth, we challenge our findings through a range of robustness checks and discuss the implications of our results and their limitations. The final section concludes.
The Social and Business Case of Board Gender Diversity
Board gender equality and the lack of female board representation have increasingly become the focus of international political and societal debates in recent years (Grosvold, 2011; Pande & Ford, 2011; Singh et al., 2001; Terjesen et al., 2016). Despite global efforts to increase female board representation, there remain huge discrepancies in the proportion of female board members across and within countries (Loy & Rupertus, 2018; Terjesen & Singh, 2008). Whereas several studies focus on the causes of these major international discrepancies in the number of women on corporate boards (Grosvold, 2011; Grosvold & Brammer, 2011; Grosvold et al., 2016; Loy & Rupertus, 2018; Terjesen & Singh, 2008), others focus on firm-level predictors for female board representation (Farrell & Hersch, 2005; Hillman et al., 2007; Terjesen et al., 2009). In recent years, scientific studies put an increased focus on the social arguments for greater board gender diversity (Campbell & Minguez-Vera, 2010; Grosvold et al., 2016; Kilgour, 2012).
Social arguments for greater board gender diversity revolve around ethical issues of fairness, equal opportunities, and participation (Brammer et al., 2007; Kilgour, 2012; Rhode & Packel, 2014; see Figure 1). As today’s women are more highly educated and participate in considerably more professional and technical occupations than their mothers and grandmothers (World Economic Forum, 2016), continuing a pattern of unequal opportunities implies a great waste of talent and, thus, societal dead weight loss (Radjavi, 2012). In summary, proponents of board gender diversity point out overall benefits for society and the economy.
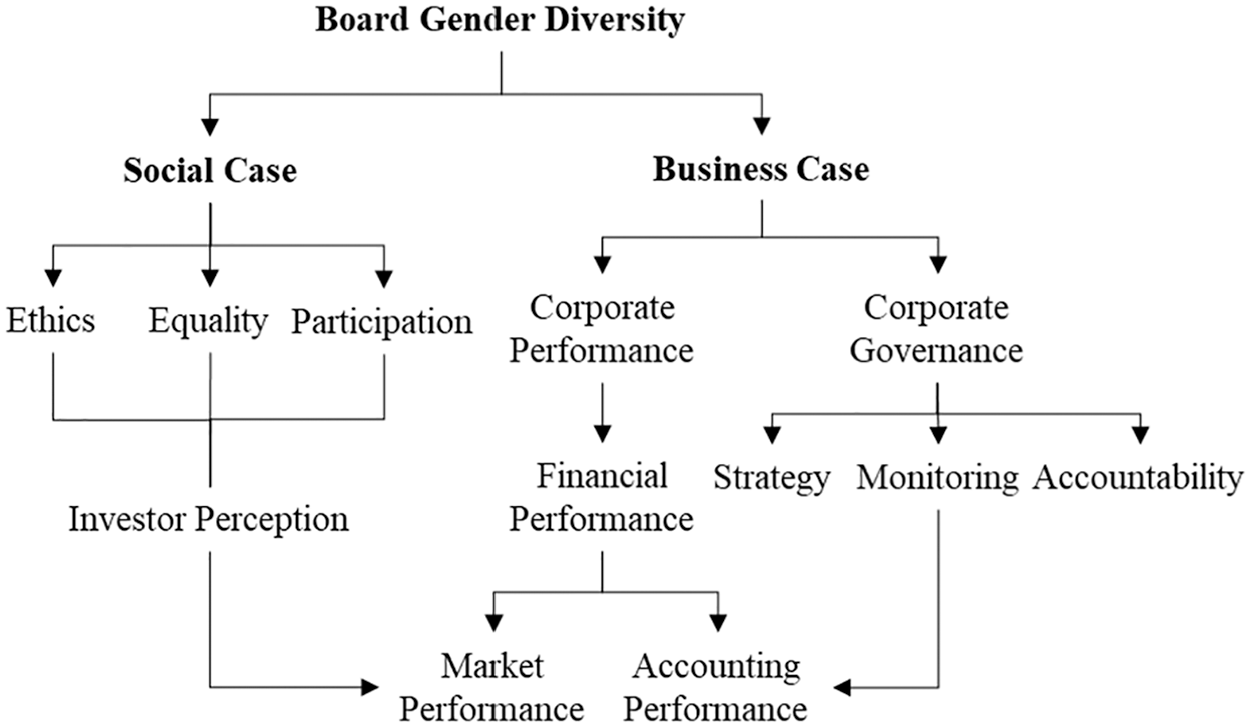
The social and business case of board gender diversity.
The business case for board gender diversity mostly relies on the assumption that female board representation improves organizational processes and performance (Rhode & Packel, 2014). This includes corporate governance outcomes as well as firms’ financial performance (Grosvold et al., 2016; Post & Byron, 2015). On one hand, firms’ financial performance entails three dimensions: (a) long-term accounting performance, (b) long-term market performance, and (c) short-term market reactions. On the other hand, in the context of corporate governance, boards of directors have three central functions: (a) shaping strategy and counsel top executives, (b) monitoring and compensating top executives, and (c) enhancing accountability through ultimately being able to replace unsuccessful top executives (Fondas, 2000; Post & Byron, 2015).
If boards efficiently fulfill their tasks, they improve firm performance. More specifically, gender diversity helps in this respect as women bring useful female leadership qualities and skills to the boards, improving decision-making processes through fresh and well-informed views on market and environmental issues (Boulouta, 2013), increased risk awareness, and less overconfident decision making (Chen et al., 2016). Moreover, gender diverse boards are more likely to engage in high-quality analysis and are less likely to take extreme positions (Dobbin & Jung, 2011; Rhode & Packel, 2014). Gender diverse boards are also better monitors; they hold more board meetings, have higher attendance rates, and are more likely to replace a CEO when stock performance is poor (Adams & Ferreira, 2009; Nielsen & Huse, 2010a, 2010b). Finally, through increasing the number of women on boards, the organization sends a credible signal that it offers fair opportunities for career progress for current and future female employees (Hillman et al., 2007). Hence, it enjoys and retains access to a broader pool of qualified employees on all organizational levels.
Based on these arguments and related empirical evidence on the positive performance effects of women on boards (Deszö & Ross, 2012; Erhardt et al., 2003; Krishnan & Park, 2005; Singh et al., 2001), one would rationally expect an increased demand for board gender diversity. Nonetheless, men still empirically dominate corporate boards globally (Loy & Rupertus, 2018), indicating an “ultimate glass ceiling” (Arfken et al., 2004). Extant studies point to stereotypes and gender-biased attitudes as the main explanation for barriers to female progression (Ding et al., 2013; Everett et al., 1996; Gregory et al., 2013; Valian, 1998). These stereotypes are mostly based on social perceptions rather than on a detailed review of qualities, skills, and abilities. There is associated evidence that male managers’ attitudes toward female managers remained largely unchanged over the decades, whereas women now perceive both genders as being equally qualified (Schein, 2007).
While prior studies overwhelmingly focus on the effects of gender diverse boards in an organizational context, it is equally important to analyze how outsiders (e.g., investors) perceive the quality and ability of female board members and their contribution to firms’ performance (Gregory et al., 2013). If the stock market evaluates that gender diversity actually contributes positively to board activities and/or firm performance, it will likely be a force in overcoming gender biases and the ultimate glass ceiling.
Theoretical Framework and Hypothesis Development
Long-Term Stock Market Perception of Female Board Members
Role congruity theory provides a theoretical framework for the biased premise that women are less favorable candidates for leadership roles. These prejudices are rooted in a perceived incongruity between female roles and (managerial) leadership roles (A. E. Eagly & Karau, 2002). More specifically, social perceivers have internalized sex-typical social roles, such as men occupy leadership positions in business and society while women stay at home and take care of the family (A. H. Eagly et al., 2000). Once a negatively stereotyped (i.e., role incongruent) person rises to a top position, this inconsistency diminishes the appreciation this person receives from others (A. E. Eagly & Karau, 2002). Applied to our context, that means that investors may react negatively to firms with women in top positions because they deviate from social expectations (Abdullah et al., 2016; Dobbin & Jung, 2011; Post & Byron, 2015).
So far, only a handful of studies analyze the stock market perception of gender diverse boards and they unanimously focus on short-term market reactions to female appointments to top executive positions. Lee and James (2007) find more negative announcement returns to appointments of female CEO than male CEO. They assume that appointing female executives attracts negative attention of investors with deeply held stereotypical beliefs and gender biases about female leadership qualities. Bharath and colleagues (2009) show that female insider trades are perceived to be less informative with respect to future corporate performance by investors. They trace this result back to investors’ stereotypic belief that female executives are not part of the “Old Boys Network” and have disadvantages in accessing insider information—irrespective of their objective qualifications. Farrell and Hersch (2005) find a positive association between firm performance and the likelihood of appointing women to the board, but they do not find support for an associated positive market reaction. Other related findings gear more positively toward board gender diversity. As such, Schmid and Urban (2016) provide evidence that stock markets exhibit more negative short-term reactions to deaths of female board members, especially in countries with low rates of female board representation. Thus, once women passed a rather strong “glass ceiling,” they are viewed as comparatively more valuable, and their untimely demise results in greater adverse short-term investor wealth effects. Finally, Kang and colleagues (2010) take a more nuanced stance. They find the most positive short-term investor reaction to the appointment of female outside directors followed by female appointments to non-CEO executive roles. Nonetheless, investors in their setting seem to view female CEO appointments as a negative event.
While looking at short-term windows around corporate events is standard practice in analyzing investors’ beliefs into the ability of newly appointed directors, role congruity theory suggests that these beliefs are likely biased (A. E. Eagly & Karau, 2002). Short-term market reactions proxy for the expected impact of female appointees on shareholder value, rather than the actual association of female board members. Appointees require some time to enact organizational changes and influence firms’ investment patterns (Pan et al., 2016). Following the appointment, the market undergoes an adjustment period during which it evaluates directors’ quality. Thus, any mis-assessments will likely be reversed over time (Gregory et al., 2013; Wolfers, 2006). Hence, we prefer taking a long-term view for two reasons. First, there is increasing skepticism and discussion whether stock markets are informationally efficient in the short term (Shiller, 2005). Indicative of this, stock volatility is highest at the appointment date of a new CEO, which likely biases short-term appointment returns (Pan et al., 2015). Second, in a longer term view, market data provide insights into the dynamics and, more importantly, the persistence of market participants’ biased beliefs (Wolfers, 2006). To our surprise, previous studies have neglected to investigate the long-term stock market perception of female board representation.
However, there are several theoretical arguments for anticipating that female board members negatively affect long-term market performance. As international evidence shows, there still is a relatively low number of women on corporate boards (Grosvold & Brammer, 2011; Grosvold et al., 2016; Loy & Rupertus, 2018; Terjesen & Singh, 2008). Furthermore, Wood (2008) assumes that women and men remain pessimistic about the likelihood of a potential change in gender stereotyping in the future. Hence, this probably persists stereotypes about female (dis)qualifications for such positions. A large body of literature in management and organizations shows that (predominantly) men believe that leadership positions are associated with masculine qualities (Gupta et al., 2009; Powell & Butterfield, 2002; Schein & Müller, 1992). Unsurprisingly, they view female board members still with considerable skepticism (Dobbin & Jung, 2011; Lee & James, 2007) and point out the detrimental effects of imposing board gender diversity through regulation (Ahern & Dittmar, 2012). Moreover, investors may still not be accustomed to women on corporate boards and, thus, believe that they lack the necessary business experience for such positions (Dobbin & Jung, 2011). Assuming that stereotypes and gender bias did not change significantly over recent years, one might still expect even a long-term undervaluation of firms with female board members. Based on the aforementioned arguments, we cannot make definite predictions on the sign of the relationship between female board members and long-term stock market performance. Consistent with role congruity theory and prior studies focusing on short-term market reactions, we state our first hypothesis in negative form. Ultimately, this issue remains an empirical question.
Investors’ Demand for Female Board Representation
Despite stereotypes and prejudice toward female board members, the number of female board members has increased slightly but continually over time (Loy & Rupertus, 2018). While the observed increase can partly be traced back to regulatory initiatives, there might also be social and investor demand for greater gender diversity. Corporations are increasingly attentive to the desires of a wide range of stakeholders (e.g., national governments, politicians, employees) as well as shareholders (e.g., sovereign wealth funds, pension funds, large institutional investors). On one hand, there are numerous non-profit initiatives to promote female board representation in basically every highly developed capital market. 2 They aim to convince businesses to implement gender fair corporate boards, even if this is not mandatory by law—or go beyond the quota. In addition, board gender diversity is regarded as a key pillar of good governance and stipulated in numerous voluntary corporate governance codes globally (Loy & Rupertus, 2018; Terjesen et al., 2015). The SEC (2009) even issued a rule that listed companies must disclose their views on board diversity. On the other hand, there is evidence that investors pay attention to board structures (Gillan & Starks, 2000; Yermack, 2006) and make board diversity, individually and collectively, a priority in investment decisions (Dobbin & Jung, 2011; Rhode & Packel, 2014). Moreover, an increasing number of (institutional) investors actively push firms to make progress in terms of board gender diversity (Byoun et al., 2016; Coffey & Fryxell, 1991; Fondas, 2000; Rhode & Packel, 2014). Thus, firms have an incentive to cater to their share- and stakeholders’ demands by having women on their boards.
Catering theory, developed by Baker and Wurgler (2004), was originally applied to firms’ decision whether or not to pay dividends. Some investors prefer receiving dividends to cover liquidity needs, while others prefer stock price increases. Depending on which group of investors is dominant, the firm chooses its dividend policy accordingly and is rewarded by a systematically higher stock market valuation than it would receive “stuck in the middle” (i.e., combining low dividends with small stock price appreciation). Along similar lines, Gosh and colleagues (2017) first employed catering theory to explain firms’ propensity to appoint women to corporate boards. More specifically, they show that certain firm characteristics are inherently associated with gender diverse boards, but there is also a time-variant, general propensity for board gender diversity which is rather based on investors’ demands. Our study applies catering theory in a somewhat different context. We also build on the assumption that inherent firm characteristics are associated with the propensity for gender diverse boards. As such, we employ the female director prediction model by Hillman and colleagues (2007), which we will explain in greater detail in the next section. Given that an increasing number of investors demands a strive for more female board representation, as laid out before, we aim to analyze whether the capital market “punishes” firms for non-compliance with its expectations.
Specifically, we argue that equity markets form their own expectations about the desired ratio of female board members. If key market participants demand improving gender diversity, firms will feel significant pressure in this regard (Dobbin & Jung, 2011; Rhode & Packel, 2014; Terjesen et al., 2009). As a result, we hypothesize that firms which do not meet investors’ expectations about gender diverse boards will be punished by a decline in long-term stock returns. Thus, we state our second hypothesis as follows:
Empirical Methods
Propensity Score Matching (PSM)
A necessary condition to analyze a relationship between explanatory and explained variable is that the former are exogenous and not prone to self-selection. In our context, corporate board composition is profoundly endogenous (Adams & Ferreira, 2009; Hermalin & Weisbach, 2003). There are only a handful of prior studies, which appropriately engage endogeneity. While one meta-analysis (Pletzer et al., 2015) does not mention the issue at all, Post and Byron (2015) specifically name two-stage models as a potential remedy to be applied in future research. We implement this through a quasi-experimental approach, novel to this literature. PSM builds on identifying potentially relevant covariates, based on previous empirical findings and economic theory, which influence selection into the treatment group (Rosenbaum & Rubin, 1983). The control group is formed by sampling a large number of potential control firms for those which exhibit highly similar covariates to the treatment group. Incidentally, this answers a recent call for future research which deems “board selection processes [. . .] a fruitful avenue for future analysis” (Post & Byron, 2015, p. 1562). Our PSM approach is based on the board gender diversity prediction model by Hillman and colleagues (2007). As such, we include return on assets (ROA), the natural logarithm of total assets as a proxy for firm size (SIZE), the number of outside directors (BOUTSIDE), the standard deviation of operating cash flows (RISK), and the total diversification measure of Palepu (1985) as an indicator for firm strategy (TD). We further include controls for firm age (AGE), sales growth (SGROWTH), and the debt-to-equity ratio (LEV). In addition, we include industry-fixed effects (IND), because there is ample evidence which suggests that industry is a significant explanatory factor of female board representation (Cumming et al., 2015), as well as year-fixed effects (YEAR) to control for a potential trend of increased female board representation in recent years (Loy & Rupertus, 2018). As a control for outliers, we winsorize the values of all non-truncated variables at the 1st and 99th percentile.
To control for country-specific regulations, national culture and institutional factors, which likely also affect the ratio of female board members, we estimate the conditional probability of receiving treatment on a country-by-country basis (Equation 1) 3 :
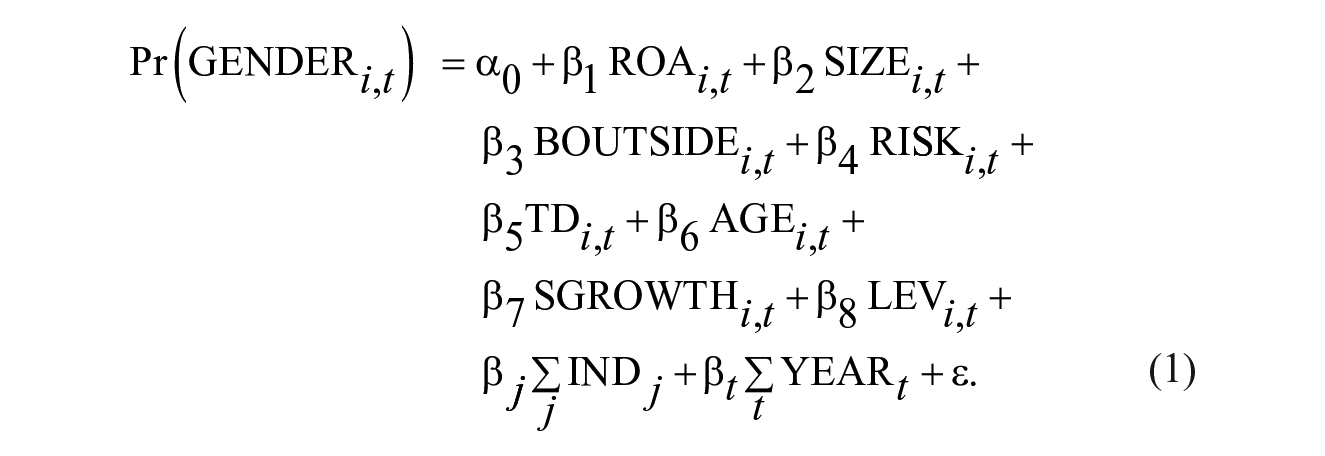
We match each firm-year from the treatment group (GENDER = 1) in a given country (e.g., Spain) with another firm-year of the control group (GENDER = 0) from the same country with the closest propensity score, without replacement. 4 Conceptually, we expect that matched firms only differ with respect to the treatment (i.e., board gender diversity).
Value Relevance Design
To further test our first hypothesis—the association of female board membership with long-term development of shareholder wealth—we employ a multivariate value relevance design. As such, we pool all country data sets and run the following regression:


The dependent variable is annual stock return corrected for possible dividend payments (RET) for the period 9 months before through 3 months after fiscal year-end. This period corresponds to the disclosure of annual financial statements and the timing of annual shareholders’ meetings at which new directors are voted into office. EPS is computed as net income before extraordinary items scaled by the number of shares outstanding. ΔEPS is the year-to-year change in EPS scaled by the stock price at the beginning of the fiscal year. A large body of evidence shows that especially earnings contain relevant information for investors (Lipe, 1990). As such, financial analysts regularly employ current earnings to estimate future cash flows. Most importantly, we examine the incremental effect of information about female board representation. In the first regression (Equation 2), we build on the full sample and include the unmatched GENDER variable to estimate its predictive ability. Attributable to aforementioned endogeneity concerns, we concentrate on the matched sample (GENDERMATCH) in a second analysis (Equation 3). Both regressions include controls for industry- (IND) and year- (YEAR) fixed effects. 5 To control for outliers, values of all non-truncated (i.e., non-binary) variables are winsorized at the 1st and 99th percentile, as well.
Gender Diversity Expectations Model
To test our second hypothesis, we extend our value relevance design. We analyze whether deviations from the expected ratio of female board members affect shareholders long-term investment decisions (H2). Therefore, we include ABSGENDIFF as the absolute difference between the observed proportion of female board members in a given firm and the expected ratio of female board representation (Equation 4):
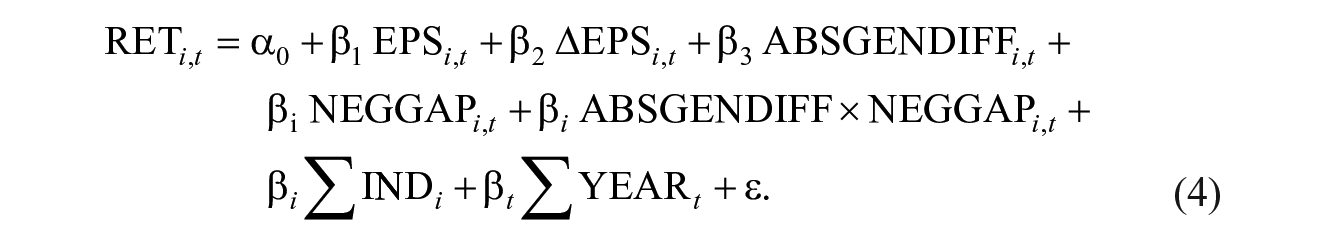
Prior research suggests that firms in certain industries are more likely to appoint women to leadership positions (Cumming et al., 2015). Likewise, the occurrence of female directors is still more common in some countries than in others (Grosvold et al., 2016; Loy & Rupertus, 2018). Thus, to determine the expected ratio of female board members, we determine the average ratio of female board representation across all firms in a given industry-country cross-section. Moreover, we include an indicator variable equal to one if a firm’s observed proportion of female board members downwardly deviates from the expected country-industry-based ratio of women on the board (NEGGAP). As we are primarily interested in the incremental effect of a downward deviation from expectations, we include the interaction term of both variables (ABSGENDIFF × NEGGAP). Hence, the baseline effect ABSGENDIFF measures the effect of a positive deviation. Finally, we include controls for industry- (IND) and year- (YEAR) fixed effects.
Sample Selection and Descriptive Statistics
Sample Selection
Initially, we consider all firms included in the Thomson Reuters’ Asset4 database for the period between 2008 and 2014. Main variables for all our investigations are board characteristics with respect to the total number of board members and the percentage of women on the board. We limit our sample to firms from countries with a sufficient number of firm-years with available board characteristics and financial data from Thomson Reuters’ Worldscope to carry out our PSM estimations. Moreover, we eliminate firm-year observations with missing stock returns. Our final sample consists of 8,872 firm-year observations from 13 countries. 6 We present our unmatched (Column a) as well as matched (Column b) sample by year (Panel A), country (Panel B), and industry (Panel C) in Table 1.
Unmatched and Matched Sample Distributions.
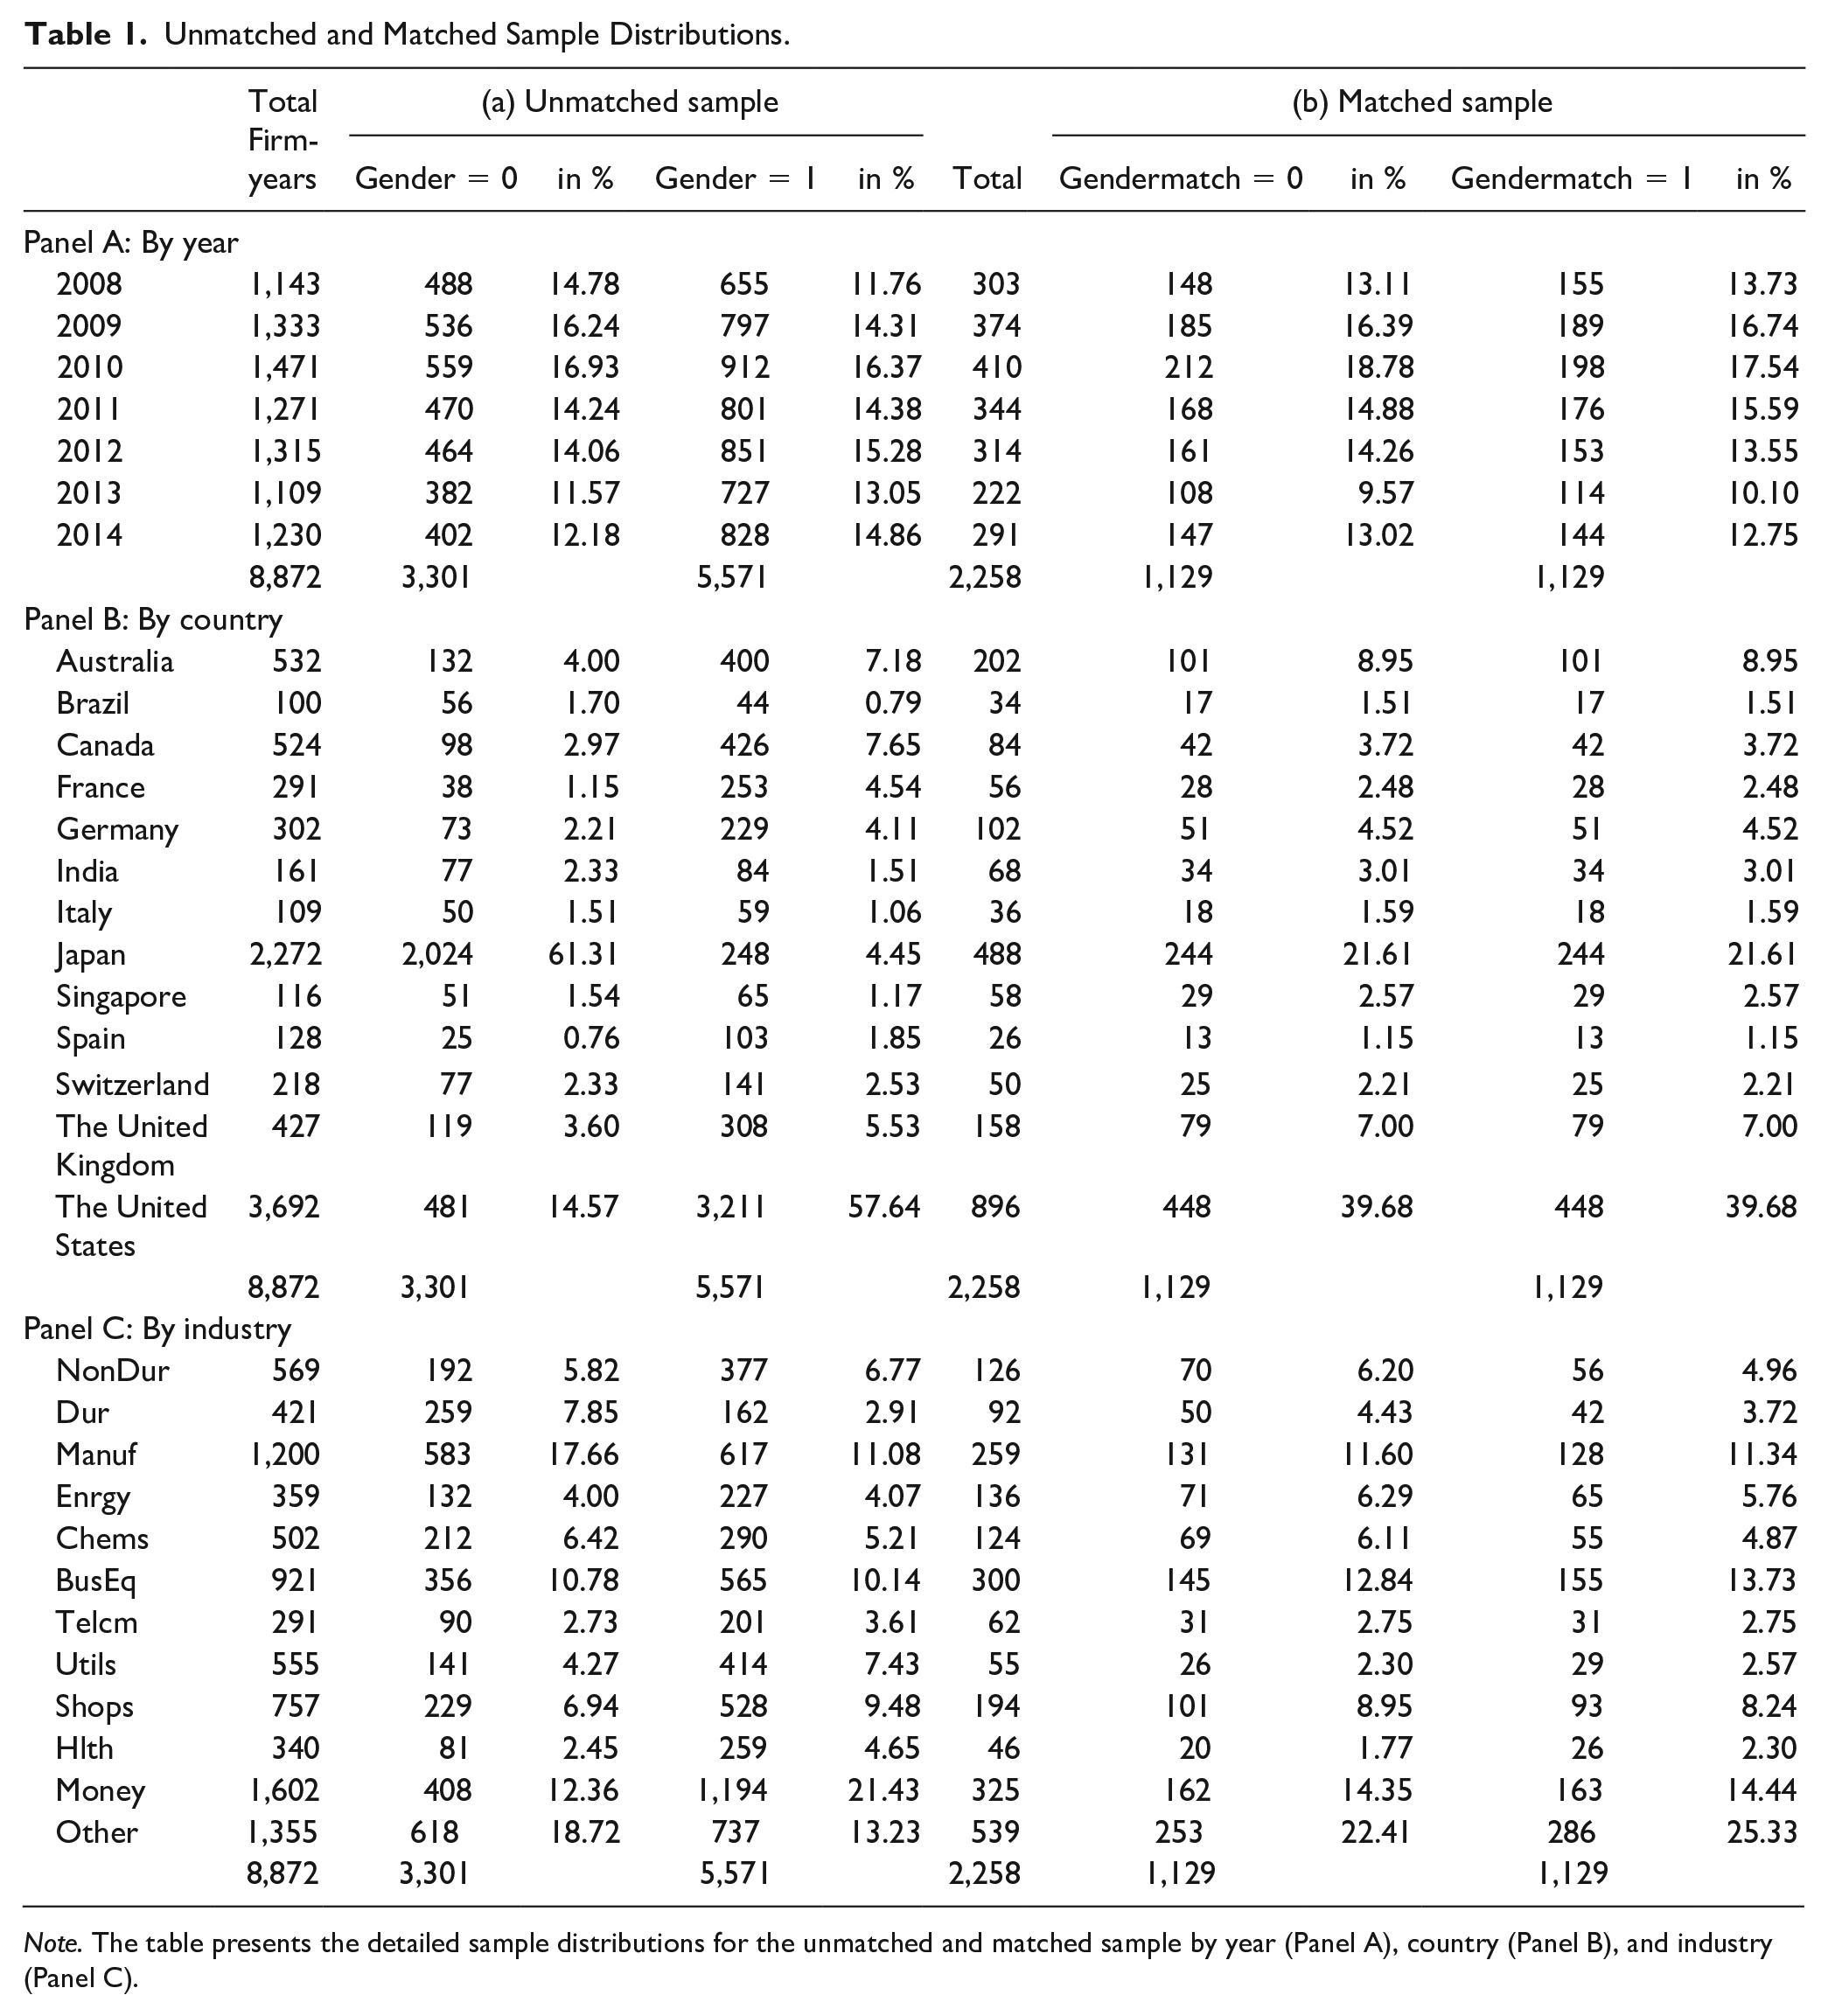
Note. The table presents the detailed sample distributions for the unmatched and matched sample by year (Panel A), country (Panel B), and industry (Panel C).
There is significant variation in the number of firm-years across countries. A majority of observations originate from Australia, Canada, Japan, the United Kingdom, and the United States There are also unambiguous differences between the treatment (GENDER = 1) and comparison (GENDER = 0) groups. On one hand, the majority of U.S. firms have at least one woman on their boards of directors despite that there are no legislative plans to implement a mandatory gender quota. France, Germany, the United Kingdom, and Canada present similar patterns. On the other hand, most firms from Japan do not exhibit gender diverse boards.
Descriptive Statistics and Correlations
For the pooled sample, average female board representation (GENQUOT) is 10.9 percentage points with a median of 10.0 (Table 2). Their mean (median) size US$10.2 billion (US$8.2 billion) in total assets and the average (median) age, which corresponds to the period since the date of incorporation, is 40 (45) years. Furthermore, outside directors occupy on average (median) 6 (7) seats on the corporate boards and the mean (median) firm-specific risk is 0.036 (0.026).
Descriptive Statistics—Pooled Sample.
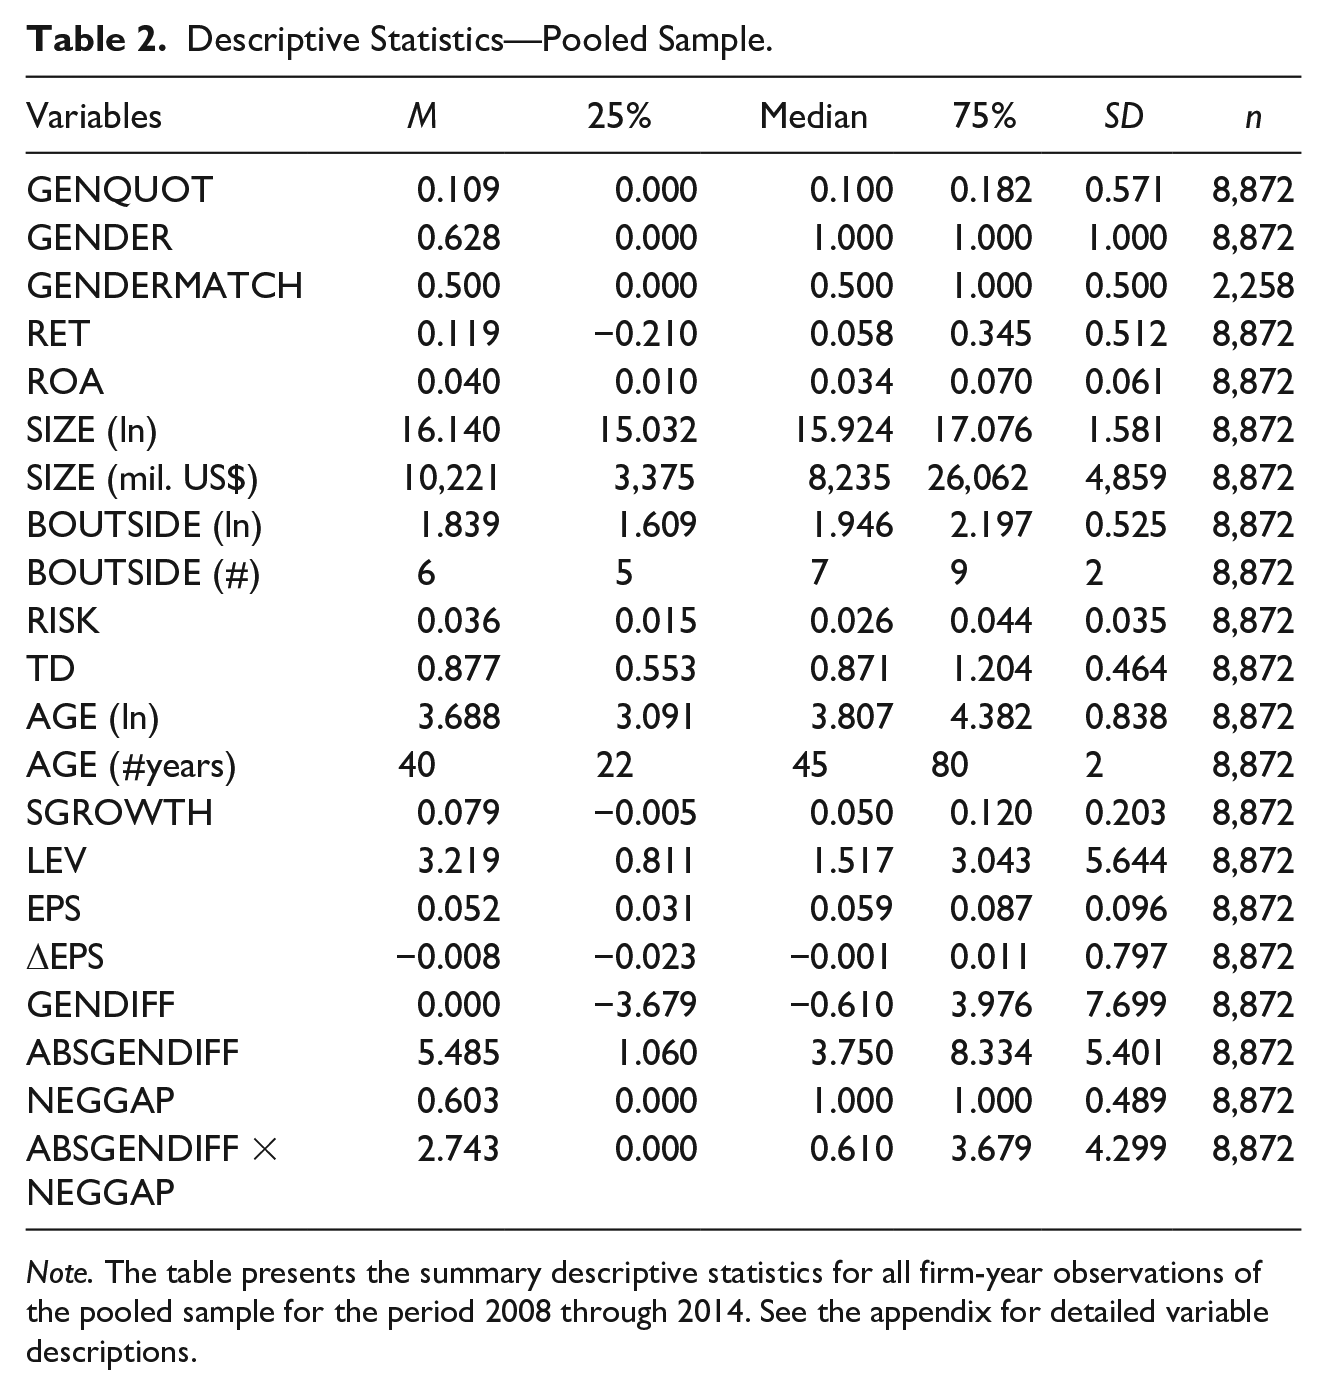
Note. The table presents the summary descriptive statistics for all firm-year observations of the pooled sample for the period 2008 through 2014. See the appendix for detailed variable descriptions.
Next, we present Pearson’s correlations. Consistent with our descriptive statistics, female board presence is positively associated with RET, ROA, SIZE, BOUTSIDE, TD, and LEV but negatively associated with RISK, AGE, and SGROWTH (Table 3). Variance inflation factors (VIFs) are far below conventional levels in the pooled cross-section as well as the separate models (cf. Online Appendix B). Therefore, multicollinearity does not bias our analyses.
Pearson’s Correlation.
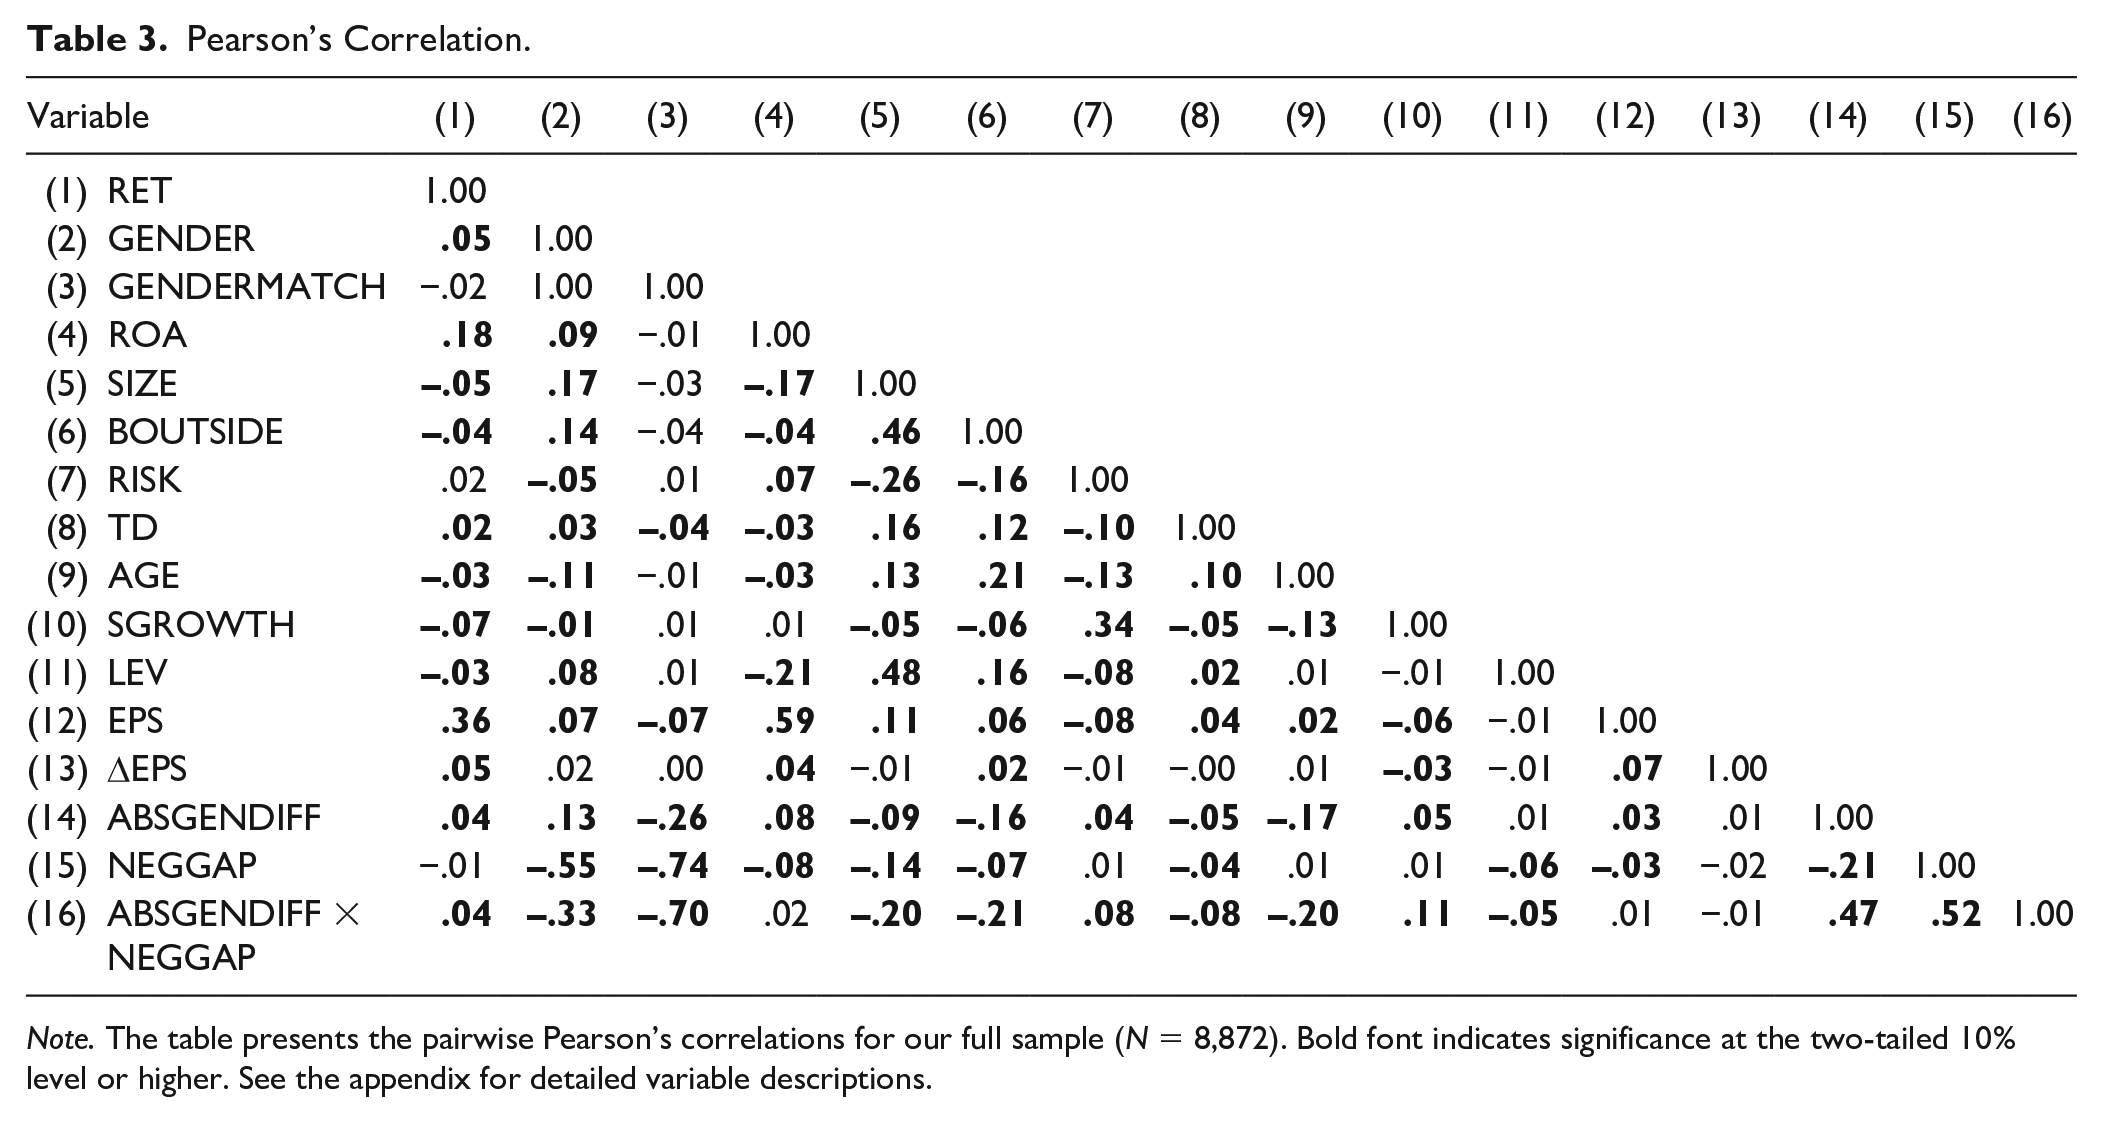
Note. The table presents the pairwise Pearson’s correlations for our full sample (N = 8,872). Bold font indicates significance at the two-tailed 10% level or higher. See the appendix for detailed variable descriptions.
Results
Propensity Score Matching (PSM)
In the following, we aim to determine whether firms with gender diverse boards exhibit lower long-term stock returns compared with their counterparts as a result of gender bias rooted in female role incongruity. In a first step to test H1, we present univariate t tests of differences in means for all variables included in our prediction model as well as stock returns (Table 4, Panel A). Comparing the gender diverse (n = 5,571) and non-gender diverse (n = 3,301) subsamples, substantial and mostly significant differences along a number of dimensions are quite visible. Compared with their counterparts, firms with female board presence exhibit, on average, (median) higher stock returns of 4.8% (8.1%); are larger and younger; and have more outside directors. Furthermore, they exhibit a lower risk profile. Generally, these descriptive statistics are in line with prior research (Hillman et al., 2007). Thus, we conclude that firms with gender diverse boards are systematically different from firms with all-male boards. Moreover, it seems that firms with female board presence exhibit significantly higher stock returns. Nevertheless, to make a convinced statement about the effect of gender diversity, we require a treatment group and a control group with similar firm fundamentals. To correct for the apparent self-selection and endogeneity of board compositions, Post and Byron (2015) suggest a two-step approach. We implement this through PSM. Afterward, both groups of firms should be similar with respect to firm characteristics that determine female board representation. Remaining differences in stock returns could, therefore, be attributed to differences in gender diversity (cf. Rosenbaum & Rubin, 1983).
Two-Sided t Tests for Differences in Means.
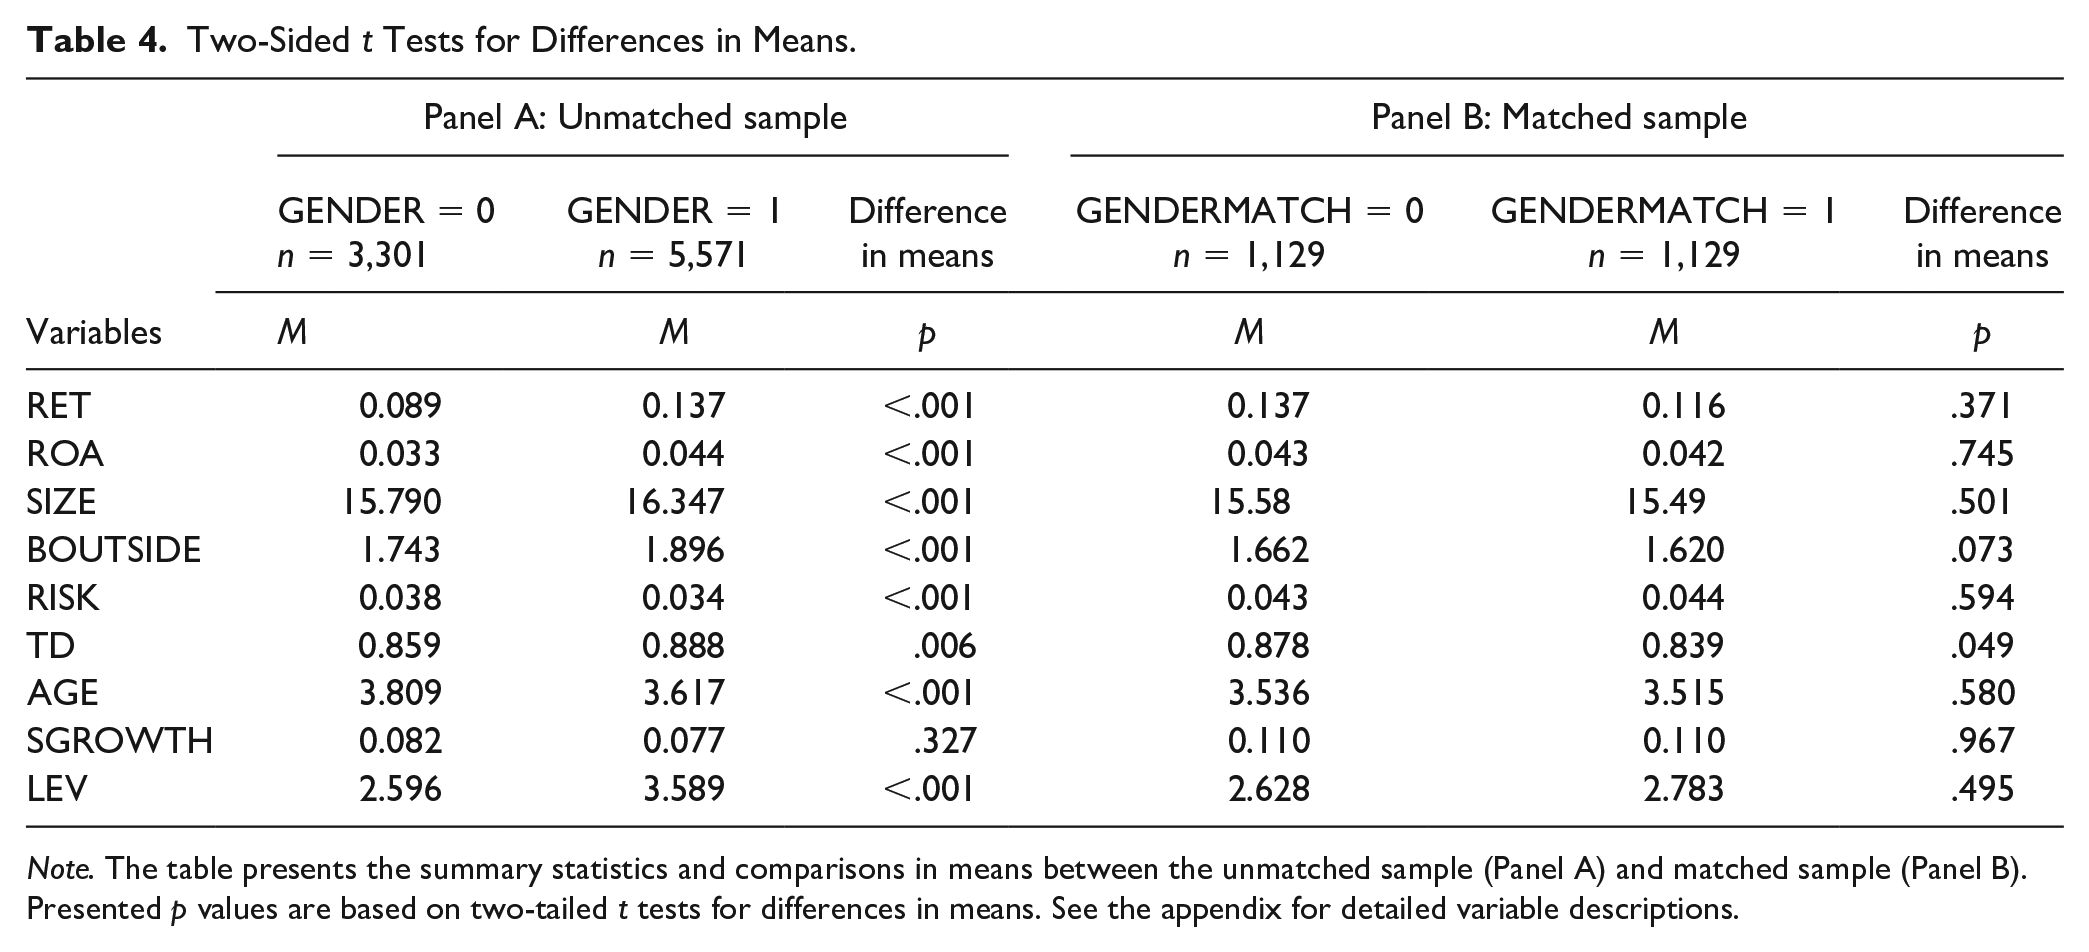
Note. The table presents the summary statistics and comparisons in means between the unmatched sample (Panel A) and matched sample (Panel B). Presented p values are based on two-tailed t tests for differences in means. See the appendix for detailed variable descriptions.
We present results of our prediction/matching model (Equation 1) for each country in our online appendix (cf. Online Appendix C). These indicate that the matching process efficiently balances differences across covariates. First, the post-match pseudo-R² values are significantly smaller than their pre-match counterparts. Second, post-match, almost none of the explanatory variables exhibit a significant association with the treatment. Across the different pre-match country subsamples, especially SIZE, AGE, SGROWTH, and BOUTSIDE have significant predictive ability toward receiving treatment. Overall, coefficients’ signs and estimated magnitudes are consistent with prior literature (Gul et al., 2011; Hillman et al., 2007). As such, the prediction model, although developed for a U.S. setting, performs well internationally.
Table 4 (Panel B) presents descriptive statistics for the matched sample as well as results of two-sided t tests for post-match differences in means. With the exception of TD and BOUTSIDE, no significant differences remain. Hence, we have first indication that H1 cannot be confirmed. Properly controlling for endogeneity and self-selection seems to render stock market performance differences insignificant. As the average pre-match pseudo-R² amounts to about 33%, other factors likely also influence the propensity of board gender diversity. If the matching process were (nearly) perfect, simple univariate t tests for our variable of interest would suffice to disprove the hypothesis (Dehejia & Wahba, 2002; Heckman et al., 1997). However, in the following, we employ a multivariate regression design to control for any remaining differences.
Value Relevance
Table 5 provides the regression results for our value relevance design (Equations 2 and 3). Both investigate firms’ stock returns, which are explained by earnings per share (EPS) and the change in earnings per share (∆EPS) as earnings are the most important information for stock markets (Lipe, 1990). Moreover, we conduct our analyses for the unmatched (GENDER) and matched (GENDERMATCH) samples to exhibit the incremental impact of board gender diversity on stock returns.
Value Relevance Regression.
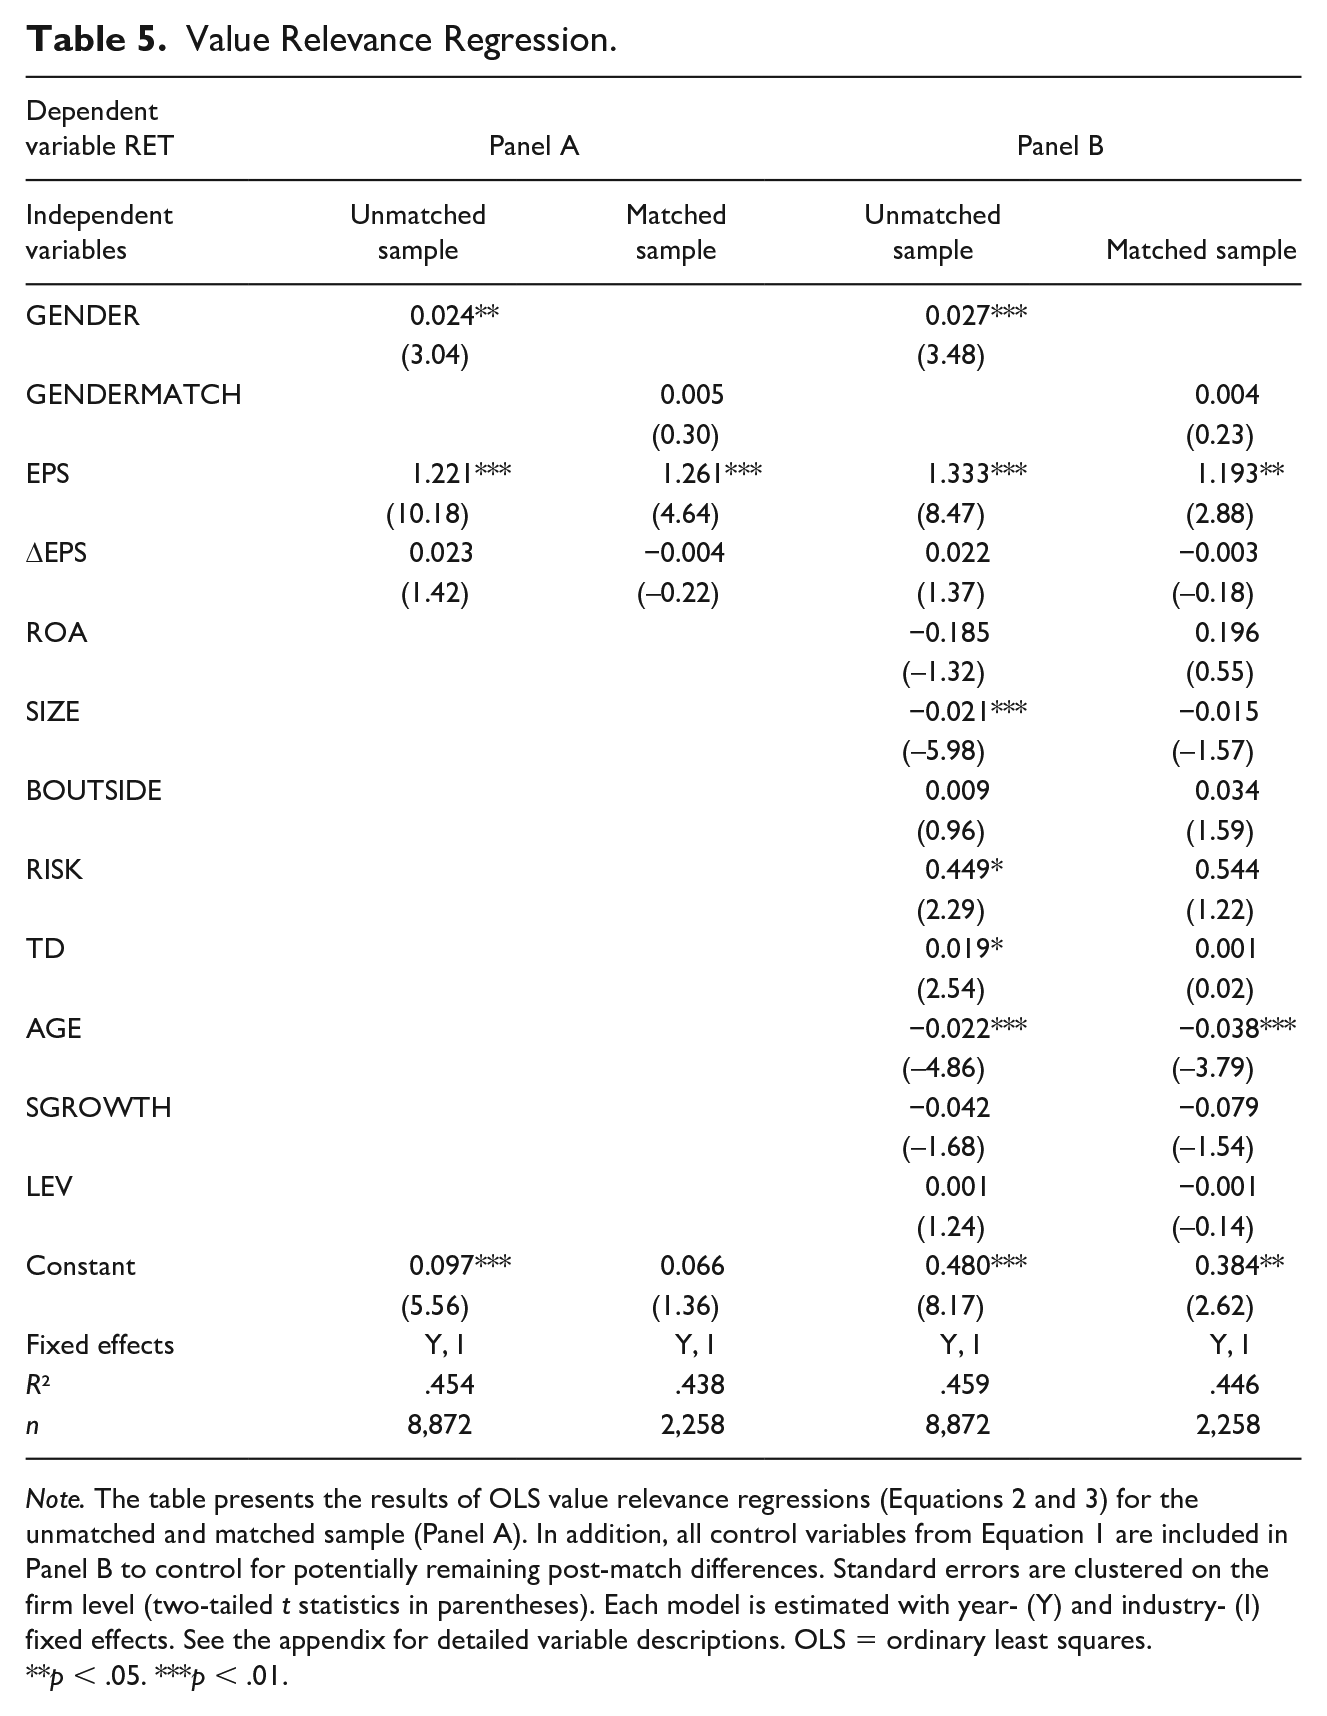
Note. The table presents the results of OLS value relevance regressions (Equations 2 and 3) for the unmatched and matched sample (Panel A). In addition, all control variables from Equation 1 are included in Panel B to control for potentially remaining post-match differences. Standard errors are clustered on the firm level (two-tailed t statistics in parentheses). Each model is estimated with year- (Y) and industry- (I) fixed effects. See the appendix for detailed variable descriptions. OLS = ordinary least squares.
p < .05. ***p < .01.
The coefficients on the GENDER indicators are significantly positive at least at the 5% level (p < .05). This confirms the pre-match univariate results. When we focus on matched pairs, the coefficients on GENDERMATCH remain positive but are insignificant. This implies that, by only considering comparable firms, female board representation has no incremental predictive value for stock returns.
Summing up, the results from comparing all board gender diverse firms with their counterparts reveal that GENDER has a significantly positive association with stock returns. Considering only matched pairs (i.e., a more comparable set of firms), the significant association vanishes. Hence, long-term changes in shareholder wealth seem independent from board gender diversity per se. To put it differently, just appointing (more) women to corporate boards (for instance, due to demand-side regulation), without putting in place additional good governance mechanisms and procedures, will likely be insufficient from the perspective of shareholders.
Gender Diversity Expectations Model
Table 6 reports results of our multivariate cross-sectional gender diversity expectations model employing the unmatched sample. In the first column, we present the pooled sample (Model 1). Furthermore, we conduct several additional tests. First, we split our sample according to the median of overall societal gender equality, based on World Economic Forum’s Global Gender Gap Index (GGGI; Model 2). Second, we split the sample into firms which established a board gender diversity policy and those that did not (Model 3). We follow Rhode and Packel (2014) and argue that corporations with an explicit commitment to gender diversity have access to a broader talent pool with diverse leadership skills. To identify firms with gender diverse policies, we use the variable CGBSDP0013 from the Asset4 database. It presents an indicator whether a firm has committed itself to a policy of board gender diversity (BOARD_POL). Third, we split the sample into industries in which women are historically more highly represented on corporate boards (i.e., service-oriented, labor-intensive, and consumer product industries; Cumming et al., 2015; Farrell & Hersch, 2005; Harrigan, 1981) and their counterparts (Model 4).
Gender Diversity Expectations Model—Unmatched Sample.
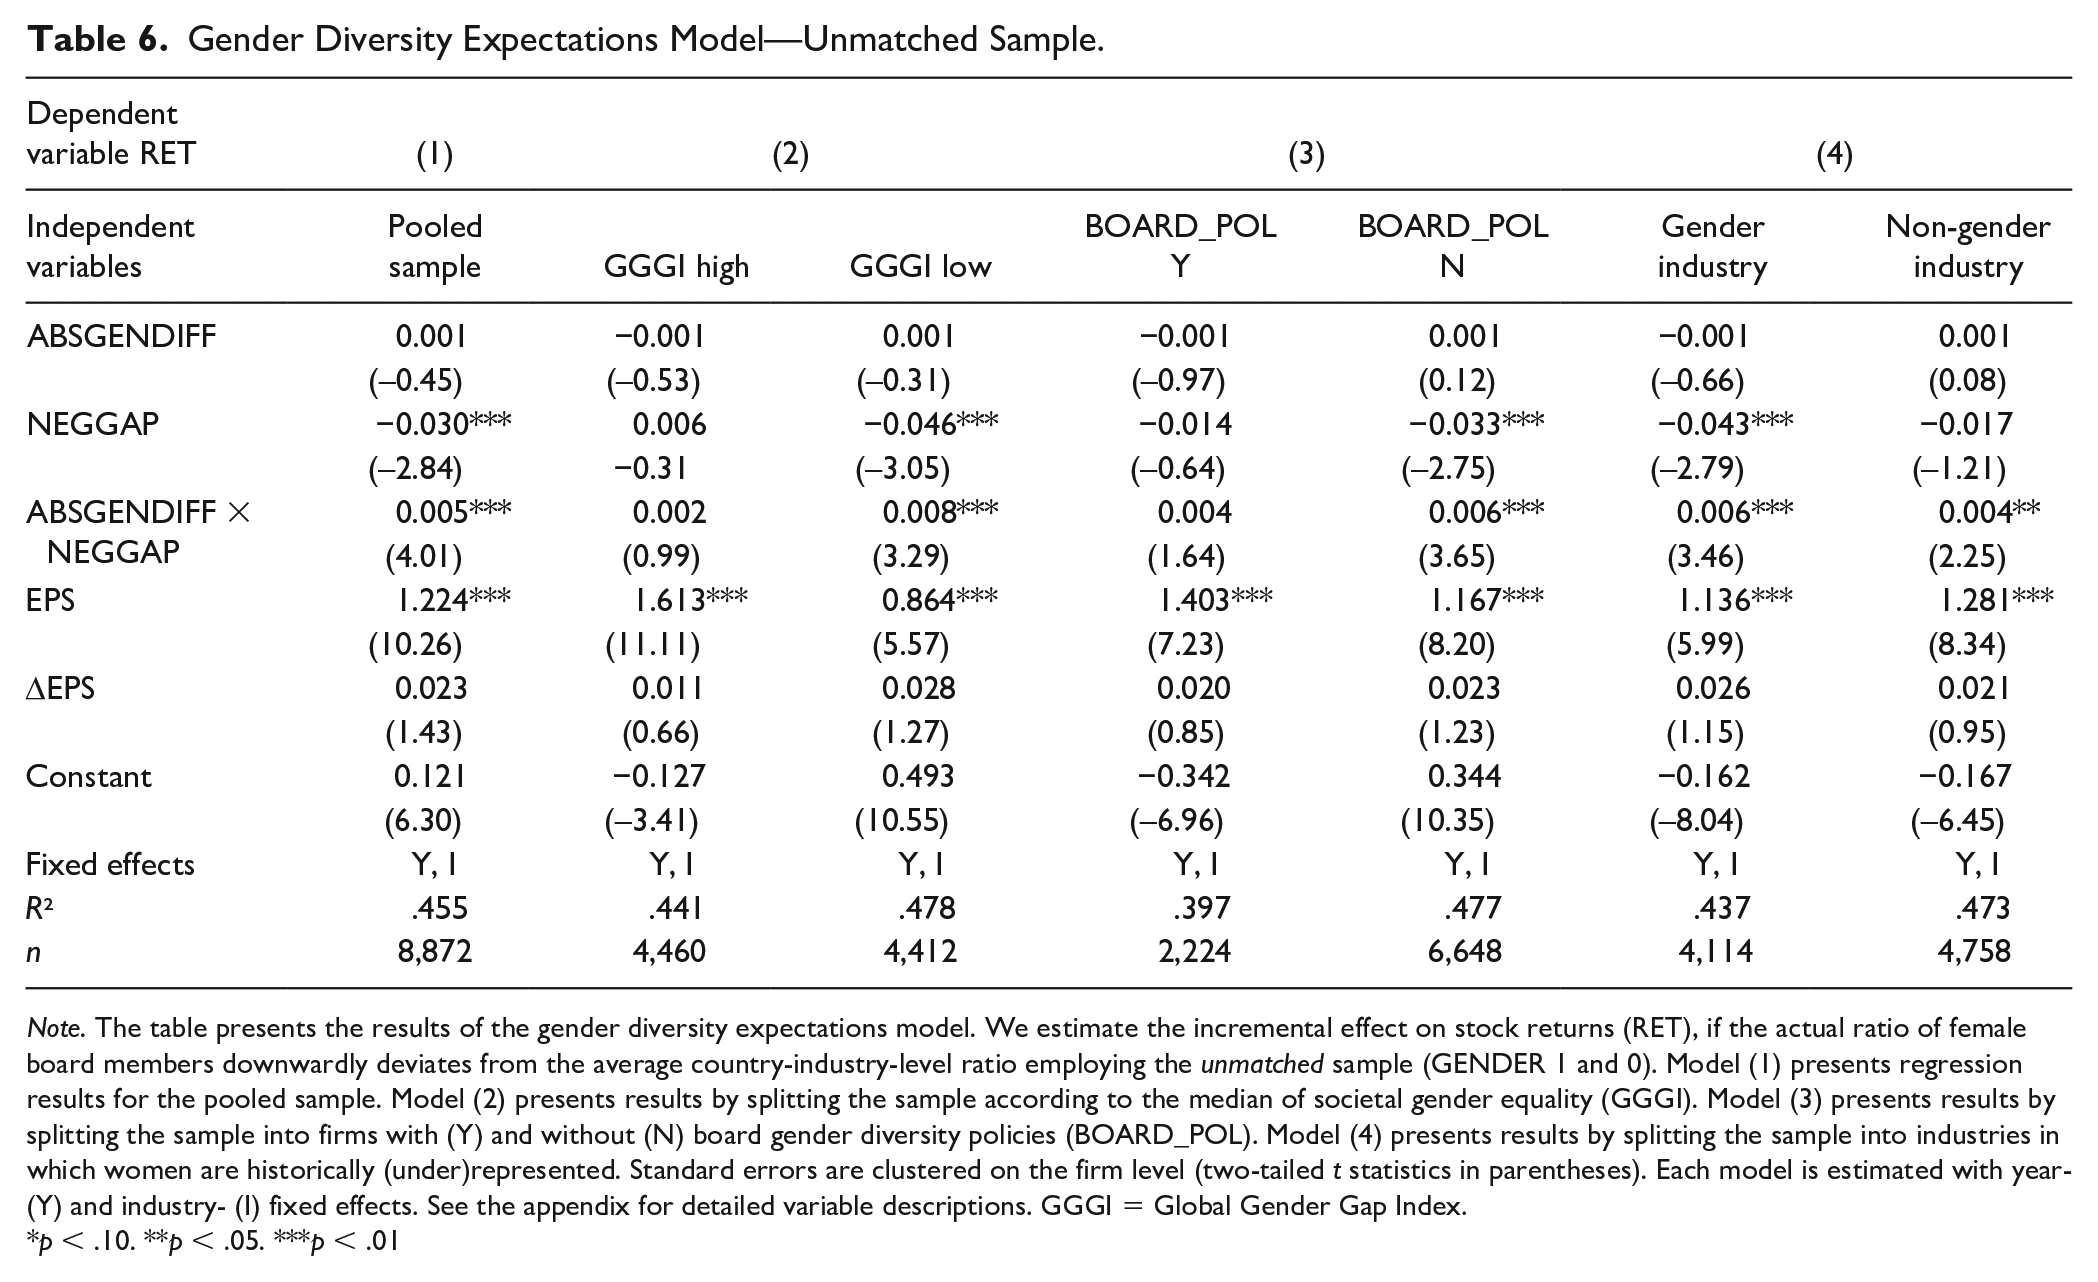
Note. The table presents the results of the gender diversity expectations model. We estimate the incremental effect on stock returns (RET), if the actual ratio of female board members downwardly deviates from the average country-industry-level ratio employing the unmatched sample (GENDER 1 and 0). Model (1) presents regression results for the pooled sample. Model (2) presents results by splitting the sample according to the median of societal gender equality (GGGI). Model (3) presents results by splitting the sample into firms with (Y) and without (N) board gender diversity policies (BOARD_POL). Model (4) presents results by splitting the sample into industries in which women are historically (under)represented. Standard errors are clustered on the firm level (two-tailed t statistics in parentheses). Each model is estimated with year- (Y) and industry- (I) fixed effects. See the appendix for detailed variable descriptions. GGGI = Global Gender Gap Index.
p < .10. **p < .05. ***p < .01
The coefficient on the interaction term ABSGENDIFF × NEGGAP is significantly positive in the pooled sample (Model 1). This indicates that the more the actual ratio of female board members is below expectations (i.e., below the average proportion of women on boards in the respective country-industry cross-section), the more positive is the incremental effect on stock returns. Yet, the result seems primarily driven by firms located in countries with lower societal gender equality (Model 2). In countries which generally put less emphasis on empowering women, investors seem to punish firms for appointing female directors. Nevertheless, again attributable to endogeneity concerns, the unmatched sample may result in incorrect inferences. Therefore, Table 7 reports results based on the matched sample. For the pooled sample, the coefficient of the interaction term is now profoundly insignificant. In line with our previous results, board gender diversity exhibits no incremental (negative) effect on stock returns by only considering matched firms.
Gender Diversity Expectations Model—Matched Sample.
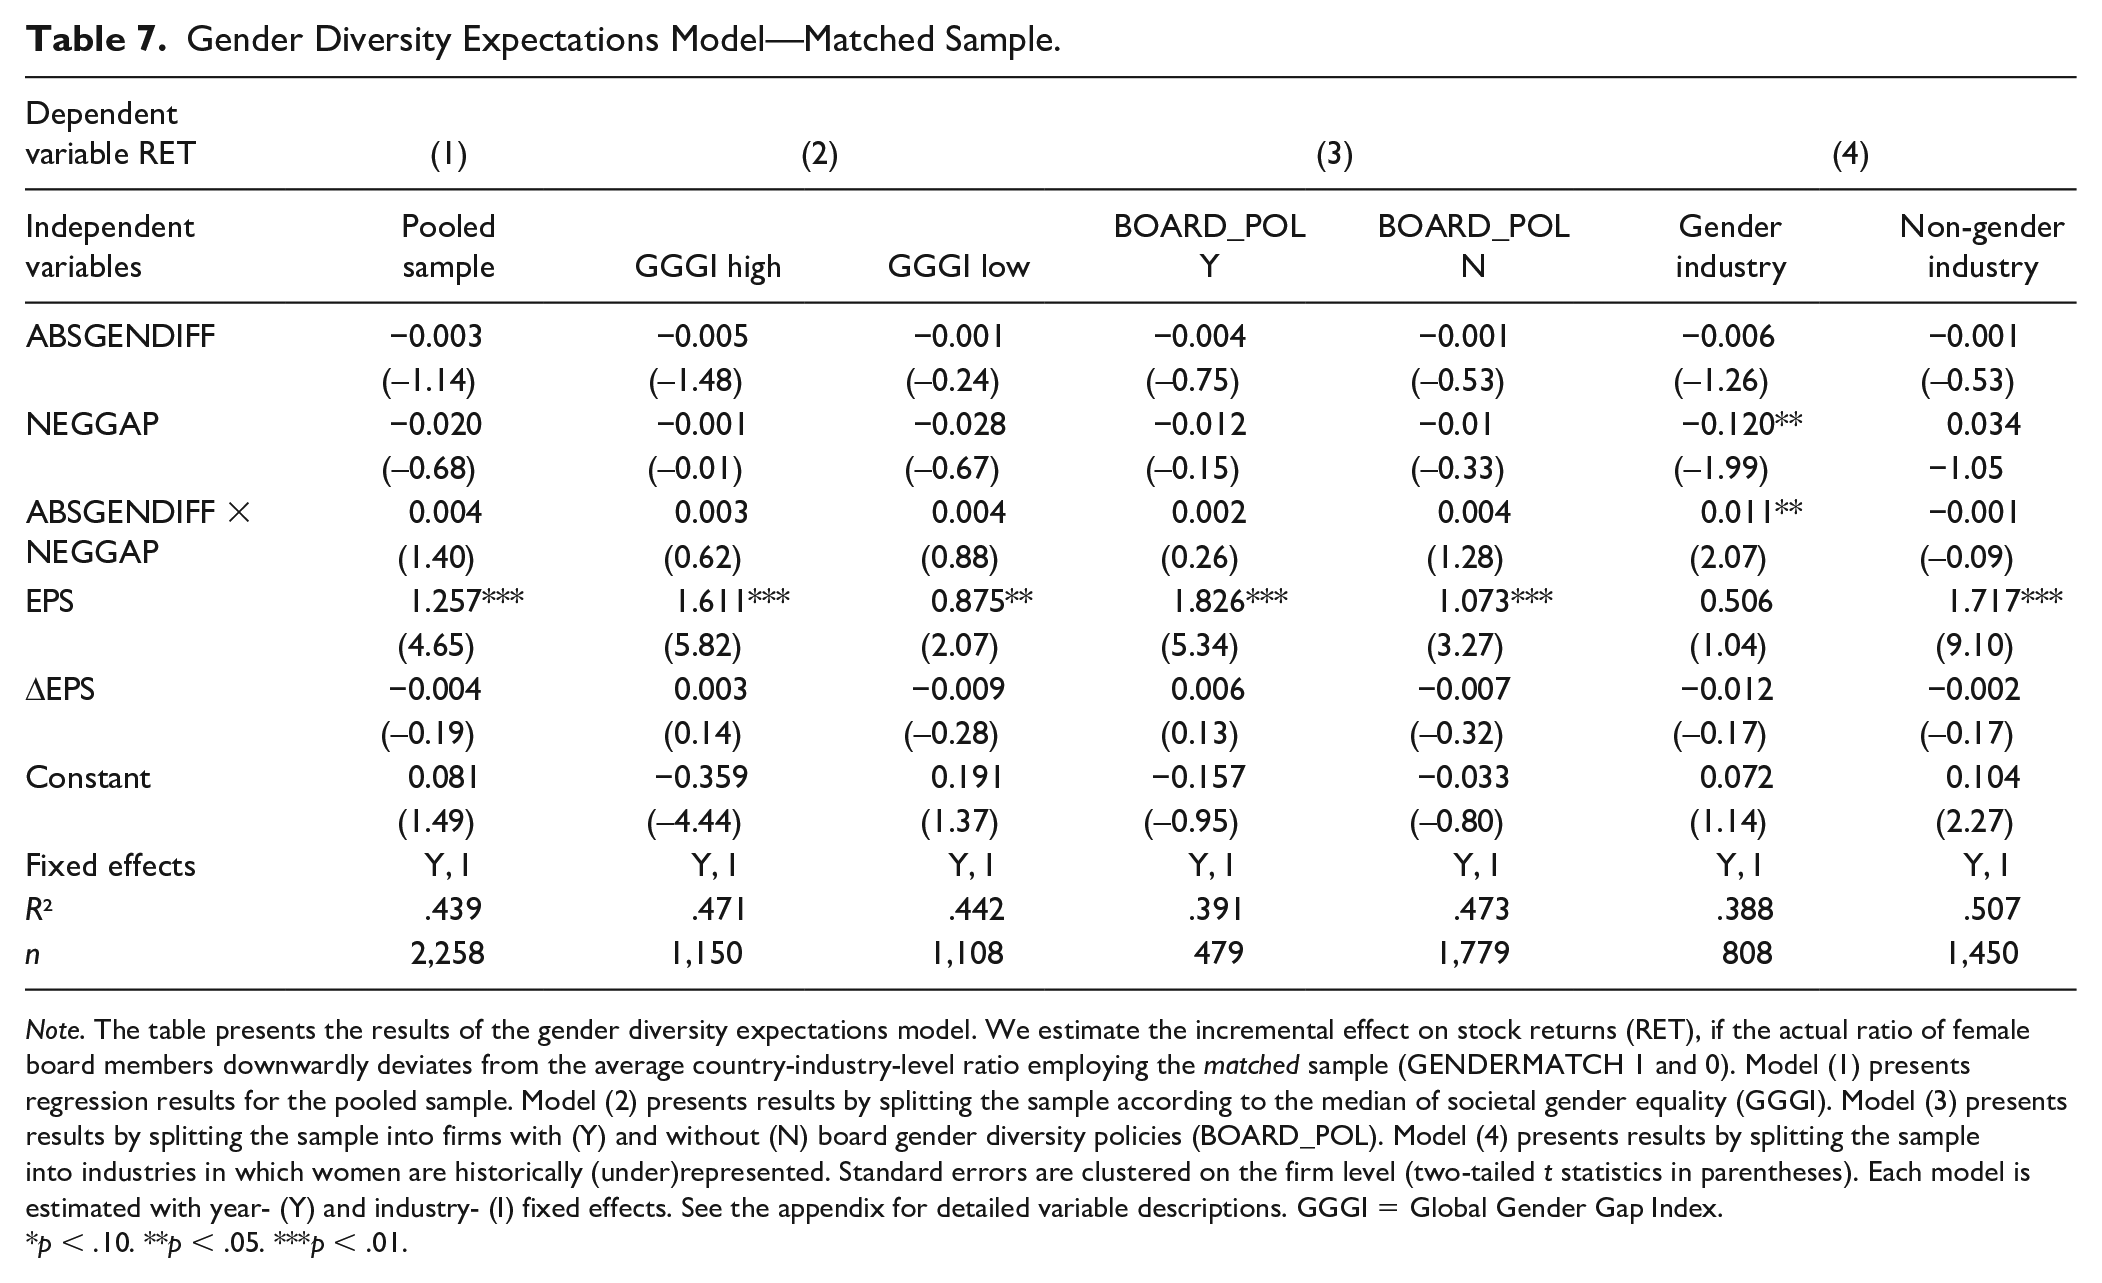
Note. The table presents the results of the gender diversity expectations model. We estimate the incremental effect on stock returns (RET), if the actual ratio of female board members downwardly deviates from the average country-industry-level ratio employing the matched sample (GENDERMATCH 1 and 0). Model (1) presents regression results for the pooled sample. Model (2) presents results by splitting the sample according to the median of societal gender equality (GGGI). Model (3) presents results by splitting the sample into firms with (Y) and without (N) board gender diversity policies (BOARD_POL). Model (4) presents results by splitting the sample into industries in which women are historically (under)represented. Standard errors are clustered on the firm level (two-tailed t statistics in parentheses). Each model is estimated with year- (Y) and industry- (I) fixed effects. See the appendix for detailed variable descriptions. GGGI = Global Gender Gap Index.
p < .10. **p < .05. ***p < .01.
Referring to the insignificant coefficients of the interaction term (ABSGENDIFF × NEGGAP) across the cross-sectional subsamples, we are able to confirm that firms do not exhibit impaired (nor improved) equity capital market performance if they downwardly deviate from the expected ratio of board gender diversity. While prior research finds that a gender-friendly societal climate seems to translate, on average, into increased female board participation (Loy & Rupertus, 2018), our results indicate that firms which do not conform to these expectations do not seem to get significantly punished (or rewarded) by investors.
Robustness Checks
We conduct several sensitivity tests and present the majority of their results in our online appendix. Our first set of robustness checks refers to the definition of GENDER. In our main results, we define GENDER as a dummy variable equal to 1 if a firm has at least one female board member, and 0 otherwise. However, using this indicator does not allow to make a convinced statement about the effect of adding more women. Prior research suggests that an unimpressive number of female board members would not receive great attention and only serve as a “token” (Adams & Ferreira, 2009; Rhode & Packel, 2014). Hence, we include three additional robustness checks. First, we compare firms with a very high number of female board members (i.e., the top quartile of the distribution of GENQUOT) with firms with a low degree of board gender diversity (i.e., the bottom quartile). 7 Second, we match firms with a female board ratio of at least 25% with firms that have no female board members, whatsoever (cf. Online Appendix D). Third, instead of binary indicators, we include the ratio of female board members and rerun Equations 2 and 3. In all additional specifications, the inferences from our main analysis hold (cf. Online Appendix E). Thus, we conclude that besides the effect regarding the presence of female board members, adding more women does not seem to have a significant impact on our results.
Our second set of robustness checks adjusts our dependent variable (i.e., stock returns). First, as we are explicitly interested in the long-term effect of gender diverse boards, we increase our investment horizon and look at 3-year buy-and-hold returns. This builds on the notion that some new strategies take more time to implement and come into effect (Pan et al., 2016; Wolfers, 2006). While one could also consider even longer periods, at significant data loss, 3 years are probably sufficient for market participants to finally assess board members’ quality. The inferences from our main analysis remain virtually unchanged. Moreover, we use annual market- and industry-adjusted stock returns as alternative measures of changes in shareholder value (cf. Online Appendix G). 8 Our results are insensitive to these adjustments. More specifically, the unmatched results of our value relevance as well as gender diversity expectations model remain positive and significant, while the matched results remain insignificant, with the exception of the gender diversity expectations model using 3-year buy-and-hold returns which are slightly positive (0.012) and barely significant at a 10% level.
Third, we acknowledge the fact, that there is an increasing amount of firms that voluntarily commit to governance policies with respect to gender diversity on their boards. Thus, we include BOARD_POL as an additional covariate in our PSM model (cf. Online Appendix H, Panel A). Results regarding our first hypothesis remain unchanged. Nevertheless, results of our gender diversity expectations model change slightly (cf. Online Appendix H, Panel B). The coefficient on the interaction term ABSGENDIFF × NEGGAP remains significant at a 5% level but is economically rather negligible (0.006). Moreover, the interaction term is essentially canceled out by the larger, but insignificant, coefficient on the baseline effect NEGGAP (–0.026).
In our fourth set of robustness checks, we rerun the PSM procedure only for countries that do not legally mandate a gender quota at some point during the sample period. However, our inferences remain unchanged (cf. Online Appendix I).
Fifth, our full sample is heavily skewed toward U.S. and Japanese observations. Prior literature suggests that differences in cultural factors and institutional systems might have a significant influence on the variation of female board representation (Grosvold & Brammer, 2011; Grosvold et al., 2016). Thus, we rerun all our regressions (a) without U.S. observations, (b) without Japanese observations, and (c) without observations from both countries (cf. Online Appendices J and K). However, our results remain virtually unchanged.
Sixth, over the course of our period under consideration, several countries in our sample enacted mandatory gender quotas as well as voluntary corporate governance code guidelines regarding board gender diversity. Thus, in our sixth set of robustness checks, we include indicators for gender quotas as well as corporate governance code stipulations in our value relevance and cross-sectional gender diversity expectations model (cf. Online Appendix L). Our results remain unchanged. Interestingly, returns seem to be systematically and significantly lower in countries which introduced a mandatory quota.
Seventh, to control for any remaining differences between the matched and unmatched sample, we also include all control variables from Equation 1 in our gender diversity expectations model (Equation 4; cf. Online Appendix M). Nevertheless, our main results remain unchanged.
Moreover, we also perform several minor robustness checks. First, we reduce the PSM caliper to 0.01. This modification forces matches to be even closer and, thus, results in a considerably smaller sample but qualitatively unchanged inferences in all analyses (untabulated). Second, we follow prior literature and employ 1-year lagged board gender information in our analysis, as the effect of gender diverse boards will most likely occur over time (Adams & Ferreira, 2009; Carter et al., 2010; Pan et al., 2016). Again, this decreases the number of observations, but all inferences from the matching procedure, the value relevance regressions, as well as the gender diversity expectations model remain qualitatively unchanged (untabulated). Third, we include country-fixed effects in all our multivariate analyses. As such, we control for country-specific, time-invariant institutional factors. However, our inferences remain robust (untabulated).
Discussion
The primary research questions addressed in this study are (a) whether female board participation, which is viewed negatively in much of the literature on short-term stock market reactions, also has adverse long-term effects on investors’ perception of the firm and (b) what is the effect on a firm’s stock performance if the actual degree of female board representation differs from investors’ expectations. Whereas most of the prior literature looks at the effects of board gender diversity on firms’ accounting performance in single-country settings (for a meta-analysis, cf. Post & Byron, 2015) or short-term announcement effects of female CEOs and directors (Kang et al., 2010; Lee & James, 2007), we focus on long-term stock market performance in an international setting, as it represents “the ‘gold standard’ measure of shareholder value” (Rhode & Packel, 2014, p. 391). Short-term market reactions only reflect market’s beliefs which may have more to do with gender stereotyping or social categorization tendencies (Gregory et al., 2013; Wolfers, 2006).
Our study offers two contributions with respect to theory. First, role congruity theory lays out that women are perceived less favorable in business contexts and especially leadership roles than men (A. E. Eagly & Karau, 2002). The fact that women on boards are still relatively rare might contribute to and reinforce this gender bias. As such, the predominantly adverse results pointed out in studies which focus on short-term market reactions to female executive and board appointments show that the market initially undervalues females and confirms notions that many investors negatively stereotype women (Dobbin & Jung, 2011; Farrell & Hersch, 2005; Kang et al., 2010; Lee & James, 2007). However, board members need some time to enact organizational changes and gain the trust of share- and stakeholders. Hence, the market undergoes an adjustment period to evaluate the actual (i.e., non-stereotypical) quality of board directors. Our results demonstrate that the market over the long term seemingly corrects the initial (i.e., short-term) mispricing due to gender stereotypes. Over the long term, there is no significant difference in the market reaction to male and female directors. Hence, this study contributes to a better understanding on how investors’ perception of female board members evolves beyond gender stereotypes and social categorization. Going beyond the short-term view is also beneficial from a societal point of view. As a lack of women on corporate boards seems demonstrably unfair, it is unsurprising that policy makers aim to eliminate this “ultimate glass ceiling.” Our results provide new evidence that board gender diversity does not come at the expense of investors—something opponents of mandatory gender quotas seem to commonly suggest (Ahern & Dittmar, 2012).
Second, in recent years, there is much pressure on firms from various stakeholder groups—besides policy makers—to improve their gender diversity and address the glass ceiling. We build on catering theory which argues that firms have an incentive to cater to investors’ and other stakeholders’ demands by appointing more women to their boards (Gosh et al., 2017; SEC, 2009). Given that an increasing number of investors demands a credible commitment to more female board representation (Rhode & Packel, 2014; Yermack, 2006), firms might get “punished” for non-compliance with these expectations. However, we find no evidence that these firms systematically incur lower stock returns. More importantly, our results also do not necessarily imply that the catering theory of board gender diversity is wrong. While some investors might consider gender diverse boards in their investment strategies (Byoun et al., 2016; Coffey & Fryxell, 1991), there are others that apparently do not, indicating a balancing effect. Nevertheless, as there is evidence that an increasing number of investors explicitly considers gender equality in their investment decisions (Byoun et al., 2016; Rhode & Packel, 2014), this result might shift over time.
Third, we offer some empirical contributions. Hermalin and Weisbach (2003) state that corporate board composition and its association with performance is a profoundly endogenous issue. However, this factor is largely ignored by the far majority of previous studies. To mitigate the issue, we employ the female director selection model developed by Hillman and colleagues (2007) as a first step in a recommended two-step approach (Post & Byron, 2015). It enables us to identify a comparable set of firms which only differs in terms of board gender diversity. As such, our PSM approach allows us to model a randomized quasi-natural experiment as closely as possible (Dehejia & Wahba, 2002; Rosenbaum & Rubin, 1983). In addition to the methodological contribution, most prior studies focus on single countries. Nonetheless, there is evidence that female board representation still differs significantly between countries (Grosvold, 2011; Grosvold et al., 2016; Loy & Rupertus, 2018; Terjesen & Singh, 2008), despite global advances to close the gender gap over recent years. Post and Byron (2015) argue that the relationship of female board representation and financial performance varies according to the level of gender parity in each country. Thus, one cannot generalize from single-country results.
Fourth, our study contributes to the social and economic debate regarding female board representation. Not only is it indisputable that female board representation should be increased due to social reasons such as ethics, equality, and participation (Grosvold, 2011; Grosvold et al., 2016; Terjesen et al., 2015; Valian, 1998), but it also seems to be economically prudent (cf. Post & Byron, 2015, for a review of the literature on the business case). Whereas one strand of literature finds that women have a positive impact on collaboration and effectiveness of corporate boards, another strand provides inconclusive results with respect to the association of female board representation with corporate (accounting) performance. Having said that, to this day, the association of board gender diversity and long-term stock market performance is still underexplored. It is common sense that investors value “high quality” directors (Cao & Donnelly, 2010; Schnatterly & Johnson, 2014; Yermack, 2006). As such, they emphasize board characteristics in their investment decisions (Bushee et al., 2014; Chung & Zhang, 2011; Yermack, 2006). However, according to our results, regardless of directors’ gender. Even if no mandatory gender quotas are imposed, stakeholders can and should encourage firms to continue to improve non-gender-biased hiring and promotion decisions. These increase the pool of talented women in middle management and professional functions, who will eventually rise to top management and corporate boards. Hence, the focus in the current debate regarding the business case of female board representation should primarily be placed on arguments with respect to improvements of, among others, board decision making, governance and strategy implementation, corporate reputation, and a firm’s workforce rather than mechanically expecting enhanced (accounting and stock market) performance. Our research shows that shareholders do not suffer from wealth losses from gender diversity and, thus, can “afford” to demand changes for societal and ethical reasons.
Limitations and Future Research
Our article should be examined in light of some limitations. Our sample is based on Thomson Reuters’ Asset4 database which includes the largest corporations across the globe. Therefore, our results might not be applicable to smaller stock corporations or smaller capital markets. Nonetheless, given the high market capitalization of our sample constituents, we are confident that we appropriately cover board gender diversity’s impact on an average investor’s wealth. Moreover, some smaller economies with the highest gender equality (e.g., Norway or Sweden) are not included in our sample because there are nearly any firms without female board representation. However, these countries are predominantly subject to mandatory gender quotas throughout our sample period, and previous research suggests negative capital market effects of such quotas (Ahern & Dittmar, 2012). Forcing an inclusion of these countries into our study would render our quasi-experimental approach useless.
Having said that, the distinct advantage of our PSM approach is that it allows us to draw quasi-causal inferences. However, while it performs well in our international setting, there might be additional observable and unobservable factors which also affect director selection and female board representation. Future research may identify additional covariates and improve the precision of the estimation model. Likewise, companies’ market values and equity returns depend on many more factors than just board gender equality (Gregory et al., 2013). While we employ a value relevance design, which is standard in the literature, and add further controls (Table 5, Panel B), as a second step after the director selection model, there might be additional influential factors to be assessed in future research. Finally, several countries in our sample have imposed mandatory gender quotas toward the end of—or after—our sample period (e.g., France, Germany). While we address this in a robustness check, future research may focus on the long-term capital market effects of quotas in these large economies.
Conclusion
In summary, our study aims to fill an important gap in the literature on investors’ perception and long-term effects of board gender diversity on firms’ stock market performance. Our results indicate that female board representation neither improves nor reduces firms’ long-term stock performance if one appropriately controls for the endogeneity of corporate board composition. Investors seem to perceive female and male board members as being equivalent in the long term. Nevertheless, a lack of women might seem demonstrably unfair and unethical.
The board is the focal point of an organization’s strategic decision making. It monitors important business activities, supervises management, liaises with auditors, (dis-)approves merger and financing decisions, and, finally, selects and appoints top executives. Over recent years, there have been reinforced calls for increased board gender diversity to make their approaches to new solutions and strategies more heterogeneous (Adams & Kirchmaier, 2015). Unsurprisingly, many stakeholder and investor groups demand improvements on the individual firm level. As such, besides the business case for gender diversity (Post & Byron, 2015), increasing the number of female board members should also be a social and ethical priority. Prior research attributes country-level differences in female board representation, among others, to differences in the percentage of women working full-time (Adams & Kirchmaier, 2015), female enrollment in tertiary education, country-specific societal climates of gender equality (Loy & Rupertus, 2018), and differences in national institutional systems (Grosvold, 2011; Grosvold & Brammer, 2011; Grosvold et al., 2016; Terjesen & Singh, 2008). Given the importance of this topic, it seems necessary to go beyond the conventional thinking in terms of the business case and broaden the perspective to also incorporate the social and ethical aspects of investing. As such, our study might be the missing bridge between both perspectives. For reasons of basic fairness, it seems to be an ethical imperative to narrow the gender gap—even more so as this apparently does not result in long-term economic harm to shareholders.
Supplemental Material
Online_Appendix_2020-05-09 – Supplemental material for How Does the Stock Market Value Female Directors? International Evidence
Supplemental material, Online_Appendix_2020-05-09 for How Does the Stock Market Value Female Directors? International Evidence by Thomas R. Loy and Hendrik Rupertus in Business & Society
Footnotes
Appendix
Variable Definitions.

| Variable | Description |
|---|---|
| ABSGENDIFF | The absolute difference between the observed proportion of female board members in a given firm and the expected ratio of female board representation. The expected ratio in the main analysis is the average ratio of female board representation across all firms in a given industry, by country and year. |
| AGE | The natural logarithm of firm age defined as the number of years since the date of incorporation (Source: Worldscope). |
| BOARD_POL | Indicator variable equal to 1 if the company has a policy regarding the gender diversity of its board, and 0 otherwise (Source: Asset4; code: CGBSDP0013). |
| BOUTSIDE | The natural logarithm of outside directors measured as the difference between total number of board members (Source: Asset4; code: CGBSDP060) and the number of executive directors. |
| EPS | Earnings per share (i.e., net income before extraordinary items scaled by the number of shares outstanding; Source: Worldscope). |
| ΔEPS | The year-to-year change in earnings per share (EPS) scaled by the stock price at the beginning of the fiscal year (Source: Worldscope). |
| GENDER | Indicator variable equal to 1 if a firm is included into the treatment group, and 0 otherwise. Our treatment group consists of firm-years, which exhibit at least one female board member (Source: Asset4; code: CGBSO17V). |
| GENDERMATCH | Indicator variable equal to 1 if a firm is (still) included into the treatment group after applying propensity score matching, and 0 otherwise. |
| GENDIFF | The signed difference between the observed proportion of female board members in a given firm and the expected ratio of female board representation. |
| GENQUOT | Observed percentage of women on the boards of directors (Source: Asset4; code: CGBSO17V). |
| GGGI | Index value of the Global Gender Gap Index (Source: World Economic Forum). |
| NEGGAP | Indicator variable equal to 1 if GENDIFF is negative, and 0 otherwise. |
| RET | Stock return is computed as year-end share price plus dividends per share minus prior year-end share price divided by prior year-end share price. We employ the period from 9 months before to 3 months after fiscal year-end. This corresponds with the timing of financial statement disclosures and shareholders’ meetings (Source: Datastream). |
| RISK | Rolling 5-year standard deviation of cash flow from operations (Source: Worldscope). |
| ROA | Return on assets is computed as net income before extraordinary items divided by total assets at fiscal year-end (Source: Worldscope). |
| SIZE | Firm size is proxied by the natural logarithm of total assets (Source: Worldscope). |
| SGROWTH | Average sales growth over the prior 3 fiscal years (Source: Worldscope). |
| TD | Is total diversification computed as , where Si is the share of the ith industry segment compared with total firm sales (Palepu, 1985). |
| YEAR | Indicator variables for year-fixed effects. |
Acknowledgements
We gratefully acknowledge comments and suggestions by Marcus Bravidor, Douglas Cumming, Benedikt Downar, Emilie Feldman, Rolf Uwe Fülbier, Gerard George, Maria Goranova (the editor), Aparna Joshi, David Reeb, Jan Seitz, three anonymous referees, delegates at the 38th European Accounting Association Annual Congress in Maastricht, delegates at the 78th Annual Congress of the German Academic Association of Business Administration in Munich, and seminar participants at the University of Bayreuth. We are especially grateful to the World Economic Forum for providing historical data on the Global Gender Gap Index. We also thank Isabell Keller, Sophie Kobes, and Marie-Thérèse Meyer for excellent research assistance.
Authors’ Note
The paper was previously circulated under the title “Board Gender Diversity and Its Effects on Capital Markets: New International Evidence.”
Declaration of Conflicting Interests
The authors declared no potential conflicts of interest with respect to the research, authorship, and/or publication of this article.
Funding
The authors received no financial support for the research, authorship, and/or publication of this article.
Supplemental Material
Supplemental material for this article is available online.