
Abstract
Promoting reasoning is the goal of mathematics education. While reasoning behaviours can be observed, how to characterise them and nurture their growth remains ambiguous. In this article, we report our effort in drafting a learning progression and geometric thinking model and using them to investigate Australian students’ geometric reasoning abilities. The data were taken from a large-scale study into the development of mathematical reasoning. Rasch analysis resulted in eight thinking zones being charted. Using a mixed method, we analysed 446 Year 7 to 10 students’ responses on a task that requires them to enlarge a logo, state its coordinates and calculate the enlarged area. In-depth, fine-grained analysis of students’ explanations revealed the range of skills and techniques students used to reason about the situation. The findings suggest that higher level reasoning was characterised by evidence of increased visualisation skills and proficient use of mixed mediums to communicate intent. The implications of the findings for curriculum and classroom practice are discussed.
Introduction
Learning progression research has gained popularity in recent years for affording a framework that supports the design of learning goals, instruction, classroom assessments and teacher professional development (Cobb et al., 2017; Confrey et al., 2019; Seah & Horne, 2019). The basic tenet for this approach is to prioritise the core concepts of domain knowledge and use evidence-based assessment data to inform teaching. Research has shown that such practice is an effective means of meeting students’ learning needs (Furtak et al., 2014; Goss et al., 2015). As such, learning progression research may provide insights into our understanding of mathematical reasoning, specifically in this article, geometric reasoning. Mathematical reasoning is one of four proficiencies that underpin the Australian Curriculum: Mathematics (AC: M) (Australian Curriculum Assessment and Reporting Authority [ACARA], 2020). International assessments such as the Programme for International Student Assessment have shown that Australian students’ mathematical literacy ability is in a long-term decline, equivalent to the loss of more than a year’s worth of schooling since 2003 (Thomson et al., 2019). Australian students are particularly weak in geometry (Thomson et al., 2017) and in ‘formulating situations mathematically and employing mathematical concepts, facts, procedures and reasoning’ (Thomson et al., 2013, p. x).
In this article, we consider the nature of mathematical reasoning and the challenge of defining and constructing a geometric reasoning learning progression. Next, we synthesise literature from geometry education, spatial reasoning and cognitive science to construct a geometric thinking model and use it to study reasoning. We then analyse a set of data taken from a larger project to highlight the challenges we face when measuring and validating geometric reasoning and consider the implications for teaching, assessment, and curriculum development.
The nature of mathematical reasoning
Mathematical reasoning is not a monolithic construct. Classic forms of mathematical reasoning can be defined in terms of its structure, the form in which it is expressed, deductively, inductively or abductively. Deductive reasoning is about proving (Tall, 2014), changing the epistemic meanings of a narrative by organising several propositions into deductive steps to reach a proof (Duval, 2002). Inductive reasoning focusses on making inference and claim from the data for the purpose of generalisation. Abductive reasoning searches for similarity and differences to discover a new hypothesis. Complete abduction necessitates a combined abduction-induction process (Rivera, 2008). Jeannotte and Kieran (2017) assert that mathematical reasoning for school mathematics should consider both the structure and the process aspects. They proposed five processes relating to the search for similarities and differences: generalising, conjecturing, identifying a pattern, comparing and classifying. These processes are observable behaviours, as reflected in many curricular documents. For example, AC: M defines reasoning as ‘developing an increasingly sophisticated capacity for logical thought and actions’. Reasoning is observed when: … students explain their thinking, when they deduce and justify strategies used and conclusions reached, when they adapt the known to the unknown, when they transfer learning from one context to another, and when they compare and contrast related ideas and explain their choices. (ACARA website, 2020)
While reasoning behaviours are observable, how these actions are nurtured and developed is not clear. A case in point is the construct of geometry, sometimes regarded as the birthplace of deductive reasoning. Geometric reasoning is often defined as invention and use of formal conceptual systems to investigate shapes and space (Battista, 2001). Much of the work in this area is built on van Hiele theory (van Hiele, 1986), which determines children’s geometric thinking as moving through five levels: visualisation, analysis, abstraction, deduction and rigour. Considerable research has shown that van Hiele’s descriptions of the development of students’ geometric thinking is generally accurate and that it is difficult to reach the deduction level (Usiskin, 2012). We posit that being able to reason geometrically is more than memorising terminologies and applying theorems to known situations. Rather, it is about understanding a connected network of concepts and geometric relationships, the similarities and differences among them despite their orientation, and the medium in which they are presented. Since the word ‘geometry’ literally means ‘earth measure’, physical measurement should be an integral part of this reasoning process. Failure to do so has consequences in our students’ reasoning of measurement concepts.
Like many other countries, Australia is faced with decades of neglect in the teaching of geometry in favour of arithmetic and other mathematical concepts (Mammana & Villani, 1998; Olkun et al., 2017). The term ‘geometric reasoning’ was first introduced in Year 3 in the AC: M and focussed solely on angle relationships. The properties of triangles and quadrilaterals, and the concept of enlargement transformation using ratio and scale factors are addressed in Years 7 to 10. There is an implicit expectation from the curriculum developers that teachers are able to make connections among and across mathematics strands in order to promote thinking (Lowrie et al., 2012); in this case, linking knowledge of geometry when reasoning about measurement situations. An overwhelming body of research has shown that this is not the case. Many students and teachers are reported to have superficial understanding of many measurement concepts (Clements et al., 2017; Seah & Horne, 2020b; Smith et al., 2016). They confuse the concept of perimeter with the concept of area, volume with surface area, do not understand the concept of unit and indiscriminately apply formulas in problem solving situations. These errors are caused by a lack of understanding of the spatial structures of the attributes. Clements et al. (2018) reported on the prevailing poor performance of American students in the national educational assessments over the past 40 years, with measurement being the weakest of five sub-strands for fourth and eighth graders. Although comparable data have yet to be obtained, many Australian students face similar challenges (Outhred & Mitchelmore, 2000; Owens & Outhred, 2006; Seah & Horne, 2020b).
Learning progression research can complement the curriculum by encapsulating the concepts, procedures, dispositions and reasoning required to promote geometric reasoning. When reasoning is being practiced in class, it is often content and context specific. Structuring reasoning and its processes in terms of a specific field of studies allow researchers to make conjectures about the process of development, researching where students are in their learning journey and seeking ways to progress students learning to the next level.
Constructing a geometric learning progression
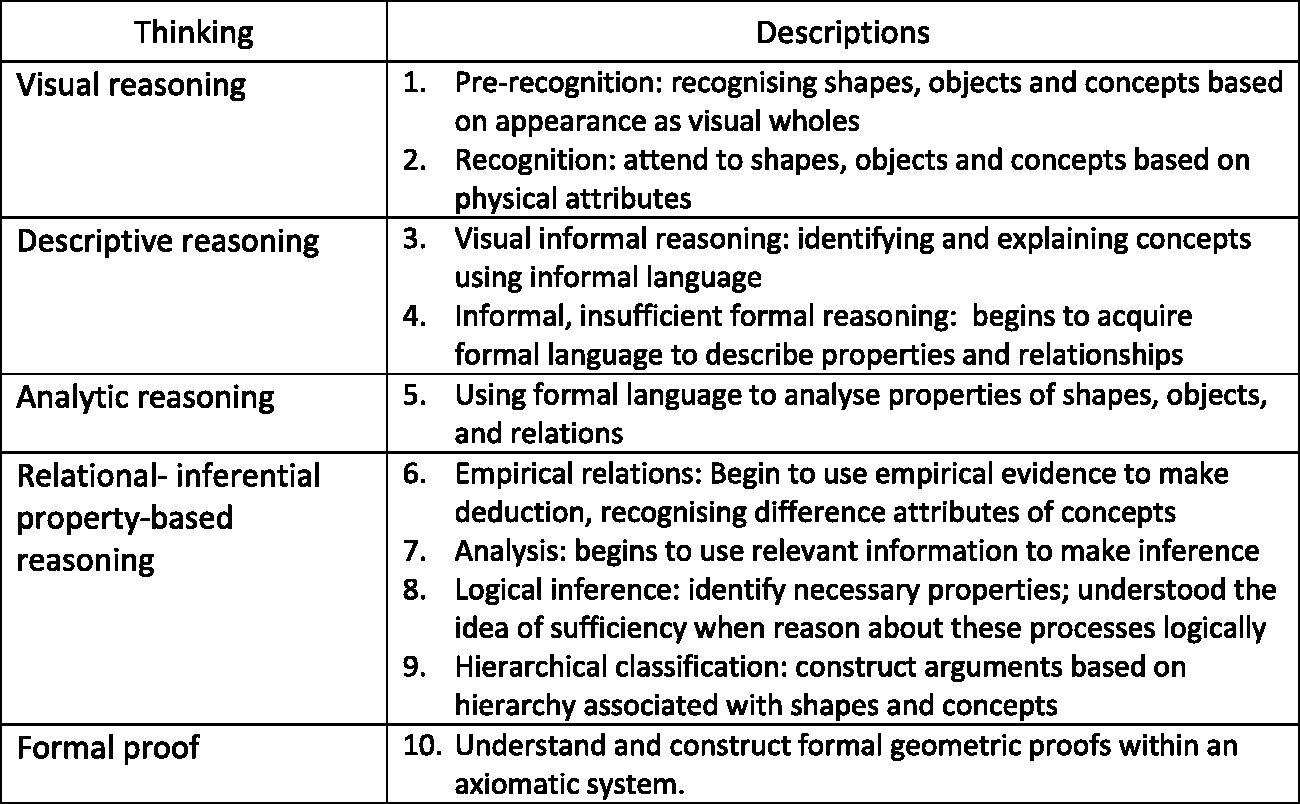
Following Confrey et al.’s (2019) metaphor of climbing a wall, we hypothesise that ‘there are a variety of starting points, and multiple paths, containing predictable obstacles and footholds to successfully reason mathematically’ (p. 79). This position allows us to study the complex levels of children’s thinking about a topic and why. Learning progressions are governed by three design principles; they are conjectural, grounded in research and instructionally useful (Sikorski, 2019). We first constructed a hypothetical geometric learning progression (HGLP) that reflects the curriculum requirements for teaching 2D shapes, 3D objects, locations and transformations, and measurement concepts. We then adapted the work of Clements and Battista (Battista, 2007; Clements & Battista, 1992), which is itself an expansion of van Hiele’s levels and proposed five levels of thinking (Figure 1). Within each level are sub-levels of thinking. These levels are seen as interconnected and develop progressively with various degrees of emphasis and importance depending on the task demand. They are plausible hypotheses of what researchers perceived students can do since the educator cannot know beforehand how a student will respond to a set of instructions (see Seah & Horne, 2019 for a more detail discussion on this).
An excerpt of the hypothetical geometric learning progression (Seah & Horne, 2019, pp. 167–169).
Theoretical framing
Mathematical reasoning is a discursive activity, a process of enculturating students to the ways of thinking and processing these ideas. Children’s learning of geometric ideas does not follow a linear path but is developed over time, becoming increasingly integrated and synthesised (Jones, 2002). We posit that engaging in geometric reasoning is dependent on the connectedness between multiple representations, visualisation and mathematical discourse (see Figure 2).
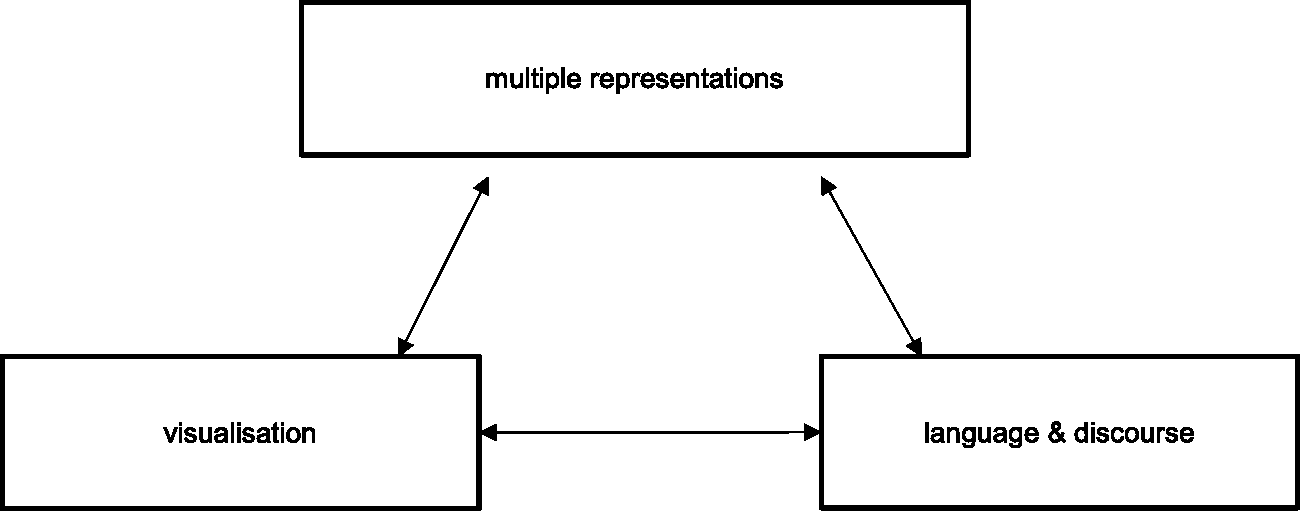
A geometric thinking model.
Mathematical concepts are abstract entities that rely on representations such as signs, characters, icons or objects that are used to stand for something else (Goldin, 2003); for example, a diagram of a triangle, or a set of symbols (3,4) depicting the coordinates of a position. These configurations form part of a larger representational system with primitive characters, rules and structure. There are two types of representational systems (Goldin & Shteingold, 2001). The external representational system refers to those with shared characteristics and bound by specific rules where meanings and conventions of the mathematical structures are established, such as (3,4) indicating the x coordinate first, followed by the y coordinates. The internal representation system comprises of personal reconstructions of images, either in ones’ mind or on paper, derived from own interpretations and interactions with the concepts. Making sense of mathematical concepts then, requires one to visualise and communicate the multiple representations used to express the idea.
As a cognitive process, visualisation plays a key role in helping individuals to interpret what they see within the network of their personal beliefs, experiences and understandings. For example, when asked to name the coordinates of a position, one must comprehend that the number 3 in (3,4) is the distance between 0 on the y axis to the 3 on the x axis and 4 is the distance between 0 on the x axis to 4 the y axis. Visualising, thinking and talking are inseparable cognitive processes. Our visual perception is influenced by the cognitive assumptions of the visualised object, and the discourse in which we engaged. Learning happens when there is a change in discourse in terms of keywords, visual mediators, narratives and routines (Sfard, 2008). In a mathematical discourse, keywords and visual mediators (representations used to express the abstract ideas) are used in distinctly mathematical ways. Both trigger images and emotions that are stored in memory, laden with personal beliefs and experiences and shape one’s thinking. Keywords are used to form descriptions and definition of a concept. Visual mediators such as graphs and coordinates serve as a focal point in the discussion and are how participants of a discourse identify the object of their talk. The narratives and routines carried out in a mathematics classroom further create sociomathematical norms through which mathematical reasoning is learned and practice (Sfard, 2008). The mathematical goal of the learning progression discussed here is the ability to visualise and use geometric knowledge to solve problems in measurement situations.
Method
The results reported here is part of a larger study into the development of mathematical reasoning. The Reframing Mathematical Futures II project was a four-year design-based research study aimed at establishing evidenced-based learning and assessment frameworks for algebraic, geometrical and statistical reasoning in the middle years of schooling (Siemon et al., 2018). The HGLP provided a basis for the development of rich assessment tasks and scoring rubrics to determine what students in Years 7–10 could do. An iterative cycle of designing, testing and re-designing to refine the HGLP was employed. The tasks were first administered to a group of trial schools which were not part of the main project, marked by two markers and validated by a team of researchers to ascertain the useability of the scoring rubric and accuracy of the data entry before using the assessment in the 32 main project schools. These project schools were secondary schools situated in lower socioeconomic regions with diverse populations across Australia. The schools for the project were chosen by the education authorities in each of the six states and the Northern Territory. Students completing the assessment answered a set of questions which differed for different groups so not all students answered all questions. In the project schools, a specialist teacher was identified and supported by a team of researchers to work with up to six other teachers in their school to trial assessment tasks and implement a targeted teaching approach on mathematical reasoning. Approximately 80 teachers in these team leading roles received three days face-to-face and ongoing online professional learning sessions per year for the three years of the project.
In this article, we report the results obtained from one of these tasks, coded as GCRD to mean Geometry Coordinate, which assesses students’ knowledge of transformation by enlargement, Cartesian coordinates, and area measurement (see Figure 3). We presented students with an authentic situation in which they were asked to enlarge a logo so that all the sides are twice as long as the original logo (item GCRD1). Next, they were asked to write down the coordinates of the vertices of the new large logo (item GCRD2) and calculate the area of the new logo and explain their reasoning (item GCRD3).
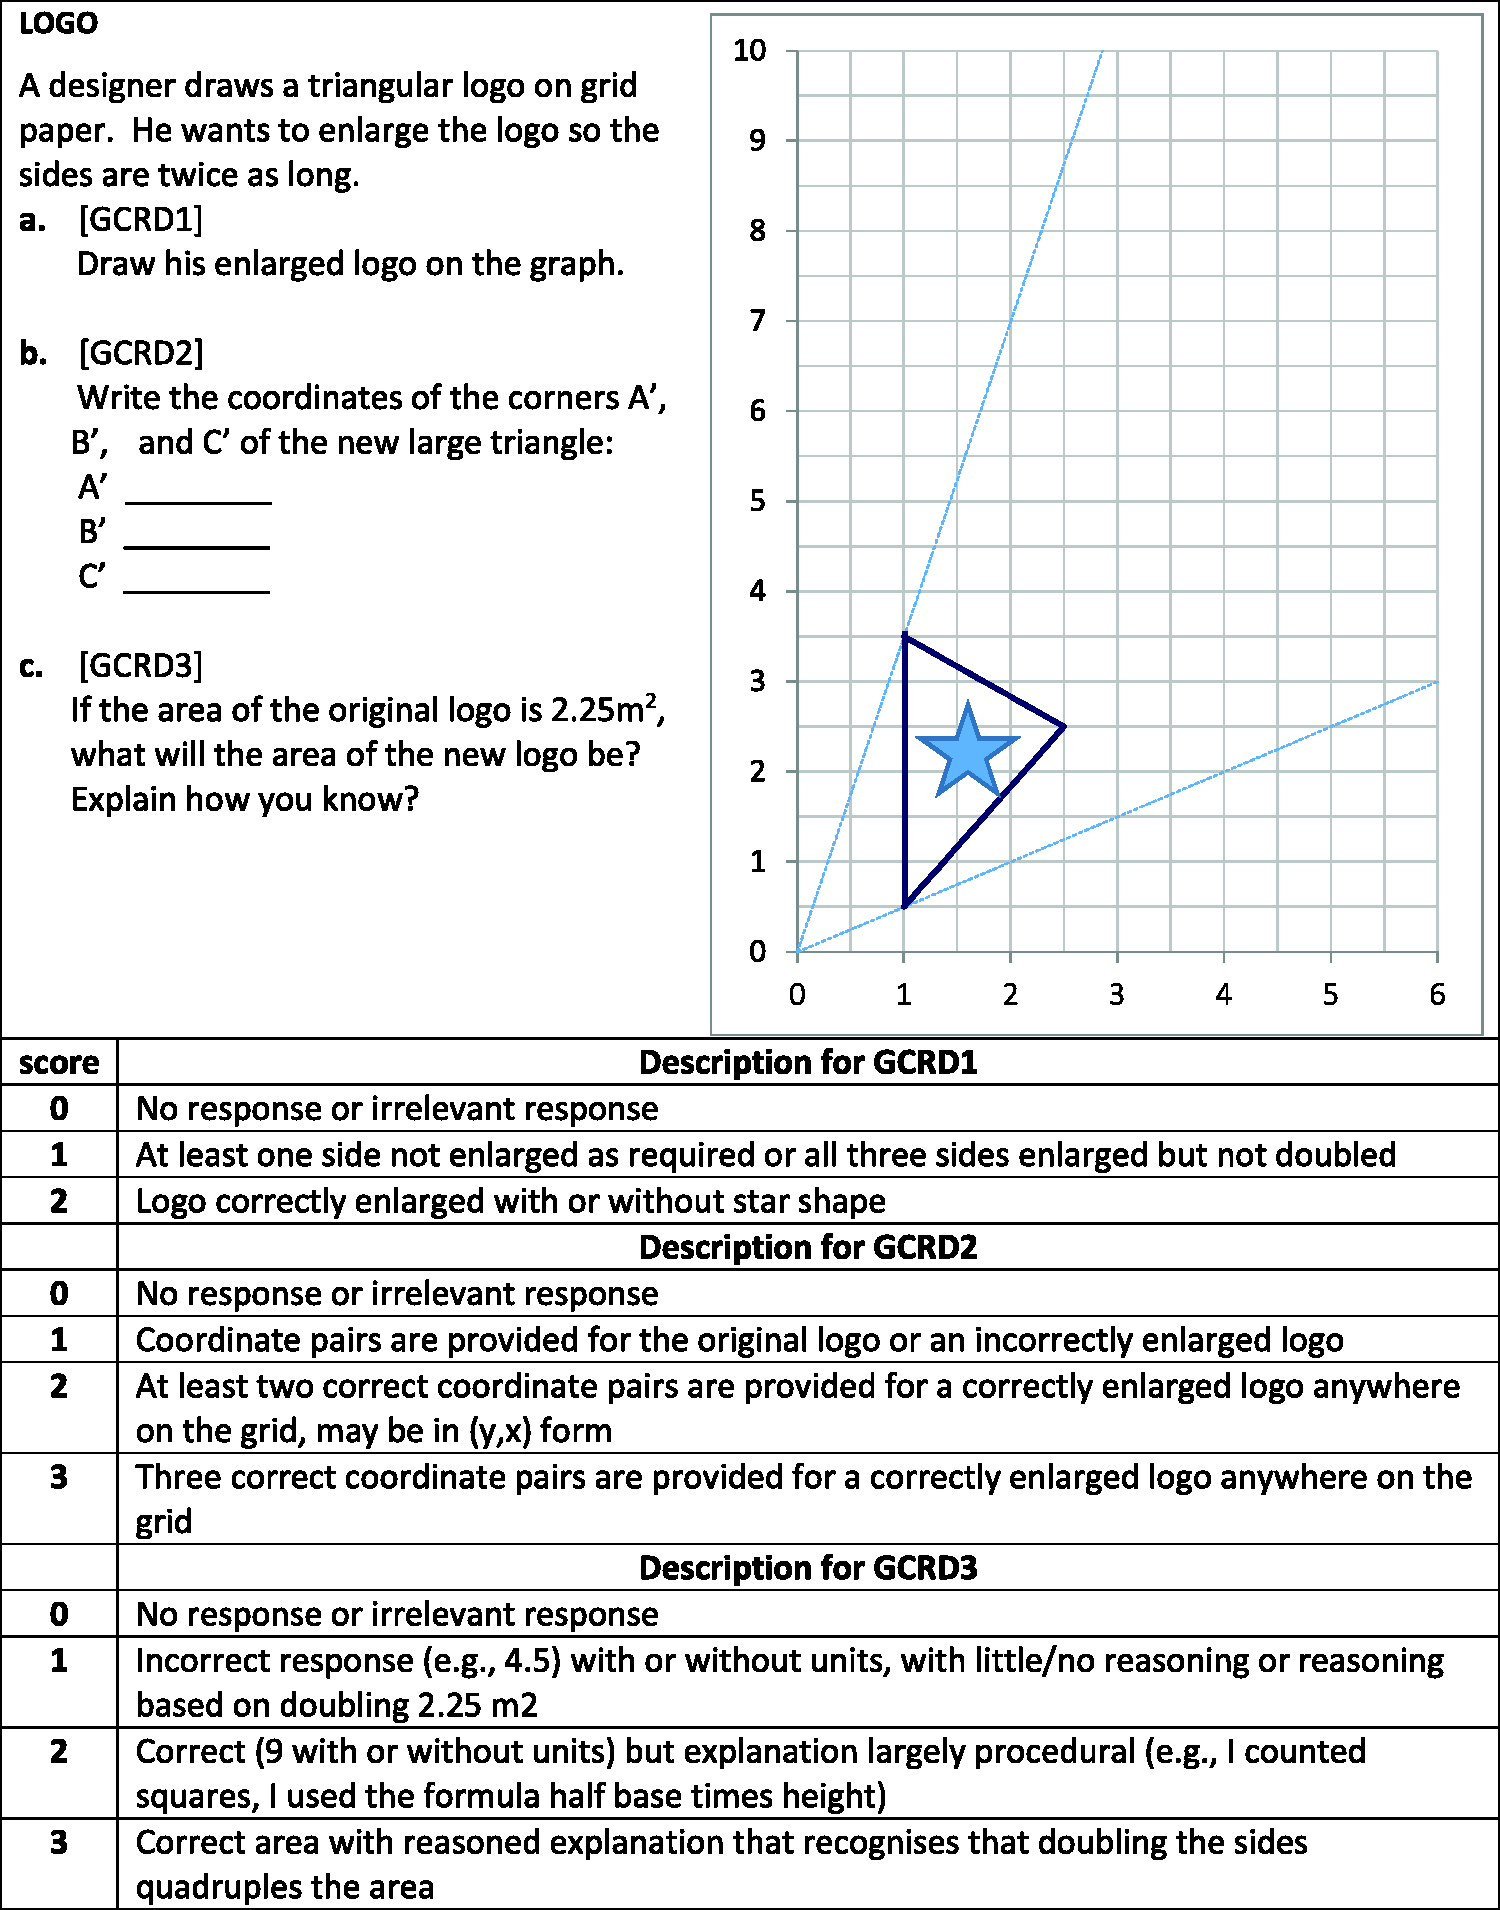
The logo task (GCRD) and marking rubric.
The first set of data – the trial data – came from 118 Year 7 to 10 students from two trial schools in two capital cities. The trial data were analysed by the researchers for validity through a careful check of the nature of the responses and the markers’ application of the rubric. The student scripts, which were the completed written assessment forms from these 118 students, were analysed in depth.
The second set of data – the main project data – consisted of the final scores from 328 students from seven schools in three different states. Teachers in each school decided which assessments their students would do, so the target questions were not completed by the whole project cohort. Teachers in the project schools had received training in the use of the rubrics and submitted the scores but retained the students’ completed assessment forms, so while their scores were used in the analysis their actual written scripts were not used.
Our purpose was to determine ‘where the learners are in their learning’ and develop a learning progression based on the evidence for what the students were able to do. We did this by applying a Rasch partial credit model (Masters, 1982) using Winsteps 3.92.0 (Linacre, 2017) on all geometric items to measure students’ reasoning. This process allowed us to validate the items used to create the scale through their fit to the model and provided an invariant measurement scale that can be used to identify longitudinal changes in students’ performance. An added benefit was the removal of the need for every student to attempt every item, thus providing the opportunity for a larger item pool to be used (see Siemon & Callingham, 2019 for an in-depth discussion). We also conducted in-depth analysis of students’ responses to the items. The constant comparisons of students’ responses within items and among different tasks enabled broad descriptions of thinking to be identified. It further supports theory construction as we sought to develop an instructional theory to nurture the development of geometric reasoning.
Results
Rasch analysis of thinking zones
Figure 4 shows the variable map for geometric reasoning (using all geometry items) produced through Rasch analysis. The map is grouped into the three content domains: (1) properties and hierarchy, (2) transformation of relationships and (3) geometric measurement and shows where all the items sit in relation to others. Some items contributed to more than one domain, such as the task reported here. Item GCRD1 and GCRD2 are highlighted and are grouped under the transformation of relationships, together with other items such as GSYM – an item that required students to reason about symmetrical shapes. Item GCRD3, also highlighted, is grouped under geometric measurement, together with GSZLSA – an item that required students to reason about surface area. The codes have an addendum that indicates the response score, so GCRD3.2 means a rubric score of 2. The degrees of item difficulties were ranked from easiest (bottom of the map) to most difficult (top of the map). For example, non-isometric enlargement of shapes is in zone 3 (GCRD1.1), and isometric enlargement is in zone 5 (GRCD1.2). Knowledge of Cartesian coordinate systems is in zone 6, and reasoning about area measurement (GRCD3.3) is in zone 7.
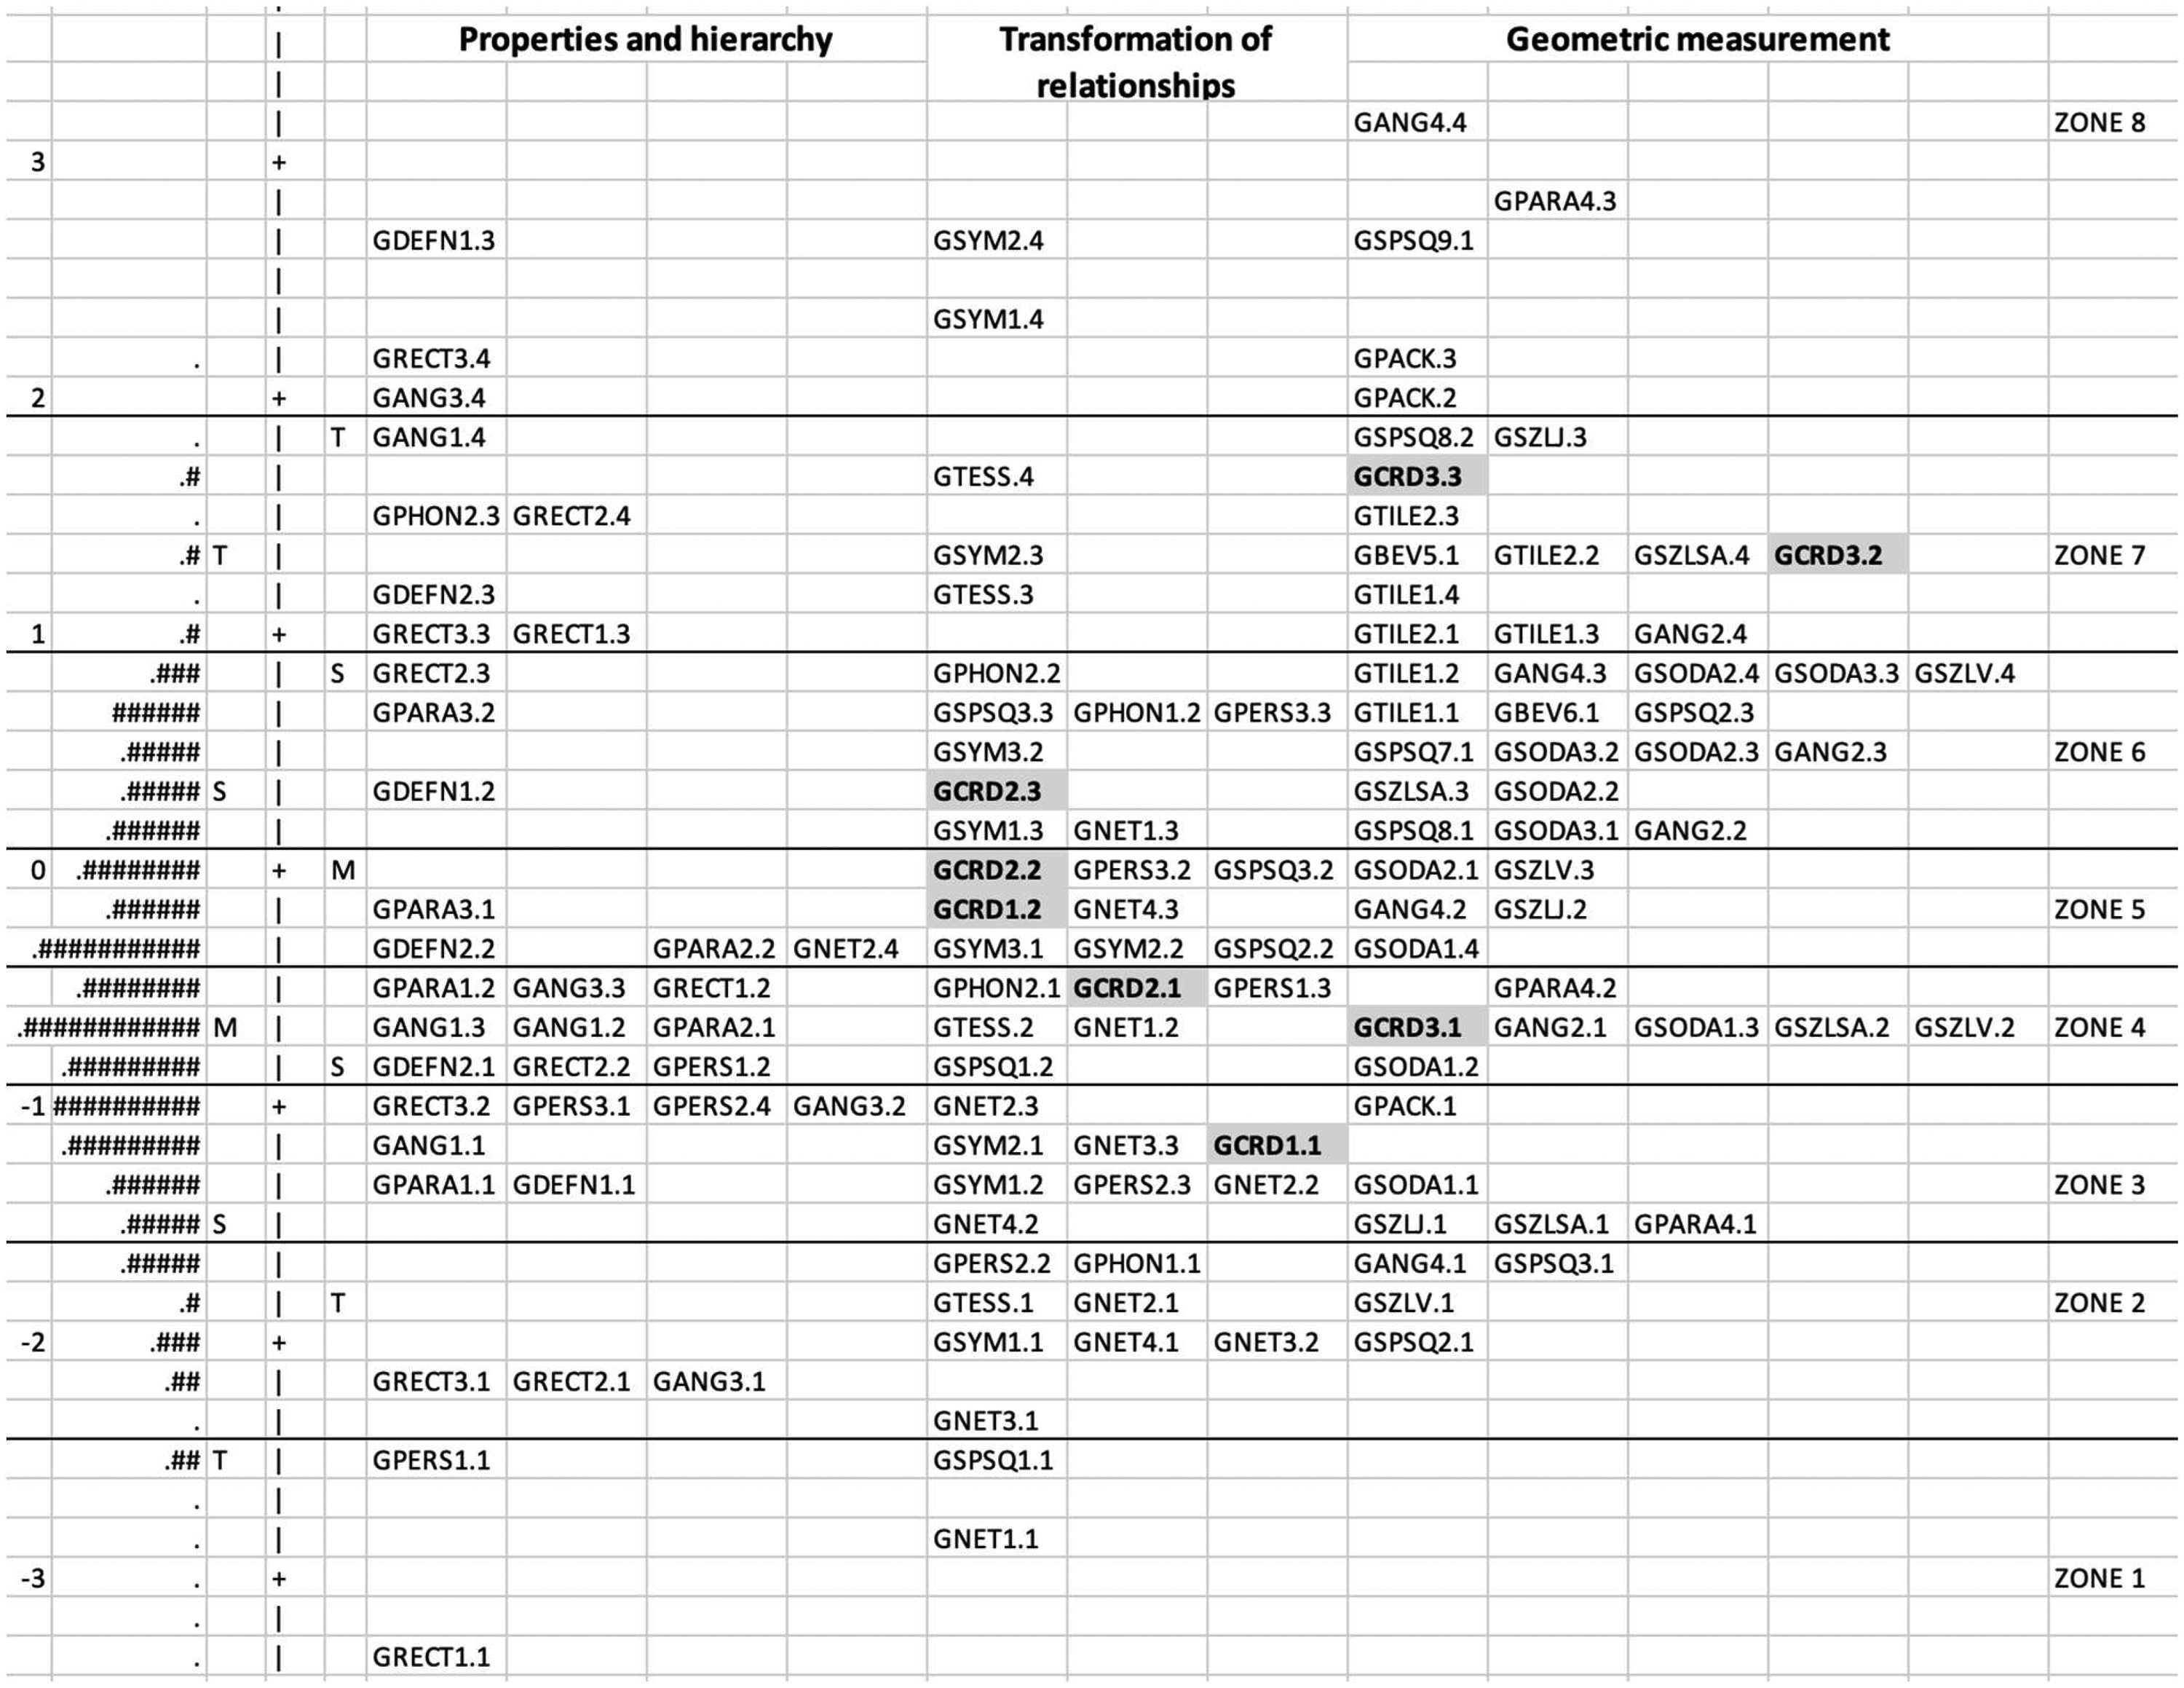
Excerpt from the variable map for geometric reasoning (n = 1041).
Specialist members of the research team interrogated the student responses located at similar points on the scale to decide whether there were qualitative differences in the nature of adjacent responses with respect to the sophistication of the mathematics or mathematical reasoning involved and/or the extent of cognitive demand required. For example, the thinking needed to calculate the area of the larger logo (GCRD3.3) is in the same zone as knowledge of shape properties (e.g. GANG1.4 and GRECT2.4) and calculation of surface area (GSZLSA.4, see Seah & Horne, 2020a for further discussion on this). This process established cut-off points between zones and supported the development of broad descriptions of the characteristic behaviours evidenced at each zone to serve as interpretations.
Item analysis of student responses
Analysis of students’ responses on each item showed that although there were slight variations in student performances, both cohorts’ knowledge of transformation, coordinate systems and area measurement were poor. As shown in Table 1, the trial data show a developmental progression in students’ reasoning. The number of ‘no response’ or ‘irrelevant response’ decreased with year level, with a corresponding improvement in students’ reasoning across the three items. Conversely, the data for the project schools were somewhat erratic. There was an increase of ‘no response’ in Year 9 for GCRD1 and in Year 8 and 10 for GCRD3. While there was an increase in performance across year levels for GCRD1 and GCRD2, the Year 9 and 10 main project students’ performance was poorer than that of the Year 8 main project students and their year-level counterparts in the trial schools for GCRD3. Moreover, students in each year level found calculating the area of the new logo the most challenging item to address.
Overall results (expressed as percentages) for the Coordinate task GCRD.
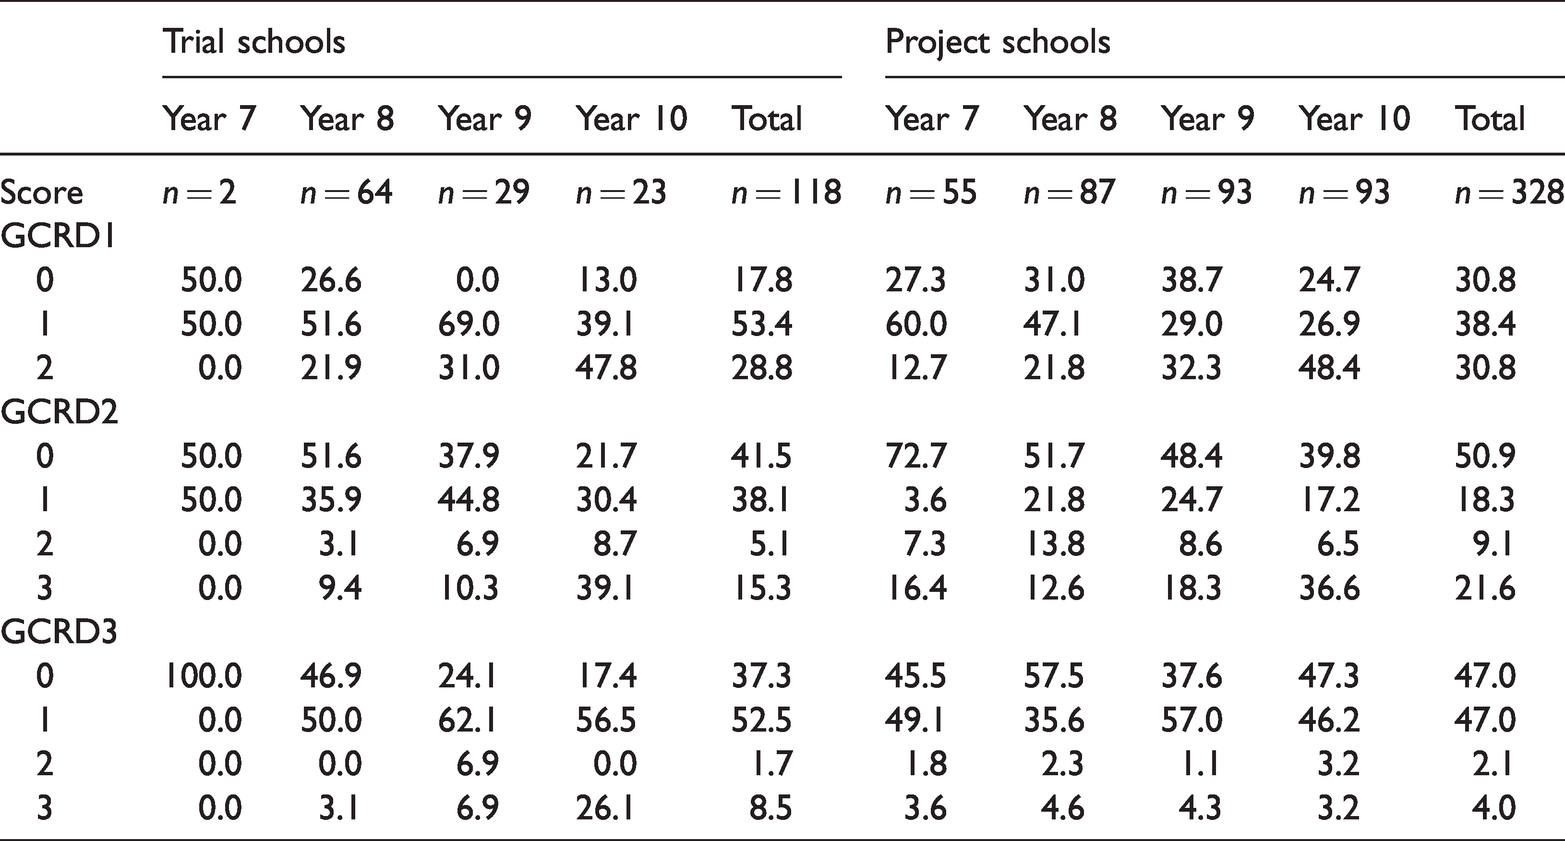
In the remaining analysis, all of the data are from the scripts of the trial school students. In GCRD1, of the 17.8% of trial schools students who scored ‘0’, 12.7% did not produce a drawing. The remainders either drew a right-angled triangle, a vertical line next to the logo or connected the two rays to make a triangle, as seen in Figure 5. These students also struggled with the concept of coordinates and were unable to work out the area of the logo. Of the 53.4% who produced a non-isometric drawing (GCRD1.1), the majority took their bearing from the vertical line (e.g. see Student 10DZ21800) and enlarged this side length correctly; 63.5% of them had one set of coordinates fixed on the lower ray, and 9% had two sets of coordinates on both rays. Some students disregarded the grids and enlarged the logo by measuring the side length (e.g. Student 8MC27602, in Figure 5).
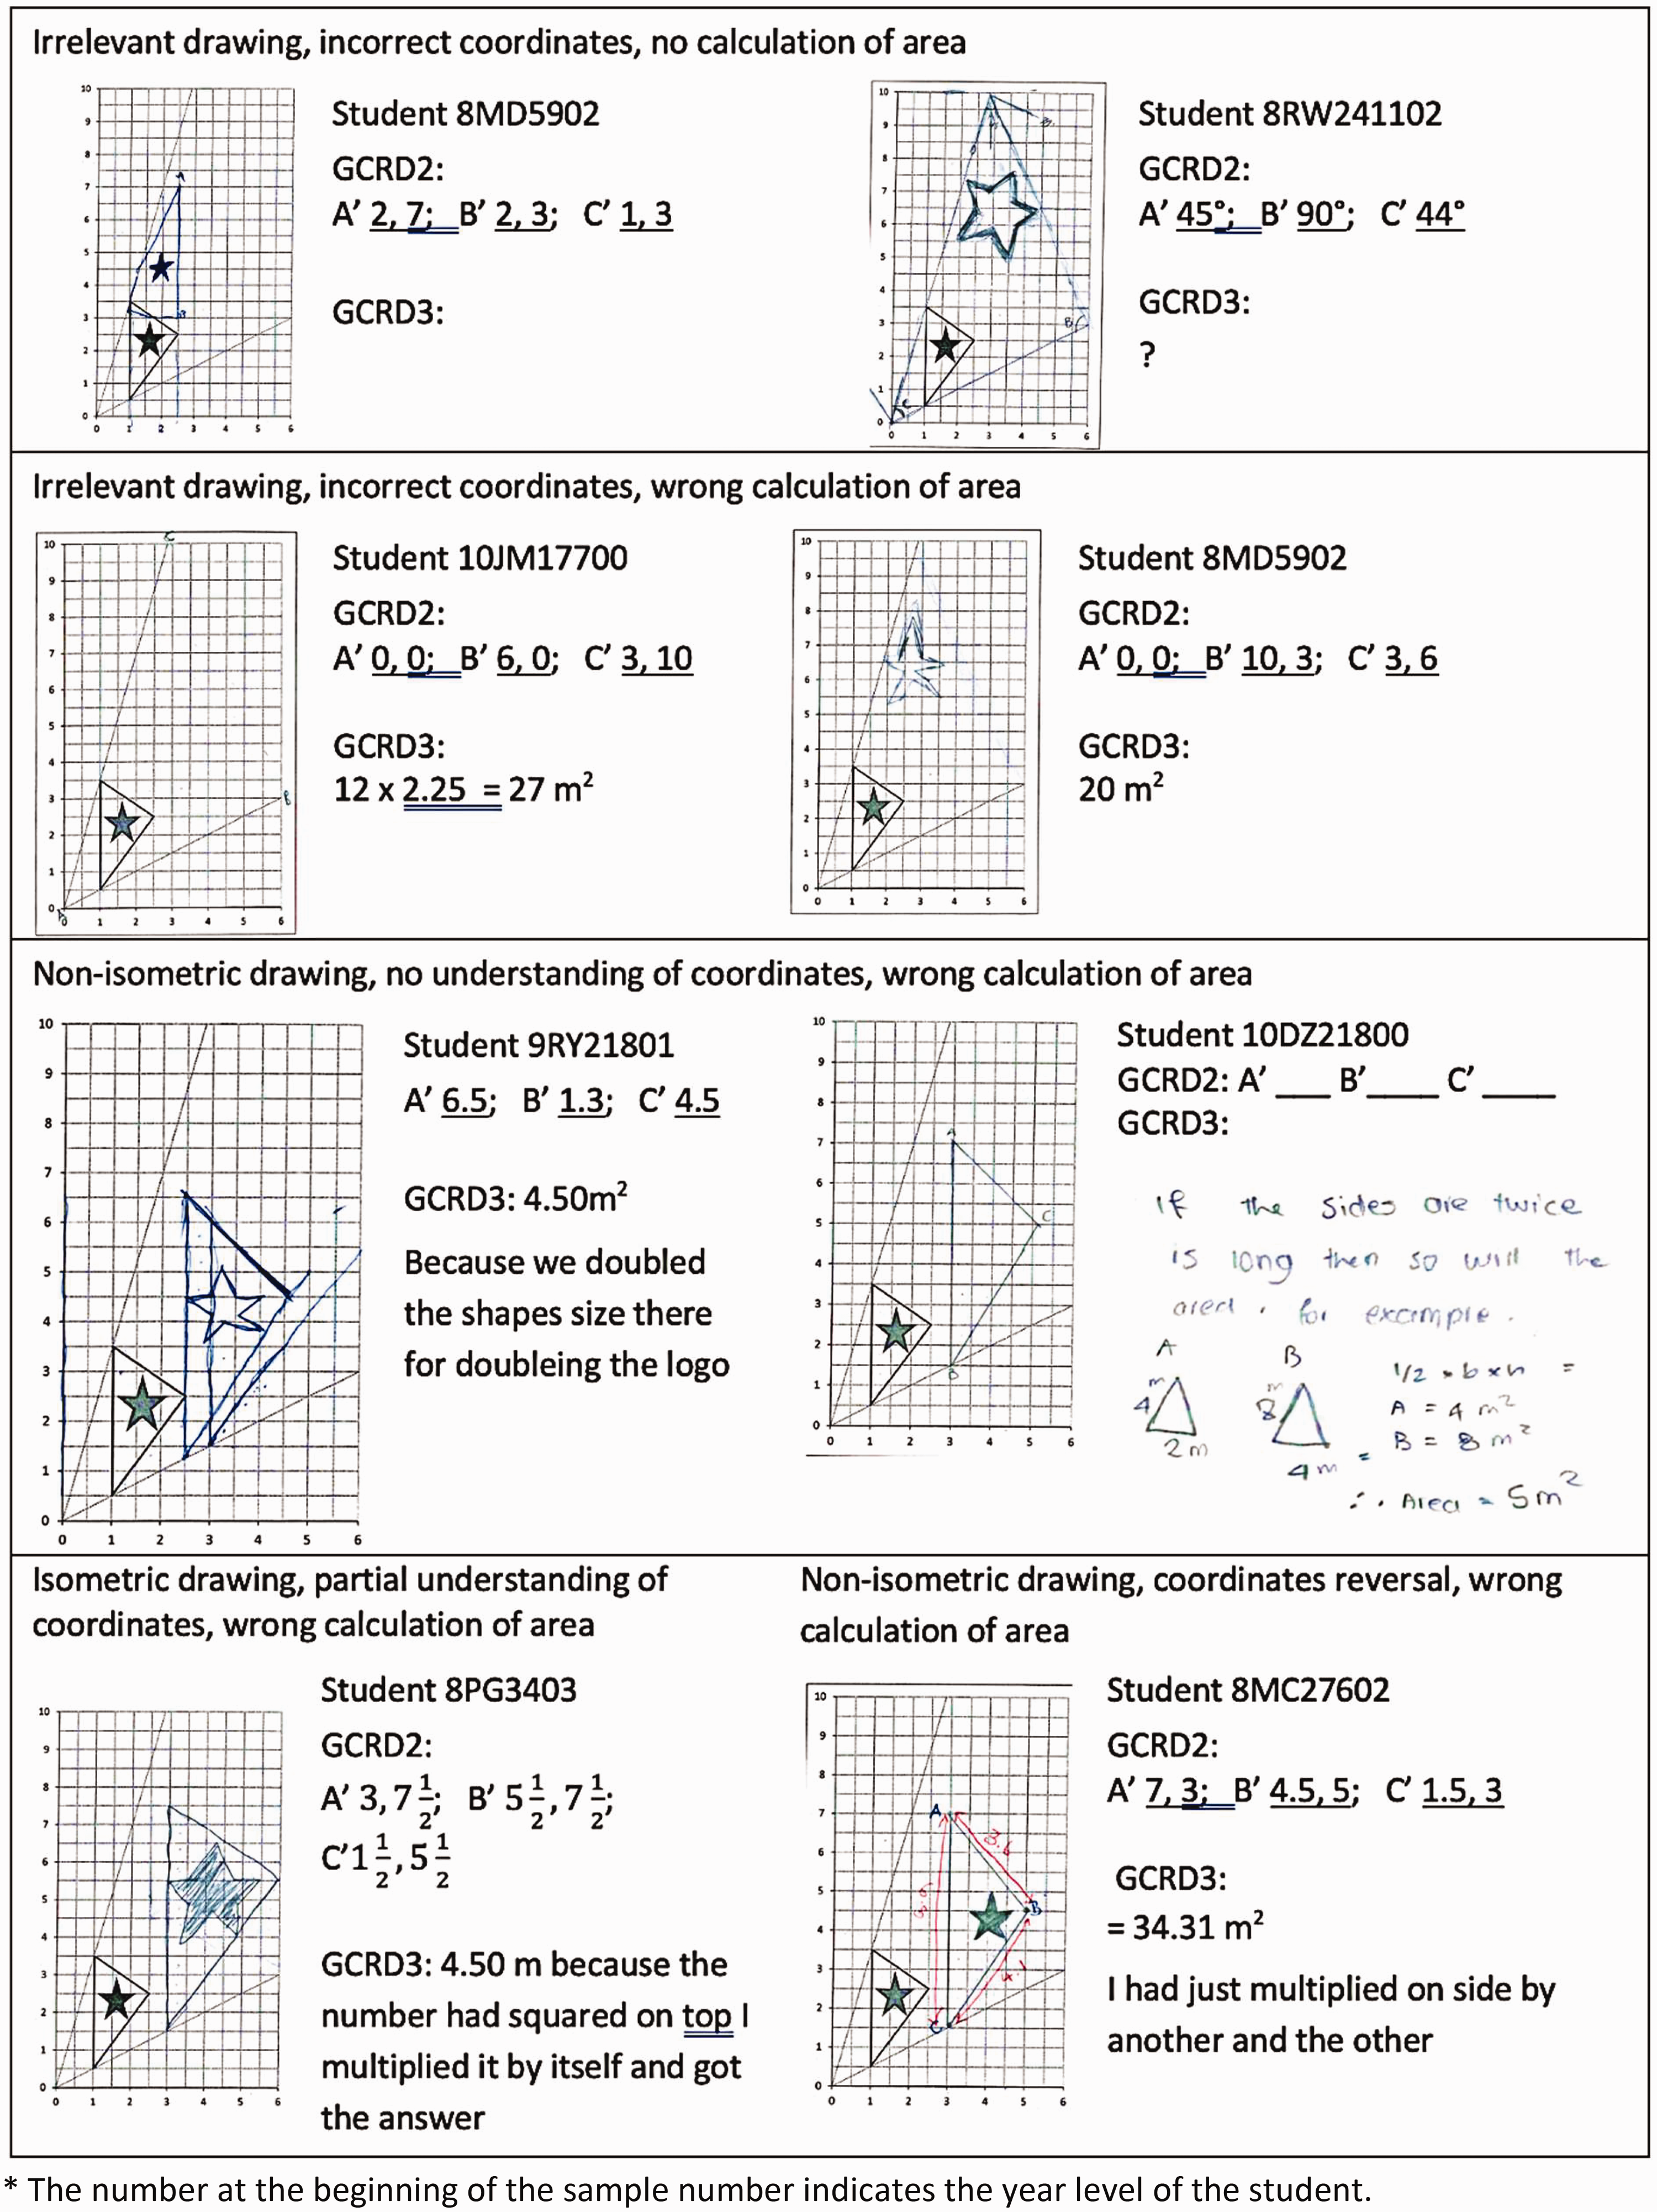
Examples of trial students’ responses to the GCRD task.
Around 41.5% of the trial school students demonstrated no knowledge of coordinates (scoring zero on GCRD2, see Table 1). Among them, 30.6% gave an irrelevant response by writing only one axis (e.g. 9RY21801), the measurement of the side length (e.g. wrote A’ 9.25 m2, B’ 3.25 m2, C’6.25 m2) or stating the angle magnitudes (e.g. Student 8RW241102). Of the 38.1% of students who listed the coordinates on a non-isometric enlarged logo (GCRD2.1), close to half (47%) gave the correct coordinates, while 18% ignored any axis with decimal numbers (e.g. wrote 2 instead of 2.5). Analysis of all the coordinates students produced showed that 15 students or 12.7% reversed the axes (wrote (y,x) instead of (x,y), see Student 8MD5902).
Students used two approaches to successfully answer the area measurement question (GCRD3) successfully. The first was to use knowledge that area measurement means surface covering and proportionate reasoning to count the square grids the triangle occupied. There was evidence of this attempt by many students, as seen in the count marks they left on the logo. However, none of the students completed the process. They either stopped the count halfway and gave up or changed their strategy and seemed to believe that doubling the size of the side would result in doubling of area (e.g. see Student 9RY21801 in Figure 5). Indeed, of the 52% incorrect responses (GCRD3.1), more than 60% gave the answer as 4.5 m2, believing that doubling the side length will result in doubling of the area. The remainder wrote answers (such as 5.06, 8.4, 5.35 cm2) without any explanation (see also Students 8MD5902, and 8MC27602 in Figure 5). Some multiplied 2.25 by 2.25 and produced 5510 or 12.5 m2.
A second approach was to draw on the knowledge of geometric properties, understanding that the area of a triangle is half that of a quadrilateral, and then use proportional reasoning to solve the problem. There was no evidence that students had a conceptual knowledge of these ideas. Several measured the side length and then applied the formula (see Student 10JM15800 in Figure 6). One student multiplied 2.25 three times because ‘there are three lines’ (see Student 10JW27701). Still another assumed that 2.25 is the length of each side and ‘doubled all the sides to get 13.5 m2 for the new logo’.
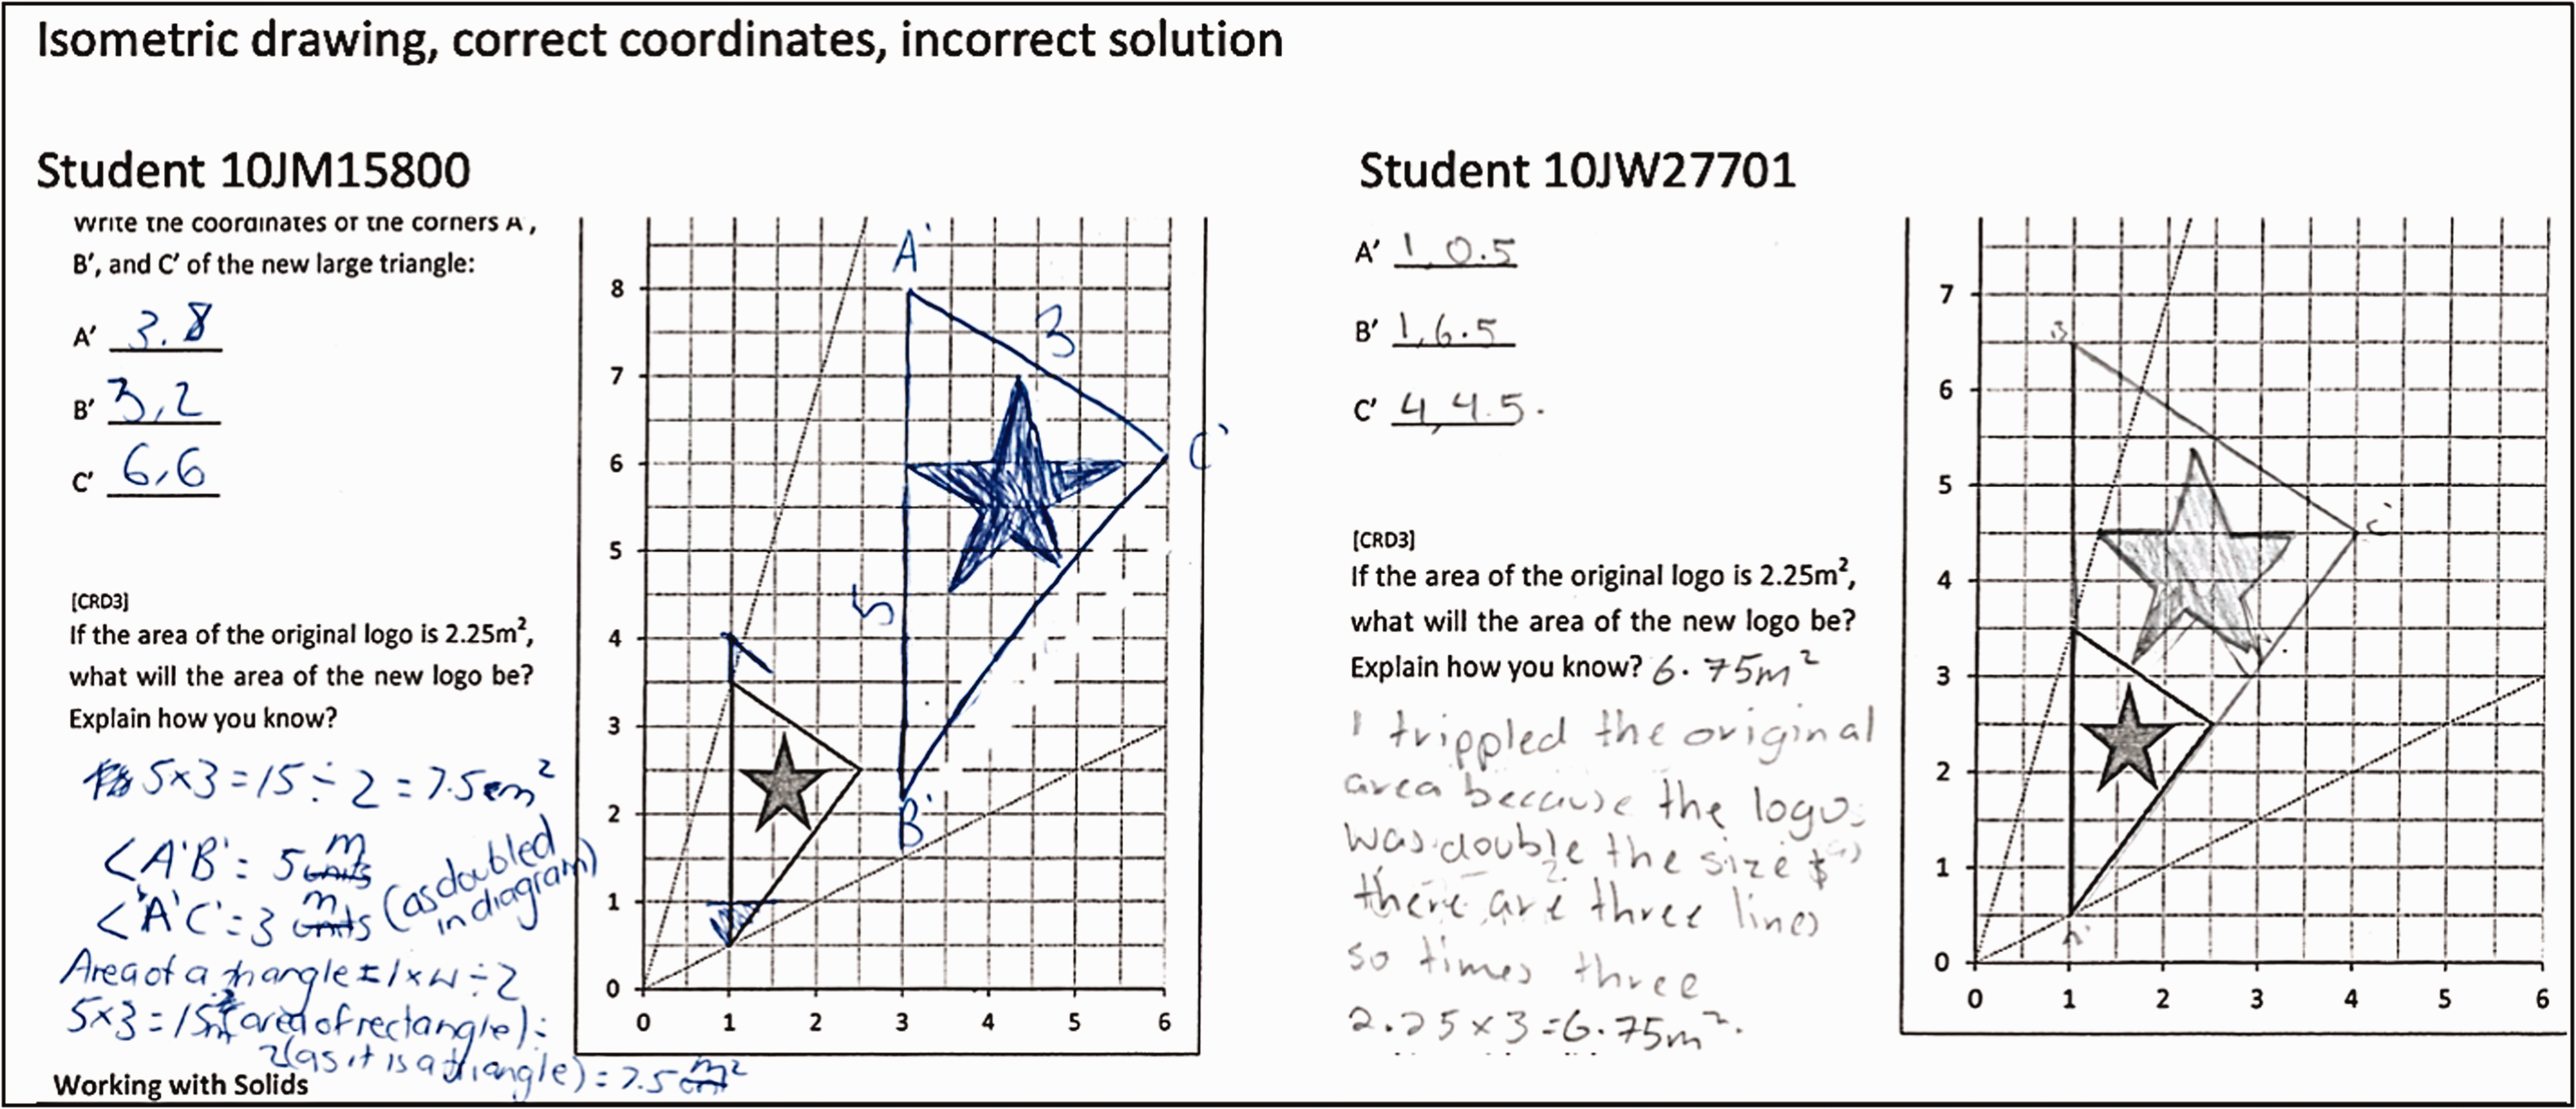
Incorrect calculation of the area of the enlarged logo.
In total, 12 students gave a partial or full explanation of their reasoning. This included giving the correct answer with incorrect reasoning (i.e. ‘double the number’) and explaining that the area will be quadrupled without specifying the result. We classified the way the students presented their reasoning in terms of linguistic, symbolic/algebraic, diagrammatic or combinations of methods. As seen in Figure 7, some of these explanations were more convincing than others. For example, the use of diagrams or an algebraic explanation provided a stronger explanation (see Students 10YL4700 and 9TC13801) than simply stating that the area would quadruple as a fact (8AS12303). The explanation provided by Student 10AV101100 was more problematic as it was unclear how s/he deduced that AC is 1.5 m2.
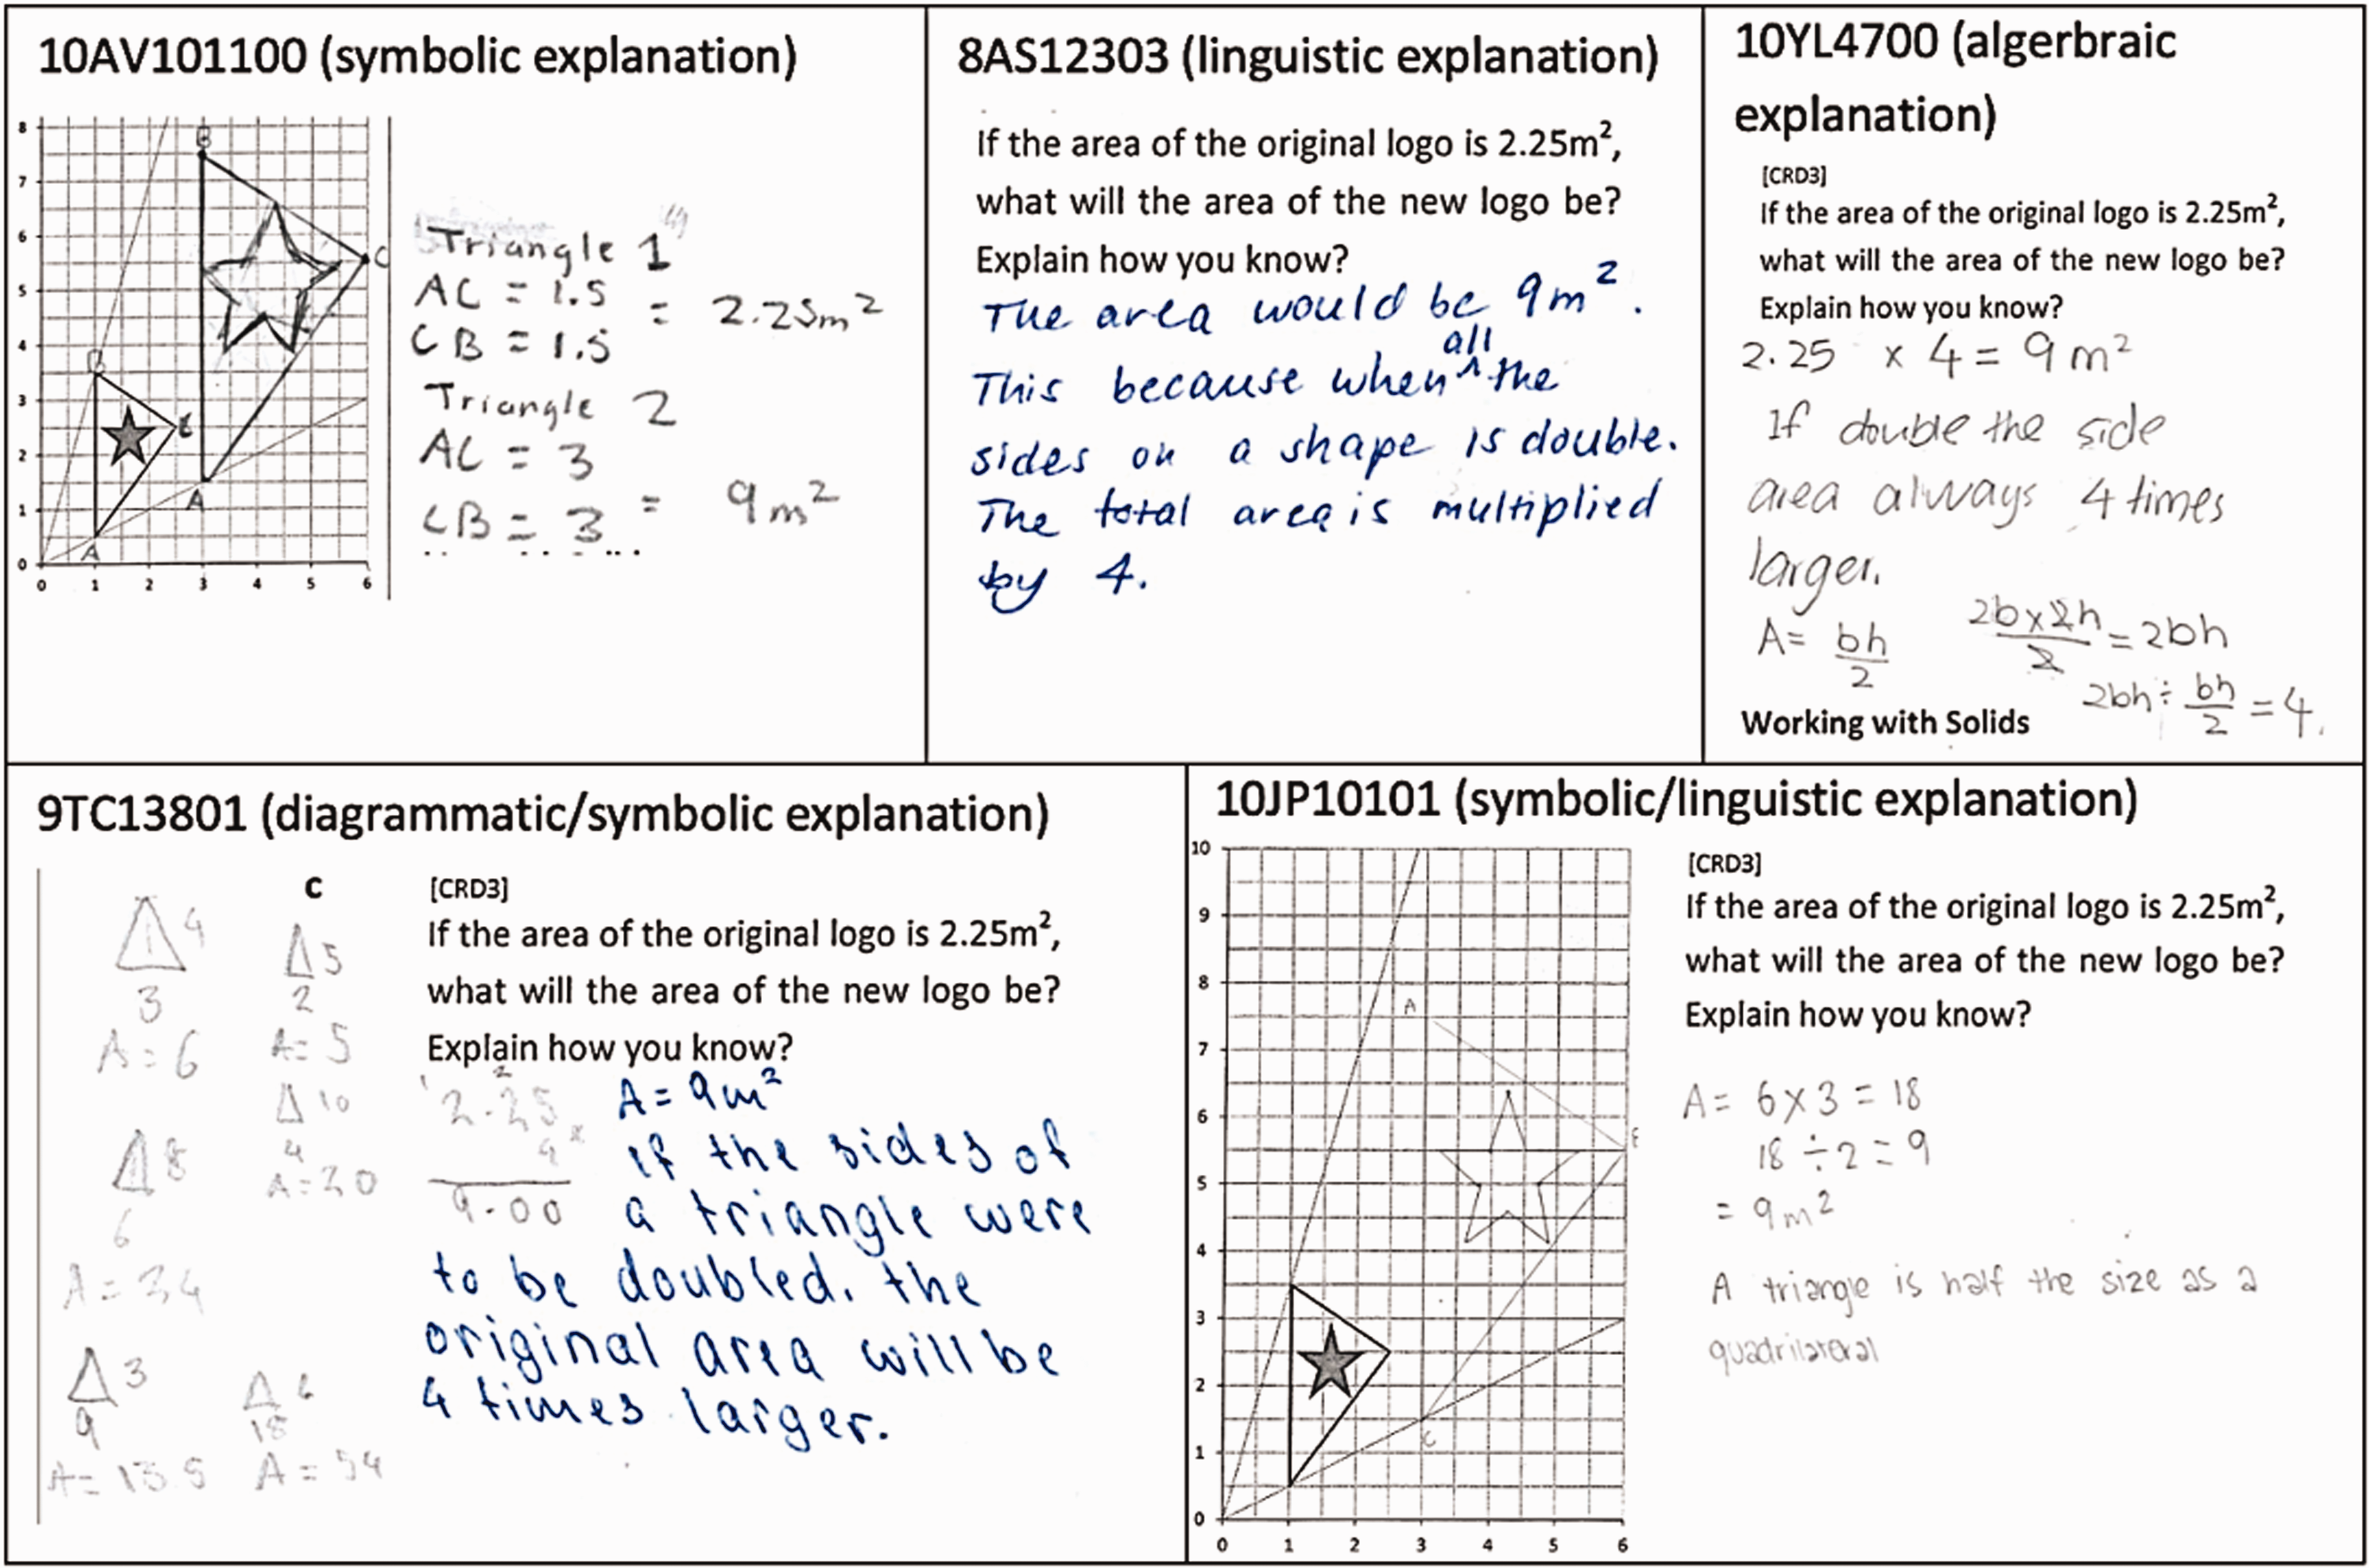
Strategies used by the students to explain their solution for GCRD3.
To investigate how students used the knowledge of transformation and geometric properties when solving measurement situations, we compared the results of those who successfully addressed each item with those who did not. The data showed that 29 students who were unable to produce an isometric logo (46% of those who scored ‘1’ in GCRD2) nevertheless provided the correct coordinates. Of the 37.3% of the trial school students who did not answer item GCRD3 correctly, more than 60% did not produce an enlarged logo, and six students gave the correct coordinates for the shape they drew. Conversely, eight students who produced an isometric drawing of the logo could not calculate the enlarged area. Of the 10 students who solved the problem and explained their reasoning, 3 could not enlarge the logo and one produced a non-isometric drawing. The coordinates these students provided also did not match their logo. Of the data set of 118 student scripts, only 6 students (1 in Year 8, 1 in Year 9 and 4 in Year 10) answered all three items correctly.
On reflection, the oblique radial lines in the question may have caused some confusion, as was evident in the scripts of a few students, such as those of Students 8MD5902 and 8RW241102 in the top section of Figure 5.
Discussion
Our research goal was to develop a geometric learning progression and use it to design activities and targeted teaching advice. These questions were not used to directly test a model, although there was a hypothetical learning progression used as a basis of assessment question design. Rather the questions in the tasks, such as the one discussed here (GCRD), were used to collect data to find evidence of a learning progression. At the macro level, Rasch analysis produced eight thinking zones based on the data from all the geometry questions used and trialling of the assessment forms in the trial and main project school data collections. Subsequent data collection showed that the scales produced were quite stable (Siemon & Callingham, 2019). For the GCRD task, reasoning moved from descriptive through analytic to relational-inferential property-based reasoning. The thinking zones are based on evidence of what students could demonstrate in response to a set of task-based questions rather than on a predetermined model. Of course, there are aspects of items used which may be improved, such as the removal of the oblique lines in the task discussed here, and we recognise that further questions in this domain of knowledge may add more insights into student thinking. While formal proof may be regarded as the pinnacle of reasoning, our learning progression falls short of proof as there was little evidence that students could use analytical formal reasoning.
Reasoning is underpinned by secure knowledge of mathematical concepts and is hampered if the base concepts are not understood. For example, reasoning about area measurement requires an understanding of the concepts of length and area, units of measurement and application of them in the right the context. If we are to understand how students reason in any situation, communication is critical. If a student just gives a numerical answer with no further explanation, we can conjecture about their thinking, but it will only be conjecture. Language, which includes words, syntactical structures, signs and symbols, is a vehicle through which we can gain insights into students thinking and reasoning. It is a limitation of this study that only students’ written explanations were available and were not supported by real time verbal explanations about what they had done.
Detailed analysis of student scripts for GCRD showed development of concept understanding, differences in diagrammatic representation and development in the use of integrated language explanation and argument using diagrams, symbols and calculation, and integrated syntactical language structures. In relation to conceptual understanding, students who were reasoning at the lower end of the progression did not attempt to or were unable to correctly identify coordinates. Students who were further along demonstrated coordinate reversal. Students who were functioning at the upper end of the progression were able to correctly identify coordinates. At the lower end of the progression, students did not attempt to find area. When they did attempt to calculate area, they either attempted a counting squares strategy, usually incompletely, or attempted a calculation by multiplying two numbers, though not ones that would enable area to be found. Some students then thought that doubling the length of the sides would also double the area but did not attempt to justify this. Students operating at the highest levels were either able to calculate the area correctly or recognised that enlargement of the lengths by two would in fact quadruple the area.
When it came to diagrammatic representation, which was critical for this task, students at the lower end were unable to draw an enlarged logo at all, some then enlarged it successfully in one dimension, some showed an enlargement which did not maintain proportionality, and at the upper end of the progression, enlargements were drawn which maintained proportionality. With regards to the calculation of area, those at the lower end tended to give no answer or write an answer with no explanation. Calculations in the next thinking zone included addition of the sides (which were estimated) or multiplication of any or all numbers related to the sides. At the upper end of the progression, students were able to calculate the area, whether through counting squares or using other area calculations, such as a triangle will be half the rectangle or cutting the triangle into two and calculating the area of each. Some stated, correctly but without supporting argument, that the area would be four times as large because the sides were twice as long. The language made use of the ‘if . . . then’ structure and the use of ‘because’, but there were no other logic structures evident. Other items used in the larger study showed similar characteristics in the nature of student responses (Seah & Horne, 2020a, 2020b).
The implications of this for curriculum are fourfold. First, concept development needs to be clear and linked to problems in contexts where students have opportunity to discuss their understanding. Second, visualisation and visual representations need to be included to support students learning to reason geometrically. Third, attention needs to be given to assist students to move between different representations of a problem situation so that they can use diagrams, calculations and language and see the connections between them. Finally, the language of explanation, argument and justification needs to be taught specifically and used regularly in classrooms to help students learn to explain their reasoning and justify their solutions. In revising the AC: M, this evidence of students’ reasoning and conceptual understanding needs to be considered in the development shown within the curriculum and specific mention should be made of visualisation, representations, and language.
In conclusion with reference to the geometric learning progression which resulted from of the Rasch analysis in the larger study, the task reported here with the student responses illustrates aspects of the thinking zones in the geometric reasoning learning progression which has been presented more fully in Seah and Horne (2019). The learning progression assists teachers in that through the related assessment it enables them to better understand their students’ current knowledge and understanding and to thus better target their teaching. The teachers learned more about their students through looking at their reasoning as they used the rubrics in the assessment. Alongside the assessment forms, the project developed teaching advice targeted at each of the thinking zones that arose from the analysis. The resources from the project are freely available to all through the Australian Association of Mathematics Teachers’ website (RMFII: http://www.mathseducation.org.au/online-resources/geometrical-reasoning/).
Footnotes
Declaration of Conflicting Interests
The author(s) declared no potential conflicts of interest with respect to the research, authorship, and/or publication of this article.
Funding
The author(s) disclosed receipt of the following financial support for the research, authorship, and/or publication of this article: This research was funded by the Australian Government Department of Education and Training under the auspices of the Australian Mathematics and Science Partnership Programme (AMSPP), in partnerships with industry partners and practitioners in each State and Territory and the Australian Association of Mathematics Teachers (AAMT).