
Abstract
Recently, students’ interest in science has been conceptualized as a network model: the science interest network model (SINM) in which affective, behavioural and cognitive components interact together; building on science interest being a dynamic relational construct. In the current study, we combine the Australian Programme for International Student Assessment (PISA) 2006 and Longitudinal Surveys of Australian Youth 2008 data (N = 4758) to investigate relationships between the network characteristics of Year 10 students with their decision to enrol in a science course in Year 12. Specifically, we identified indicators central to the SINM and tested whether they predicted chemistry, physics and biology course enrolment. Students’ intentions to pursue a science-related study or career (future intentions in science) and their enjoyment of science (science enjoyment) were the most central indicators for all three science courses. Centrality was strongly related to course enrolment (r = .36–.74), lending support to the validity of network theory in the context of science interest, as central indicators may play an influential role within the network.
Science interest is seen as an important educational outcome. It is considered to be a driving force of engagement with the sciences, be it keeping up to date with new developments in science, or deciding to take up a science course or pursuing a science career (e.g. Ainley & Ainley, 2011, 2015; Nugent et al., 2015). Recently, the science interest network model was introduced (SINM; Sachisthal et al., 2019), building on commonly agreed upon characteristics of theories of (science) interest which focus on the development of interest (see Renninger & Hidi, 2011). The SINM conceptualizes science interest as a dynamic relational construct (Ainley, 2017). Interest is dynamic, in that individual interest (a more stable trait-like form of interest) may emerge from short-lived situational interest (an externally triggered state-like form of interest) through the interaction of an individual with their environment (Hidi & Renninger, 2006; Krapp, 2002). Individual and situational interest may interact and re-organize throughout the development of interest. Interest is relational in that it only exists in relation to something – a teenager is interested in science, for instance (Hidi & Renninger, 2006; Krapp, 2007; Renninger & Hidi, 2011). In the SINM, the mutual interactions of affective, behavioural and cognitive components of science interest are central, meaning that the dynamic aspects of interest (development) lie at the core of the model.
The potential for increasing or improving students’ interest in science through targeted interventions (e.g. Gunter, 2013; Hulleman & Harackiewicz, 2009), and thereby positively effecting the take-up of science courses and careers, has been highlighted as an important area of research. Conceptualizing science interest as a network of interconnected interest components allows for the identification of indicators that may be more central (i.e. influential), and therefore a potential target for successful interventions. If such central indicators are indeed influential, we expect that they are related with relevant outcome measures, such as the enrolment of secondary science courses by students – an important predictor of tertiary study enrolment in science courses (Ainley et al., 2008; Maltese & Tai, 2011). The aim of the current study is therefore to test whether centrality of indicators of the SINMs is related to students’ later enrolment in science courses (chemistry, physics, biology).
Science interest as network
The basic premise of the SINM is that mutually interacting indicators (i.e. items) of interest components and closely related motivational constructs constitute science interest. Interest components are constructs that are commonly included in definitions of interest in research literature on interest development, such as affect, behaviour, knowledge, value (Hidi & Renninger, 2006), whereas related motivational constructs are constructs that have been shown to have reciprocal relationships with interest, such as self-efficacy (Fryer & Ainley, 2019) or self-concept (Marsh et al., 2005). Figure 1 (left panel) displays a representation of a SINM; the nodes (indicators’ such as Science Enjoyment (Efu) and Engaging with Science (Bsc)) are connected by edges (i.e. partial correlations). Edges differ in their width and style, representing the strength and direction (positive/negative) of relationships between indicators. For example, the nodes Science Enjoyment (Efu) and Future Intentions in Science (Fmd) are closely and positively related, as indicated by the thicker, solid edge between them, whereas the nodes Engaging with Science (Bsc) and Knowledge in Science (Kis) have a weak negative relationship – the edge between them is thinner and dashed. In addition to building on commonly agreed upon characteristics of (science) interest (see Renninger & Hidi, 2011), namely content-specificity, emergence and multidimensionality, the SINM builds on the causal attitude network model (Dalege et al., 2016), which conceptualizes attitudes as causally interacting evaluative reactions. A distinction between the SINM and other modelling techniques that can be used to explore relationships between interest constructs is how the indicators (or the items presented to students) are considered. In latent variable approaches, such as structural equation modelling (SEM), the indicators are viewed as potential measures of the underlying constructs, while in SINM the indicators are treated as a part of the construct. The focus of the analysis then moves away from modelling predictive paths between constructs (e.g. enjoyment predicts behavioural engagement) in latent variable analyses, to the analysis of the characteristics of networks in the SINM. One characteristic that may be considered is node centrality: With the nodes assumed to be interacting, when one (central) node changes, so should any other, closely connected nodes. Nodes with more and stronger (in)direct connections should therefore have a stronger influence on the network, and may hence be efficient targets for intervention (e.g. Borsboom & Cramer, 2013; McNally, 2016).
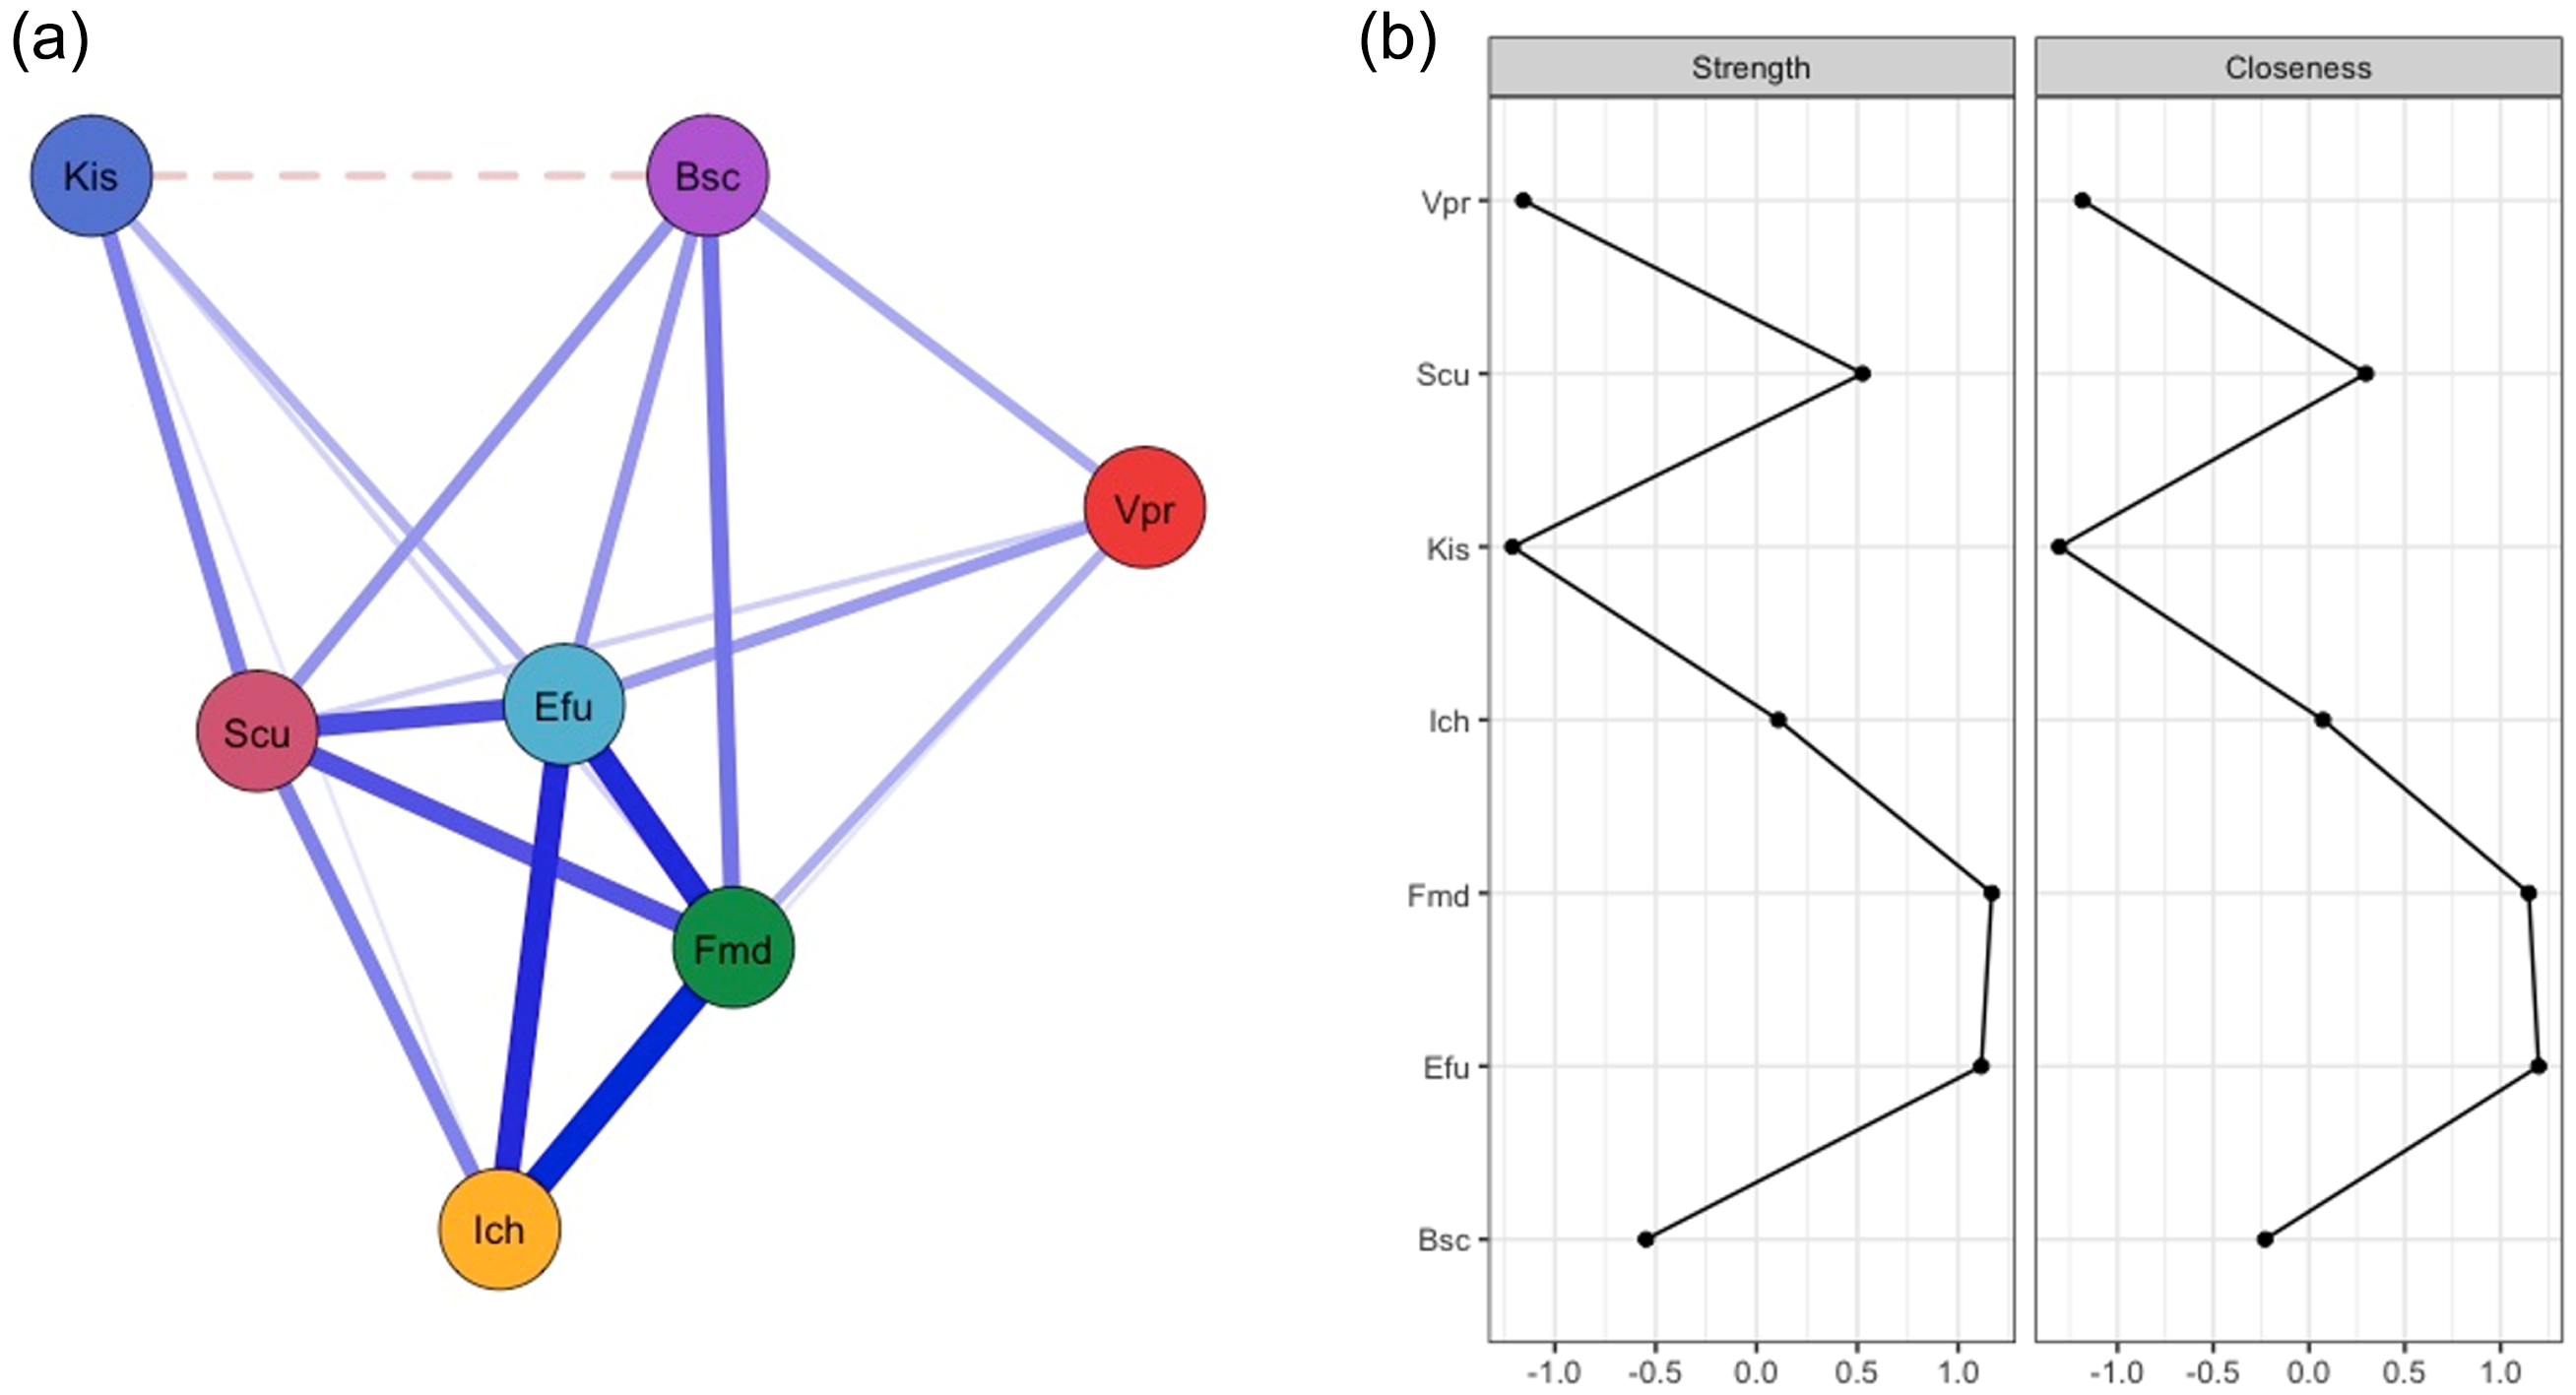
Left: Estimated science interest network based on a subset of indicators. Nodes represent indicators and edges connecting them represent the mutual interactions between them. Edges differ in their width and style (solid, dashed), representing the strength and direction (positive, negative) of the relation. The nodes represent the following indicators: Bsc = Engaging with Science; Ich= Interest in Chemistry, Efu = Science Enjoyment; Kis = Knowledge in Science; Fmd = Future Intentions in Science; Vpr = Science Value; Scu = Science Self-Concept. Right: Centrality plot of the example SINM; for purposes of simplicity, only the (standardized) strength centrality (i.e. direct influences) and closeness (i.e. direct and indirect influences) are displayed. The node names are displayed on the y-axis in alphabetical order.
Different measures of node centrality in psychometric network analysis exist (Freeman, 1978; Opsahl et al., 2010); most commonly used are strength centrality (i.e. strength of direct relations of node with other nodes), betweenness centrality (i.e. number of times a node is passed on the shortest path between any pair of nodes) and closeness centrality (i.e. indirect and direct connections of node with other nodes). Going back to Figure 1 (right panel), the nodes representing Future Intentions in Science (Fmd) and Enjoyment of Science (Efu) have the strongest direct (and indirect) connections, as indicated by the strength (closeness) centrality. Interventions that target these constructs would therefore be expected to have a positive effect on the rest of the network, whereas intervening on the nodes with lowest strength centrality – Science Value (Vpr) and Science Knowledge (Kis) – would have a smaller effect.
Node centrality has been shown to be related with relevant outcome variables: In attitude networks, central nodes predicted voting behaviour (Dalege et al., 2017), and in clinical networks, central nodes predicted post-treatment outcomes in anorexia nervosa (Elliott et al., 2020). In a previous study on the SINM using PISA 2015 data from the Netherlands and Colombia, enjoyment nodes were strongest in the SINM for Dutch students and behaviour nodes were strongest in the SINM for Columbian students indicating that the efficacy of intervention targets may vary across cultural environments (Sachisthal et al., 2019).
Overview of studies using PISA and Longitudinal Surveys of Australian Youth (LSAY) data to predict course enrolment
Previous studies have predicted science course enrolment using the same data set as used in the current study, using a latent variable approach. Jeffries et al. (2019) used SEM to investigate the predictive effect of students’ background variables (e.g. gender and socioeconomic status (SES)) on their Science, Technology, Engineering and Mathematics (STEM) subject choice, and the mediating role of attitudinal variables (personal value, enjoyment, self-concept) as well as their achievement in science and mathematics. They found that the attitudinal variables and achievement acted as mediators between background variables and STEM subject choice. Ainley and Ainley (2015) used three SEM models to predict the enrolment in a biology, chemistry or physics course in the final year of secondary school and found that prediction strength as well as structure of relations differed for the science courses, showing the importance of domain-specificity. The science knowledge of 15-year-olds was an important direct predictor for chemistry and physics enrolment, but not for biology, whereas gender played an important direct role in enrolment in biology and physics, but not in chemistry.
Current study
In the current study, we aim to test whether node centrality within the SINMs is related to students’ later enrolment in senior secondary science courses. When representing science interest as a network, relevant science interest components and closely related motivational components should be included in the SINM. The following relevant components 1 present in the PISA 2006 data set are included in the SINM (OECD, 2006): Science Enjoyment, Science Interest, Personal Value, Future Intentions and Science Knowledge (as in Ainley & Ainley, 2015) plus Science Self-concept, which was shown to be reciprocally related with interest and achievement (Marsh et al., 2005) and Science-related Activities, an important indicator of interest. Moreover, given the importance of domain-specificity of science interest (e.g. Ainley & Ainley, 2015; Krapp & Prenzel, 2011), we will estimate one SINM per science course (chemistry, physics and biology) and only include the science interest item(s) that are related to the course in question, for example Interest in Chemistry in the SINM focused on enrolment in chemistry courses.
Considering the cross-sectional nature of the data set and the fact that the psychometric network approach to science interest is still in its early stages (Sachisthal et al., 2019), the current study should be seen as an exploratory study. We do expect to find a positive correlation between centrality of nodes and their strength of relation with the outcome measure (course enrolment). Based on earlier studies we hypothesize that (1) generally, enjoyment nodes will be central to the SINMs (Sachisthal et al., 2019) but that (2) centrality of other nodes may differ between the specific course networks (Ainley & Ainley, 2015).
Method
Participants
We analysed data from the Australian PISA 2006 data (OECD, 2009) and the LSAY 2008 data from the 2006 cohort (NCVER, 2017; OECD, 2009). A sample of 14,170 teenagers (6978 girls, 7192 boys; Mage = 15.78, SDage = .29) participated in the PISA 2006 assessment, of which 5423 teenagers (2894 girls, 2529 boys; Mage = 15.72, SDage = .28) also participated in the LSAY 2008 data collection and were still in school at that time. To make sure that students indeed had the choice to elect a science course, students who followed the international baccalaureate program in their last year of secondary school were excluded (N = 54). Moreover, students who were not in Year 10 in 2006 and Year 12 in 2008 were excluded (N = 611), to ensure participants followed the same schooling trajectory. This resulted in a final sample size of 4758 (2596 girls, 2162 boys; Mage = 15.45, SDage = .27).
PISA and LSAY measures
The main focus of PISA 2006 was scientific literacy, which was defined as ‘the ability to use scientific knowledge and processes not only to understand the natural world but to participate in decisions that affect it’ (OECD, 2006, p. 12). The Australian participants of the PISA 2006 cycle were later tracked through the LSAY research program, which contacts the participants once a year for up to 12 years to collect data about education, work and social development (NCVER, 2017). Table 1 shows an overview of the self-report scales, which are all measured on a 1 (= strongly disagree) to 4 (= strongly agree) Likert-scale, and Table 2 lists the indicators included in the network analyses. While the reliability of PISA measures is reported for the full sample (OECD, 2009), please note that the assumption of local independence (i.e. indicators measuring the same latent variable are not directly causally linked) and exchangeability of indicators (i.e. additional indicators may increase reliability but will not add substantial information) that are usually required for latent variable models are not necessary in psychometric network models. This is because in the SINM, (1) indicators are thought to be mutually linked with one another and (2) indicators may differ in their importance within the network.
Overview of the components used in the study which were assessed using self-report measures.
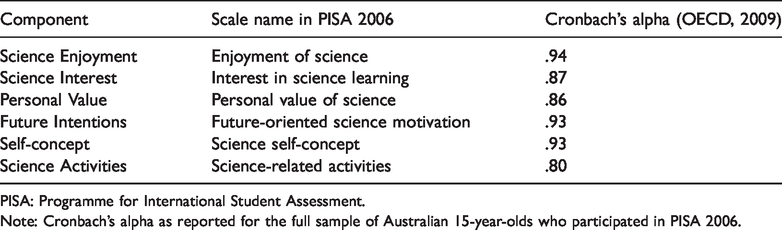
PISA: Programme for International Student Assessment.
Note: Cronbach’s alpha as reported for the full sample of Australian 15-year-olds who participated in PISA 2006.
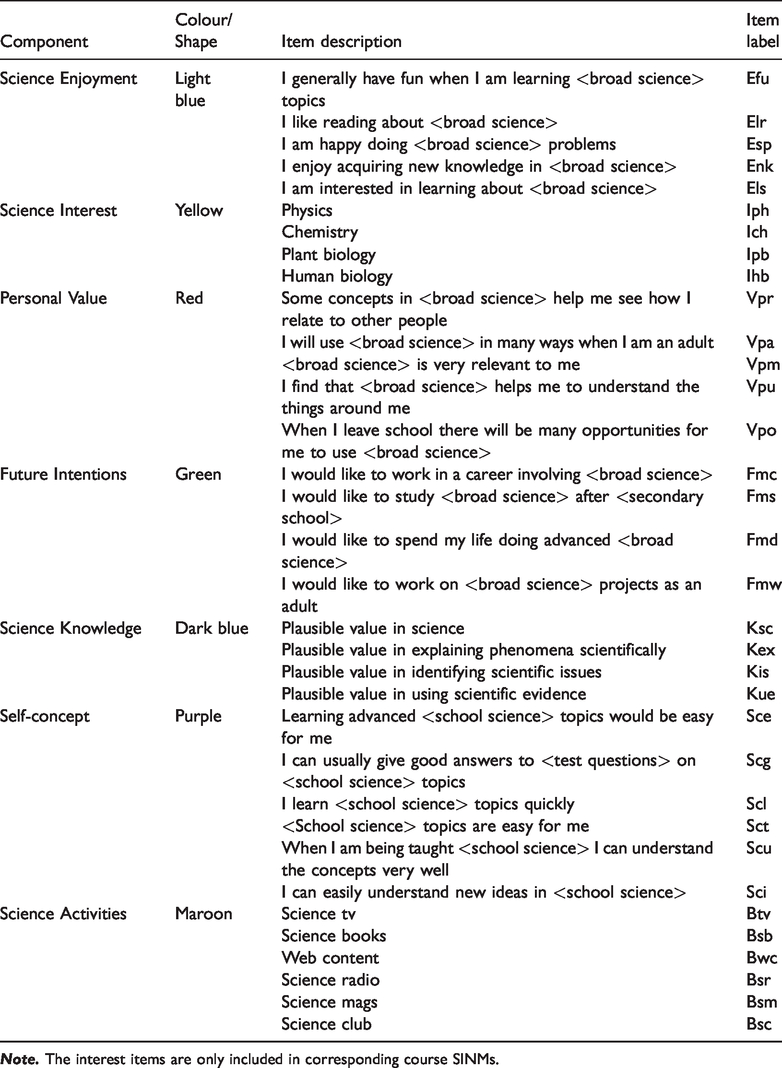
List of indicators used in the network, the component they are intended to measure, the colour (or shape) corresponding to the component (as intended by PISA 2006) and their description.
Science knowledge
Students answered different subsets of the science knowledge items, which measured knowledge about science (i.e. content knowledge; OECD, 2006), and three abilities (identify, explain, use evidence). Based on the subsets, five probable proficiencies per student were imputed, referred to as plausible values (PVs). PV1 was used for each science knowledge indicator (content, identify, explain, use evidence) in all analyses, as has been done in similar studies (Ainley & Ainley, 2015; Sachisthal et al., 2019).
Science course in Year 12
The LSAY 2008 data (wave 3) included a variable indicating whether students followed a science course (0 = no; 1 = yes) and if so, which course they followed (NCVER, 2017). Information from these items was combined to create a dichotomous variable for each of the three science courses in question – biology, chemistry and physics. It should be noted that generally, Australian students choose to enrol in a course at the beginning of their senior secondary school (Year 11). Their Year 12 enrolment thus not only reflects subject selection but also retention in senior secondary school science courses.
Data preparation
Before estimating the networks, we tested whether the missing data were missing completely at random (MCAR), and whether the assumptions of multivariate normality and homoscedasticity were met (Jamshidian et al., 2014; see Supplementary Materials for further information). The Hawkins test of normality and homoscedasticity was significant (p < .001), indicating that at least one assumption was not met in the data set. The non-parametric test was not significant (p = .234), meaning that MCAR can be assumed given that the data are not normally distributed; we therefore decided to use casewise deletion of missing data.
Network estimation
The different SINMs were estimated using the R-package bootnet (Epskamp & Fried, 2017). The indicators in Table 2 were included in the estimation and are represented as nodes. The partial correlations per pair of nodes, controlling for relations with all other included nodes, are represented as edges connecting the nodes. Solid (dashed) edges represent positive (negative) partial correlations; darker and thicker edges represent stronger partial correlations (Epskamp et al., 2012).
Data were dichotomized because (1) of the use of different measurement scales in the PISA 2006 data set (OECD, 2006), (2) of the finding of non-normality of data and (3) centrality stability (CS) was highest in networks using dichotomized data. Self-reported interest components were dichotomized based on the mid-point of the scale, behaviour indicators were dichotomized indicating no behaviour (1 = 0) or some behaviour (2–4 = 1) and the knowledge indicators were dichotomized along their median score. Due to the use of binary data, we estimated the networks using the IsingFit default within the estimateNetwork function (Epskamp & Fried, 2017). The eLasso-procedure was used to estimate the edges (Van Borkulo & Epskamp, 2015), meaning that (1) all indicators are regressed on each other; and (2) each regression is subjected to regularization, as to control for multicollinearity, which presents a problem in data sets with many indicators (Friedman et al., 2008; Tibshirani, 1996) and to create sparser, more interpretable models. The extended Bayesian information criterion is used to select the regression function with the best fit (as in Foygel & Drton, 2010). The SINMs were visualized using the Fruchterman–Reingold algorithm (Fruchterman & Reingold, 1991), in which highly correlated nodes are placed close together and nodes with many strong correlations are placed in the centre of the network, whereas nodes with fewer, weaker correlations are placed towards the periphery.
Forecast analysis
Before testing whether node centrality was predictive of later course enrolment, we first determined the stability of three centrality measures (closeness, betweenness and strength; Epskamp & Fried, 2017). Centrality indices are deemed sufficiently stable if the CS coefficient is at least 0.25 and preferably above 0.5 (Epskamp, Borsboom, et al., 2018).
To determine whether node centrality is predictive of course enrolment we conducted the following steps for each science course SINM and centrality measure: (1) We calculated the correlation of each node with the outcome measure across the sample. (2) This forecast correlation was regressed on each centrality index separately. (3) Covariates: Other node characteristics such as node variance and mean may be related with the forecast correlation (e.g. Elliott et al., 2020; Rodebaugh et al., 2018). We controlled for their effect by including them as covariates in the linear regression in step 2 in addition to the centrality index. A stepwise algorithm evaluating model fit (Venables & Ripley, 2002) based on the Akaike information criterion was then used to investigate model fit. Only the final (best fitting) model is reported (see Table S2 in the Supplementary Materials for both models). We report standardized regression weight (β) as a measure of effect size.
Additional analyses
We ran additional analyses to establish the stability and accuracy of the SINMs and the centrality indices. Bootstrap difference tests were run to test which nodes differed significantly on their strength and closeness (Epskamp, Borsboom et al., 2018). We also performed a topological analysis to test whether any two nodes were essentially measuring the same underlying construct (Jones, 2019) and ran forecast analyses based on networks which were estimated using different methods. These additional analyses, the covariance matrices of the networks as well as the descriptive statistics of all included variables are included in the supplementary materials.
Results
Network estimation
The estimated course SINM networks and the corresponding centrality plots are displayed on the left and right panel of Figure 2, respectively. The edges connecting nodes are positive (solid) across all three networks, indicating a positive relationship between indicators for each course SINM. This is in line with developmental interest theories, in which positive mutually reinforcing relations are thought to underlie the development of interest (e.g. Renninger & Hidi, 2011). Moreover, indicators of the different included components seem to form clusters, which are more (e.g. enjoyment cluster) or less (e.g. knowledge cluster) connected with the other clusters. These findings suggest that enjoyment is playing a larger role in the interest network, while knowledge plays a smaller part. The one to two indicator(s) included for the domain-specific interest measure seem to be most closely related with indicators in the enjoyment and the future intentions cluster across all three SINMs.
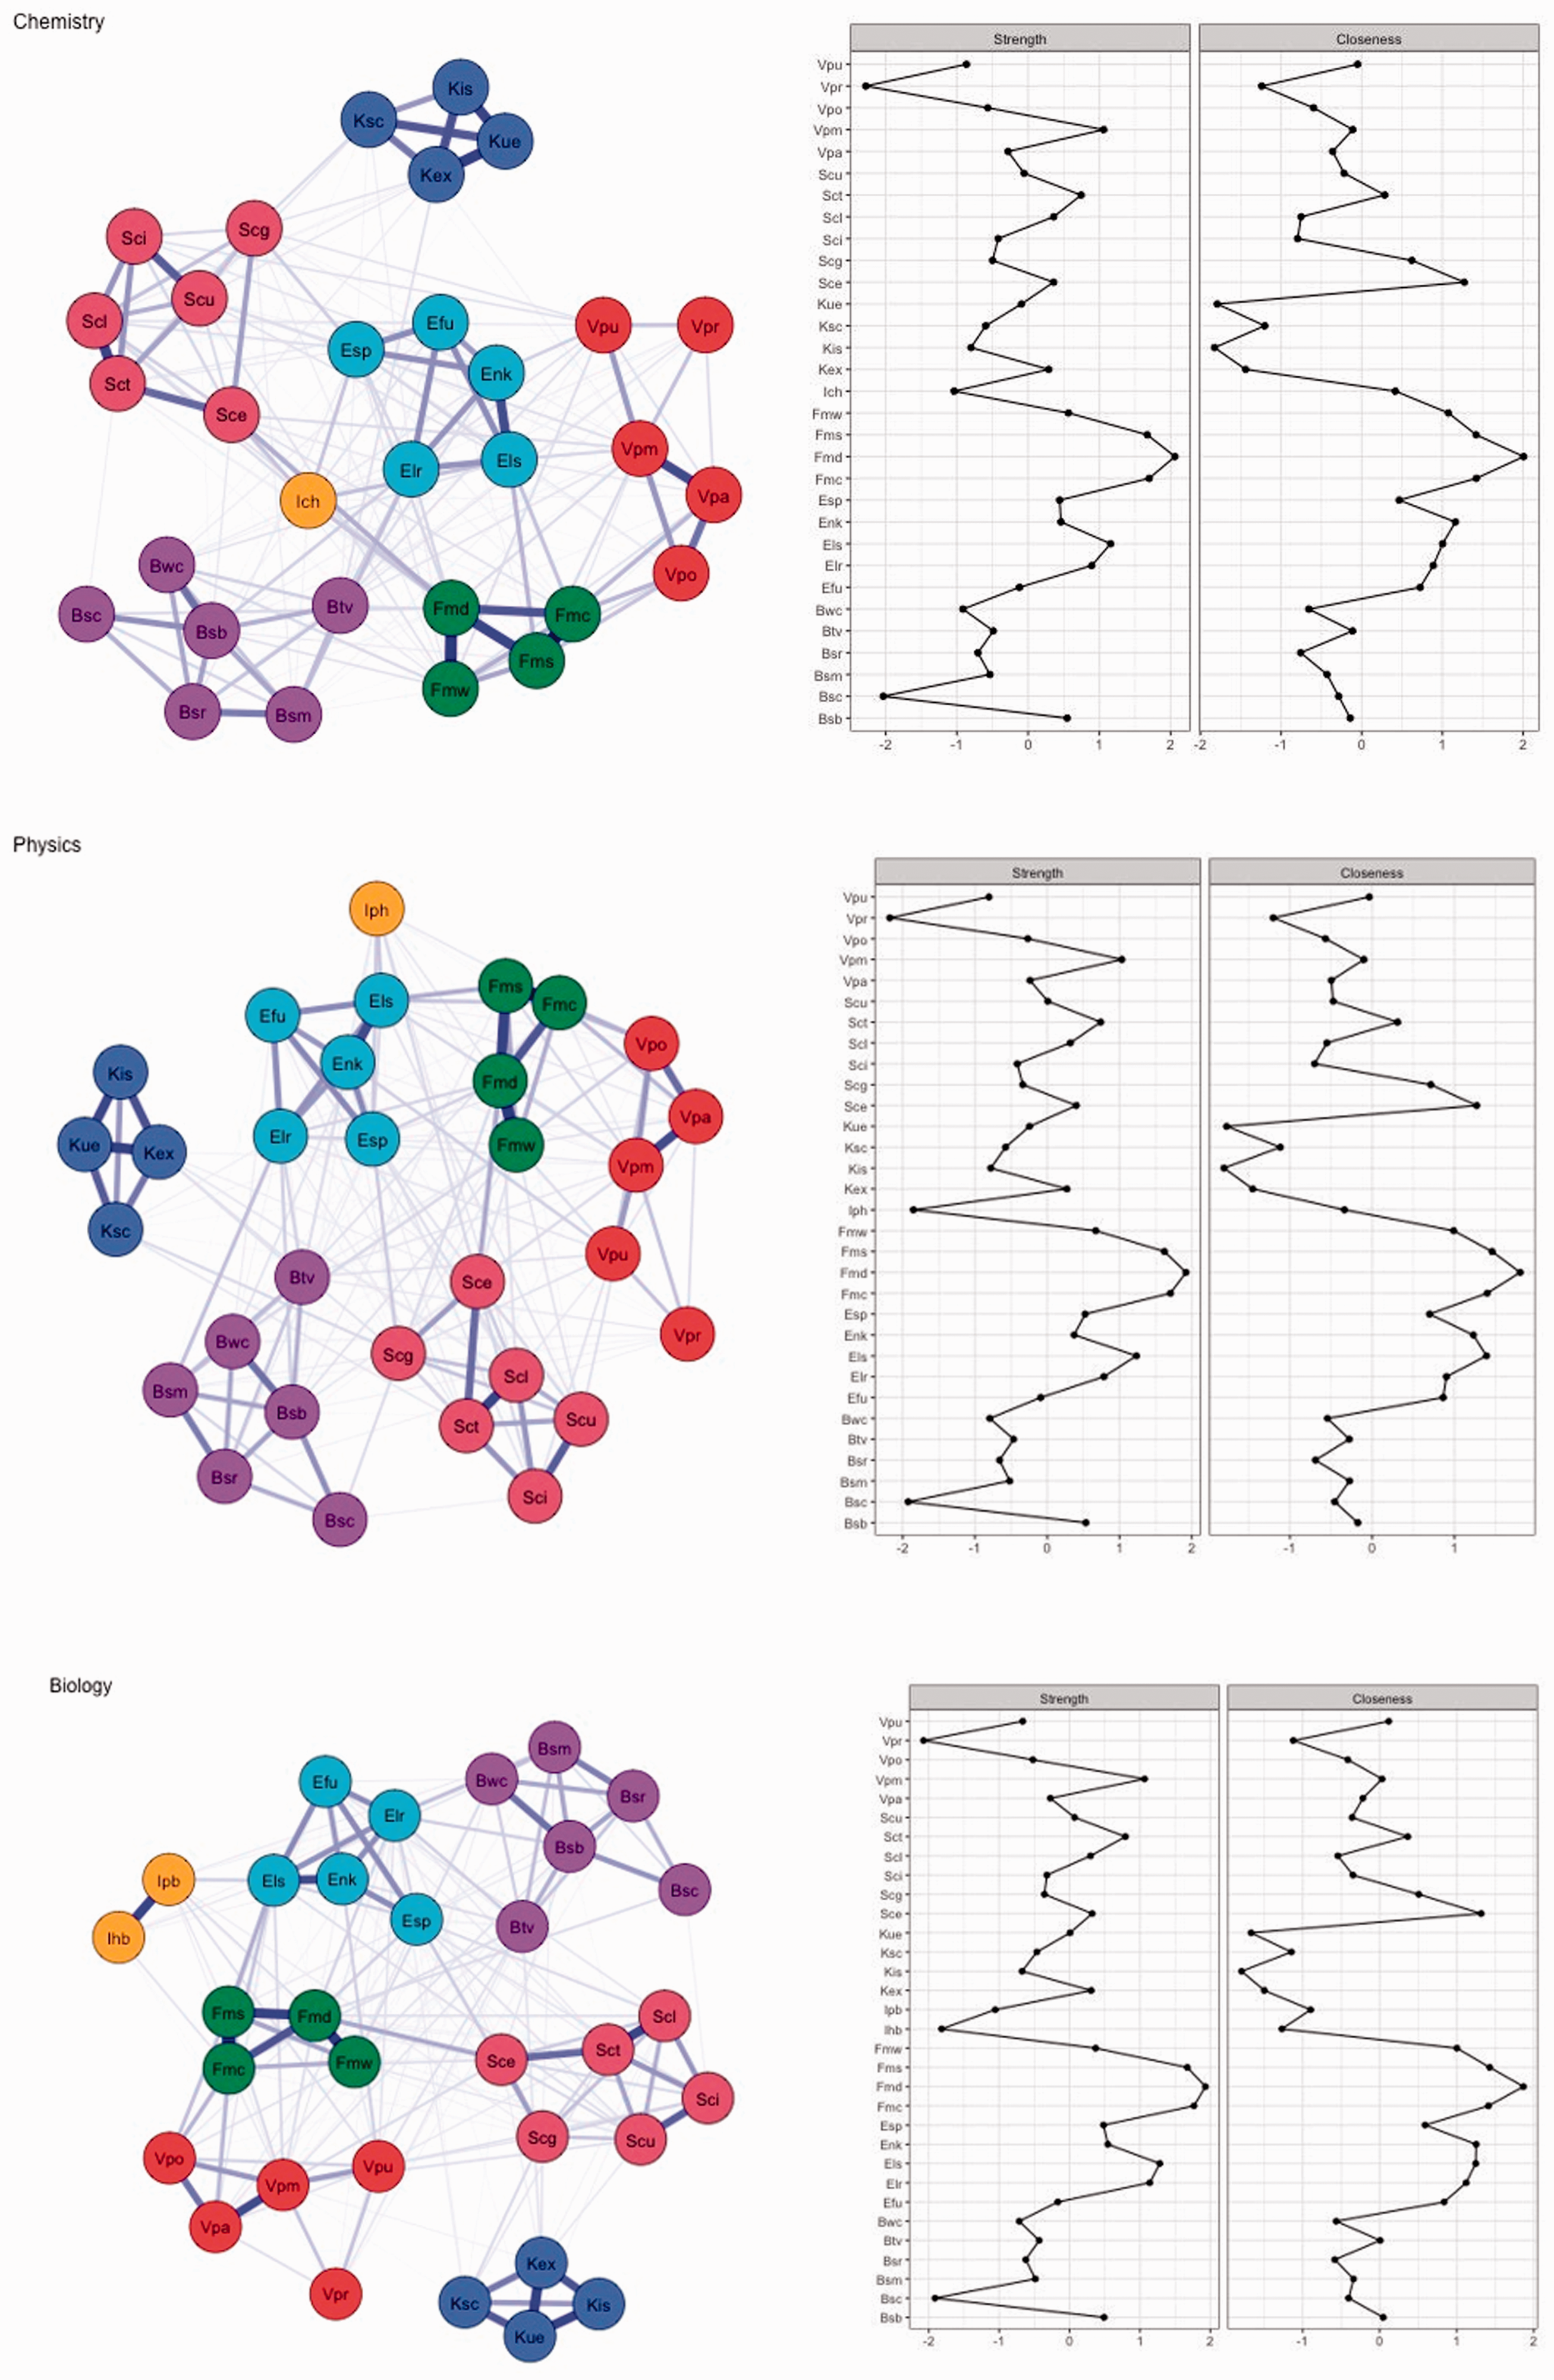
Course SINMs and centrality plots. Left panels: Networks depicting the relationships between the nodes (i.e. indicators) of Interest, Enjoyment, Personal Value, Behaviour, Knowledge and Self-concept in learners choosing chemistry (top), physics (middle) and biology (bottom) in the last year of secondary school. See Table 2 for the item labels of the nodes. The edges correspond to partial correlations between two nodes. Edge thickness indicates the strength of the relation, which can be positive (solid) or negative (dashed). Right panels: Scaled centrality measures per course SINM: strength (left) and closeness (right). The node names are displayed on the y-axis in alphabetical order.
Only strength (CS[cor = 0.7] = .75, .75, .75) and closeness (CS[cor = 0.7] = .67, .67, .67) centrality are included as they were sufficiently stable across the chemistry, physics and biology networks, respectively, whereas betweenness centrality (CS[cor = 0.7] = .21, .21, .28) was unstable. We interpret the results of the centrality of nodes only when they significantly differ from the centrality of other nodes, as shown in the bootstrap difference test (see the Supplementary Material). In general, the strength and closeness of indicators seems to be similar for all three SINMs, with Future Intention nodes having the highest strength across SINMs and the nodes Vpr (Value), Bsc (Behaviour) and the Interest nodes having the lowest strength. For closeness, a similar picture emerges: nodes related to Future Intentions are the strongest in closeness across SINMs, followed by nodes of the Enjoyment component and the node Sce (Self-concept). Knowledge nodes have the lowest closeness.
Forecast analysis
Step 1: Correlation between centrality and course enrolment
Figure 3 shows the relation between centrality and course enrolment, by SINM (rows) and centrality measure (left: strength; right: closeness). Visual inspection of Figure 3 gives an idea of which items are most central and predicte course enrolment best. Correlations between centrality and course enrolment are positive and significant for all subjects (ranging from r = . 36 to r = .74; all ps < .05). Details for each subject are discussed below, by centrality index.
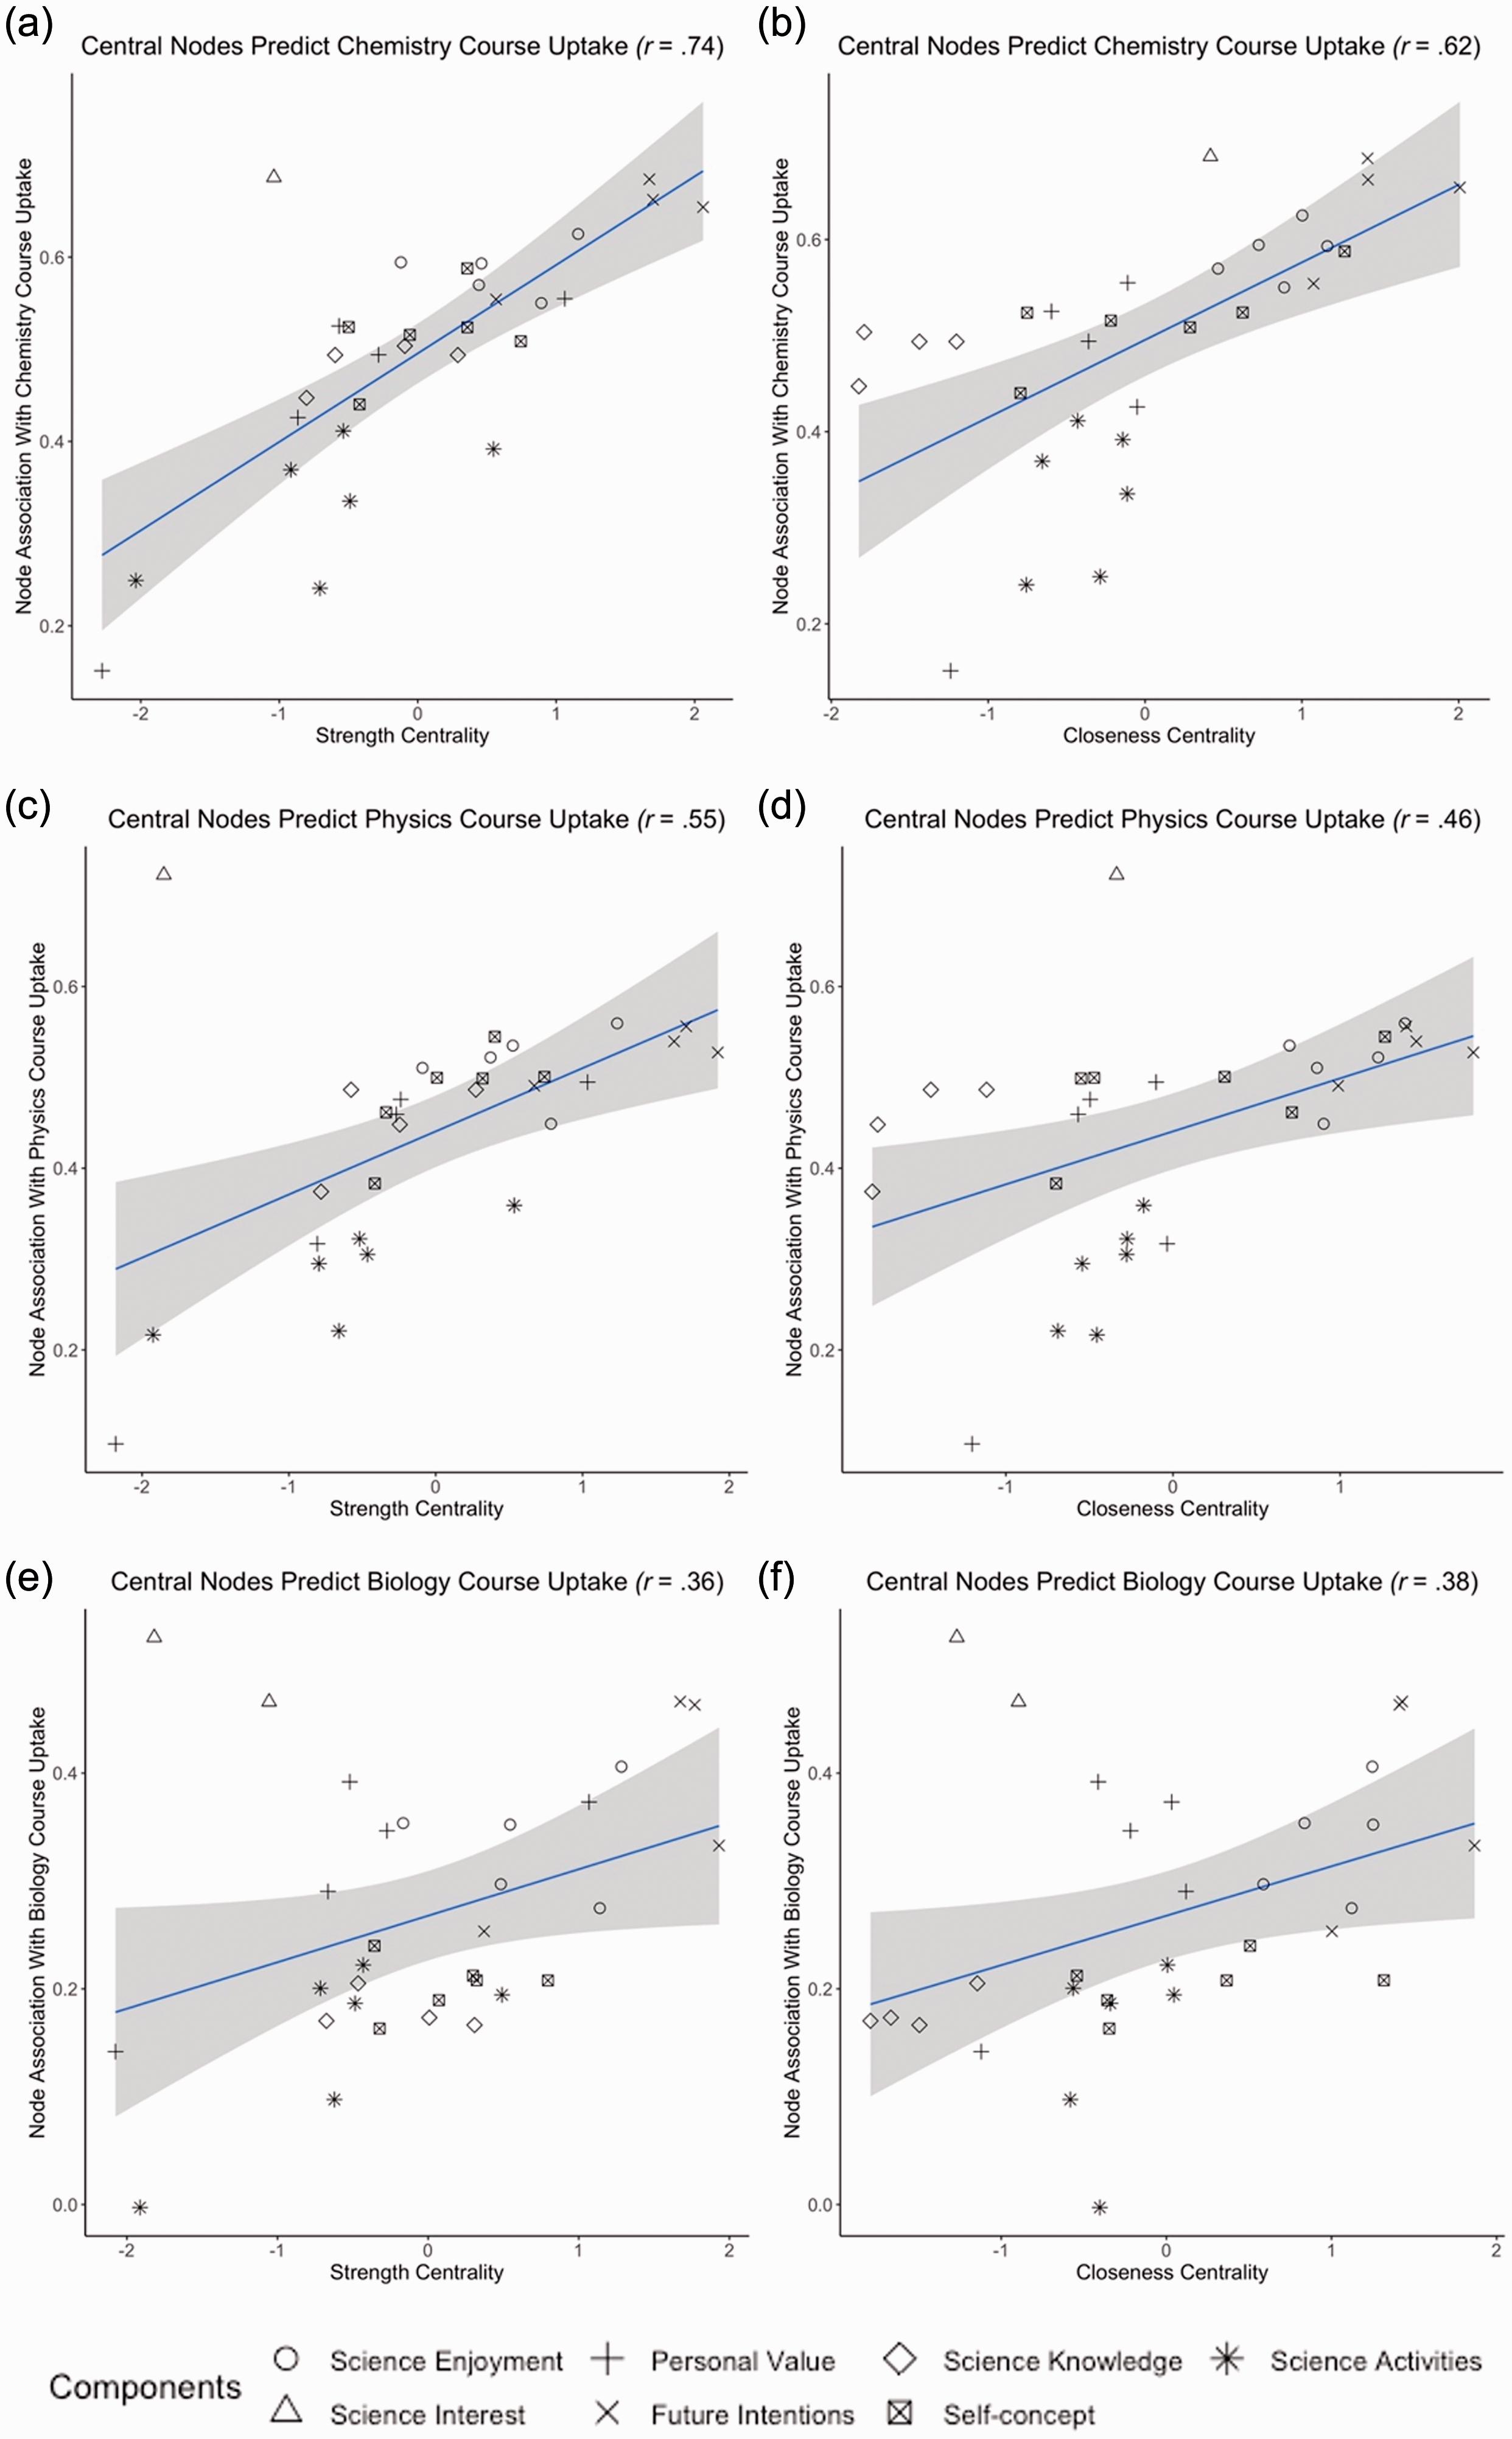
Effect of centrality on course enrolment for (a) strength centrality on chemistry course enrolment, (b) closeness centrality on chemistry course enrolment, (c) strength centrality on physics course enrolment, (d) closeness centrality on physics course enrolment, (e) strength centrality on biology course enrolment and (f) closeness centrality on biology course enrolment. Each point represents an indicator (node) in the networks, with different shapes corresponding to different components (see Table 2). Points towards the right on the x-axis are central nodes. Points high on the y-axis represent nodes that are predictive of course enrolment.
Strength
Seven nodes are significantly higher in strength than the other nodes across all three course SINMs: three Future Intentions nodes (Fmd, Fmc, Fms), two Enjoyment nodes (Els, Elr), a Personal Value node (Vpm) and a Self-concept node (Sct). The nodes with lowest strength are one Behaviour node (Bsc), one Personal Value node (Vpr) as well as the (or one of the) Interest node(s) (Ich for chemistry; Iph for physics and Ihb for biology). While the Interest node(s) are low in strength, they are predictive of course enrolment (see Figure 3; triangles).
Closeness
Nine nodes are significantly higher in closeness than the other nodes across all three SINMs: four Future Intentions nodes (Fmd, Fmc, Fms, Fmw), one Self-concept node (Sce) and four Enjoyment nodes (Enk, Els, Elr, Efu). The four Knowledge nodes (Ksc, Kex, Kue, Kis) and one Personal Value node (Vpr) are consistently lower in closeness than the other nodes. While the Interest node(s) are low (biology) to medium (chemistry, physics) in closeness, they are predictive of course enrolment (see Figure 3; triangles).
Steps 2 and 3: Regressions analyses
Chemistry course enrolment – strength
The model including node mean and strength fits best and is significant, F(2, 28) = 20.36, p < .001, R2Adjusted = .56. Only node strength is a significant predictor, t(28) = 6.28, p < .001, β = .76; and not the node mean t(28) = 1.70, p = .10, β = .21.
Chemistry course enrolment – closeness
The model including node closeness and variance fits best and is significant, F(2, 28) = 18.58, p < .001, R2Adjusted = .54. Node closeness is a significant predictor, t(28) = 5.54, p < .001, β = .70; alongside node variance, t(28) = 3.44, p = .002, β = .43.
Physics course enrolment – strength
The model including node strength and node variance fits best and is significant, F(2, 28) = 7.66, p = .002, R2Adjusted = .31. Only node strength is a significant predictor, t(28) = 3.13, p = .004, β = .49; and not node variance, t(28) = 1.48, p = .151, β = .23.
Physics course enrolment – closeness
The model including node strength and node variance fits best and is significant, F(2, 28) = 9.14, p < .001, R2Adjusted = .35. Both node closeness, t(28) = 3.52, p = .002, β = .52; and not node variance, t(28) = 2.90, p = .007, β = .43; are significant predictors.
Biology course enrolment – strength
The model including node strength and node mean fits best and is significant, F(2, 29) = 6.25, p = .006, R2Adjusted = .25. Both node strength, t(29) = 2.53, p = .017, β = .39; and node mean, t(29) = 2.69, p = .012, β = .42; are significant predictors.
Biology course enrolment – closeness
The model including node closeness and node mean fits best and is significant, F(2, 29) = 6.61, p = .004, R2Adjusted = .27. Both node closeness, t(29) = 2.65, p = .013, β = .41; and node mean, t(29) = 2.68, p = .012, β = .41; are significant predictors.
Discussion
Using the PISA 2006 and LSAY 2008 data (NCVER, 2017; OECD, 2006), we were able to test whether centrality of nodes in Year 10 students' SINMs is related to their chemistry, physics and biology course enrolment around two years later – in their last year of secondary school. Our results suggest that strength as well as closeness centrality of nodes in the SINM, meaning the extent to which a node is directly and indirectly related with other nodes, was predictive of later behaviour, namely enrolment choices learners made. Students’ Future Intentions and their Enjoyment of learning science were most consistently central, which replicated earlier findings of the central role of enjoyment in the SINM (Sachisthal et al., 2019) and the importance of future intentions for later choices (e.g. Stokking, 2000).
Theoretical implications
Theories of how (science) interest develops highlight the importance of mutual interactions of different science interest components, such as behaviour, enjoyment and knowledge, in the developmental trajectory from situational to individual interest (e.g. Ainley, 2017; Hidi & Renninger, 2006; Krapp, 2002). These mutual interactions between indicators are the central focus of analysis when using a network approach, as the indicators and their relations are what constitutes science interest (Sachisthal et al., 2019). As such, indicators that are more closely connected to other indicators are more central – and are assumed to be more influential – and should therefore be related with later outcomes. The results of the current study suggest that centrality within the SINMs is a significant predictor of enrolment in chemistry, physics and biology courses, even when controlling for covariates (mean and variance of the indicators), therefore validating the applicability of network models in the context of science interest. These mutual interactions between components are not commonly accounted for in latent variable models, in which directionality between components is often assumed (e.g. Ainley & Ainley, 2015; Jeffries et al., 2019). While the centrality of indicators was a significant predictor of enrolment for all three science courses, the prediction strength differed between the courses. It was strongest for chemistry, followed by physics and lowest for enrolment in biology subjects. This may be due to possible effects of background variables, which we did not account for; gender, for instance was found to be a direct predictor of biology, but not chemistry enrolment in an earlier study (Ainley & Ainley, 2015). Domain-specific differences between the SINMs are also a possible reason for differences in predictor strength, mirroring structural differences in SEM models predicting chemistry, physics and biology course enrolment in M. Ainley and Ainley’s study (2015).
The contribution of each component at different stages within (science) interest development is one of the open questions within interest research (e.g. Ainley, 2017; Renninger & Hidi, 2011). It is thought that affect is more important in earlier stages of interest, whereas value and knowledge components may contribute, in co-occurrence with affect, in later stages of interest. As such, our results concerning centrality of nodes within the SINM partly confirm this hypothesis, as future intentions, enjoyment (affect) and one value node (‘Broad science is very relevant to me’) were found to be the most central nodes across course SINMs. Knowledge was not central though, a finding that is also at odds with the results of studies using SEM models on the same data set (Ainley & Ainley, 2015; Jeffries et al., 2019). The finding is, however, consistent with earlier findings of the SINM (Sachisthal et al., 2019), in which Knowledge was not found to be central to the networks. When controlling for all other variables in the interest construct, the role of knowledge thus seems to be less influential.
Practical implications
Similar indicators were central in all three SINMs: All four indicators of students’ future intentions, such as wanting to spend one’s life doing advanced science, and two to five of the five Enjoyment indicators, such as being interested in learning about science, had both the highest indirect (closeness) and direct (strength) effect across all three course SINMs. The two indicators of students’ self-concept in science, such as their reported ease of learning school science topics, were either one of the highest indirect or direct indicators. Regarding science as being relevant for oneself, an indicator of students’ personal valuing of science, belonged in the group of indicators having the highest direct influence. These results are consistent with earlier research which has found that future intentions (e.g. Ainley & Ainley, 2015; Stokking, 2000), enjoyment (e.g. Lyons, 2006; Smyth & Hannan, 2006) and self-perceptions, including self-concept (e.g. Dickhäuser et al., 2005) are important predictors of course enrolment. The influential roles of these factors within the SINMs suggest that targeting these indicators in interventions may increase science interest in students, and may subsequently have a positive effect on students’ enrolment in science courses.
Limitations and avenues for future research
The results of the current study have to be interpreted with care due to the following limitations. First, we relied on existing data sets (NCVER, 2017; OECD, 2006). These data sets included measures and scales that were constructed to fit a latent variable perspective, using an empirically driven questionnaire construction approach, whereas from a network perspective, a theory driven approach is more appropriate (see Borsboom et al., 2004). The components of science interest were measured on different levels of specificity: from least specific for Knowledge being a composite score based on students’ responses to multiple test items, to most specific for the Interest indicators. This varying degree of specificity may have led to underestimation of the edges connecting indicators measured at different levels. Further research is needed to investigate whether networks differ for science subjects if components are measured for specific versus general domains (i.e. measuring chemistry knowledge versus science knowledge).
Second, contrary to earlier findings highlighting the importance of domain-specific interest in predicting course enrolment (e.g. Maltese & Tai, 2011), the Interest indicators were in the group with the lowest direct influence in the three SINMs. This can be attributed to the fact that there were only one (chemistry and physics SINM) or two science interest indicators (biology SINM) included in each SINM – as indicators belonging to the same science interest component form clusters of tighter interaction, their relation with one another contributes to their total strength centrality – meaning that the Interest indicators naturally have a lower strength centrality. An earlier study of SINM, which included a greater number of interest indicators than the current study, also found that nodes related to students’ interest were not the most central, neither in the Dutch nor the Columbian samples (Sachisthal et al., 2019). In the Dutch SINM, interest nodes did not even form their own cluster, but clustered instead with related domain-specific nodes. This finding, again, points towards the importance of domain-specificity in these networks. In future studies, a more balanced number of indicators per component should be used to counteract this issue.
Third, we decided to dichotomize the variables due to differences in scales measuring the constructs, non-normality of the data (particularly those items related to the Behaviour component), and higher stability of centrality indices. We acknowledge that this approach can lead to a significant loss of information, but it ensures that stability indices are more stable. For a more thorough discussion of this issue, please see Dalege et al.’s (2016) paper.
Fourth, the importance of student background variables, such as gender and SES, as well as students’ cultural identities, which may be of particular relevance in the Australian context in predicting science course enrolment or interest in science, has been reported previously (e.g. M. Ainley & Ainley, 2015; Jeffries et al., 2019; McConney et al., 2011; Van Langen et al., 2006). These factors were not included in the current study. A previous study of SINM using the PISA 2015 data (Sachisthal et al., 2019) found no structural differences of SINMs based on gender or SES in two countries, but future studies may consider including student background variables as possible mediators in the networks.
A variety of centrality indices exist and we decided to employ the centrality indices most widely used. Future research could use other centrality indices, one of which seems especially interesting in the context of science interest: Bridge centrality indices, which take into account components or communities of nodes and are a measure of in how far a node connects (i.e. bridges) the communities, and therefore may carry information between communities (Blanken et al., 2018; Jones et al., 2019).
Relying on cross-sectional data, we cannot make any reliable conclusions about the direction of relations between science interest indicators and possible individual differences in interest development (Krapp, 2002). Intervention studies are needed to test whether targeting central indicators within the SINMs indeed has a positive effect on interest development. Trajectories of interest development may be studied using network tools allowing the analysis of time series data, for instance (Epskamp, Waldorp, et al., 2018). Such analysis would allow for the modelling of the development of interest within and between individuals, which may be a fruitful avenue for research given that interest development theories hypothesize that different components may be more or less influential throughout the development of individual interest (e.g. Renninger & Hidi, 2011).
Conclusion
In the current study, we demonstrated that central indicators of the SINM of Year 10 students are important predictors of chemistry, physics and chemistry enrolment in their last year of secondary school. Our results suggest that similar interventions may be fruitful in increasing science interest for the enrolment of any of the three courses, that is increasing the future intention of science and enjoyment of science learning. The strength of prediction did differ between course SINMs though, with prediction strength being higher for chemistry and physics than for biology course enrolment. We believe that the psychometric network approach is a promising avenue for future research, especially as it enables us to study inter- and intra-individual dynamics of science interest development when applied to time series data.
Supplemental Material
sj-pdf-1-aed-10.1177_0004944120957477 - Supplemental material for Relating teenagers’ science interest network characteristics to later science course enrolment: An analysis of Australian PISA 2006 and Longitudinal Surveys of Australian Youth data
Supplemental material, sj-pdf-1-aed-10.1177_0004944120957477 for Relating teenagers’ science interest network characteristics to later science course enrolment: An analysis of Australian PISA 2006 and Longitudinal Surveys of Australian Youth data by Maien S.M. Sachisthal, Brenda R.J. Jansen, Jonas Dalege and Maartje E.J. Raijmakers in Australian Journal of Education
Supplemental Material
sj-pdf-2-aed-10.1177_0004944120957477 - Supplemental material for Relating teenagers’ science interest network characteristics to later science course enrolment: An analysis of Australian PISA 2006 and Longitudinal Surveys of Australian Youth data
Supplemental material, sj-pdf-2-aed-10.1177_0004944120957477 for Relating teenagers’ science interest network characteristics to later science course enrolment: An analysis of Australian PISA 2006 and Longitudinal Surveys of Australian Youth data by Maien S.M. Sachisthal, Brenda R.J. Jansen, Jonas Dalege and Maartje E.J. Raijmakers in Australian Journal of Education
Supplemental Material
sj-xlsx-3-aed-10.1177_0004944120957477 - Supplemental material for Relating teenagers’ science interest network characteristics to later science course enrolment: An analysis of Australian PISA 2006 and Longitudinal Surveys of Australian Youth data
Supplemental material, sj-xlsx-3-aed-10.1177_0004944120957477 for Relating teenagers’ science interest network characteristics to later science course enrolment: An analysis of Australian PISA 2006 and Longitudinal Surveys of Australian Youth data by Maien S.M. Sachisthal, Brenda R.J. Jansen, Jonas Dalege and Maartje E.J. Raijmakers in Australian Journal of Education
Footnotes
Acknowledgements
We would like to thank the National Centre for Vocational Educational Research (NCVER) and the Australian Data Archive (ADA) for making the Longitudinal Surveys of Australian Youth (LSAY) data available for our study, and the reviewers for the helpful suggestions.
Declaration of Conflicting Interests
The author(s) declared no potential conflicts of interest with respect to the research, authorship, and/or publication of this article.
Funding
The author(s) disclosed receipt of the following financial support for the research, authorship, and/or publication of this article: This work is part of the Research Priority Area Yield with project number 022.006.0, which is financed by the Netherlands Organisation for Scientific Research (NWO).
Note
Supplemental Material
Supplemental material for this article is available online.
References
Supplementary Material
Please find the following supplemental material available below.
For Open Access articles published under a Creative Commons License, all supplemental material carries the same license as the article it is associated with.
For non-Open Access articles published, all supplemental material carries a non-exclusive license, and permission requests for re-use of supplemental material or any part of supplemental material shall be sent directly to the copyright owner as specified in the copyright notice associated with the article.