
Abstract
Australia and New Zealand have participated in the Organisation for Economic Co-operation and Development’s Programme for International Student Assessment since 2000. Reading literacy was the main focus of the Programme for International Student Assessment in 2000, and at that time both countries’ students generally performed well above the Organisation for Economic Co-operation and Development average. Nearly 20 years later, in the latest cycle of the Programme for International Student Assessment in 2018, reading literacy was again the main focus. Students’ average reading performance has tracked down in both countries. Large inequities persist between socio-economically advantaged and disadvantaged students, indigenous and non-indigenous students, and genders. The Programme for International Student Assessment gathers a wealth of contextual information that highlights key educational challenges facing both countries, including poor disciplinary climates, declining attitudes towards reading and sense of belonging at school, and increasing bullying. While there are similarities among the two countries’ 15-year-olds, evidence shows practices are diverging at the middle primary schooling level, which may be impacting positively on younger Australian cohorts; these differences are also discussed with respect to early reading experiences.
Introduction
The Organisation for Economic Co-operation and Development’s (OECD) Programme for International Student Assessment (PISA) started in 2000 with the aim of evaluating countries’ education systems by assessing 15-year-olds’ skills and knowledge in three key domains: reading, mathematical, and scientific literacies. Focusing primarily on PISA 2018, the purpose of this paper is to compare and contrast the reading literacy results and key background factors for Australia and New Zealand’s students, also taking into account each country’s educational policy context.
Background
Australia and New Zealand share a similar colonisation history by Great Britain during the late 18th and early 19th centuries. However, they differ vastly in size and population. In 2018, Australia was estimated to have about 25.2 million people (Population Australia, 2019). New Zealand’s population was 4.7 million people (Stats NZ, 2018), about the same as Queensland, but living in an area only a little bigger than Victoria (268,000 square kilometres compared with 227,000
As a federal parliamentary constitutional monarchy, Australia’s governance is distributed between the national government (‘the Commonwealth’), and six states and two self-governing territories. The state and territory governments are also based on principles of parliamentary government (Parliament of Australia, 2019). New Zealand is also a constitutional monarchy with a parliamentary system of government.
Both countries have indigenous peoples, but with different histories and visibility in their respective countries. Indigenous Australians, Aboriginal and Torres Strait Islander People, make up 3.3% of Australia’s population and 5.6% of its student population (Australian Bureau of Statistics, 2018a, 2018b). Māori, as tangata whenua, 1 make up 16.5% of New Zealand’s population, with 24% of the student population identifying as Māori (Education Counts, 2019; Stats NZ, 2018).
Australia does not have an official language, though English is regarded as the country’s national language and is the language of instruction for the majority of students (Australian Council for Educational Research (ACER), 2017). New Zealand has two official languages: Māori and New Zealand Sign Language. English is often referred to as a de facto official language by virtue of its widespread use (Ministry of Education (MoE), 2007). Language diversity is a key characteristic of both Australia and New Zealand, with both countries having a vast number of languages, including indigenous languages, spoken in homes.
Early childhood education
Compared with Australia, New Zealand has higher participation rates in early childhood education and care (ECEC) for both 0–2 and 3–4
Schooling
Australia’s individual states and territories are responsible for their own education administration, although the structures are similar throughout the country (ACER, 2017). Government schools, accounting for 65.6% of students, receive funding from both the Commonwealth Government and their state or territorial government. Non-government schools, which are supported primarily by the Commonwealth, comprise Roman Catholic and independent schools, and account for just over one-third of all students (Department of Education, 2020).
New Zealand’s education system is characterised by a high level of decentralisation. The vast majority of students (96%) are enrolled in either state or state-integrated schools. 2 Schools are governed by boards of trustees, a type of Crown entity responsible for employing staff, and managing school property and finances. The remaining students (4%) attend independent schools. Fully registered independent schools receive partial funding from the central government (MoE, 2019).
Curriculum context
Until recently, Australian states and territories implemented their own curricula. At the end of 2011, the Australian ministers of education agreed to the gradual implementation of a national curriculum, the Australian Curriculum. New Zealand’s curriculum reforms began in the 1980s, and continued until 2007–2010, when The New Zealand Curriculum (NZC) was introduced and eventually fully implemented. 3 National standards for literacy and mathematics were also introduced in 2010 for monitoring student progress. However, with a change of government these were removed at the end of 2017 (MoE, 2017a).
There are similarities between the two countries’ curricula, with each organised around eight comparable learning areas with either general capabilities or competency areas that link to 21st century skills with which students are expected to be equipped. Both curricula can be used flexibly according to the school communities being served.
There are also points of difference. The Australian Curriculum is structured around schooling years, and is more prescriptive than the NZC, as it sets out content descriptions and achievement standards for each year. The NZC is organised around eight curriculum levels. Levels 1–5 span about two years of learning and Levels 6–8 about one year. For each learning area and level in the NZC, the content to be taught is expressed as achievement objectives; the distinction between curriculum levels is sometimes subtle.
National assessments
Both countries have a national assessment programme for monitoring system performance, though Australia’s programme is more extensive. Established in 2002, Australia’s National Assessment Program involves a full assessment of students at Years 3, 5, 7, and 9 in literacy and numeracy – commonly referred to as NAPLAN.
New Zealand’s National Monitoring Study of Student Achievement was first implemented in 2012, replacing the National Education Monitoring Project, which ran from 1995 to 2009. It assesses all eight curriculum areas with samples of Years 4 and 8 students (the end of primary school).
As well as PISA, both countries participate in the Progress in International Reading Literacy Study (PIRLS), a study at the middle primary level. 4 Compared with New Zealand, Australia’s use of PIRLS and PISA is more formal, with standards established for both studies in order to gauge how well Australia is meeting its literacy goals (Australian Curriculum, Assessment and Reporting Authority (ACARA), 2019).
Literacy policy context
For the past two decades, the goal of improving literacy achievement for all students has been central to the educational policies of both countries (see Appendix 1). For example, in 1997, all Australian education ministers agreed to a national literacy and numeracy goal: ‘Every child leaving primary school should be numerate and be able to read, write, and spell at an appropriate level’ (Department of Employment, Education, Training and Youth Affairs, 1998).
The Australian Government’s National Inquiry into the Teaching of Literacy 2004–2005, the Melbourne Declaration on Educational Goals for Young Australians in 2008, and the literacy targets set out by the 2013 Australian Education Act are also examples of important policy drivers for literacy education (ACER, 2017; Meiers, 2012).
The New Zealand Government also set its goal to improve literacy outcomes. In 1998, it announced that ‘by 2005, every child turning nine will be able to read, write, and do maths for success’, which led to the establishment of the Literacy Taskforce (New Zealand Literacy Taskforce, 1999). Recommendations made by the taskforce in 1999 subsequently informed the work of the Literacy and Numeracy Strategy. Active until 2010, this strategy involved the alignment of policies and programmes that focused on improving literacy achievement. Since the removal of national standards, the learning progression framework for reading has been advocated for use by teachers. 5
In addition to governmental goals and initiatives, both countries have implemented targeted interventions in schools to deliver sustained improvement in students’ literacy outcomes. These included Australia’s Literacy and Numeracy National Partnership (2008–2009 to 2011–2012), and New Zealand’s Literacy Professional Development Project (2004–2009).
Teaching reading in the early years
Since the late 1990s both countries’ reading has been viewed under a broader notion of literacy. In this context, considerable attention has been given to the teaching of reading in the early years of schooling and the elements of effective reading programmes. For example, the role of phonics instruction, where the emphasis is on a ‘whole-language’ instructional approach, has often featured as part of the debate on what represents effective practice.
Building on the findings of Australia’s National Inquiry into the Teaching of Literacy, the national research study In Teachers’ Hands has been influential in the approaches to teaching reading in Australia. In their reporting on the study, Louden et al. (2005) identified three teaching strategies found to be the most effective for teaching reading and improving literacy outcomes: a highly structured approach to phonics teaching in a purposeful context, clear explanations of word level structures, and careful scaffolding. Several Australian state education departments, such as those in New South Wales, South Australia, and Western Australia, encourage teachers to incorporate explicit and systematic teaching of phonics as part of their literacy programmes. 6
Underpinning New Zealand’s English-medium primary school literacy programmes are the MoE’s Effective Literacy Practice in Years 1 to 4 and its compendium Effective Literacy Practice in Years 5 to 8. Published in response to one of the 1999 Literacy Taskforce’s recommendations, they drew on national and international evidence on dimensions of effective reading practice at that time. The dominant approach to teaching reading is whole-language; however, it is estimated that around 90% of teachers integrate phonics at least to some extent as part of a ‘balanced’ reading programme (Chapman et al., 2018). Teacher support material Sound Sense 7 notes that effective teachers incorporate phonics through a range of instructional activities and use material already familiar to children.
Evidence from PIRLS 2016 suggests there are mostly similarities between Australian and New Zealand teachers’ pedagogical practices when teaching reading comprehension skills and strategies at the middle primary school level (Chamberlain & Forkert, 2019), although:
while ability grouping was equally likely to be used in both countries’ classrooms, New Zealand teachers were much less likely to teach reading as a whole-class activity Australian teachers were more likely to frequently teach decoding strategies and new vocabulary than New Zealand teachers Australian teachers were more likely to ask their students to read aloud than New Zealand teachers Australian teachers were more likely to develop their students’ evaluating and critiquing skills and have their students read longer chapter books (fiction and non-fiction) than New Zealand teachers.
PISA 8
Reading literacy was the main domain assessed in PISA in 2000, 2009, and again in 2018. The definition of reading literacy has essentially been the same for each cycle, but with some refinement to reflect the changing context and forms of reading. In 2018, evaluating the quality and credibility of texts featured as part of a refreshed definition: ‘Reading literacy is understanding, using,
The PISA 2018 framework defines three processes of reading comprehension to measure reading literacy: locating information, understanding information, and evaluating and reflecting. While the nomenclature for the processes has changed slightly over time, the 2000 and 2009 cycles measured broadly similar aspects (OECD, 2019a).
PISA professes not to be a curriculum-based study; it is designed to measure students’ cumulative learning to see how well equipped they are to transition into adulthood. However, curriculum is relevant to the PISA reading framework. For example, the Year 10 standard for listening, reading, and viewing associated with the Australian PISA modal year level requires students to evaluate text structures, develop and justify their interpretations of text, and analyse evidence (ACARA, 2016). According to NZC’s achievement objective for the English listening, reading, and viewing strand at Level 6, the level most New Zealand PISA students are expected to be at, students will ‘Integrate sources of information, processes, and strategies purposefully and confidently identify, form, and express increasingly sophisticated ideas’ (MoE, 2007, p. 58).
While the cohort of New Zealand students assessed in PISA 2018 would have had most of their learning experiences in the context of the NZC and National Standards, 9 the Australian Curriculum was only fully implemented in 2015 and it is unlikely that the Australian 2018 PISA cohort would have been greatly impacted by its introduction.
Reading achievement 10
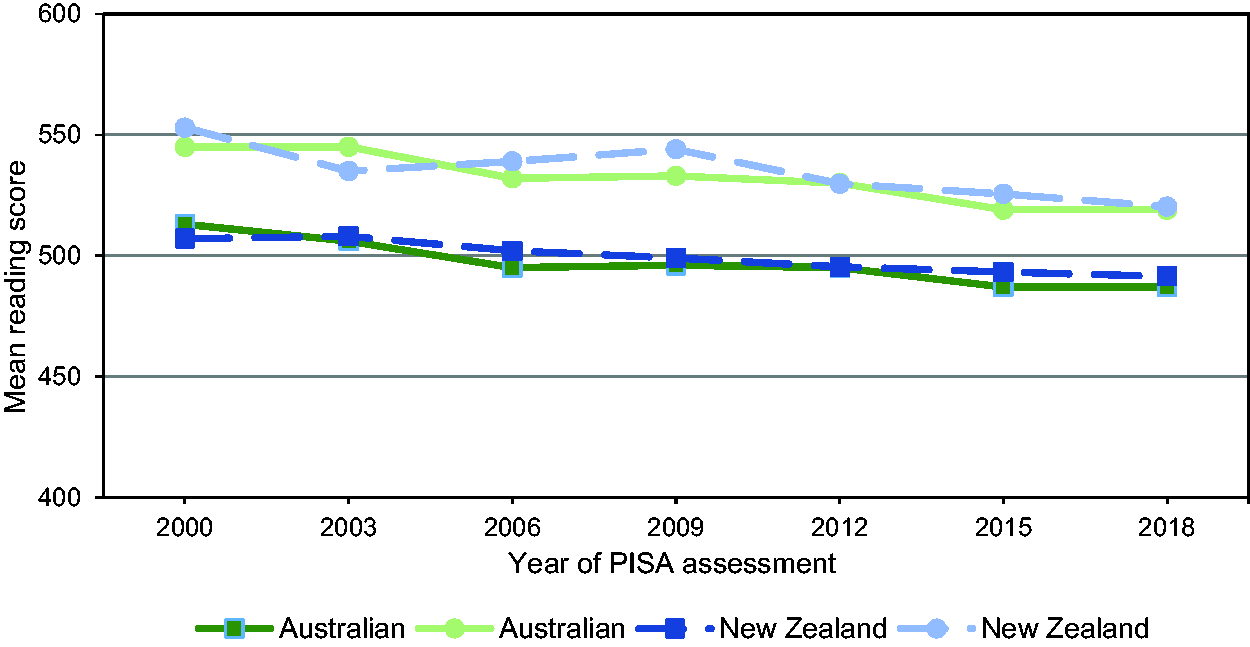
On average, both countries’ students performed similarly in reading literacy in both 2000 and 2018, and well above OECD averages (Figure 1). However, trend data indicate a long-term downward trajectory with decreases of 26 and 23 points for Australian and New Zealand students, respectively.
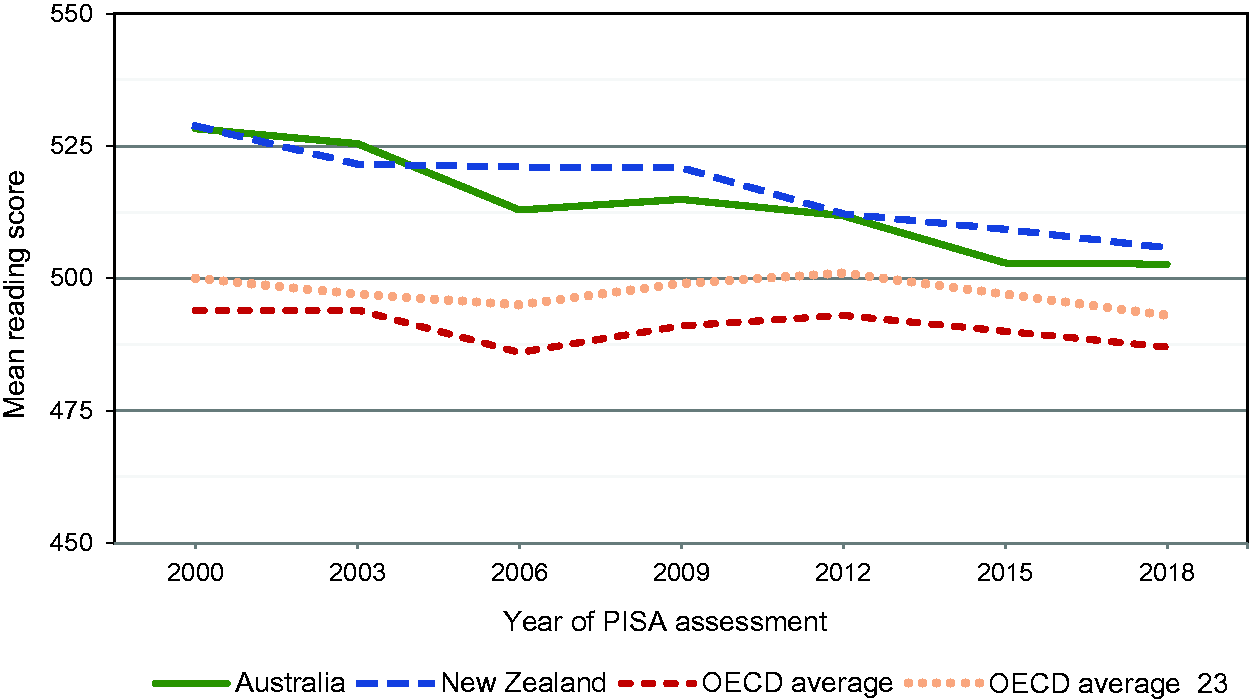
Trends in reading literacy performance of 15-year-olds, 2000–2018. Note: Sourced from PISA 2018 Results (Volume I): What Students Know and Can Do, OECD, 2019, Table I.B1.10. ‘OECD average-23’ refers to the average of all OECD countries with valid data in all seven assessments. Austria, Chile, Estonia, Israel, Luxembourg, the Netherlands, the Slovak Republic, Slovenia, Spain, Turkey, the United Kingdom, and the United States are not included in this average. OECD: Organisation for Economic Co-operation and Development; PISA: Programme for International Student Assessment.
The gradual decline in Australia’s reading performance is not reflected consistently across states and territories (Figure 2). Since 2000, Victoria and the Northern Territory have shown more variability but have had the smallest decline overall (8 points or less). New South Wales and South Australia had the greatest decline (more than 40 points). Queensland and Western Australia have had declines comparable to Australia overall and New Zealand.
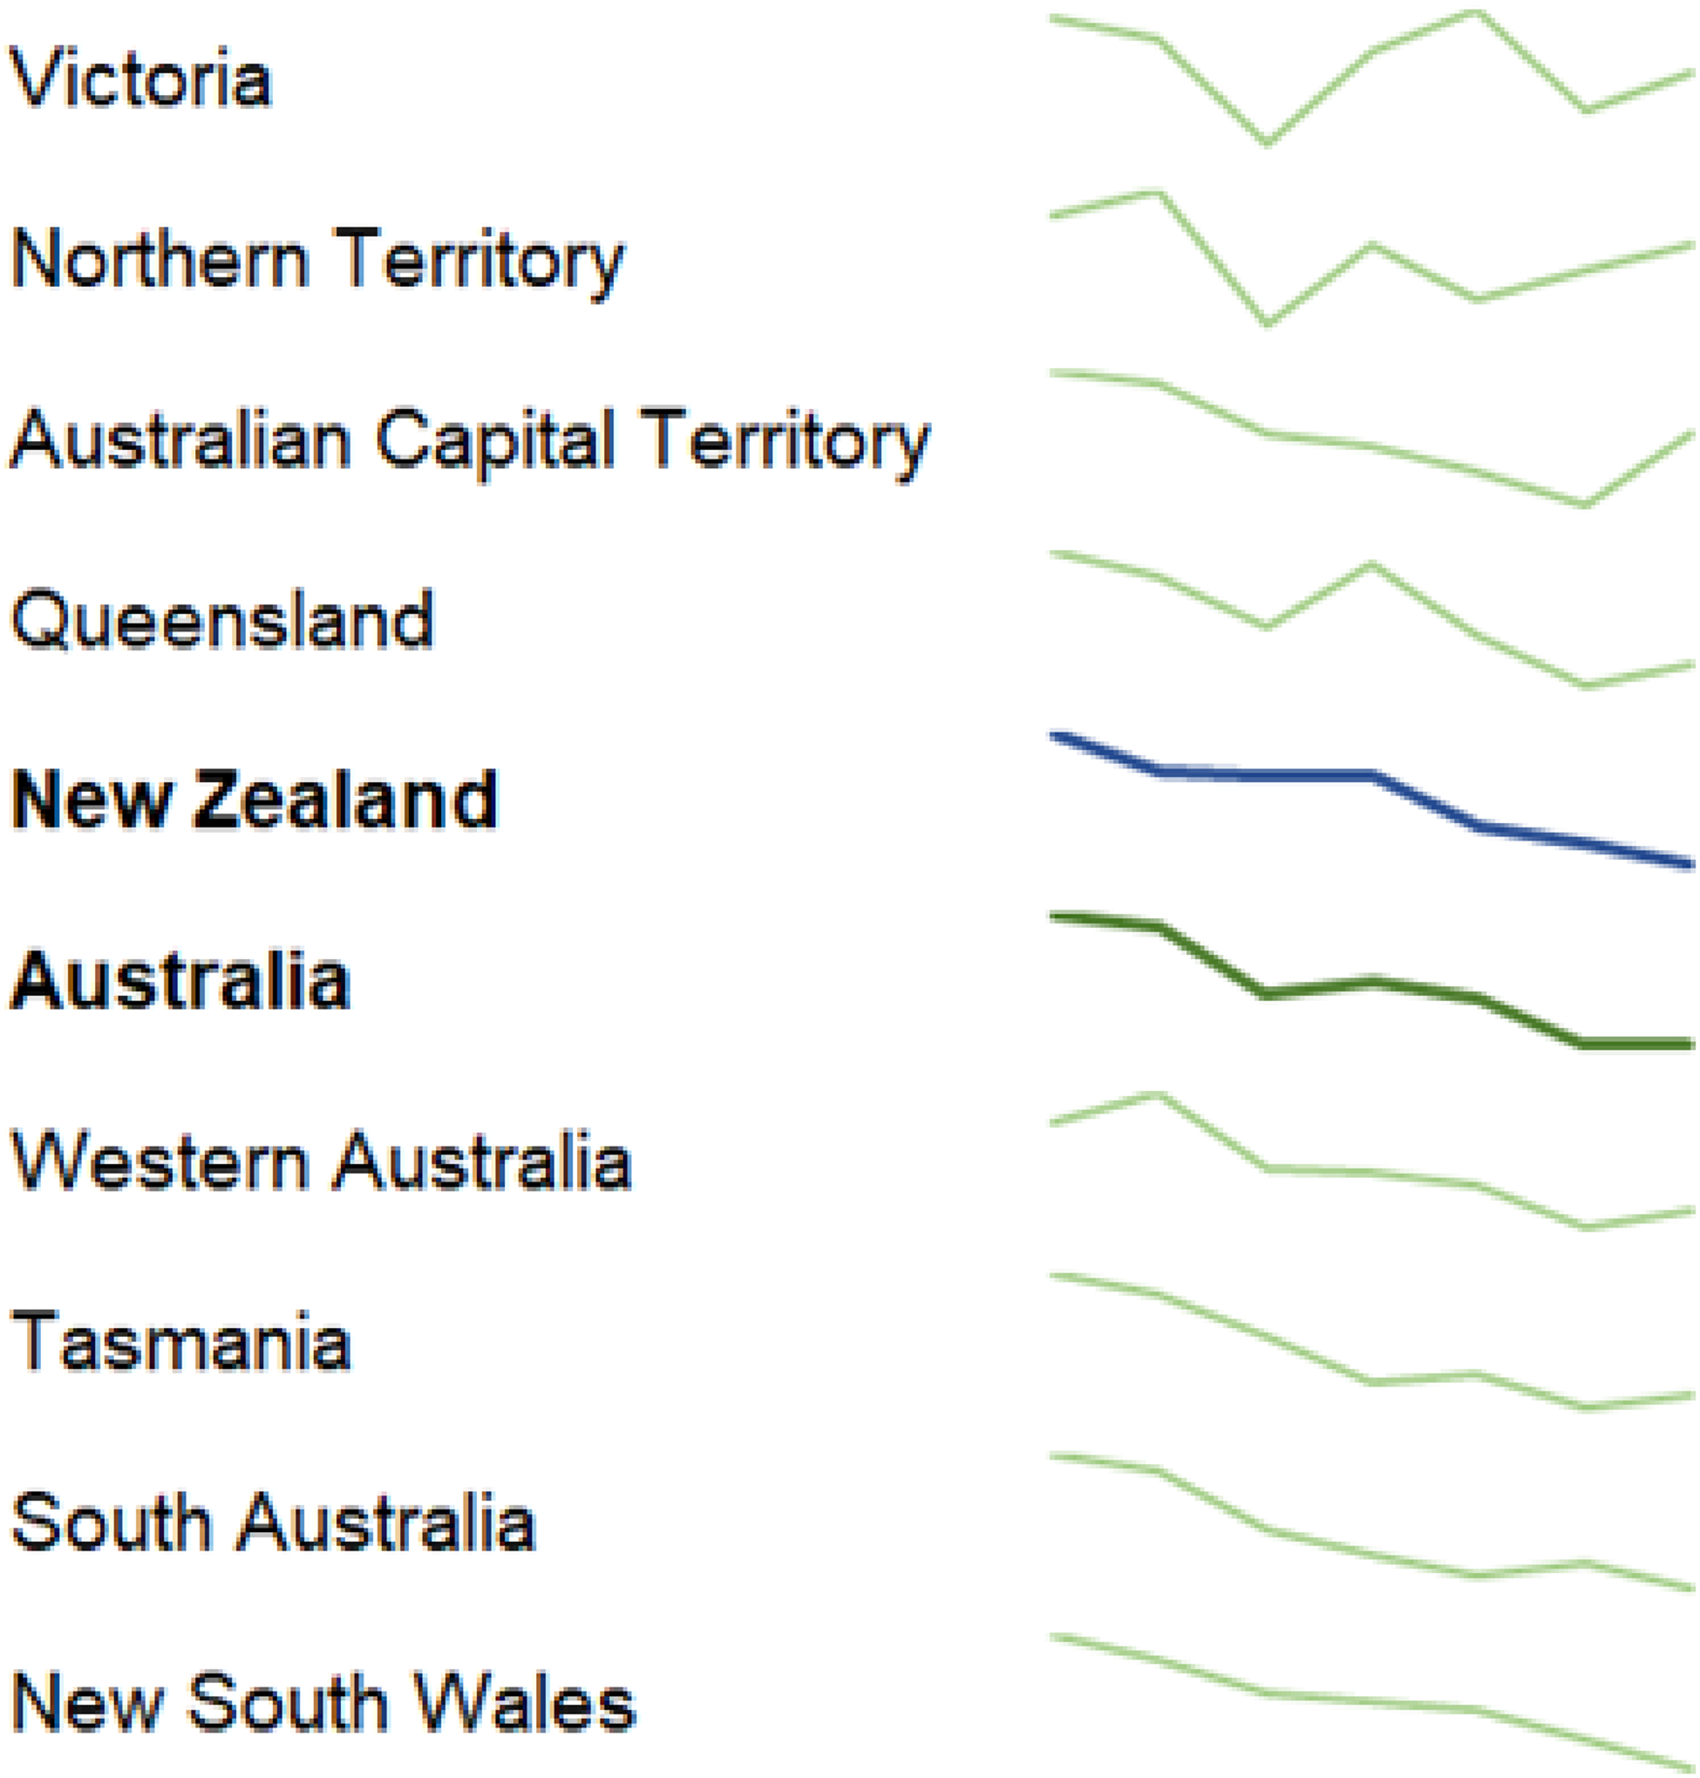
Trends in average reading scores of 15-year-olds, by education jurisdiction, ordered by smallest to largest decline. Note: Data sourced from PISA 2018: Reporting Australia’s Results Volume I Student Performance, S. Thomson, L. De Bortoli, C. Underwood, and M. Schmid, 2019.
PISA 2018 reported on student performance for the reading processes. The average scores on understanding information, and evaluating and reflecting were comparable for the two countries, but Australian students scored lower than their New Zealand counterparts on locating information.
Since 2009, Australian students have demonstrated a strength in evaluating and reflecting while New Zealand’s strength in this process was evidenced in 2009 only; in 2018, no processes featured as a strength or weakness.
Educational equity
Some of the most important equity-related factors associated with Australian and New Zealand students’ reading achievement include their socio-economic background, indigenous identity, and gender.
Socio-economic background
PISA measures a student’s socio-economic standing through a composite measure called the Index of Economic, Social and Cultural Status (ESCS), using student responses to questions on parental education and occupation, and possessions at home.
Across most countries, disparities in educational outcomes persist between socio-economically advantaged and disadvantaged students 11 ; Australia and New Zealand are no exception (see Figure 3). The gap between advantaged and disadvantaged students has historically been smaller in Australia than in New Zealand but these gaps have been converging since 2015. Since 2003, the average reading performance of advantaged students in both countries has declined faster than the performance of disadvantaged students.
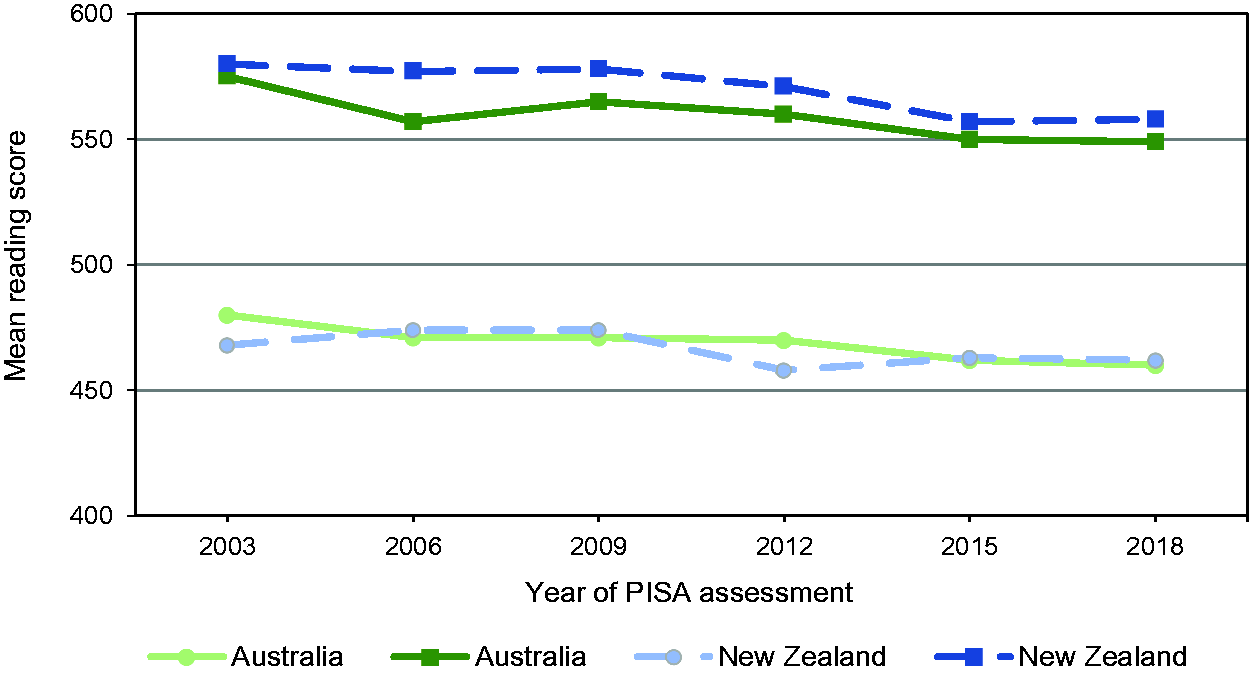
Trends in reading achievement for advantaged and disadvantaged 15-year-olds. 16 Note: Data sourced from PISA 2018: Reporting Australia’s Results Volume I Student Performance, S. Thomson, L. De Bortoli, C. Underwood, and M. Schmid, 2019, and PISA 2018 New Zealand Summary Report – System Performance and Equity, S. May, 2019. PISA: Programme for International Student Assessment.
To put this difference into a reading context, the mean score of advantaged students in both countries was near to, or above, the lower limit of PISA’s reading proficiency Level 4, 13 meaning they can comprehend extended passages, draw inferences based on multiple sources, and evaluate the reliability of a source. In contrast, the mean score of disadvantaged students in both countries was in the range of proficiency Level 2, the baseline level at which students begin to demonstrate the necessary reading skills that will enable them to participate effectively later in life.
In both countries, almost one-third of disadvantaged students scored below the Level 2 proficiency baseline in reading literacy, compared to less than 10% of advantaged students. While around one-quarter of advantaged students scored at or above proficiency Level 5, just 5% of disadvantaged students did.
Indigenous students
Despite work to lift the achievement of indigenous students in both countries, large gaps in reading performance between indigenous and non-indigenous students have continued since 2000 (Figure 4). Australia’s reading achievement gap between indigenous and non-indigenous students in 2018 was larger than that of New Zealand Māori and non-Māori students, though both were sizable (76 points and 56 points, respectively). The average reading scores for indigenous students in both countries were in the range of proficiency Level 2. However, in both countries, the average scores of non-indigenous students decreased more than those of indigenous students, but neither group had recorded any improvements since 2003.
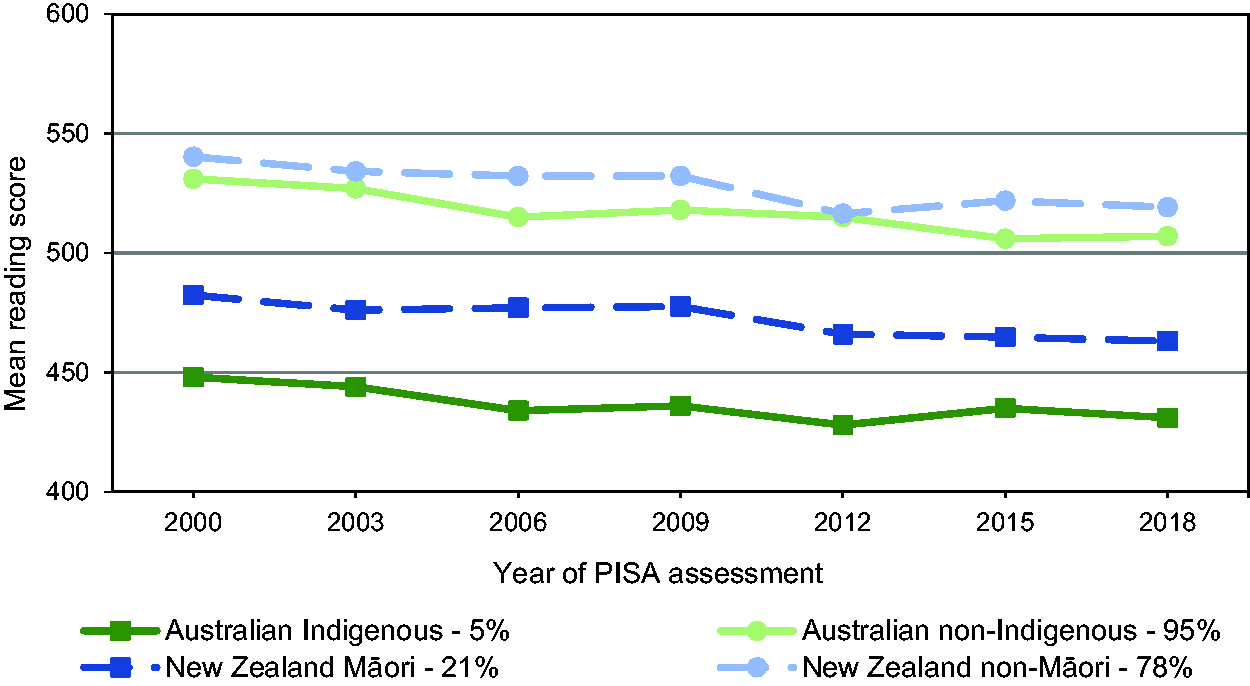
Trends in reading achievement for indigenous and non-indigenous 15-year-olds. Note: Data sourced from PISA 2018: Reporting Australia’s Results Volume I Student Performance, S. Thomson, L. De Bortoli, C. Underwood, and M. Schmid, 2019, and PISA 2018 New Zealand Summary Report – System Performance and Equity, S. May, 2019. PISA: Programme for International Student Assessment.
Gender
Girls have historically outperformed boys in reading assessments of primary and secondary students, in both PISA and numerous other studies (Loveless, 2015; Wagemaker, 1996). Consistent with the national trends, the average scores for both boys and girls have declined steadily in both countries (Figure 5).
Trends in reading achievement for male and female 15-year-olds. Note: Data sourced from PISA 2018: Reporting Australia’s Results Volume I Student Performance, S. Thomson, L. De Bortoli, C. Underwood, and M. Schmid, 2019, and PISA 2018 New Zealand Summary Report – System Performance and Equity, S. May, 2019. PISA: Programme for International Student Assessment.
Where the two countries differ is that, while the Australian gender gap has remained the same since 2000 (32 points), New Zealand’s has decreased, from 46 points in 2000 to 29 points in 2018, as girls’ reading scores have declined, on average, at a faster rate than boys’.
Classroom and school climates for learning
Disciplinary climate
Positive classroom climates with minimal disruptions allow students to concentrate better and teachers to create a safe environment. PISA measures the disciplinary climate of a classroom by asking students how often the following behaviours happen in their English classes:
Students don’t listen to what the teacher says
There is noise and disorder
The teacher has to wait a long time for students to quieten down
Students cannot work well
Students don’t start working for a long time after the lesson begins.
Australian and New Zealand students reported similarly negative experiences when compared to students in other countries. When responses to individual statements were combined to form the Index of Disciplinary Climate, with positive values indicating better disciplinary climates, Australia (−0.20) and New Zealand (−0.16) were found to have significantly lower mean values than the OECD average (0.04). As Figure 6 shows, the majority of Australian states and territories are in the same range, although the Northern Territory and Tasmania stand out as having particularly poor classroom climates.
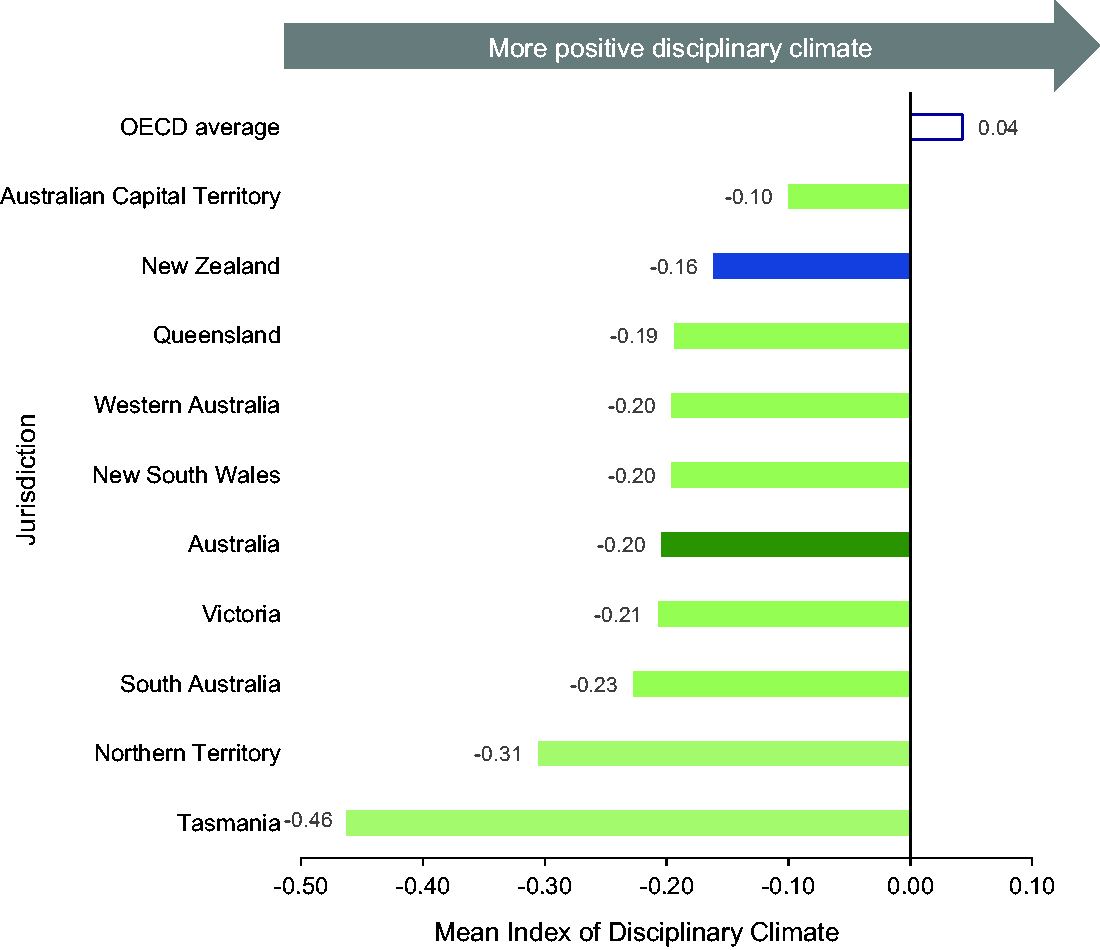
Mean index of disciplinary climate in New Zealand and Australian states and territories. Note: Data sourced from the OECD PISA 2018 database. OECD: Organisation for Economic Co-operation and Development.
In many countries and across the OECD on average, girls and advantaged students report significantly better disciplinary climates when compared with boys and disadvantaged students, indicating that these sub-populations experience different classroom climates.
The relationship between disciplinary climate and reading performance was also very similar in both countries. A one-unit increase on the Index of Disciplinary Climate was associated with a 12–13 point increase in reading scores, after accounting for students’ and schools’ socio-economic profile.
Since 2009, there have been increases in two behaviours in Australia (‘the teacher has to wait a long time for students to quieten down’ and ‘students cannot work well’). Increasing negative behaviours also feature in New Zealand classrooms, particularly the reports of ‘students cannot work well’ and ‘students don’t start working for a long time after the lesson begins’.
Truancy
Each day a student does not attend school, learning opportunities are missed (Gottfried, 2010). Skipping a full day of class was more prevalent in Australia (33% of students) and New Zealand (29%) than on average across the OECD (21%) (Figure 7). Since 2015, truancy has increased in both countries by 4–5 percentage points.
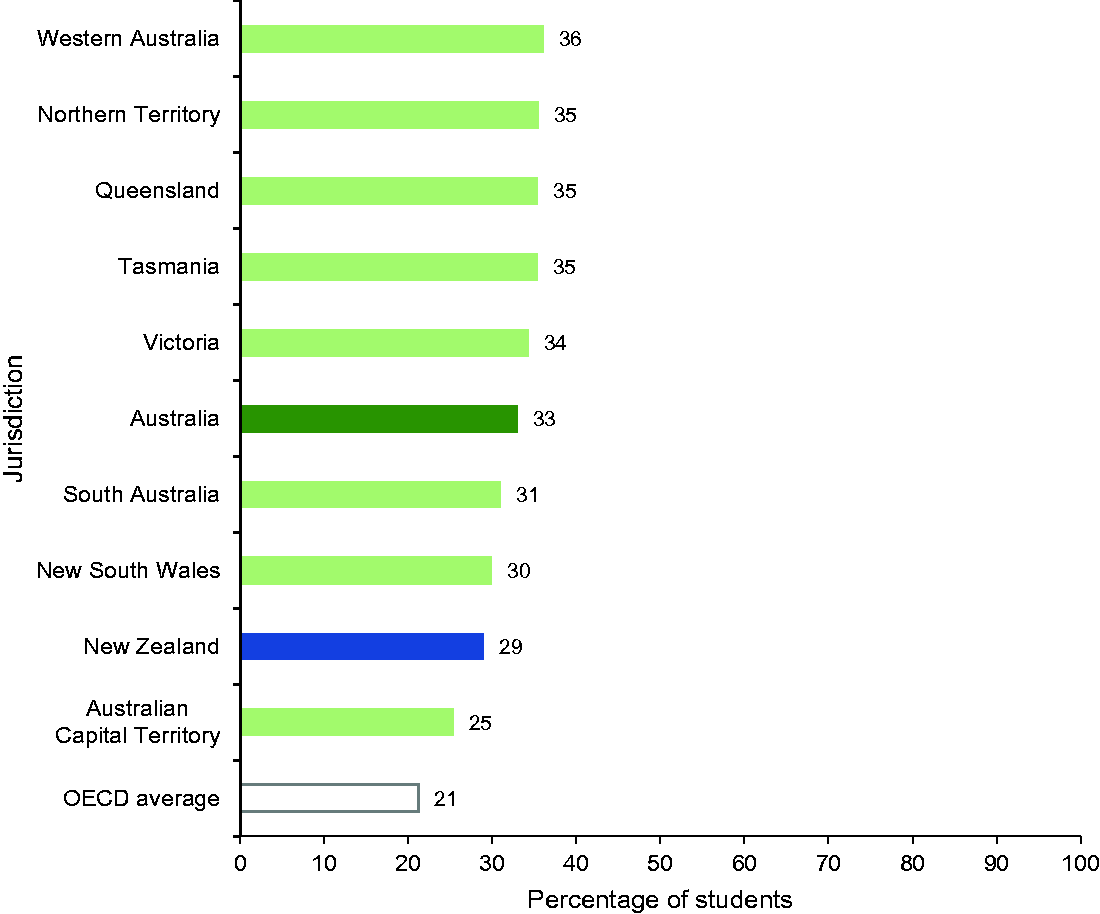
Fifteen-year-olds’ reports of truancy. Note: Data sourced from the OECD PISA 2018 database. OECD: Organisation for Economic Co-operation and Development.
The relationship between truancy and reading performance is meaningfully large in both countries. After accounting for students’ and schools’ socio-economic background, students who reported they skipped a day of school at least once in the two weeks prior to the PISA test scored 24 points lower in Australia and 32 points lower in New Zealand. Like all associations, the direction of causality is unknown, and in this case is likely to be bi-directional: students who are struggling academically in school are more prone to truancy, and missing learning time contributes to their academic struggle.
Sense of belonging
Sense of belonging encompasses student relationships at school and how much students feel accepted by others and the school community. To measure this, students were asked to what extent they agreed or disagreed with the following statements:
I feel lonely at school
Other students seem to like me
I feel awkward and out of place in my school
I feel like I belong at school
I feel like an outsider (or left out of things) at school.
Students in New Zealand and Australia reported similarly low levels of belonging at school. In both countries, almost one in five students felt lonely at school and one in four felt like an outsider (or left out of things) at school. Since 2015, both countries have seen a decline in sense of belonging across almost all statements. 14
Compared to the OECD average Index of Sense of Belonging value of 0.0, Australian and New Zealand students reported significantly lower levels of sense of belonging (Figure 8). While students scored higher in reading when they reported a stronger sense of well-being on average, this difference disappears after adjusting for students’ and schools’ socio-economic profile.
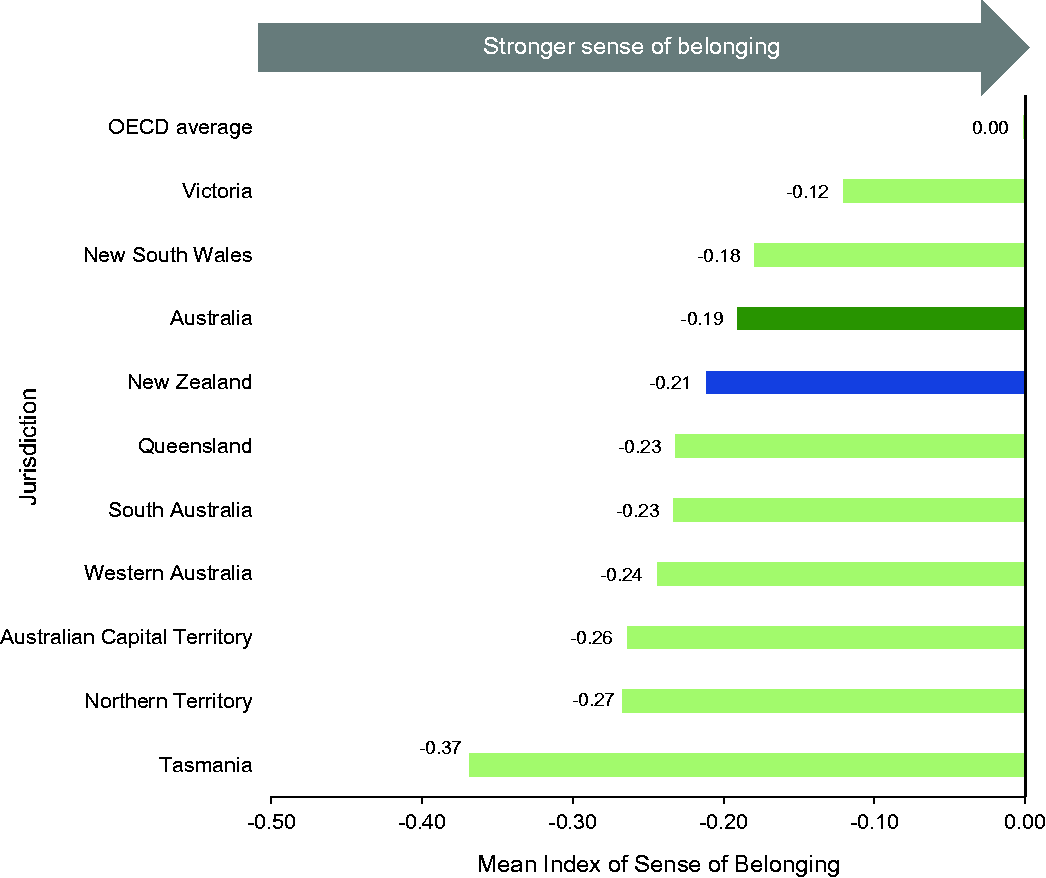
Mean index of sense of belonging in New Zealand and Australian states and territories. Note: Data sourced from the OECD PISA 2018 database. OECD: Organisation for Economic Co-operation and Development.
Bullying
PISA defines bullying as a ‘type of aggressive behaviour that involves unwanted, negative actions in which someone intentionally and repeatedly harms and discomforts another person who has difficulty defending himself or herself’ (OECD, 2019b, p. 46). Bullying can manifest physically (hitting), verbally (name calling), or relationally (spreading rumours).
Students were asked how often during the 12
Other students left me out of things on purpose
Other students made fun of me
I was threatened by other students
Other students took away or destroyed things that belong to me
I got hit or pushed around by other students
Other students spread nasty rumours about me.
Both Australian and New Zealand students reported high instances of bullying, with verbal and relational bullying being the most common. Around 30% of students in both countries experienced a bullying behaviour at least a few times a month.
Furthermore, both countries’ mean Index of Exposure to Bullying was significantly higher than the OECD average (Figure 9). New Zealand’s mean was also higher than the Australian mean and similar to the means for Western Australia and Queensland. Students with more frequent exposure to bullying scored lower on average in reading, even after accounting for students’ and schools’ socio-economic profile. Since 2015, there has been an increase in students’ experiences of bullying behaviours in both countries.
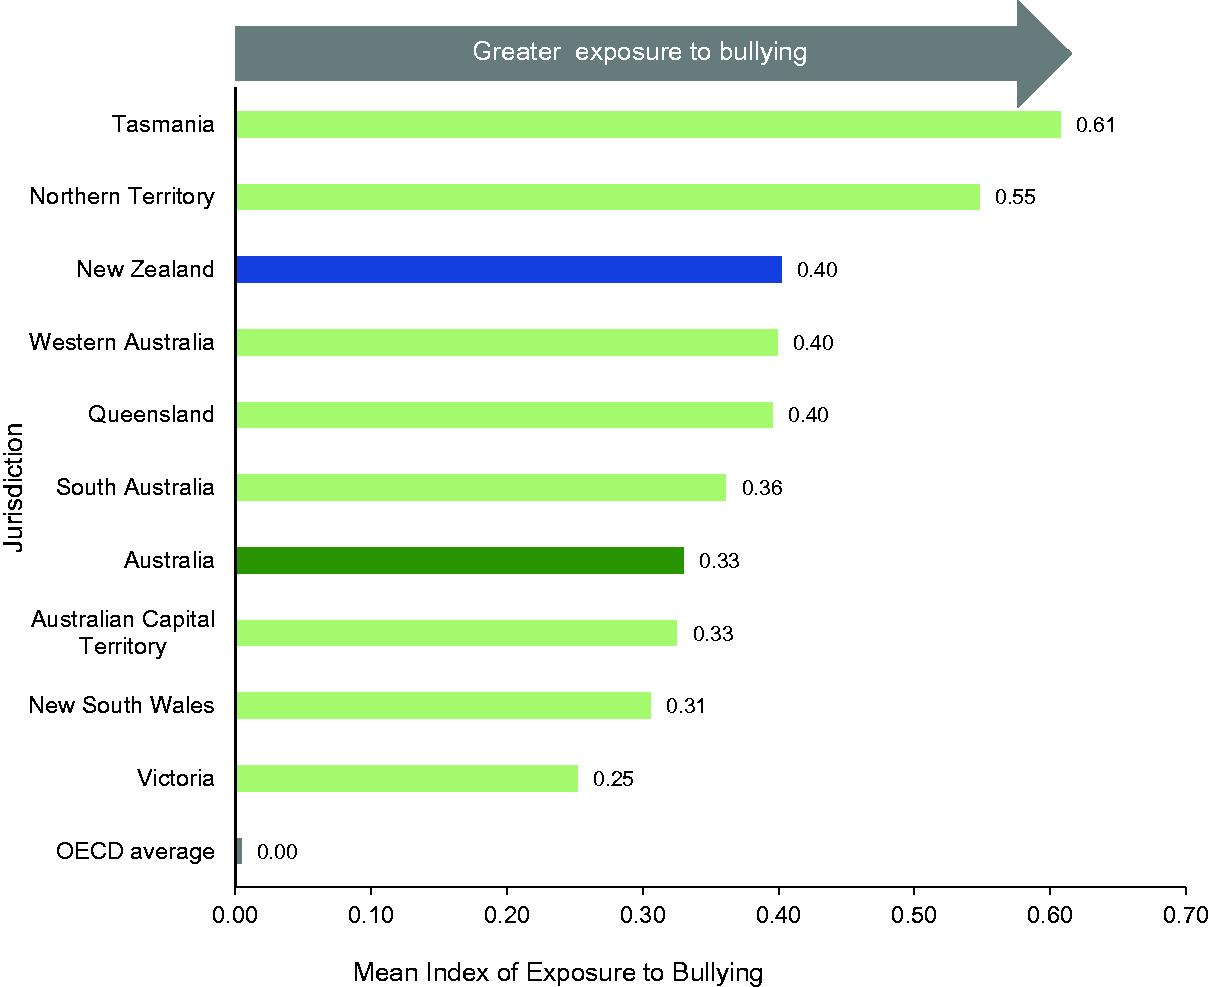
Mean index of exposure to bullying in New Zealand and Australian states and territories. Note: Data sourced from the OECD PISA 2018 database. OECD: Organisation for Economic Co-operation and Development.
Enjoyment of reading
In addition to a decline in positive learning environments for students, another shift has been in students’ attitudes towards reading, in particular reading for enjoyment. Students were asked how much time they spend reading for enjoyment, taking into account diverse kinds of reading including books, magazines, newspapers, websites, blogs, and emails. Based on their responses they were classified into two groups: those who read for enjoyment and those who do not.
In 2018, less than 60% of students in both countries reported they read for enjoyment (Figure 10), about 12–13 percentage points lower than in 2000. Students who read for enjoyment scored almost 60 points higher, on average, than those who do not, accounting for students’ and schools’ socio-economic profile.
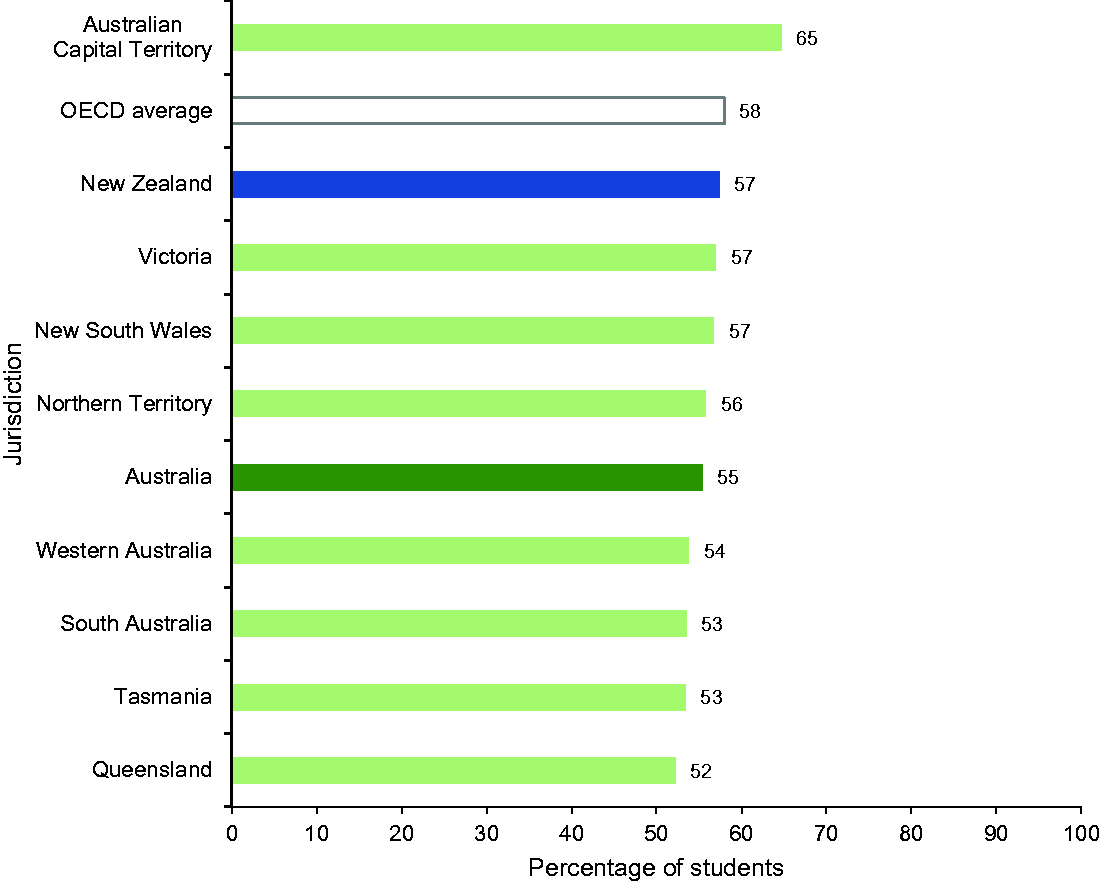
Percentage of students who read for enjoyment. Note: Data sourced from the OECD PISA 2018 database. OECD: Organisation for Economic Co-operation and Development.
Confidence in reading
PISA 2018 also asked about students’ perceived competence in reading. Students were asked how much they agreed with the statements:
I am a good reader
I am able to understand difficult texts
I read fluently.
As measured by the Index of Perceived Competence in Reading, Australian students nationally, and across states and territories, were significantly more confident in their reading abilities than the OECD average, and much more so than New Zealand students (Figure 11). Despite the average reading scores being lower than the OECD average, students in Tasmania and the Northern Territory were still very confident in their reading abilities.
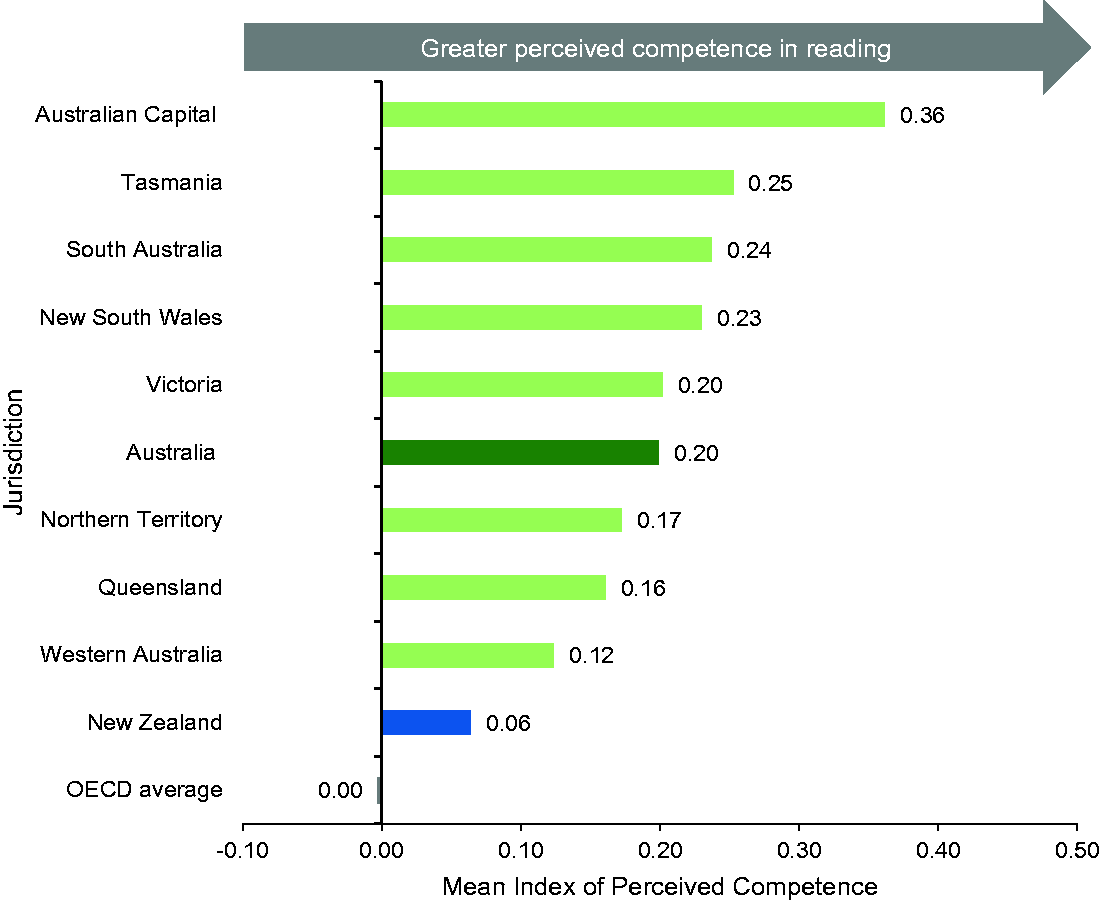
Mean index of perceived competence in reading in New Zealand and Australian states and territories. Note: Data sourced from the OECD PISA 2018 database. OECD: Organisation for Economic Co-operation and Development.
Relationships with reading achievement
The univariate relationships between student background factors and reading achievement reported above are all strong, with the exception of sense of belonging. However, it is useful to understand the impact each background factor has on reading achievement separately with the other factors being equal. First, for both Australia and New Zealand, multiple linear regression techniques were used to examine the relationship between the student background (contextual and demographic) and reading literacy performance. Second, the impact of each background variable was determined by calculating quasi-effect sizes from the regression coefficients that were normalised and adjusted to take into account whether or not they were derived from continuous or binary variables. Figures 12 and 13 show for Australia and New Zealand, respectively, the quasi-effect size (Cohen’s d) of each factor associated with each measure.
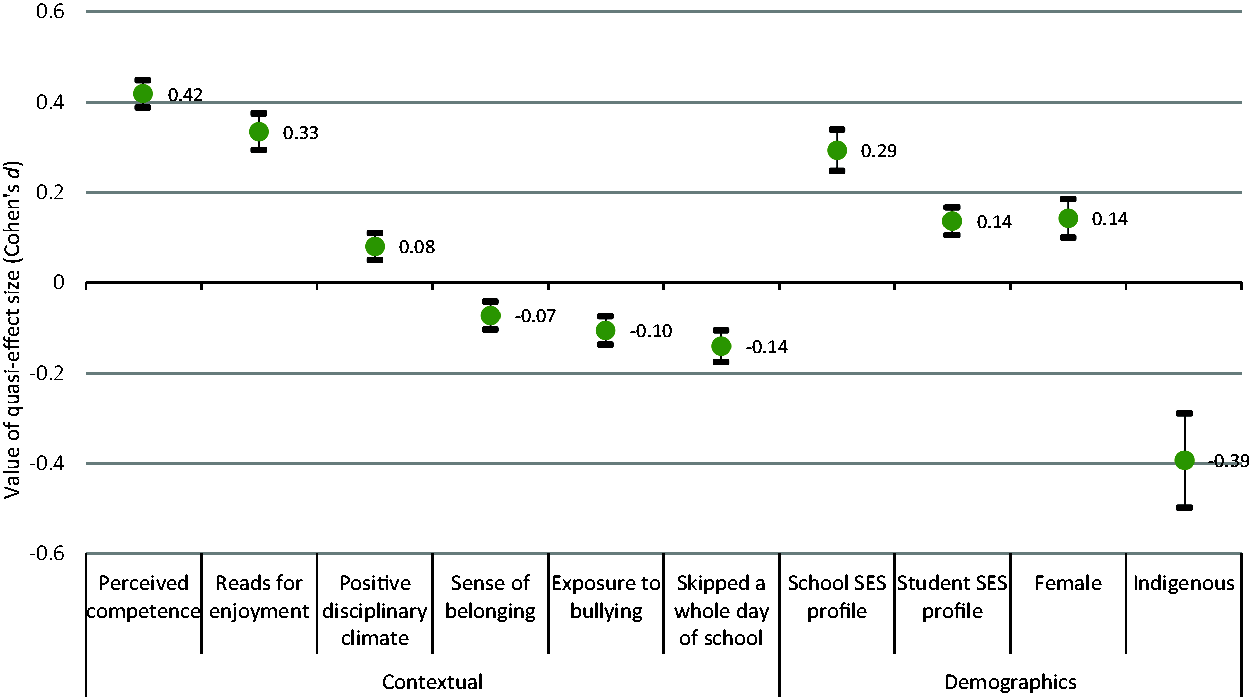
Quasi-effect sizes (Cohen’s d) of demographic and students’ learning climate and attitudes on PISA 2018 reading scores, Australia. Note: Data sourced from the Australia PISA 2018 database: https://research.acer.edu.au/ozpisa/. All effect sizes have p values <.01. SES: ‘socio-economic status’ using the PISA Index of Economic, Social and Cultural Status.
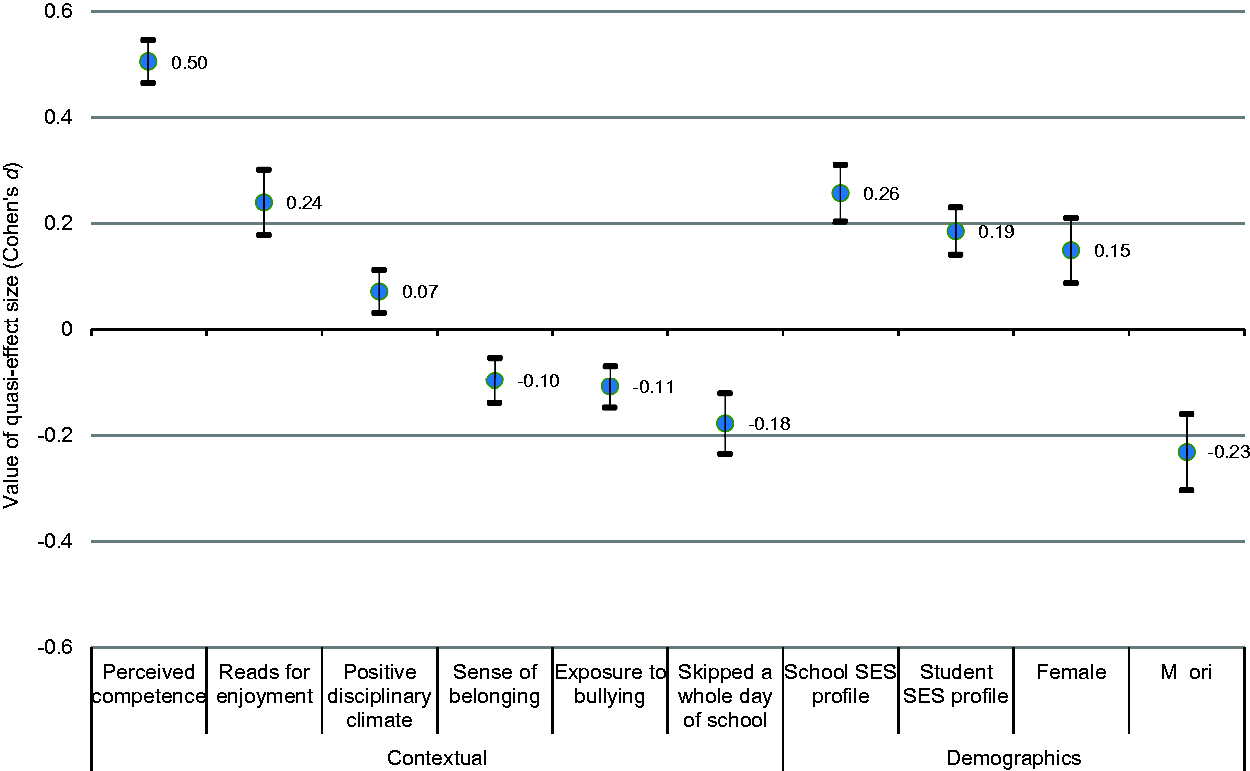
Quasi-effect sizes (Cohen’s d) of demographic and students’ learning climate and attitudes on PISA 2018 reading scores, New Zealand. Note: Data sourced from the New Zealand PISA 2018 database. All effect sizes have p values < .01. SES:▪▪.
When demographic variables are equal, all school climate and student attitude factors have significant effects on students’ reading achievement scores. In both countries, confidence and reading for enjoyment had the largest effects, while the effects of disciplinary climate, sense of belonging, and bullying reduced in magnitude. Most interestingly, a higher sense of belonging had a negative effect on reading with all variables held equal. This signals that if all other conditions for academic excellence are not met, having a strong social network at school will not help students achieve.
While creating a positive learning environment and developing positive attitudes towards reading are important, these alone will not erase the gaps in performance between sub-groups. Interventions at earlier year levels are likely needed.
Discussion
Through their colonial history and regional proximity, Australia and New Zealand share more similarities than differences, whether constitutional, cultural, or linguistic. Each education system is decentralised, though in slightly different ways and with the power held at different levels. While the countries’ indigenous peoples’ histories differ, the challenges they face are similar.
PISA lets us see just how close the two countries are, educationally, in the 21st century. They have a similar declining trajectory in reading performance, and the nature of their inequities is very similar, particularly those noted among socio-economic groups and indigenous peoples. This is despite having policies to tackle educational inequities such as Australia’s National Aboriginal and Torres Strait Islander Education Strategy 2015, and New Zealand’s Ka Hikitia Accelerating Success 2013–2017: The Māori Education Strategy and its 2020 refresh. 15 In both countries, students’ learning context and experiences at school are very similar – a weakening school climate and students’ sense of school belonging, and increasing rates of truancy and bullying.
Both countries’ literacy goals were established around the late 1990s, and both implemented new curriculums, standards for literacy, and national monitoring mechanisms. Australia’s national assessment programme is more comprehensive than New Zealand’s monitoring programme. NAPLAN provides more ‘signposts’ for the system, states/territories, and schools to make improvements. New Zealand’s national curriculum is permissive to allow for local context and priorities, and there are few system-level checks until its qualifications programme begins at Year 11, the modal year for New Zealand PISA students. If the 2019 recommendation from The Curriculum, Progress, and Achievement Ministerial Advisory Group to ‘develop curriculum progress maps that clarify critically important markers of progress … ’ (p. 9), is accepted, this may help strengthen the current curriculum.
The influence of NAPLAN, together with Louden et al.’s (2005) report could account for the significant improvement in reading performance of Australian middle primary school students in PIRLS 2016. New Zealand, on the other hand, showed significantly weaker performance overall compared with both other English-language countries and its own cohorts in previous cycles (MoE, 2017b). Australian middle primary students demonstrated the most improvement in the interpreting, integrating, and evaluating process, mirroring the strength of the PISA 2018 cohort, who showed a strength in the reflecting and evaluating reading process. This apparent strength for both Australian cohorts, combined with the fact that New Zealand middle primary students’ average performance declined most in this area, suggests a point of difference in curricular emphasis.
Both countries recognise the importance of research-based evidence to inform teaching practice. For example, since the mid-2000s Australia’s Commonwealth Government has recognised the evidence on the explicit and systematic teaching of phonics, and several states advocate this as a key element of an effective early years reading programme. In New Zealand the teaching of phonics is more often blended with whole-language practices. Teachers need to draw on their knowledge and skills to decide when and how best to teach phonics as part of an effective programme that best fits the needs of the children in their class. However, just changing the method for teaching phonics will not, on its own, make a difference to improving literacy outcomes of 15-year-olds.
Reading enjoyment has waned among Australian and New Zealand secondary school students since 2000. In many other countries, this attitudinal shift is evident among younger children and their parents/caregivers (Hooper, 2020). The classroom teacher’s role is crucial in fostering positive behaviours and attitudes to reading; they can do this by demonstrating the enjoyment they have when reading, and exposing students to a range of reading material. It is worth noting that large proportions of students reported not being assigned a text of at least 100 pages in their English class in 2018 (33% of Australian and 40% of New Zealand students).
Finally, the impact of not being confident as a reader cannot be overstated. New Zealand students, more so than their Australian counterparts, are not confident as readers; this is evident even at the middle primary school level (see Chamberlain, 2019). Some instructional practices teachers use (or not) could be contributing to students’ views of how they see themselves as readers. Reading aloud, for example, helps a reader develop fluency, but New Zealand middle primary school students have less opportunity to do this than Australian students. Australian teachers may be using approaches that could be adapted for the New Zealand context.
Conclusion
If current trends continue, neither Australia nor New Zealand will be considered high-performing education systems in terms of reading literacy; fewer students in both countries would have the essential literacy skills to function in society than previous cohorts and other comparable countries. Our analyses indicate that the most effective interventions to improve reading achievement will aim to increase student attendance and improve their reading behaviours. While other facets of school climate have less impact on achievement on their own, well-being outcomes like sense of belonging are desired schooling outcomes in their own right.
There are signs that Australia’s downward trajectory may reverse. Its PIRLS 2016 cohort performed better than previously and will be around the PISA-eligible age in PISA 2021. New Zealand’s PIRLS findings have informed some policy but little has changed in terms of impact on teaching practice (Chamberlain, 2012, 2019). It appears that the key differences in interventions between the two countries are related to advocacy of phonics-based instruction, practices that develop reading comprehension, and comprehensiveness of national monitoring. To address this, New Zealand might want to consider refreshing recommended literacy practice guides and assessments to ensure their relevance for literacy teaching in the 2020s.
The synthesis of PISA data has also highlighted the variation across the Australian states and territories. Future research might replicate the modelling undertaken to see which factors are most important at the state/territory level – reading enjoyment and confidence or the school climate factors. The other area to investigate further, not touched on in this summary, is how well initial teacher education programmes are preparing teachers to teach reading.
The similarities in educational contexts mean each country is in a position to learn from the success of the other and implement these ideas with some degree of success. Where the countries or jurisdictions face the same challenge, there should be enough similarity to collaborate and improve in tandem rather than in isolation.
Footnotes
Acknowledgements
The authors acknowledge the invaluable assistance from their Ministry of Education colleagues Adam Jang Jones and Steve May. The opinions expressed in this article are those of the authors and do not necessarily reflect the opinions of the New Zealand Ministry of Education.
Declaration of Conflicting Interests
The author(s) declared no potential conflicts of interest with respect to the research, authorship, and/or publication of this article.
Funding
The author(s) received no financial support for the research, authorship, and/or publication of this article.