
Abstract
Secondary schools are purported to play a significant role in the resilience enhancement of adolescents; however, there are no measures of resilience designed specifically for use in secondary schools. To address this shortcoming, a resilience at secondary school (RASS) scale was developed and its psychometric properties explored. Five hundred and sixty-two female secondary school students aged from 12 years to 18 years completed the 20-item RASS, which was adapted from the Resilience at University scale. Confirmatory factor analysis using structural equation modeling revealed a 19-item, seven-factor structure. Convergent validity of all the subscales was tenable. Internal consistency of two subscales was not ideal, indicative of the need for further research. The RASS scale and subscales represent promising empirical measures of resilience at secondary schools in Australia. With further refinement, the RASS offers educators in secondary schools a practical measure founded on the skills and behaviours considered critical for psychological resilience which can be used to inform resilience-building curriculum activities.
Introduction
Resilience has gained much attention over the past decades. Resilience is viewed as a concept enabling adaptation to stressors and contributing to wellbeing and success (Tusaie & Dyer, 2004). One area of focus has been on adolescent resilience, and Cefai (2004) contends that schools have a significant role to play in the resilience enhancement of adolescents. Multiple scales measuring resilience have been developed for use with adolescents, yet none of these have been developed specifically for a school environment. The broad and generalized nature of the scales limits the ability for results to be practically applied in a school setting. There have been calls to use more contextually-relevant measures of resilience (Robertson, Cooper, Sarkar, & Curran, 2015) which are practical and allow results to be translated into the settings for which they are intended (Winwood, Colon, & McEwen, 2013). Such measures can guide resilience development within a specific population and measure the effectiveness of resilience-building strategies in that setting. Similarly, Olsson, Bond, Burns, Vella-Brodrick, and Sawyer (2003) contend that specific definitions of resilience, such as social resilience, academic resilience, or emotional resilience, may be more useful than broad definitions as these may yield more detailed and useful insights into adolescent resilience development in a given setting.
In a school setting, teachers are identified as central to nurturing students’ resilience (Cefai, 2008; Knight, 2007). This study contributes to adolescent resilience through the development of a school-specific measure of resilience that can be conducted, scored and interpreted by secondary school teachers. The aim of the study is to develop a resilience at secondary school (RASS) scale and evaluate its psychometric properties. The RASS scale is not intended to replace existing measures of adolescent resilience used in clinical settings which focus on major trauma and stress. Instead, this new measure seeks to sit alongside clinical measures, albeit differentiated by its administration in secondary schools for use with all students. It is intended that the scale is founded on the skills and behaviours considered critical for psychological resilience in an academic environment. Importantly, results emerging from the scale can be translated into strategies that support resilience development and enhancement in the school environment.
Resilience development in schools
Various models of resilience have been developed (e.g. Cotton, Nash, & Kneale, 2017; Masten, 2018; Walsh, 2002); however, two models in particular focus on resilience development from an educator’s perspective. Such models provide guidance for educators in creating and promoting student resilience. The first of these is a resilience model for school-based educators developed by Knight (2007) which positions resilience using a three-dimensional framework: resilience as a state, a condition, and a practice. Resilience as a state specifies a set of personal characteristics associated with healthy development. These include emotional competence, social competence, and futures orientation. Resilience as a condition focuses on minimizing risk factors and enhancing protective factors. Educators can help protect children and young people from adversity through appropriate interventions that build their resilience. Resilience as a practice is focused on the role of the school and teachers and includes practical ways for fostering resilience in schools. This is achieved by the practical application of resilience knowledge to achieve better outcomes for students by placing more focus on protective factors that enhance resilience. Underpinning this three-dimensional framework is the contention that resilience is a quality that can be enhanced in all students rather than as a dispositional ability that some possess, and others do not.
The second model of resilience developed for educators focuses on the environment in which students are situated (Cefai, 2008), and is closely aligned with Knight’s contention of resilience as a practice. Cefai’s (2008) model outlines the key elements considered important in a classroom: emphasizing caring relationships, meaningful engagement, and a shared focus on learning all together. Both models position resilience as a capability which can be developed with targeted strategies, which is consistent with other definitions (e.g. Windle, 2011; Winwood et al., 2013).
The three-dimensional resilience framework of Knight (2007) is a useful lens to consider whether existing scales of adolescent resilience can be practically applied in a school setting. A further consideration is the psychometric properties of said scales. In their review of resilience measurement scales, Windle, Bennett, and Noyes (2011) caution that while various measures of resilience are adequate, there is no “gold standard”. Various studies have evaluated the psychometric properties of resilience instruments developed for adolescents (see Ahern, Kiehl, Sole, & Byers, 2006; Smith-Osborne & Whitehill Bolton, 2013; Windle et al., 2011). Of the scales evaluated, the Resilience Scale for Adolescents (READ) (Hjemdal, Friborg, Stiles, Martinussen, & Rosenvinge, 2006) is considered to have satisfactory psychometric properties alongside a comprehensive conceptualization of resilience which recognizes internal and external protective factors. The READ comprises factors and items which represent three higher-order categories: individual dispositional attributes, family support and cohesion, and external support systems.
In an academic context, student resilience is described as the “positive adaptation to situations of stress and adversity within the context of the situated formal or informal learning experience which enables student progress, growth, and learning” (Holdsworth, Turner, & Scott-Young, 2018, p. 1848). While the focus of Holdsworth et al. (2018) was on university students, this definition is applicable to a secondary school context; adolescents partake as students within a learning system shaped by the school, the classroom, the curriculum, and the teacher. While the READ is age-and-stage appropriate for secondary school students, the scale is a broad measure of resilience which encompasses systems beyond the school setting, and as such its items and scales do not readily lend themselves to intervention and education by the teachers.
In taking a broader view of resilience in the context of education, the Resilience at University (RAU) scale (Turner, Holdsworth, & Scott-Young, 2017) and the Academic Resilience Scale (ARS-30) (Cassidy, 2016) were developed specifically for students in higher education and both demonstrate promise as reliable and valid instruments. The ARS-30 comprises of 30 items and three factors: perseverance, reflecting and adaptive help-seeking, and negative affect and emotional response. Turner, Holdsworth et al. (2017), drawing on the work of Winwood et al. (2013), developed the RAU scale as a practical measure in which results can be translated into practical curriculum-based initiatives. The RAU consists of six factors – finding your calling, maintaining perspective, building networks, managing stress, interacting cooperatively and living authentically, and staying healthy – measured using 19 items.
It is unclear whether the RAU and ARS-30 are valid and reliable in a secondary school setting. While the ARS-30 demonstrates satisfactory psychometric properties in a university context, the face validity in a secondary school context is uncertain given that the instrument utilizes a vignette situated in a university environment, which is arguably not applicable to secondary school students. As such, the present study draws on the RAU developed by Turner, Holdsworth et al. (2017) which may be more readily modified, to explore whether this measure may be applicable within the context of secondary school education.
Method
Participants
The population consisted of students (Years 7–12) enrolled at a single-sex secondary school located in a large regional city in Victoria, Australia. Participation was anonymous and voluntary and occurred during the 2018 school year. A total of 562 female students participated in the study, representing 48% of the total number enrolled at the school. The age of participants ranged from 12 years to 18 years, with the mean and median ages being 14.5 years and 15 years, respectively. The distribution of the participants across year levels was as follows: Year 7 (n = 118; 21.0%); Year 8 (n = 94; 16.7%); Year 9 (n = 99; 17.6%); Year 10 (n = 108; 19.2%); Year 11 (n = 88; 15.7%); and Year 12 (n = 55; 9.8%).
Human subjects’ approval statement
Permission was granted by the participating school, and ethical approval was granted by the university Ethics Committee.
Instrument
Instrument suitability was guided by the three-dimensional framework of Knight (2007) which considers resilience as a state (personal characteristics associated with resilience), a condition (appropriate interventions that build resilience), and a practice (focus on protective factors that enhance resilience). Therefore, the instrument was required to meet the following to be rendered applicable for a school setting: (i) resilience is conceptualized as an ability which can be nurtured with targeted interventions, is (ii) a multi-dimensional construct comprising of emotional competence, social competence, and futures orientated which embodies both internal and external protective factors; (iii) each dimension of resilience can be translated into specific initiatives which can be implemented in a school setting; and (iv) building resilience capacity is a shared endeavor between the school, the teacher, and the student.
The six factor, 19-item RAU scale (Turner, Holdsworth et al., 2017), itself based on the seven-factor, 20-item resilience in the workplace (RAW) scale proposed by Winwood et al. (2013), was adapted for use in a secondary school setting. The RAW scale has demonstrated good internal consistency reliability (α = 0.84) (Winwood et al., 2013), as has the RAU (α = 0.81) (Turner, Holdsworth et al., 2017). The RAU measure has been shown to have a positive relationship with subjective happiness, and a negative relationship with depression, anxiety and stress (Turner, Holdsworth et al., 2017). Furthermore, the RAU conceptual framework has been utilized in various studies to explore resilience across countries and identify resilience-building strategies which can be used by educators (see Holdsworth et al., 2018; Turner & Simmons, 2019). While the RAU is a relatively new measure in developmental phase, it was considered worthy of further investigation in a school setting given that its psychometric properties are satisfactory, and its philosophical stance is aligned with the key elements of Knight’s (2007) resilience framework.
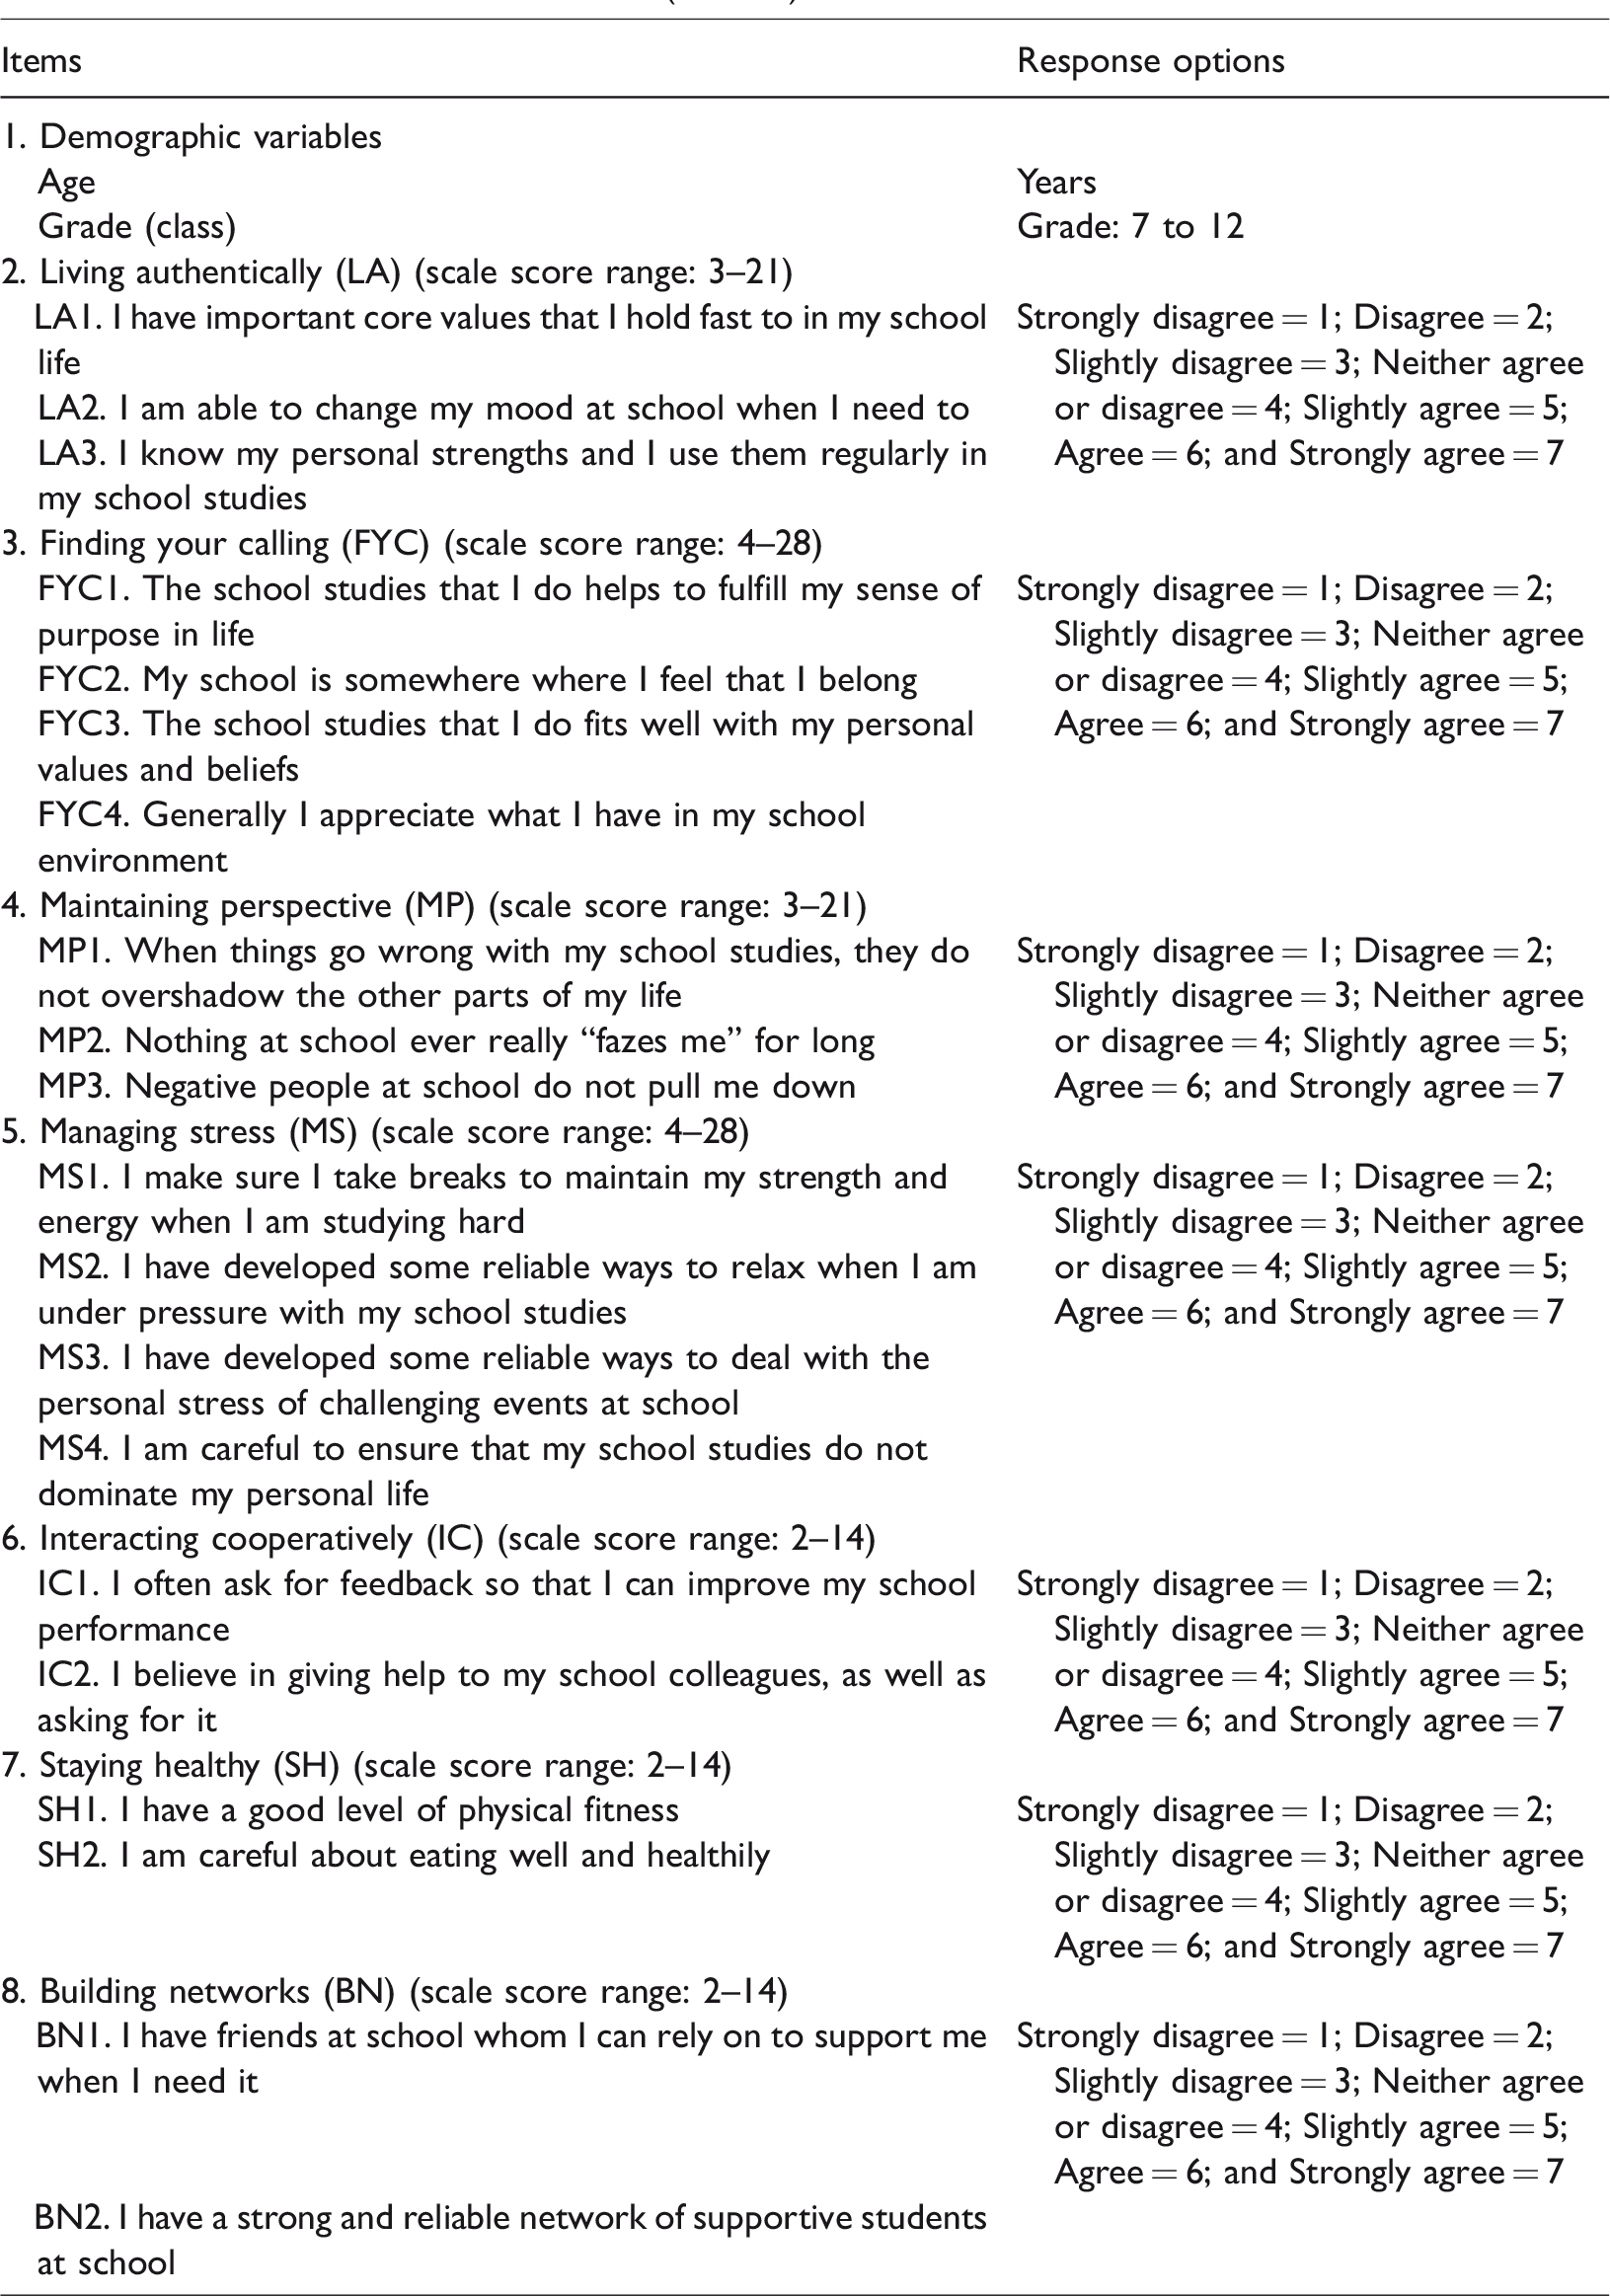
The seven factors and 20 items drawn from Winwood et al. (2013) upon which the development of the RAU measure is based, are described as:
Finding your calling (FYC): undertaking a program of study that is aligned with career focus and goals and knowing that the subject content being learned will be applicable in the workplace (four items). Maintaining perspective (MP): capacity to reframe setbacks, maintain a solution focus, and manage negativity (three items). Building networks (BN): developing and maintaining personal support networks both within and outside the university (two items). Managing stress (MS): routines that help manage everyday stressors, maintain study–life balance, and ensure time for relaxation (four items). Living authentically (LA): knowing and holding onto personal values, using personal strengths, and having a good level of emotional awareness and regulation (three items). Interacting cooperatively (IC): seeking feedback, advice, and support as well as providing support to others (two items). Staying healthy (SH): maintaining a good level of physical fitness and a healthy diet (two items).
In the adaption of the measure for a secondary school population, items were modified so that the word “university” was substituted with “school”, and “career” was substituted for “life”. All 20 items drawn from Winwood et al. (2013) included in the initial testing of the RAU (Turner, Holdsworth et al., 2017) were retained for analysis with the secondary school population. Participants were asked to indicate their agreement with the items on a seven-point Likert scale from ‘strongly disagree’ (1) to ‘strongly agree’ (7). The structure of the questionnaire is shown in Table 1. The RAU scale provides a summative score and subscale scores. In all instances, higher scores indicate higher levels of the attribute of interest. Full details pertaining to the scale items within each of the seven constructs are given in Table 1.
Items for variables and subscales (n = 562).
Three variables were included in the instrument alongside the adapted items, to enable the face validity of the resilience scale to be explored. These were support from family members (‘I have family whom I can rely on to support me when I need it’); sleep sufficiency (‘I make sure I get enough sleep’); and support from friends outside of school (‘I have a strong and reliable network of supportive friends outside school’). Based on the literature, it was hypothesized a priori that a positive association would exist between each of the seven constructs and the three test variables described above. In essence, students experiencing support from family members (Masten, 2018), getting sufficient sleep (Chatburn, Coussens, & Kohler, 2013; Silk et al., 2007), and being supported by a network of friends outside of school (Graber, Turner, & Madill, 2016; van Harmelen et al., 2017), would be more likely to report living authentically, finding their calling, maintaining perspective, managing stress, interacting cooperatively, staying healthy, and building networks, than would their counterparts – in essence, reflecting resilience.
The instrument, consisting of the 20-item resilience measure and the three test variables, was administered to participants through an online survey delivered to students via email. During class, teachers referred to the survey and encouraged students to participate, and also reiterated that completion of the survey was both anonymous and confidential.
Data analysis
There were no missing data and no anomalies were apparent. Using IBM SPSS (IBM Corporation, 2013a) a variety of descriptive and bivariate statistical analyses was performed. To verify the factorial structure of all measured variables, confirmatory factor analysis (CFA) using structural equation modeling (SEM) was performed using IBM AMOS Version 24.0 for Windows (IBM Corporation, 2013b). Given the categorical nature of the data, Bayesian estimation (the methodological approach available within AMOS for analyzing categorical data using the Markov Chain Monte Carlo (MCMC) algorithm) was used to compare the parameter estimates derived from both the ML and Bayesian approaches (Byrne, 2010). Sampling convergence was deemed to have occurred when the convergence statistic was less than 1.002 (Arbuckle, 2013). The sample size was sufficient for CFA (Brown, 2006). Modification indices, available within AMOS, guided the model revision process.
Six critical model fit indices were applied to determine the degree of fit as follows: χ2/df ratio (less than 4); Bollen’s incremental fit index (IFI) (.95 and greater); the Tucker Lewis TLI (non-normed fit index (.95 and greater)); Bentler CFI (comparative fit index (.95 and greater)); RMSEA (root mean square error of approximation (.05 and less)); and Hoelter (critical N (CN) index (200 and greater)). A factor loading of .5 is minimally accepted and a loading of .7 is considered satisfactory. Model improvements were tested using the Chi-Square Difference Test (Tabachnick & Fidell, 2013). Once the factorial structure had been validated, unweighted scale scores were created by summating the scores of their respective constituent items.
After the factorial structure was confirmed, the internal consistency of the scales and convergent validity of the measurement model were assessed. Cronbach’s alpha was calculated to assess the internal consistency of each scale, with alpha >.7 considered acceptable (Hair, Black, Rabin, & Anderson, 2014).
Convergent validity at scale level was assessed using three variables – support from family members, sleep sufficiency and support from friends outside of school. These variables were selected on the basis of their face validity (Ursachi, Horodnic, & Zait, 2015), i.e. when the content of the research is related to the studied variables in terms of logic.
If the relationships between the rationalization scores and the empirically-related variables discussed above are confirmed, then the test of the convergent validity of the scale would be satisfied (Cronbach & Meehl, 1955). Pearson correlation coefficients (for continuous variables) were used to assess convergent validity.
Results
Correlation analysis
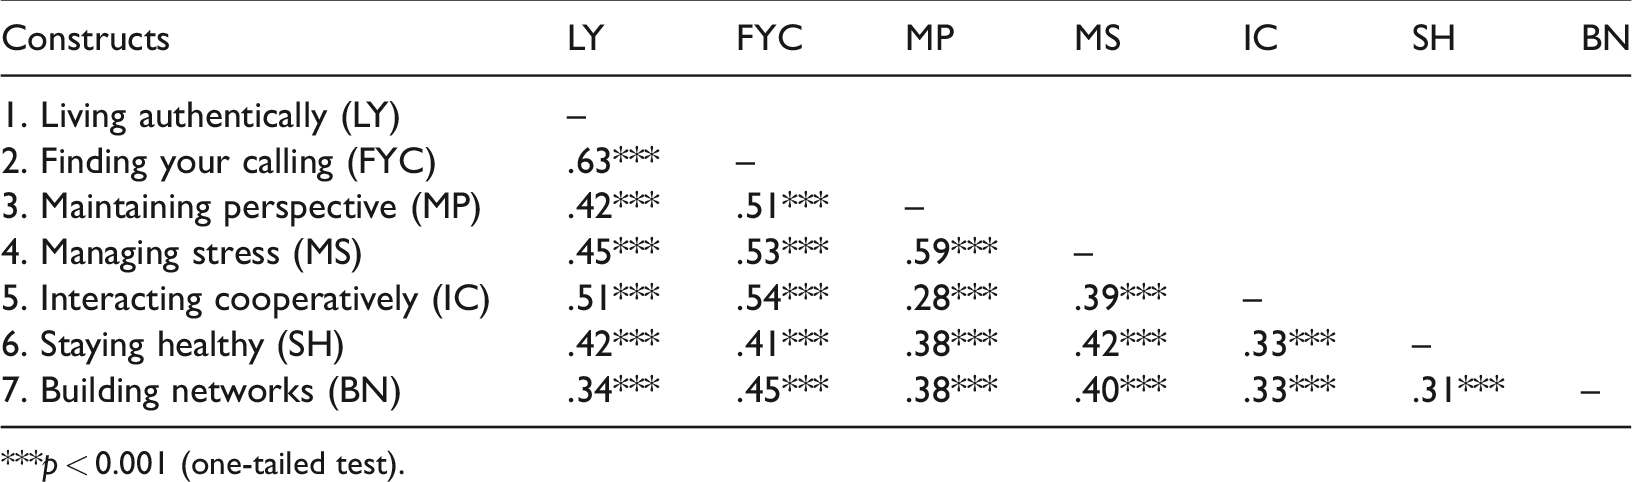
Table 2 reports the correlations (one-tailed tests) between the seven constructs of interest. All of the correlations were significant, p < .001 (one-tailed).
Correlations between the seven constructs (n = 562).
***p < 0.001 (one-tailed test).
The magnitude of the relationships varied between small (.10 to .29), medium (.30 to .49), and large (≥.50) (Cohen, 1988). Notably, large associations were found between LA and each of FYC and IC; between FYC and each of MP, MS, and IC; and between MP and MS. All other associations were medium, except between MP and IC, which was small. As hypothesized a priori, the directions of the relationships were positive in all instances. In terms of shared variance (r2), LA explained 39.9% of the variance in FYC and 25.8% of the variance in IC. FYC explained 25.5%, 27.9%, and 28.8% of the variance in MP, MS, and IC, respectively. MP explained 34.9% of the variance in MS. The significance, strength and direction of these correlations align closely to those reported by Turner, Holdsworth et al. (2017).
Confirmatory factor analysis
A measurement model based on the seven factors (20-items) employed by Turner, Holdsworth et al. (2017) was specified and tested. Output indices for the CFA model indicated a satisfactory fit to the data (χ2/df ratio = 2.572, IFI = .942, CFI = .942, RMSEA = .052, CI 95% (.046–.059), and Hoelter (95%) = 262). All factor loadings were statistically significant (p < .001). The modification indices indicated cross-loading between one item (MS14) (‘I am careful to ensure that my school work does not dominate my personal life’) from the MS factor and the MP construct. This item (MS14) was removed from the MS factor, which is consistent with Turner, Holdsworth et al. (2017) who also removed the item from the RAU due to cross-loading.
With this item removed, the resultant model presented a very good fit to the data (χ2/df ratio = 2.221, IFI = .957, CFI = .957, RMSEA = .047, CI 95% (.039 - .054), and Hoelter (95%)=306), with all factor loadings statistically significant (p < .001). The Chi-Square Difference Test revealed that this model was a significant improvement on the previous model [(Δχ2(18) = 92.191, p < .001), indicating that the exclusion of this item substantively enhanced the model. No further modifications were necessary.
Bayesian estimation was employed to compare the parameter estimates for this model derived from both the ML and Bayesian approaches. The convergence statistic cutpoint was 1.0014. The parameter estimates were very close to each other, r =1.00, n = 12, p < .001 (1-tailed). Inspection of the Bayesian SEM diagnostic first and last combined polygon plot for each item indicated that AMOS successfully identified salient features of the posterior distribution for each item. The Bayesian SEM diagnostic trace plots indicated convergence in distribution occurred rapidly, a clear indicator that the SEM model was specified correctly (Byrne, 2010).
Mplus version 8.2 (Muthén & Muthén, 1998–2012) using the WLSMV estimator to account for the ordinal nature of the items was used to confirm the dimensionality of the final model. Fit of the CFA model was assessed using the χ2 for exact fit and standardized root mean squared residual (SRMR). Additionally, local fit was inspected via residual correlations, with absolute residual correlations above .2 being flagged as potentially problematic (Morizot, Ainsworth, & Reise, 2007). The CFA showed approximate model fit of the seven-dimensional model, χ2WLSMV(131) = 416.10, p < .001, SRMR = .032. None of the 253 absolute residual correlations was greater than 0.2; local fit was deemed acceptable. In addition, estimation using MLR resulted in the same conclusions regarding fit as did the WLSMV results. The dimensionality of the model was deemed tenable.
Internal consistency
The internal consistency of the seven scales as modified in the CFA was assessed using Cronbach’s alpha. The analysis indicated poor-to-good internal consistency: LA (3-items) (α = .61), FYC (4-items) (α = .77), MP (3-items) (α = .73), MS (revised) (3-items) (α = .77), IC (2-items) (α = .51), SH (2-items) (α = .70), and BN (2-items) (α = .85). For the FYC, MS, SH, and BN scales, the corrected item-total correlation values exceeded .50 (indicative of very good discrimination). This was not the case for the LA and IC scales, where all items in each scale were below .50 – indicative of weak discrimination. The MP scale was marginal, with two of the three values above .50 but the third marginally below, r = .49. In essence, the LA and IC scales were each problematic in terms of both obtained alpha values and corrected item-total correlations.
The LA scale contained three items and seven response options. All three items were significantly positively correlated (p < .001) (one-tailed). The IC scale contained two items and seven response options, with both items significantly positively correlated (one-tailed). Inter-item correlation magnitude was medium (r = .30 to .49) for both scales, except in the case of the correlation between LAq1 (‘I have important core values that I hold fast to in my school life’) and LAq2 (‘I am able to change my mood when I need to’), where it was small (r = .26). Low correlation between items, shorter tests, and fewer response options are associated with lower internal consistency (alpha) (Tavakol & Dennick, 2011). Future research would usefully be directed at incorporating more suitable items in these two scales.
Two of the seven scales indicated an improvement, albeit marginal, in internal consistency occasioned by the removal of one or more items from that scale. The removal of LAq1 (‘I have important core values that I hold fast to in my school life’) from the LA scale would raise the alpha value from .609 to .614. Similarly, the removal of MSq11 (‘I make sure I take breaks to maintain my strength and energy when I am working hard at school’) from the MS scale would raise the alpha value from .772 to .778. Given the marginal nature of the improvement in alpha occasioned by the omission of these items, together with the shortness of the tests, they were retained.
The length of these scales should be taken into consideration when interpreting the above results. To increase alpha, more related items testing the same concept should be added to the test, but that was not possible in this study.
Convergent validity
The CFA indicated that the final measurement model described above is a very good fit to the data. The model demonstrates construct validity at an item level. This model comprises 19 items with a 7-factor structure. As outlined above, three variables were used to assess convergent validity, namely, support from family members; sleep sufficiency; and support from friends outside of school. The associations between these three variables themselves were positive and significant (p < .001, one-tailed). The magnitude of the relationships varied between small and medium.
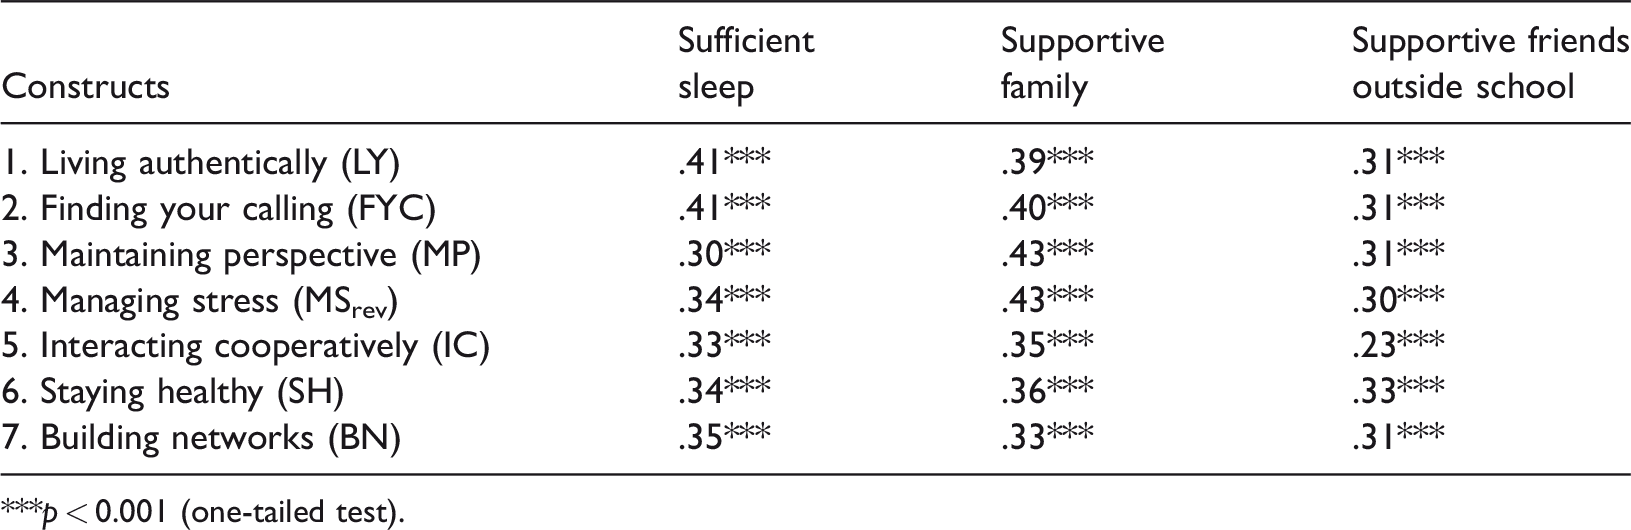
The results of the validity tests at a scale level are described below. The relevant correlation coefficients (one-tailed tests), together with their respective significance and strength of the relationships, are presented in Table 3.
Correlations between the test variables and the seven constructs (n = 562).
***p < 0.001 (one-tailed test).
All three test variables were significantly positively associated with the seven constructs, p < .001. The magnitude of the association between reliable family support when needed, sleep sufficiency, and a reliable network of supportive friends outside of school, and each of the seven constructs was medium, with the notable exception of the association between supportive family and MP, and between a supportive network of friends outside of school and IC, where it was small.
Discussion and implications for practice
The aim of our study was to examine the psychometric properties of a resilience at secondary school (RASS) scale based on the RAU scale developed by Turner, Holdsworth et al. (2017). The CFA verified the factorial structure of the set of 19 items loading onto a 7-factor structure, confirming the hypothesized relationships between the observed variables and their underlying latent constructs. The exclusion of one item from the ‘managing stress’ factor (‘I am careful to ensure that my school studies does not dominate my personal life’) (q14) was consistent with previous studies (Turner, Holdsworth et al., 2017). The subscales demonstrated very good model fit and all factor loadings were significant. There was supportive evidence indicating the convergent validity of the scales, but evidence confirming the internal consistency of the subscales was more equivocal. While the CFA confirms the validity of the seven-factor structure, the Cronbach’s alpha indicates issues within two of the seven subscales, namely, ‘living authentically’ and ‘interacting cooperatively’, and possibly ‘maintaining perspective’. Further testing is recommended to clarify the internal consistency of these subscales using new items which represent the subscales in question. It is imperative that new items are contextually relevant to the target population. To assess the suitability of new items, it is recommended that focus groups with both male and female school students would be beneficial.
Our study supports the development of resilience for secondary school students aged from 11 to 18 years. Importantly, pending further development, it equips educators with a framework which is premised on the contention that resilience is a capacity which can be nurtured through development of specific skills and behaviours. The resilience development approach sits alongside a risk reduction approach whereby the school can seek to remove or minimise factors or processes which are considered harmful (Olson et al., 2003). Such a two-pronged approach recognizes the interplay between the student and his/her school environment.
Administration and scoring of the RASS is straightforward, and the seven elements of the RASS are designed to be “practical”. Using an explicit approach to resilience development, the RASS scale can be completed by students as part of a classroom activity to raise awareness of resilience and the various elements associated with “being” resilient. This “self-development” activity can build knowledge about the actions, skills and behaviours which can be practiced both within and outside of the school environment. Such an approach may open up or continue a dialogue about adolescent health, wellbeing, and managing stress.
In conjunction with administering the RASS to students using an explicit approach to resilience development, educators may also implicitly embed strategies, activities, and information which are aligned with the RASS into the curriculum. For example, one of the elements of the RASS is “maintaining perspective”, described as the ability to reframe setbacks, maintain a solution focus, and manage negativity. Educators may implicitly support the development of this element through activities which require self-reflection and self-assessment. Another example is the “managing stress” element, described as utilising routines which help to manage everyday stressors, maintain study–life balance, and ensure time for relaxation. Educators can implicitly support this element through activities which teach students how to plan their time, prioritise activities, and overcome procrastination. Two papers which educators may find useful is Holdsworth et al. (2018) and Turner and Simmons (2019). These papers outline strategies which educators may consider utilising to support resilience development according to the seven elements of resilience.
Pending further development of the RASS to establish robust psychometric properties, it is also possible that the RASS may be used in evaluation programs designed to review the effectiveness of resilience-building strategies at school through the use of pre- and post-measures of resilience.
Limitations
This study has several limitations. The gender-specific nature of the study limits generalization to the general secondary school population. However, given the similarity of state secondary school structures, curricula, and extra-mural activities within Australia, our findings would likely be applicable beyond learners at the participating school. We acknowledge the potential bias inherent in the self-reporting nature of the survey, and that there can be no absolute claim to complete representivity. However, we do not believe respondent bias is a serious concern. The survey was cross-sectional in nature; hence, test-retest reliability could not be investigated. Similarly, given the small number of items per scale, split-half reliability could not be assessed. While internal consistency is recognized as an important aspect of scalar psychometric integrity, it is acknowledged that the test for scale reliability is incomplete without at least another form of reliability testing, preferably test-retest reliability. It is acknowledged that age and maturity may be a differentiating factor in any assessment of bias, but such an investigation was beyond the scope of this study.
Despite the limitations identified through this study, and subject to the caveats raised above, it is argued that the RASS scale and subscales evaluated here represent a promising empirical measure of resilience at secondary schools in Australia. While further scale development is required to ensure that the RASS is a reliable and valid measure, the study supports the call to use more contextually-relevant measures of resilience (Robertson et al., 2015) which are practical and allow results to be translated into the settings for which they are intended (Winwood et al., 2013).
Footnotes
Declaration of Conflicting Interests
The author(s) declared no potential conflicts of interest with respect to the research, authorship, and/or publication of this article.
Funding
The author(s) received no financial support for the research, authorship, and/or publication of this article.