
Abstract
Students who can regulate their own learning are proposed to gain the most out of education, yet research into the impact of self-regulated learning skills on performance shows mixed results. This study supports the link between self-regulated learning and performance, while providing evidence of grade- or age-related differences. Australian students from Grades 5 to 8 completed mathematics or reading comprehension assessments and self-regulated learning questionnaires, with each response ranked on a hierarchy of quality. All assessments were psychometrically analysed and validated. In each cohort and overall, higher performing students reported higher levels of self-regulated learning. Still, age-related differences outweighed performance differences, resulting in significantly lower reported usage of self-regulated learning skills in Grade 7 students compared to those in Grades 5, 6 and 8. These findings suggest that either age or school organisational differences mediate students’ self-regulated learning, counteracting ability-related associations.
Introduction
Self-regulated learning (SRL) is the process whereby learners monitor and regulate their internal abilities and responses against internal and external environments using self-awareness and self-reflection (Boekaerts & Corno, 2005; Pintrich, 2004; Zimmerman, 2002; Zimmerman & Schunk, 1989). Students who have developed advanced SRL skills use metacognition, motivation and self-efficacy to modify their behaviour to reach a desired learning goal, outcome or process. Those students who can regulate their learning are proposed to gain the most out of education because their actions are motivated by learning rather than external rewards. Research has found a positive relationship between intervention studies aimed at fostering SRL skills and academic performance in both primary and secondary schools (reviewed in Dignath & Buttner, 2018). However, studies showing links between SRL behaviours and academic achievement or student intelligence have found a variety of relationships, depending on the SRL measurement and the classroom/schooling context, and in some cases, no relationship.
This study compared student SRL use across Grades 5–8 and correlated self-reported SRL behaviour with mathematics and reading comprehension achievement measures.
Measurement of SRL
Multiple models are used to describe SRL processes or skills, most of which are cyclical in nature and include a goals/forethought/intention/preparation phase, an action phase (strategy use, performance) and a reflection/monitoring of progress/self-judgment/appraisal phase. The most well-known and used SRL models were reviewed by Panadero (2017) and include those published by (in order of total citations) Zimmerman (2000), Pintrich (2000), Winne and Hadwin (1998), Boekaerts and Corno (2005) and Efklides (2011). The exact model utilized for designing SRL-based interventions, teaching activities or student learning resources will differ depending on the institute preparing the professional development or undertaking the study. Similarly, the exact ‘skills’ involved when assessing SRL will differ between researchers, depending on the model of SRL to which they subscribe and the purpose for which they assess such skills. Most researchers split the SRL domain into various components for assessment purposes, comparing student performance on each strand as separate latent variables, for example, self-efficacy or metacognitive monitoring. In this way, researchers can compare the SRL skills of different cohorts of students – such as those who have completed an intervention program – on different components of SRL. Such studies provide rich detail of the differences between components of SRL. A limitation of separately assessing specific components of SRL and correlating these with student academic performance, age or other independent variables is that the overall impact of SRL, and how behaviours vary across grade levels, may be missed.
In this study, the skills involved in SRL were assessed according to Zimmerman’s (2000) framework but different strands of SRL were not assessed separately. Instead, SRL was considered to be one latent variable that could be mapped to the extent that students would display lower or higher levels of SRL based on their learning behaviours and motivations. It was hypothesized that the skills related to SRL were not independent of each other and existed together to form a common construct, whereby students who had higher levels of demonstrable SRL behaviours in one component would largely be able to demonstrate high levels of behaviours in another. The intention was to create one comprehensive measure of SRL that was not based on students’ content ability, but rather measured students’ ability to regulate their own learning regarding metacognitive and motivational aspects. Using this measure, comparisons were made between high performing students and age-matched peers, and between students of differing grade levels across schooling types.
Despite the growing field of literature on SRL in different school contexts, there is a lack of research using the same measure of SRL across contexts. While reviews such as Moos and Ringal (2012) and Panadero (2017) synthesized the literature and concluded that primary teachers implement more SRL practices than secondary teachers, these studies do not appear to be based on the same measure of SRL, and their results are not connected to student SRL use or achievement using the same tool. Previous studies support the findings in this article that secondary students report fewer SRL behaviours than primary students. In this article, however, the same method of measurement is utilized for both school contexts, and results are therefore directly compared across grade cohorts.
Relationships between self-regulation and achievement measures
Numerous studies have looked at connections between SRL and achievement, with varying results. In Estonia, a longitudinal study of Grades 1, 2, and 3 students demonstrated that the development of cognitive and behavioural aspects of SRL varies across individuals and differs over time in relation to mathematics and reading skills (Mägi, Männamaa, & Kikas, 2016). The authors found that Grade 3 students with higher phonemic awareness, listening comprehension, number sequences and problem-solving skills also displayed higher SRL skills. In contrast, in a comparison of high- and low-achieving students on variables related to SRL in an undergraduate psychology course, self-reported SRL skills did not align with measures of achievement, and there were no initial differences in self-efficacy among students (DiFrancesca, Nietfeld, & Cao, 2016).
Many other SRL measures have been linked to academic achievement; often, however, these measures are based on specific elements of SRL that would certainly be correlated with performance. For example, a review and meta-analysis of over 200 studies (Richardson, Abraham, & Bond, 2012) found that a student’s self-efficacy is the highest predictor of performance. Similarly, Robbins et al. (2004) found achievement motivation and academic self-efficacy to be predictors of high student grade point average.
A study by Ziegler and Stoeger (2010) reported that Grade 4 pupils with differing cognitive abilities benefited similarly from an SRL training program, indicating a relationship between academic achievement and some elements of SRL. The authors divided students into four quartiles based on intelligence and compared the effectiveness of training for each cognitive grouping. Except for the variables self-reflection of own learning and willingness to exert effort, all pupils, independent of their intelligence, profited from the SRL training. There were no correlations between the performance measures (Raven’s progressive matrices test) and self-regulation measures at the time of the pretest (Ziegler & Stoeger, 2010). Further studies (Sontag & Stoeger, 2015) investigated differences in preference for using SRL for the top 10% of students based on intelligence and the top 10% based on achievement (grades) compared with the bottom 90%, respectively. The focus of the study was the result of an intervention program that encouraged preference for SRL behaviours over externally regulated learning or impulsive learning. A trend emerged between students of higher intelligence and higher academic performance on increased preference towards SRL from Week 1 of the training program, but ‘highly intelligent students’ baseline value in SRL [did] not exceed their peers’ baseline value’ (Sontag & Stoeger, 2015, p. 51), indicating that, in this study, intelligence and SRL preference in Grade 4 students were not initially correlated. The study showed that the intervention program improved the preference for SRL in all groups (top 10% and bottom 90%, intelligence and performance); however, due to very low sample numbers in the top 10% groups (n = 13 and n = 11 in the intelligence and performance groups respectively), results are difficult to interpret.
Other studies give mixed messages on the link between academic performance and use of SRL. Sontag, Stoeger, and Harder (2012) indicated that highly intelligent Grade 4 students (top 5%) did not prefer SRL more than their classroom peers of lower intelligence. Further, in unchallenging contexts, SRL is not necessary for students to obtain high achievement (Stoeger, Steinbach, Obergriesser, & Matthes, 2014). Earlier studies suggested that SRL strategies are not necessary for high achievement. For example, Ablard and Lipschultz (1998) argued that the large variation in SRL strategy use found in high-performing Year 7 students (top 97%) indicates that advanced reasoning is not related to SRL. A limitation of this study is that as all participants were high performers, the link between SRL and performance may be too nuanced to measure.
Differences in self-regulation among students
Of the vast number of studies on SRL, very few cover differences in SRL use across different school contexts or grade levels. An early seminal study by Zimmerman and Martinez-Pons (1990) compared verbal efficacy, mathematical efficacy and SRL strategy use between 30 gifted and 30 regular Grades 5, 8, and 11 students. They found that the Grade 11 students surpassed the Grade 8 students who in turn surpassed the Grade 5 students on all three measures; however, the authors claimed that the results for self-regulated strategy use ‘proved to be more complex than anticipated’ (p. 57). The measurements used for self-efficacy were related to academic efficacy, where students were asked to rate their capacity to solve 10 mathematics problems or define 10 specific words, respectively. Self-efficacy was therefore related to student ability, which increased with age in a consistent manner as predicted. In contrast, SRL strategy use did not form a similar consistent pattern of increase over grades, suggesting that this variable should be further investigated.
Recent studies (Dignath & Buttner, 2018; authors’ unpublished findings) have shown that secondary teachers do not explicitly teach students SRL metacognitive strategies to the same extent as primary school teachers do. These studies suggest there may be differences in students’ use of SRL skills between grades; however, as yet, no empirical studies support this.
The present study
Many studies have focused on the link between SRL and achievement. This study, however, examined this link using consistent measurement tools across grades and schooling types. The current study was aimed at providing empirical evidence to support or reject current synthesized research that suggests a decrease in SRL behaviours over the duration of secondary schooling (Panadero, 2017) and to investigate the hypothesis that use of SRL predicts achievement.
The SRL measurement tool was based on the theoretical perspective that SRL skills function together as a cohesive unidimensional construct, where students who are able to regulate their own learning display high-order SRL behaviours, and those who are not regulating their behaviour display low-order SRL behaviours. Thus, a proposed unity could be observed in the construct, with a theoretical assumption that behaviours would conform to an ordered series which would be definable and measurable. The tool was intended to be intelligence independent; that is, not affected by the responder’s intellectual capability or performance on any cognitive-based task. Care was therefore taken to remove all aspects of SRL that may be completely explained by achievement, cognitive ability or intelligence. For example, self-efficacy is the belief in one’s ability to succeed; however, it is true that high-performing students have a greater likelihood of performing well. Therefore, items favouring high achievers such as ‘I believe I am able to answer questions correctly on tests for this subject’ were deemed inappropriate for this kind of study, as responses would almost certainly correlate with increased performance on a cognitive assessment. Instead, items such as ‘Do you care whether you have learnt anything from a task?’ were constructed. This type of SRL motivational aspect may not necessarily be linked with performance. This was an important research design and assessment decision as ‘Although there are many types of cognitive ability tests of individual differences, they almost all correlate substantially and positively; people with higher ability on one cognitive task tend to higher ability on all of the others’ (Plomin & Deary, 2015, p. 99). The intention was to use one comprehensive measure of SRL that was not based on students’ content ability, but rather measured students’ application of SRL behaviours. Using this measure, comparisons were made between high performing students and grade-matched peers to answer the research questions.
Given the nature of this research, another important measurement consideration was the achievement tests themselves. Other studies have used student grades or rankings, teacher scores or specifically designed tests for the research year. These may differ over different contexts, making comparison across year levels impossible or inaccurate, which may in part explain the absence of studies crossing student year levels and schooling types. In the present study, the same series of Rasch-based assessments were utilized to test students’ competency in mathematics or in reading comprehension across Grades 5, 6, 7, and 8. The assessments formed part of the same competency-based scale that mapped students’ zone of proximal development (ZPD) based on their responses to one of a series of 40-item multiple-choice tests that were suitable for assessing students from Grades 1 to 10. In this way, students’ ability estimates could be calculated across schooling types and grade levels to compare with SRL practices.
With consistent and accurate measurement approaches across both content areas and SRL skills relevant and suitable for Grades 5–8 students, the following research questions related to the relationship between SRL use and student performance were posed.
Research questions
RQ1. Do SRL behaviours predict academic performance?
RQ2. Are there differences in the use of SRL behaviours across grade levels 5, 6, 7, and 8?
Importantly, this study, like others of its kind, could not determine the direction of the relationship between academic performance and SRL. The analysis performed was directional to support or reject the contention that SRL behaviours predict academic performance, as stated in RQ1. However, as the correlational nature of the data cannot determine causality, the question could have been constructed alternatively as Does academic performance predict SRL behaviour?
Method
Participants
Students in Grades 5, 6, 7, or 8 attending 42 ‘typical’ public schools in Victoria, Australia participated in the current study. The students attended schools that participated in an Australian Research Council Linkage project ‘Realising the Potential of Australia’s High Capacity Students’ (REAP). Participants were heterogeneous and included all students of classes whose teachers selected to join the research project. While 4232 students completed the SRL questionnaire, not all of these students had assessment results or valid assessment results as teachers were tasked with targeting the content assessments. Numbers of students from each grade for whom data were available for both content assessment and SRL questionnaire are presented in Table 1.
Student numbers per grade by subject area.
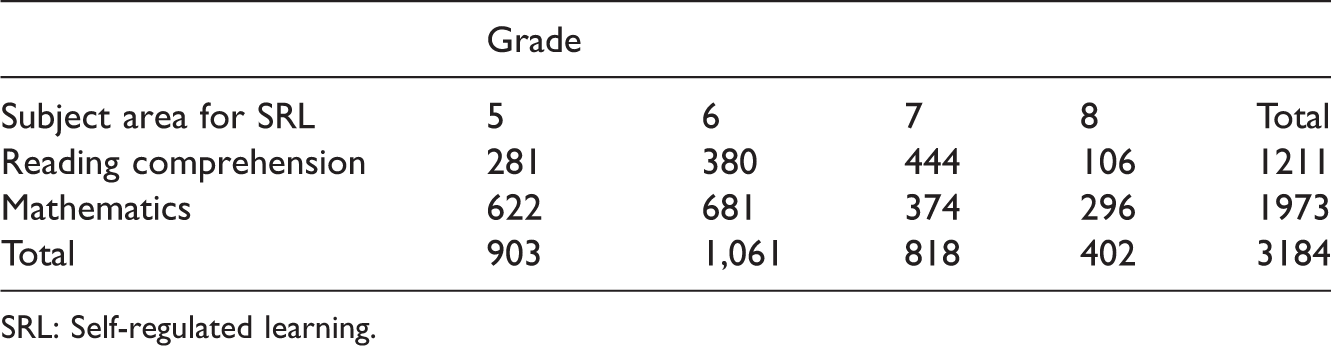
SRL: Self-regulated learning.
Instruments
SRL assessment
To measure SRL behaviours in terms of levels of quality for each student, students completed an online self-report questionnaire, facilitated by the teacher of the class. The SRL questionnaire was based on the phases and elements described by Zimmerman and Campillo (2003). Capabilities suggested by Zimmerman and Campillo (2003) to support SRL were used to design 27 items asking students to report what they would do in specific learning circumstances. Response options were coded from 0 to 3, 4 or 5 on a hierarchical scale (see further explanations below). A schematic of the construct used for item design is presented in Figure 1. The test blueprint framework used the approach created by Griffin (2007) and explained in Griffin (2014, p.21) to collect evidence of student behaviour based on what a student can ‘do, make, say or write’.
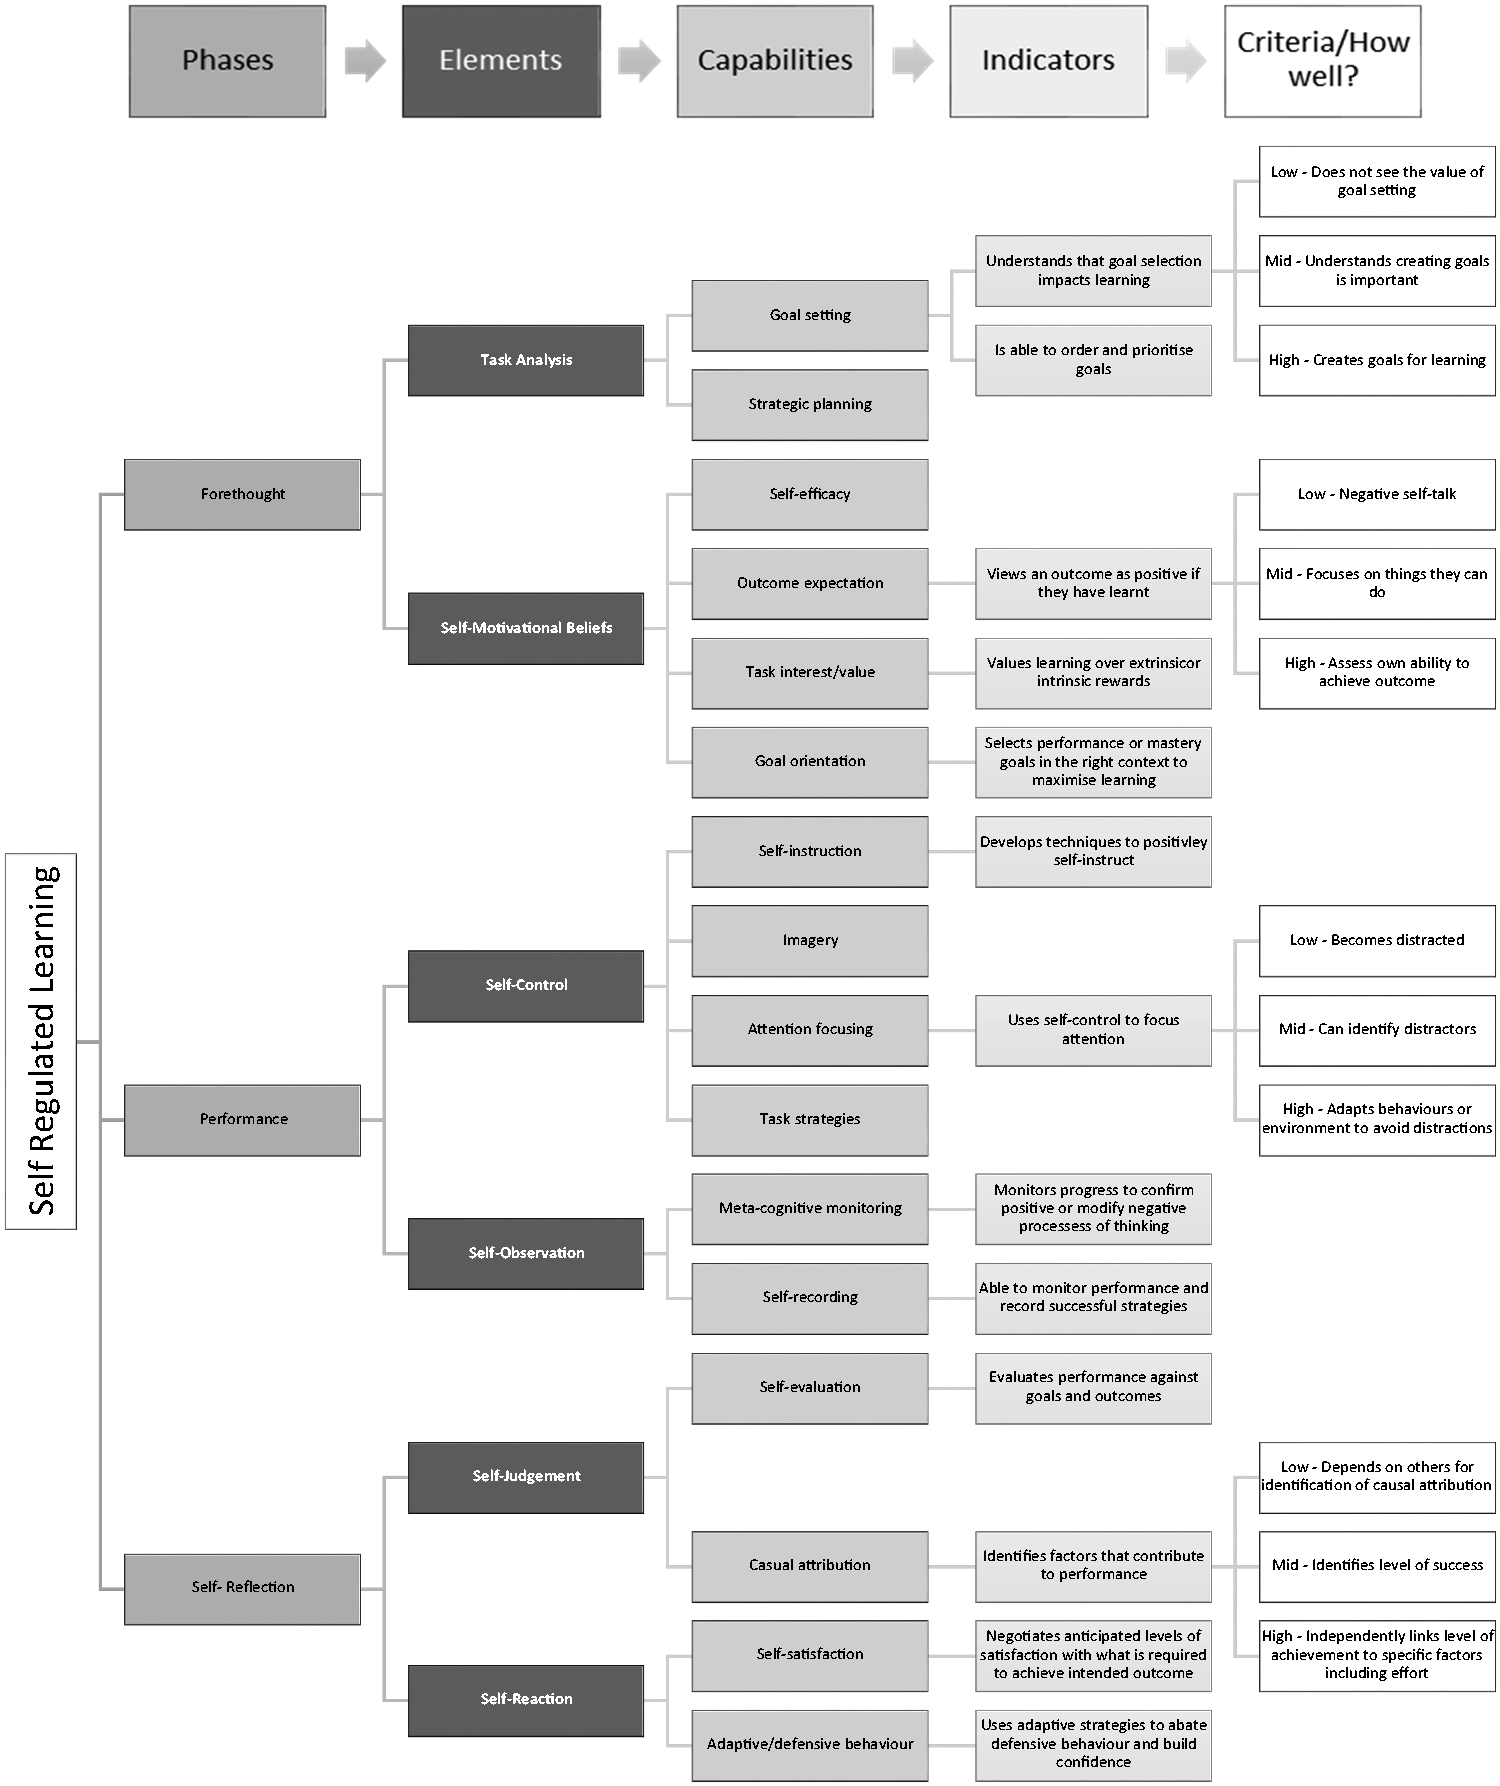
Schematic of SRL construct used for item design based on Zimmerman and Campillo’s (2003) SRL model and Griffin’s (2007) approach to item design. Only some indicators and quality criteria are listed due to space restraints.
During initial workshops with teachers, students’ behaviours in terms of each capability were ordered low, medium or high to create a theoretical construct underpinning students’ skill. Students were mapped from low to high according to their SRL behaviours and motivations (refer to criteria listed in Figure 1). Items were created to reflect the quality criteria in language suitable for 10- to 14-year-old students. Coding for the hierarchical scale of the responses was based on the theoretical frameworks described by Krathwohl, Bloom, and Masia, (1964), Dreyfus and Dreyfus (1980) or Bloom (1984), with a ‘motivation for learning hierarchy’ (authors own as referred to in Figure 2) used for some items. Each item was written based on levels of skill from one of these taxonomies in conjunction with the teacher-collected data.
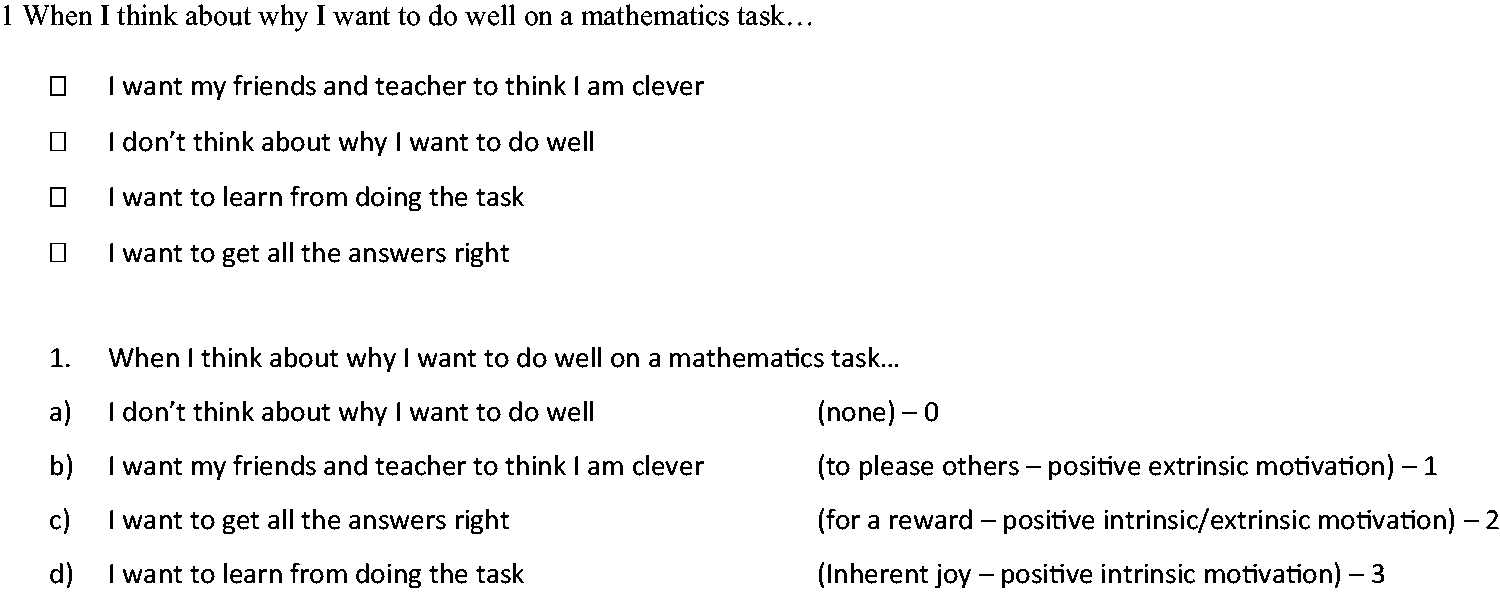
Example item from SRL questionnaire. The top item is in the format as presented to the student. The student clicks on the response that best matches ‘what you are most likely to do in class’. The lower item format is ordered in terms of the motivational hierarchy. Item response codes range from 0 to 3.
Krathwohl’s taxonomy of affective learning encompasses receiving, responding, valuing, organization and characterization (Krathwohl, Bloom, & Masia, 1964). The affective domain describes learning objectives that vary from simple attention (receiving) to complex but internally consistent qualities of character and conscience, where characterization by value set indicates that the student acts consistently in accordance with the values he or she has internalized. Items coded using this taxonomy include those regarding how students respond to and use feedback.
The Dreyfus (Dreyfus & Dreyfus, 1980) model of skill acquisition is based on a five-stage hierarchy of novice (rules), advanced beginner (routine), competent (guidelines), proficient (principles) and expert (intuitive). The Dreyfus taxonomy was used to code items that involved how students completed classroom tasks.
Bloom’s (1984) taxonomy of learning was based on the levels of knowledge, comprehension, application, analysis, synthesis and evaluation. Bloom’s hierarchy was used to create response categories for items involving learning strategy use or imagery.
The motivation for learning hierarchy stems from research on intrinsic and extrinsic motivation and is based on the work of Ryan and Deci (2000). The stages of the taxonomy include lack of motivation, extrinsic motivation to please others, intrinsic and extrinsic motivation to gain a ‘reward’, or true intrinsic motivation to learn. This taxonomy was utilized for items regarding self-motivational beliefs such as outcome expectations and task interest/valuing. An example of the use of this taxonomy is shown in Figure 2.
Depending on the item, the relevant taxonomy was applied to create a hierarchy of the response order based on the stem of the item. Importantly, item responses were not presented in hierarchical order for the students, so they could not deduce the pattern of the “correct” or best response to select (for an example, refer to Figure 2). Students did not know which response they were ‘supposed’ to select. Instead, they selected which response best fit them as a learner, creating a non-biased response pattern.
Separate SRL questionnaires were constructed for mathematics and for reading, the only difference being the use of the term ‘mathematics’ or ‘reading’ in the stem of each question (e.g. ‘When completing a mathematics task …’ and ‘When completing a reading task …’). Analysis of the results revealed that items in both questionnaire types followed the same order of difficulty; thus, there were no psychometric differences between the instruments. Consequentially, no separate SRL scales for reading or for mathematics had to be developed. SRL ability estimates calculated from responses to the mathematics SRL questionnaire were compared with students’ mathematics content ability estimates, and likewise for reading estimates.
As many of the capabilities in the SRL construct speak to students’ intrinsic motivation or inner monologue (see again e.g. Figure 2), it was decided that a self-report was the preferred way to measure students’ SRL ability. Cog labs of students during the piloting process of the questionnaire indicated that students in the age range 9 to 12 were exceptionally honest, many willingly choosing the lowest response option even when negative language was used (e.g. ‘I don’t care about learning’). The questionnaire was administered online by the regular classroom teacher, and students were not aware there would be any report or record based on their responses. The questionnaire was titled Student Questionnaire, so it is likely that the students did not know their learning behaviours and motivations were being analysed.
Validation of the SRL instrument used in this study followed Wolfe and Smith’s (2007) instrument design and validation protocols. The validation of the instrument is supported throughout the design process using a series of activities that ‘facilitate the development of evidence arguments’ (Wolfe & Smith, 2007b, p. 243). Steps to building an argument for validity were incorporated throughout the processes of identifying and defining the construct, item specification and item analysis. Evidence of content validity was gathered throughout the process using data gathered from workshops with teachers, expert reviewers in the field of SRL and cognitive laboratories with students. Item calibration and instrument reliability support an argument for construct and criterion validity which will be discussed in the section on item analysis. Arguments for evidence of consequential validity are presented in this article whereby students who score high in the measure of SRL also score high on the achievement tests and a standard setting process drawing on subject matter experts once again. Ongoing efforts to gather further evidence to support claims of validity for the measure are continuing through research that has been funded by an Australian Research Council discovery project grant.
Content assessments
To investigate the relationship between SRL and content ability across multiple grade levels, it was imperative that students’ skills in each of these areas were mapped using a common assessment approach. Therefore, classroom tests were not considered appropriate and to gather the rich data required to compare student abilities, end-of-year reports were inadequate and not directly comparable across schools. An appropriately designed assessment system was provided by the Assessment Research Centre at the University of Melbourne (ARCOTS) (Australia). Students’ content ability in mathematics or reading comprehension was tested using the ARCOTS. The assessments were delivered online, together with an integrated reporting system. Teachers were tasked with the role of targeting the appropriate test to each student in their class. Teachers selected from a series of eight tests, color-coded in order of difficulty and complexity of the material and related questions: red, orange, yellow, lime, green, aqua, blue and purple, with red being the easiest. Teachers were given access to view each test prior to allocating tests to students. Teachers were expected to use a variety of test colours per class for the same year level. As an example, a Year 6 teacher may need to administer the orange test to some students and the yellow, lime or green test to others. Teachers received professional development through a series of online guides informing how to target and administer the tests. The online guides explained how to receive the most accurate report for each student; teachers should aim to administer a test where the student will answer approximately 50% of questions correctly, maximizing test information for the student.
The tests in each learning area varied in content and complexity. In reading comprehension, for instance, the content was a written passage, and the items based on the passage differed in complexity of skills assessed. For example, the same passage may have had one associated question requiring students to locate information directly stated in the passage, and another question requiring students to identify possible reasons for a character’s motivation (a more complex skill). These are questions of different complexity on the same content. Each test had questions drawing on a range of content with varying levels of complexity. There was overlap in both content and complexity between one test and the next. This allowed psychometric scaling of the set of tests to place students on the same (logit) scale regardless of the coloured test they sat. Using this method of test targeting and equating, students’ ability estimates could be calculated accurately across grade levels.
Reports were available for students who received an assessment measure that was within the acceptable range of appropriate targeting (generally around 30–80% questions answered correctly). If a student reached either end of the usable proportion of the assessment, the testing errors were considered too high to be able to accurately determine the student’s capacity. Students who answered less than 30% of questions correctly were administered an easier test, and students who answered more than 80% correctly completed a harder test. Teachers were given the option of retesting these students with a more appropriately targeted test. Only appropriately targeted test scores were used in the analysis for this study to keep testing errors low and to increase the validity of the results presented.
Students’ results were not reported to teachers as a grade or score but as a written description of the skill level at which students were ready to learn (i.e. their zone of proximal development or ZPD). The written descriptions were presented as a progression of skills from low (level A) to high (level M in reading and level L in mathematics). Progressions were not based on what should have be taught at any given grade level; instead, progressions were derived from the Centre’s research on how students learn and validated from large empirical data sets obtained from hundreds of thousands of students (M. Pavlovic, personal correspondence, 4 February 2016). Progressions or ZPD levels were not used in this study to investigate students’ ability levels; rather, their weighted likelihood estimates (WLEs), calculated from data provided by the ARCOTS system based on Rasch analysis, were used to compare with students’ SRL ability.
Analysis method
Analysis of SRL
The SRL questionnaire was completed by 4232 students and analysed using a partial credit model (Masters, 1982) using ConQuest software (Wu, Adams, Wilson, & Haldane, 2007). The assessment tool produced an alpha reliability (EAP/PV) of 0.87, indicating strong internal consistency. For estimation of parameters, average indicator difficulty was arbitrarily set to zero, while student ability estimates were allowed to vary. The range of latent student ability estimates was compared to the range of indicator difficulties to check that the items were appropriately matched to students’ abilities. Item and person separation reliabilities were 0.99 and 0.86, respectively, which according to Wright and Masters (1982) provide evidence of construct and criterion validity respectively (Wright & Masters, 1982). This indicated that the items’ facility to map SRL was appropriate over a large range of abilities of students tested. The mean of the latent ability distribution was 0.66 logits (standard error 0.011), showing that the indicators were well matched for students’ abilities.
Fit statistics were estimated as residual-based indices as described by Wu (1997), who extended those described by Wright and Masters (1982). The data fit the Rasch model, providing evidence that the SRL assessment was measuring a consistent latent trait. Item information-weighted mean-squared residual goodness of fit statistics (INFIT) ranged from 0.83 to 1.17, with a mean of 0.99 and standard deviation of 0.089, indicating the data fit the model. Individual steps of each item were examined to confirm fit to the model and that the plausible value of the average ability of each item step was consistent with the hypothetical continuum of the latent trait. This was to confirm that the response probability increased with higher values of θ (student ability).
Student ability estimates were calculated as WLEs obtained based on the procedure described by Warm (1989). Student ability and item difficulty were interpreted on the same scale, with units referred to as logits.
Analysis of content ability
Students’ WLEs for content ability on the latent continuum for mathematics or reading comprehension were calculated from data collected by the ARCOTS system, using common item parameter estimates to equate tests. Item parameter estimates were provided based on previous data collected by the system method (Pavlovic, 2017).
Analysis of relationship between SRL behaviour and content ability per grade
Simple linear regression analysis between SRL and content ability estimates was undertaken separately for mathematics and for reading comprehension using SPSS software. Both ability estimates were continuous interval scaled variables, so linear regression was appropriate. SRL behaviour was designated as the independent variable and content ability as the dependent variable to present the data under the hypothesis of SRL predicting academic performance. Multilevel modelling was performed to examine the source of the variation between students’ SRL behaviour and academic achievement, structured as students (Level 1) within classes (Level 2) using the MLwiN software (Rasbash, Charlton, Browne, Healy, & Cameron, 2009).
Differences in SRL and content ability between grades were compared using between-subjects one-way analysis of variance (ANOVA) using SPSS software. Levene’s (1960) statistic was calculated to determine homogeneity of variance, and Bonferroni (Dunnet, 1955) post hoc tests were used to determine differences, adjusting for multiple comparisons (SPSS software).
Results
SRL assessment
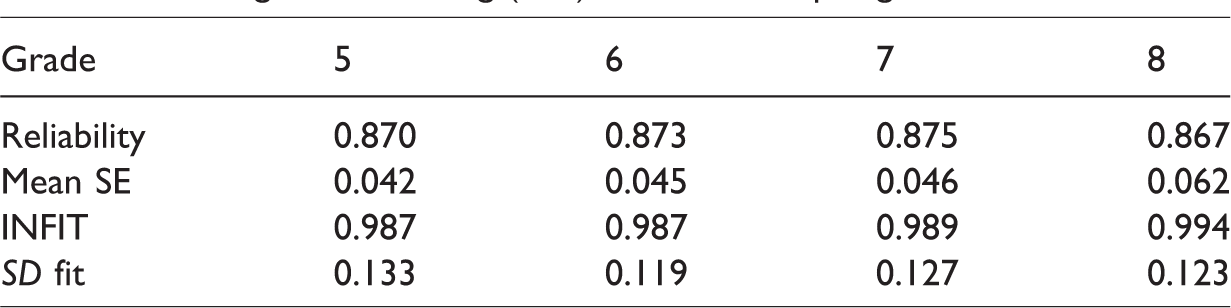
To examine possible differences in the functioning of the SRL assessment across grade levels, responses from each grade level were analysed separately as though separate instruments were administrated, and instrument statistics were compared for each cohort (Table 2). There were no differences noted in either the reliability of the assessment in measuring SRL for particular grade levels, nor in the mean standard error of person ability measures, mean fit statistics, or standard deviations of the mean fit statistics. Reliability estimates for indicator and student separation were identified using ConQuest (Adams et al., 2012). Fit statistics were estimated as residual-based indices as described by Wu (1997), who extended those described by Wright and Masters (1982). Weighted fit is the mean-squared difference between the observed and the estimated difficulty of each score, weighted by the variance of the assigned score, or INFIT. If the model fits the data, then the INFIT should approximate to 1. Acceptable fit is often quoted as ranging between 0.77 and 1.20 (as in Adams & Khoo, 1995). INFIT means and standard deviations for each grade cohort are listed in Table 2.
Self-regulated learning (SRL) test statistics per grade.
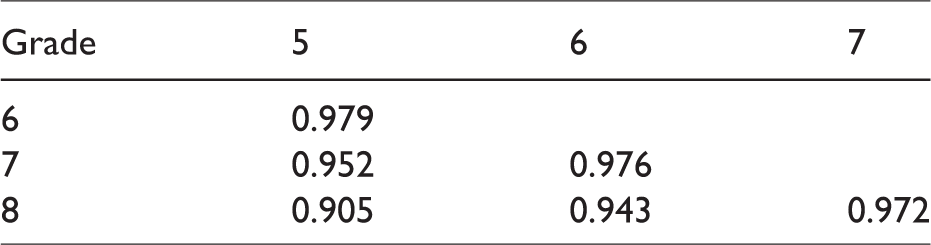
To examine the possibility of differential item functioning (DIF) between the student samples in the different grades involved in this study, data were calibrated separately for each grade and item parameter estimates were compared. The correlation between item parameter estimates for each grade was used as an indication of the amount of DIF between grades. Item difficulties per grade were compared and correlations (r) are shown in Table 3. All correlations were significant (two-tailed, p < .01) and greater than 0.9, demonstrating no major differences in the way the indicators were measuring SRL in the different grades. One item displayed some evidence of non-uniform DIF. The item bordered the 95% confidence interval range of acceptable item parameter variation, reaching a 0.38 logit difference between Grade 5 and Grade 8 students (just above the 0.3 logit absolute difference rule of thumb). Grade 5 students were disadvantaged with this item, as a higher proportion selected the 0-response category compared to what would be expected by their responses to the remainder of the items. The item was retained for the analysis presented in this article due to the closeness to acceptable range and the need to maintain construct validity and instrument reliability measures. Analysis without this item did not change the outcome.
SRL grade item parameter correlations (r).
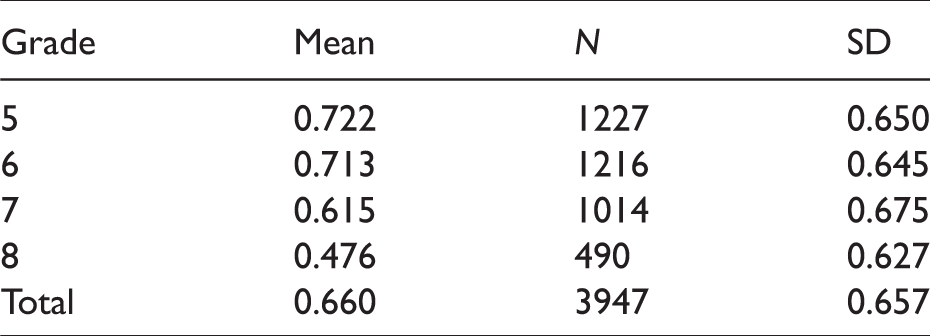
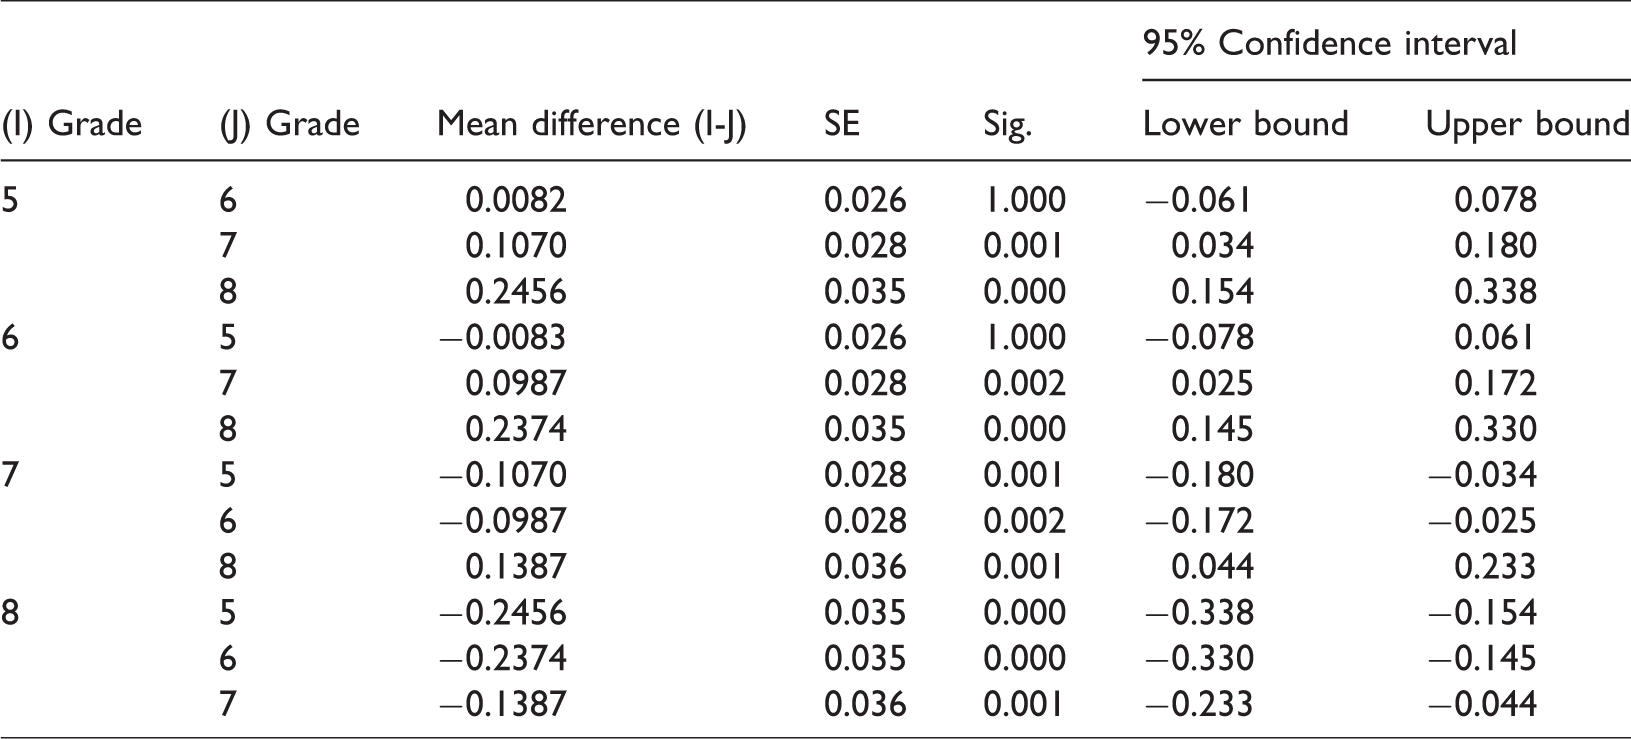
As no notable differences emerged in the way the assessment functioned for each grade level, students’ SRL use could be accurately compared across grades. The entire assessment was calibrated as one instrument and analysed using Masters’ (1982) partial credit extension to the Rasch model to estimate students’ level of skill in regulating their own learning as described in the ‘Methods’ section. The differences in SRL use between grades were compared using a between-subjects one-way ANOVA. Mean differences are shown in Table 4. Levene’s statistic was not significant (p = 0.336), indicating that variances were homogeneous and a Bonferroni post hoc test was suitable to determine differences in SRL between grade levels, adjusting for multiple comparisons. Grade had a significant effect on SRL use at the p < .05 level [F(3, 3943) = 20.98, p < .001]. Post hoc comparisons using the Bonferroni test (Table 5) indicated that the mean SRL use for Grade 8 (M = 0.476, SD = 1.30) was significantly different from the mean SRL use for all other grades (M = 0.615–0.721). However, SRL use of students at Grade 5 (M = 0.722, SD = 0.650) did not significantly differ from SRL use of students at Grade 6 (M = 0.713, SD = 0.645); refer to Table 5. Taken together, these results suggest that students at higher grade levels or those in secondary schools report less use of SRL practices, with the lowest use of these skills being reported by Grade 8 students.
Mean self-regulated learning (SRL) use per grade.
Differences in mean self-regulated learning (SRL) use per grade.
Content assessment
Students’ mathematics or reading comprehension ability was tested using ARCOTS as described under ‘Methods’. As students were administered one of a series of developmental assessments, they completed separate items, not only between grades, but also between schools, classes and individual students within each class. It was common (and necessary) for a teacher to administer four or five different assessments within the same class, each student completing one assessment based only on their ability – unless the test was mis-targeted and the student was therefore asked to sit an assessment of different difficulty. The scope to perform a DIF analysis for this study was limited due to the complexity of test construction, administration and lack of common items answered by students of different grade levels; therefore, this study relies on the robustness of the measures used. Predictions of increased ability by grade were as expected as presented in Table 6, supporting the validity of the content assessments in this study.
Mean content ability per grade.
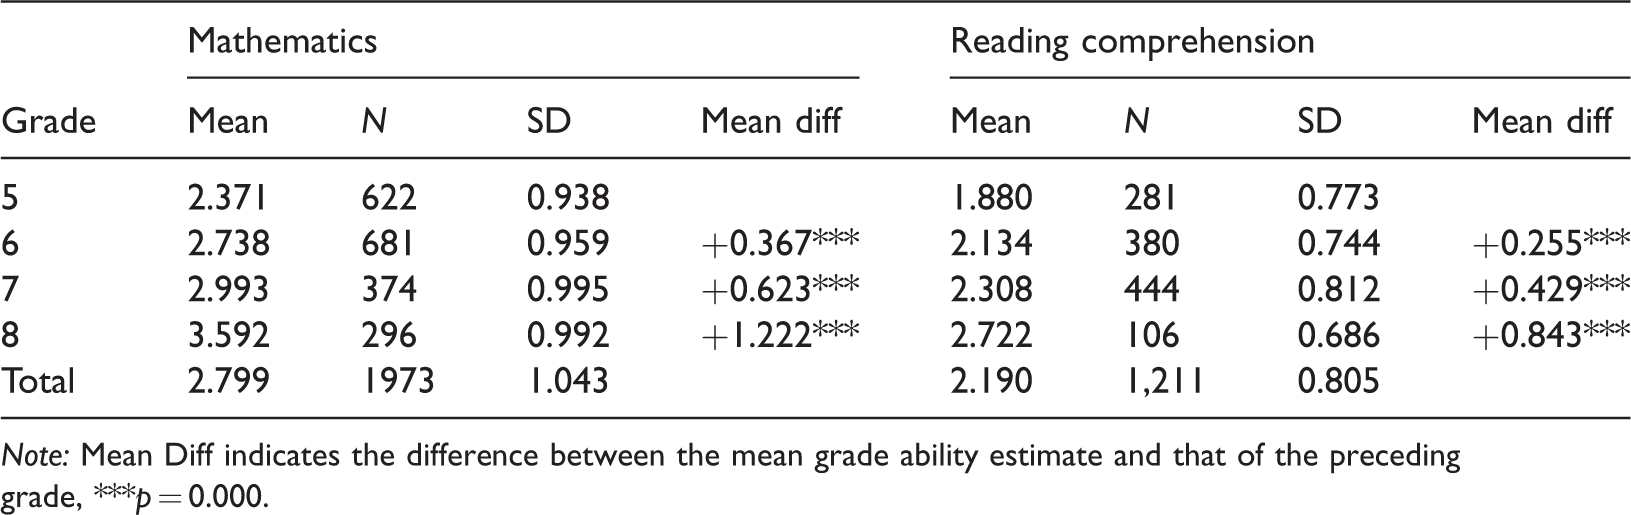
Note: Mean Diff indicates the difference between the mean grade ability estimate and that of the preceding grade, ***p = 0.000.
Differences in content ability between grades were compared using a between-subjects one-way ANOVA. Levene’s statistic was not significant for either mathematics or reading ability (p = 0.191 and 0.177, respectively), indicating that variances were homogeneous and a Bonferroni post hoc test was suitable to determine differences in ability between grade levels, adjusting for multiple comparisons. Grade had a significant effect on content ability for both mathematics and reading at the p < .05 level [mathematics, F(3, 1969) = 113.621, p = 0.000], [reading, F(3, 1207) = 36.112, p = 0.000]. Post hoc comparisons using the Bonferroni test indicated that the mean mathematics and reading ability for each grade were significantly greater than that of the preceding grade (Table 6). These results were completely predictable, as it was expected that with each grade transition, students’ mean ability in content areas would increase.
High-performing students regulate their own learning
Predicting academic performance based on SRL intentions and motivations
Simple linear regressions were utilized to determine whether SRL intentions and motivations predicted academic performance for mathematics or reading comprehension. A significant regression equation was found for both mathematics [F(1, 1971) = 51.48, p = 0.000], and reading comprehension [F(1, 1209) = 31.046, p = 0.000]. R2 was 0.025 for both content areas. Students’ predicted mathematics ability was 2.627 + 0.260 (SRL) and students’ predicted reading comprehension ability was 2.067 + 0.190 (SRL); all units are in logits. Students’ academic performance was therefore increased by 0.190–0.260 logits for every logit of SRL use. The effect size r was low for both subjects: 0.160 for mathematics and 0.158 for reading comprehension.
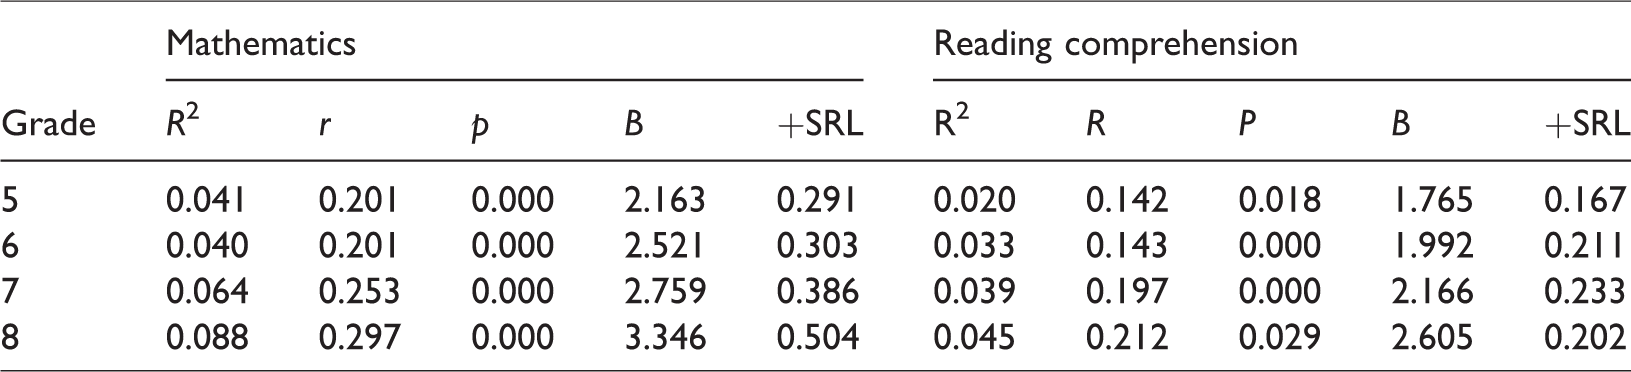
Separate regression analyses per grade were performed to determine whether the predictive effect of SRL on academic performance was consistent between grade levels. Results are presented in Table 7, showing that for every year level increase, the predictive power of SRL on achievement also increased. Further, SRL had a greater predictive power on mathematics ability than on reading comprehension ability based on the academic performance measures used in this study (ARCOTS). Importantly, however, the assessment systems were scaled separately for mathematics and for reading comprehension; therefore, it is likely that results may not be directly comparable.
Linear regression results: Prediction of academic performance based on self-regulated learning (SRL).
Examining quartiles of student ability groupings to graph students’ SRL relationship with content ability
Considering that academic performance was shown to increase based on higher use of SRL behaviours (High-performing students regulate their own learning section), and academic performance also increased based on grade level (Content assessment section), it is counterintuitive for students at higher grade levels to display lower levels of SRL behaviours (SRL assessment section). To further investigate this phenomenon, students were separated into quartiles based on their academic performance, where Q1 was designated to students performing in the lowest 25% of their grade and students designated Q4 when their academic performance was in the highest 25% of their grade. Figure 3 demonstrates the relationship between SRL behaviour and content ability by graphing the mean student SRL for each ability group. Graphing the data separately by grade, as in Figure 4(a) and (b), demonstrates that the relationship between increased SRL in higher ability groups is maintained within each grade, even though the higher grades demonstrate fewer mean SRL behaviours. This is also visible when the results of the regression analysis are presented graphically in Figure 4(c) and (d). Note that the independent variable (SRL) and the dependent variable (content ability) are mapped on the opposite axis than is usually presented; this is to visually present the overall reduced SRL behaviour in the latter grades in comparison to the slopes of the regression, which progressively get steeper as the grade increases.
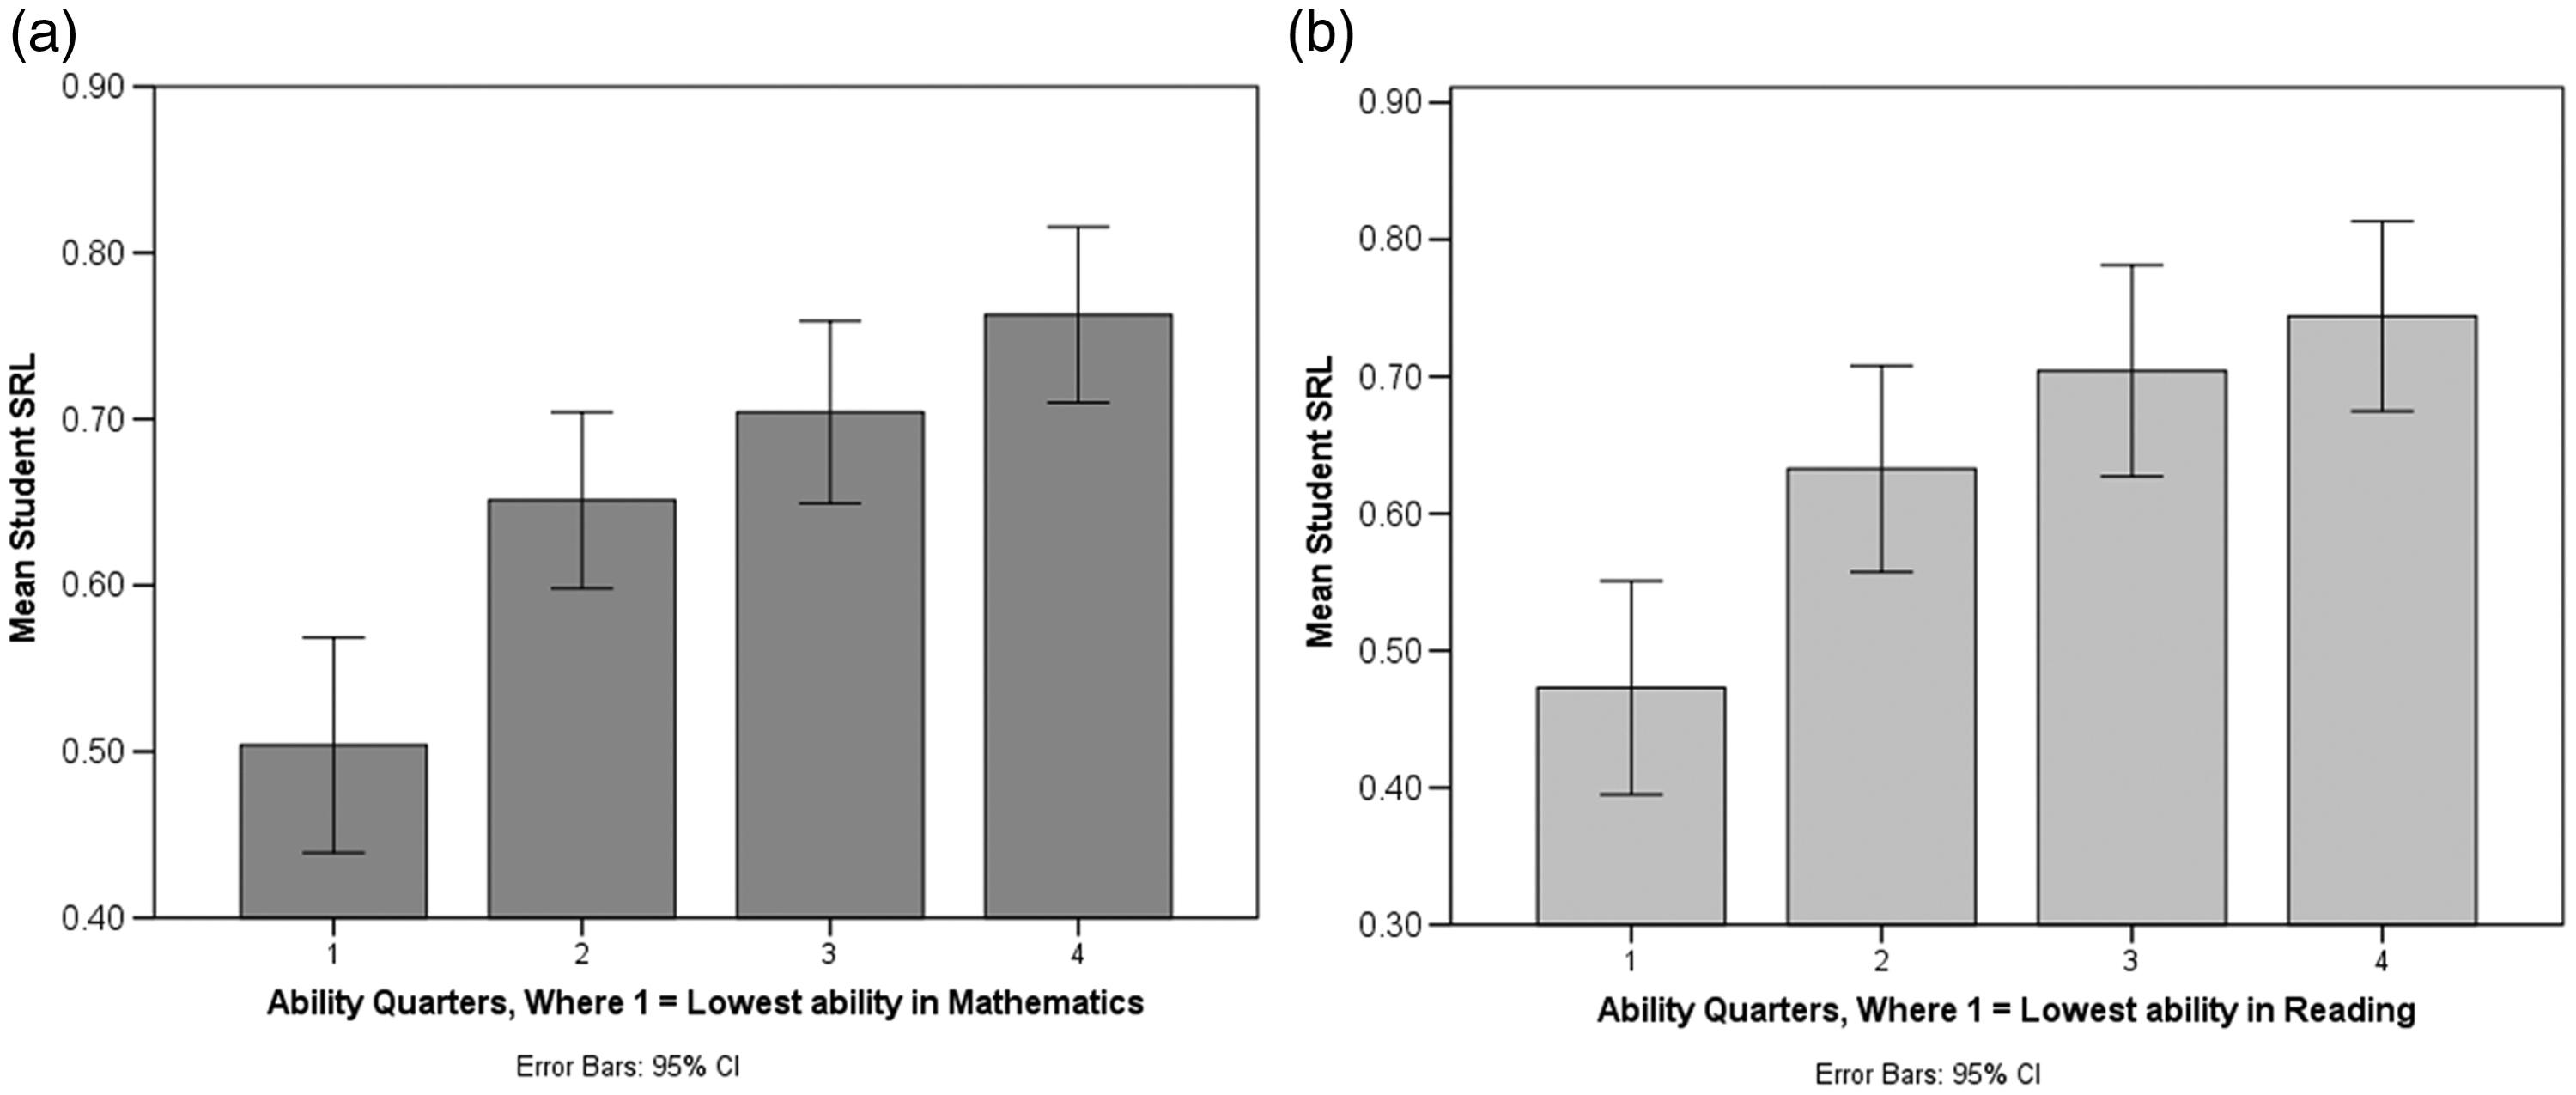
Students with higher mathematics (a) and reading comprehension (b) abilities show increased SRL behaviours.
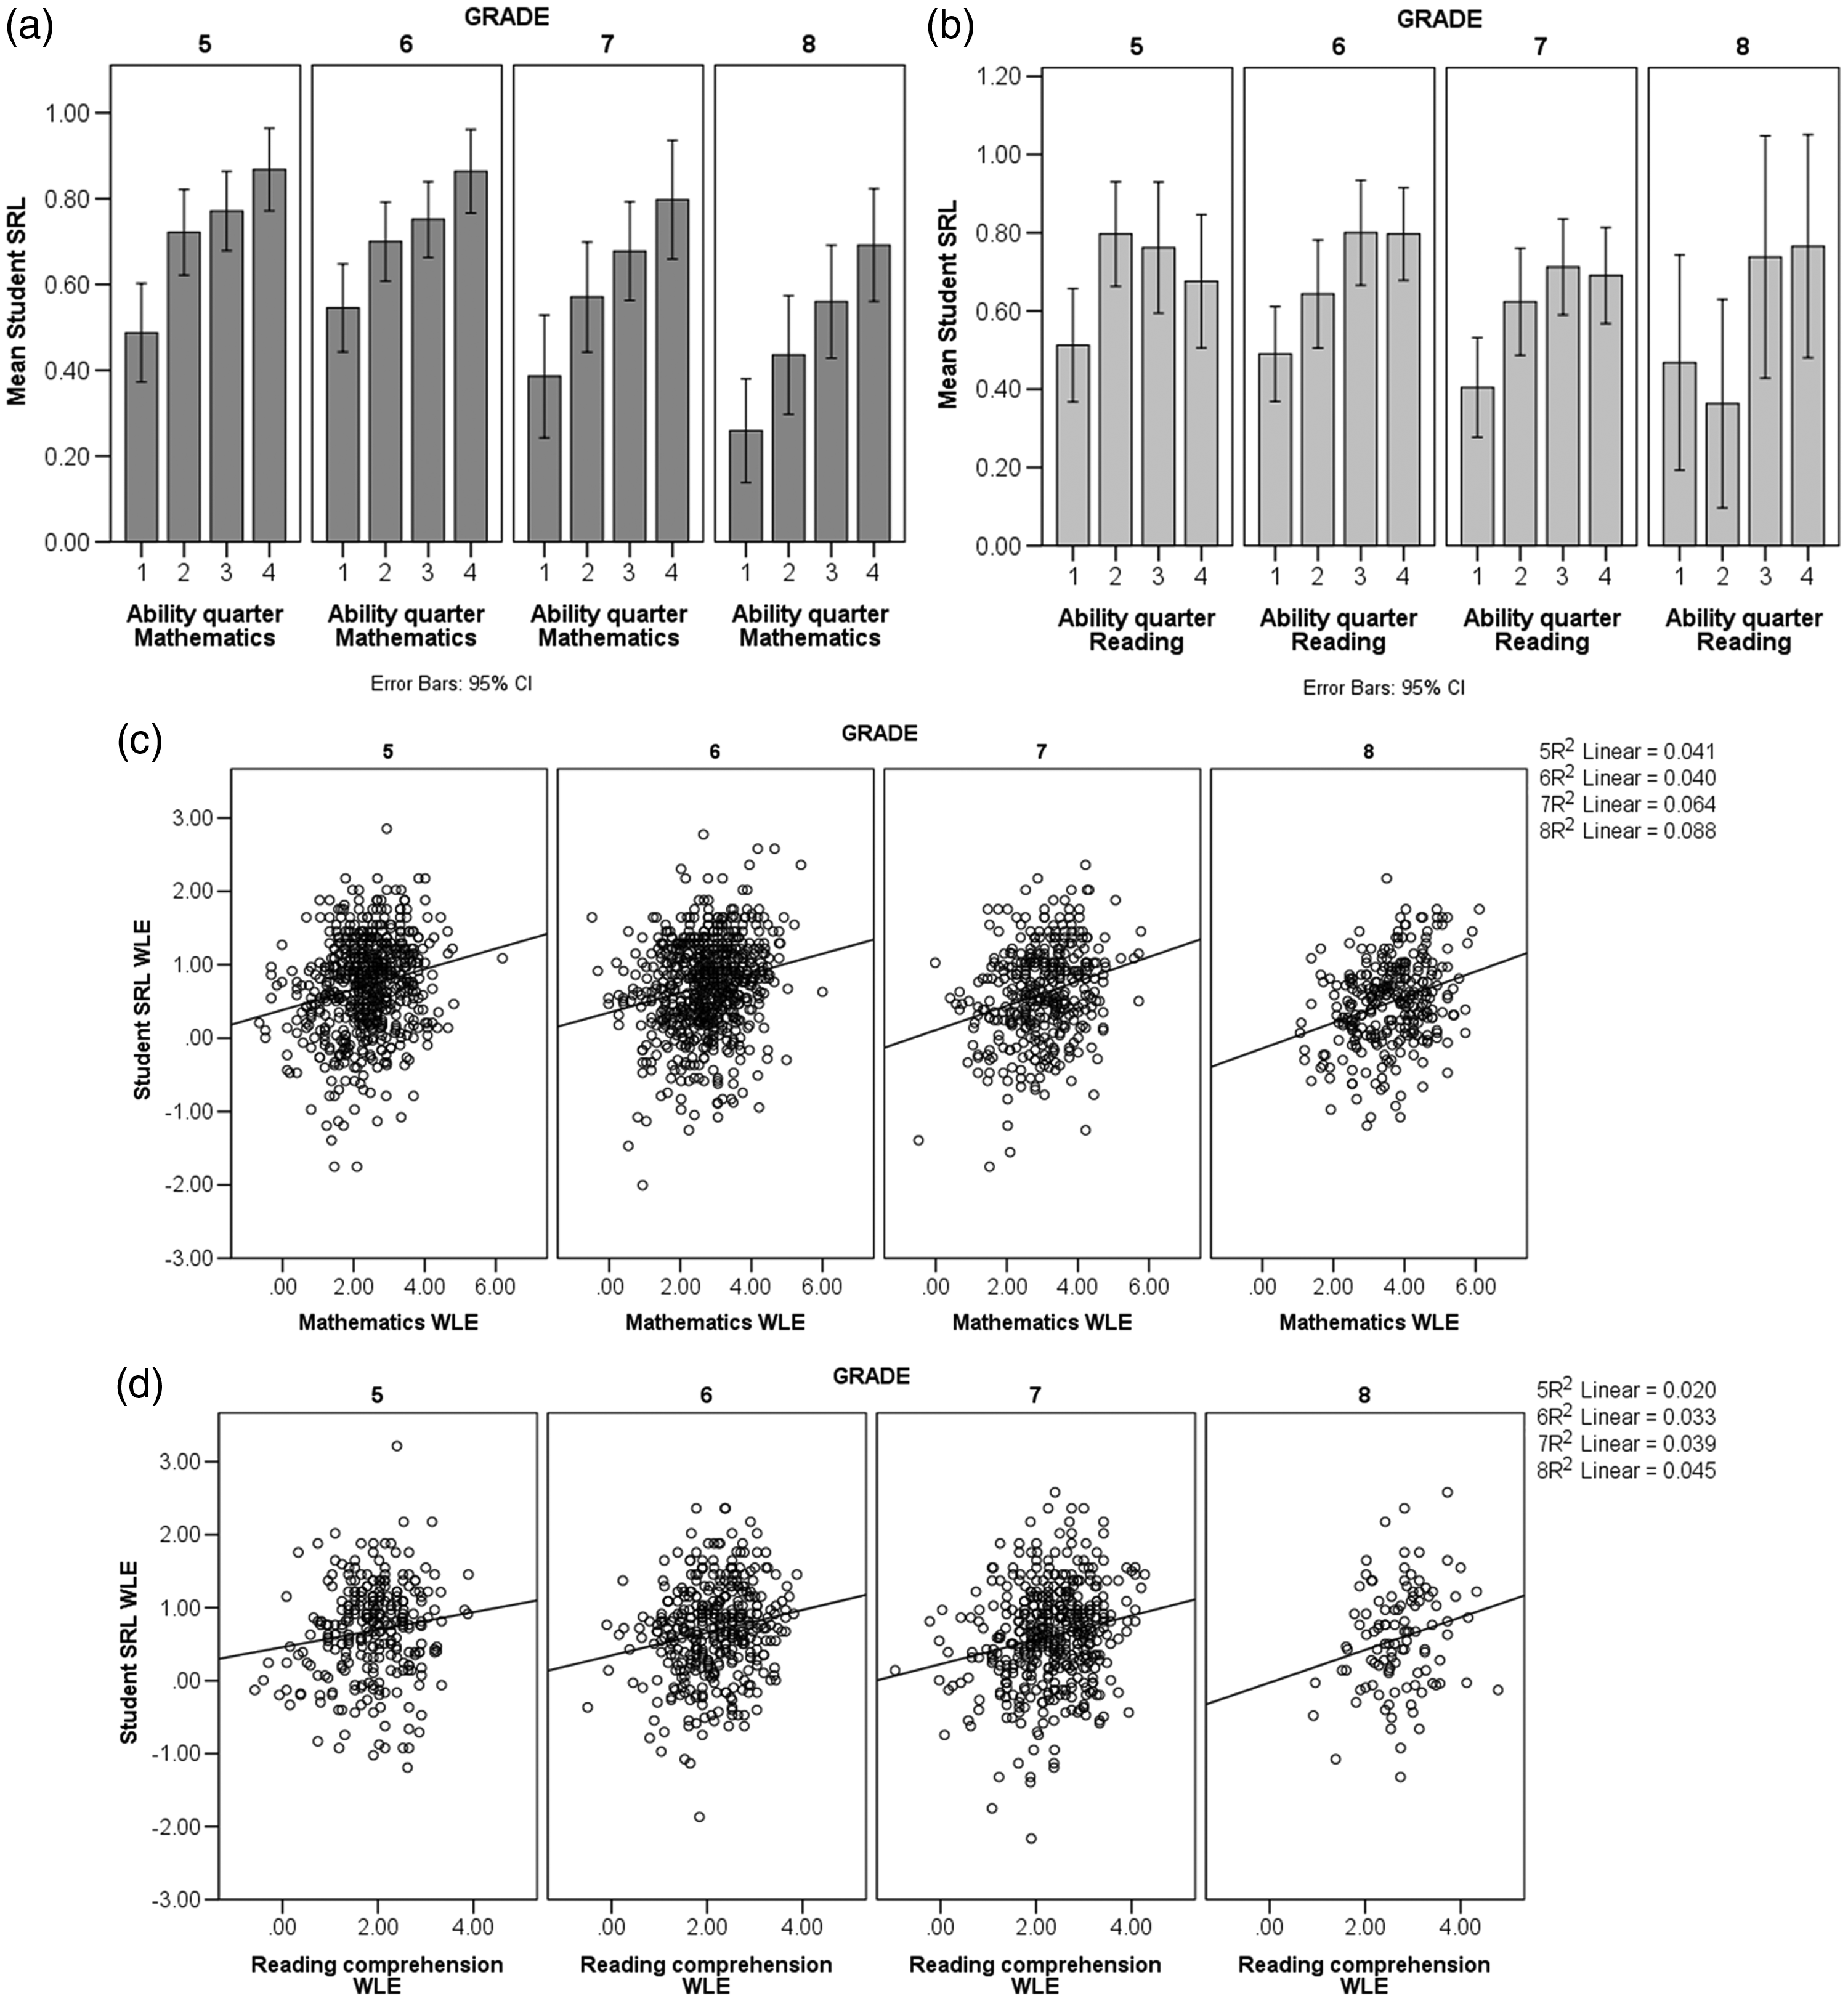
The relationship between SRL and mathematic ability (a and c) or reading comprehension ability (b and d) per grade, by ability groupings (a and b) or linear regression (c and d).
Participant numbers were not equal across grades, with far fewer Grade 8 students tested and more teachers electing to focus on mathematics than reading; refer back to Table 1. Unequal samples can be noted in Figure 4(c) and (d). An ANOVA analysis is not presented based on differences between ability groupings and SRL behaviour per grade, as content ability is a continuous variable; therefore, the regression analysis was the more appropriate technique.
Within-class relationships and student groupings
Given the relationship between SRL and academic performance within grade, students’ ability estimates for one class were graphed separately, demonstrating the relationship between variables and the possible grouping practices that could be used when students’ SRL behaviours were taken into account along with their content ability (Figure 5). A standard approach was considered where students were grouped into high–low mathematics or reading performance/SRL behaviour groupings (i.e., high/high, high/low, low/high, and low/low as shown in Figure 5(a)). An alternative approach would be for the teacher to look at how students may be grouped more intuitively, without the need for having equal students in each group, but by identifying clusters of students who have similar abilities and behaviours so that their instruction can be targeted appropriately (Figure 5(b)). Reasons why this might be helpful will be discussed.
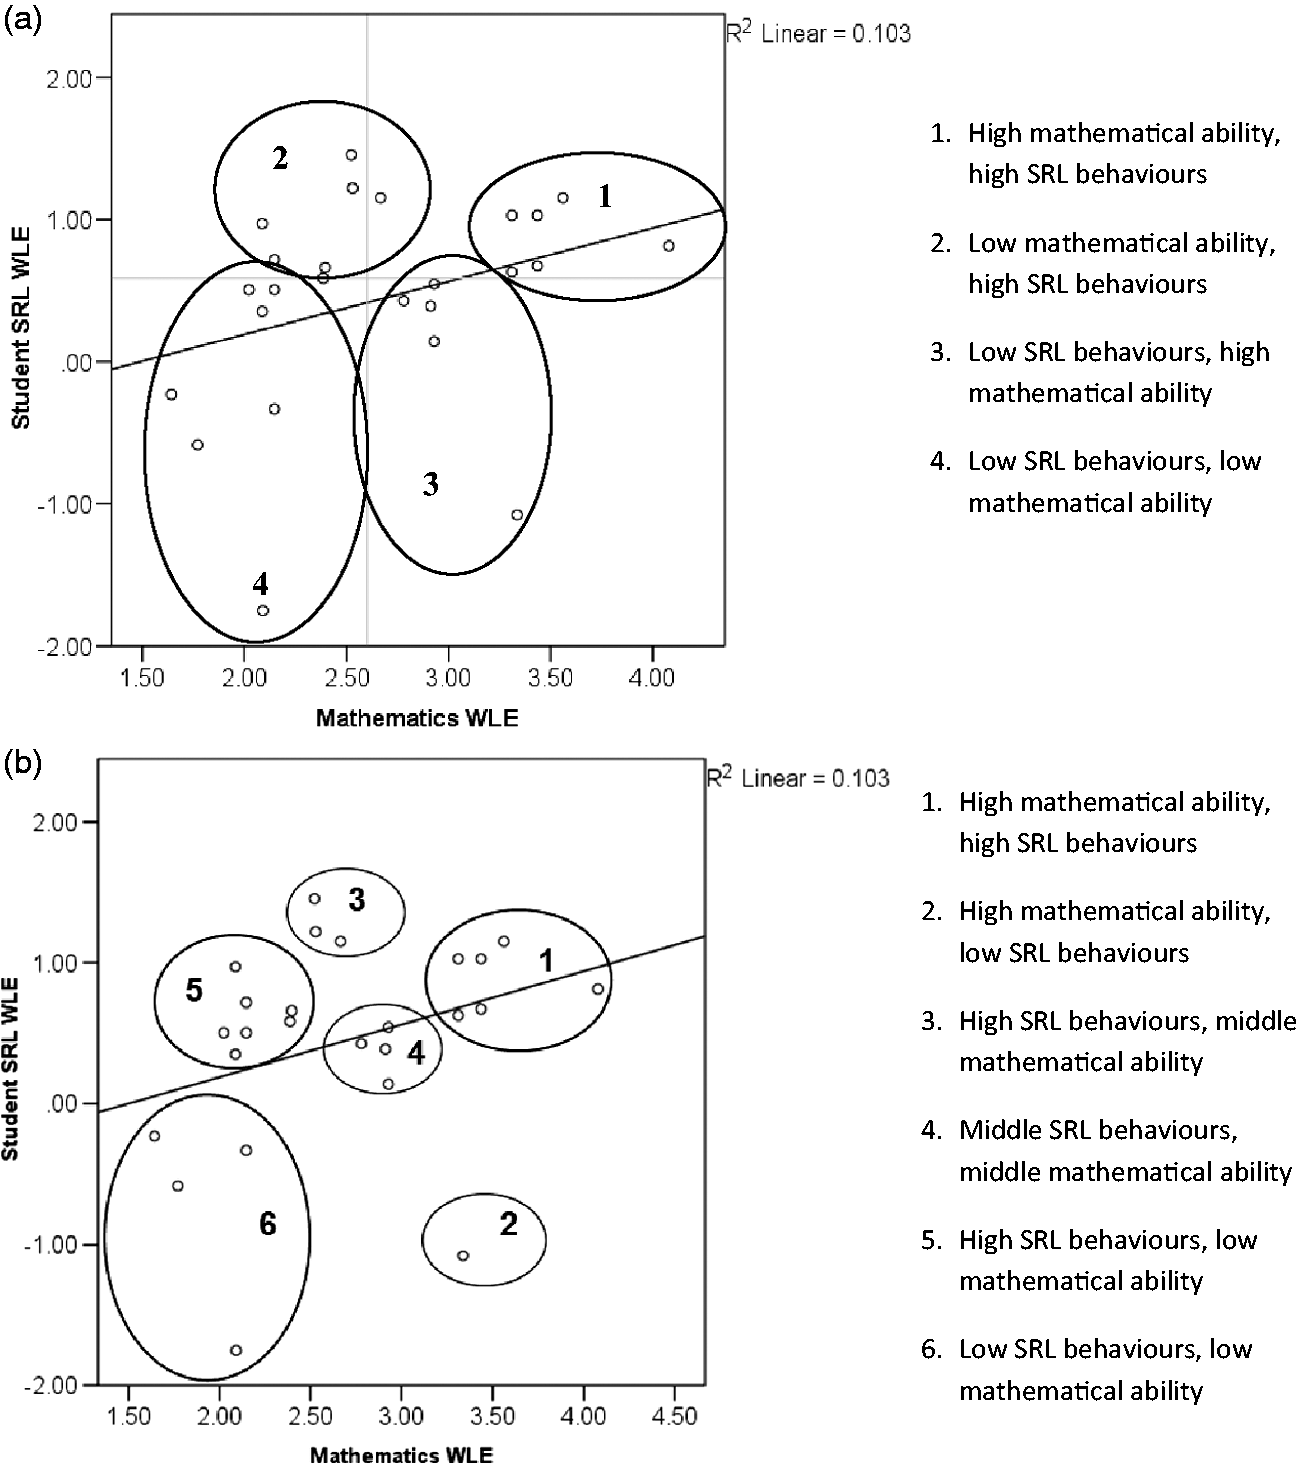
Example instructional groups based on SRL and mathematics results for one Grade 5/6 class (n = 25). Example (a) uses a standard high/low approach where example (b) shows intuitive groupings.
Discussion
In answer to the first research question, this study found SRL behaviours to be associated with academic performance in all grades tested (as described in Predicting academic performance based on SRL intentions and motivations section) with the relationship the strongest at Grade 8, although the relationship between SRL behaviour and academic performance was only small in all grades. In answer to the second research question, evidence from the current study indicated difference in the use of SRL behaviours across grade levels. Thus, students in Grades 7 and 8 were found to be less likely to regulate their own learning compared with students in lower grades (5 and 6). Of importance to students’ learning and instruction, the second finding outweighed the first, as shown in Figure 4. Students in Grade 8 exhibited the lowest SRL-related behaviours of all grades tested.
SRL behaviour predicts academic performance
Previous studies have demonstrated the predictive nature of SRL behaviour on academic performance (e.g., Magi et al., 2016; Richardson et al., 2012; Robbins et al., 2004), while other studies have shown no relationship (e.g. DiFrancesca et al., 2016; Sontag & Stoeger, 2015; Ziegler & Stoeger, 2010), albeit in differing contexts and for different ages. As shown in this study, the relationship is very weak (R2 varies from 0.020 to 0.088; refer to Table 7) depending on grade level and content area tested. These findings suggest that differences in the impact of SRL on performance will likely continue to be ambiguous. This is due to differing methods of measuring SRL or measuring components of SRL that are weakly related to performance. Alternatively, components such as self-efficacy, which are often based on measures that are dependent on ability, continue to be strongly linked to performance.
Although this study has shown a relatively small association between SRL behaviour and achievement when compared with the strong relationships between other variables such as socioeconomic, parental education or support, genetics, schooling or other background characteristics and students’ learning, it is likely that the advantage of supporting SRL behaviours in mathematics or reading comprehension may be greater than this study has shown. The need to encourage students to use SRL behaviours that enhance their education is vital, as this may be the one aspect of learning that students themselves can control.
Second, some studies have focused on the relationship between parental support and students’ SRL behaviours (e.g. Kallia & Dermitzaki, 2017; Zhang & Whitebread, 2017) which, although beyond the scope of this study, is important as even though appropriate SRL behaviours may be necessary for learning, it is not only teachers who foster these skills. Regardless of parental involvement, we postulate that students with better ability to regulate their own learning gain the most out of their educational experience and are advantaged in their learning environment.
Secondary students use less effective SRL behaviours
The second major finding presented in this article is the reduced display of SRL behaviours by Grade 8 students, who reported using less SRL than the Grade 7 students, who, in turn, reported less use of SRL than the Grade 5s and 6s (refer to Table 4). Most educational constructs are developmental according to age as well as competency, with higher age leading to greater level of skill displayed or greater ability. The SRL construct is unusual in that students are able to go “down” the latent continuum as they progress through schooling.
This study focused on students in Grades 5–8. Therefore, it is unknown what level of SRL behaviour the students in middle and upper secondary school would exhibit – or those in lower primary – if they were included in this study. The trend to use SRL behaviours less in Grade 8 might not continue into later secondary years. It is just as likely that older students will again begin to exhibit quality SRL behaviours when they are given the student voice and agency within which to exhibit these kinds of skills in the later years of secondary schooling. Students in lower secondary school arguably have less opportunity to exhibit SRL behaviours than those in higher year levels, as they are seen as needing direct instruction and firm guidelines. Goals may be set for these students, rather than them having the capability of setting their own learning goals, and they may feel less engaged in their learning and so less likely to adapt their behaviours for learning.
This study has shown that lower secondary school students report less use of SRL behaviours compared to students in upper primary school. Why this pattern of results has been observed is uncertain, but numerous explanations could be considered. For example, it is possible that the structure of lower secondary school inhibits students’ SRL behaviours. Alternatively, curriculum demands are often greater in secondary schools, resulting in teachers having less scope to spend time teaching ‘soft skills’ such as SRL. There could also be a lack of professional development on teaching SRL, which might mean that teachers lack the requisite skills to teach these types of behaviours. Even if teachers do not lack such skills, they may lack the view that it is their responsibility to teach SRL to their students if they do not see SRL skills as directly related to their subject areas. Overall, there may be less explicit teaching of SRL capabilities in secondary schools, resulting in students using fewer appropriate SRL behaviours as a general consequence of less direct teacher–student time in secondary schools where students commonly have a different teacher for each subject. In primary schools, the teacher–student bond has the potential to be stronger as students have one main teacher for the year. The ability of teachers to recognize students’ SRL behaviours – and therefore target their instruction to students’ SRL ZPD – may also be lower in secondary schools when compared to primary schools.
Alternatively, the reduction in use of SRL skills could be attributable to the students themselves. Students potentially become more outwardly focused on their grades and scores in later year levels because they see the need to perform well as they progress through their schooling. The emphasis on learning for intrinsic purposes may subtly shift to learning for extrinsic purposes, such as achieving high marks or achieving entry into a select entry school. This may or may not be detrimental to the student. As this study measured students across ages as well as schooling contexts, it could be that age-based development differences that are related to the reduced use of SRL exist alongside schooling-based factors. Another possibility is that older students have begun to realize that their ability to learn is shaped by the quality of their school, teachers, parental support, socioeconomic factors and genetics, and they therefore lose the desire to control their own learning and focus less on how they can improve themselves as learners, concentrating instead on external factors shaping their capacity to learn. Whatever the explanation, it is vital that secondary students get the support and encouragement they need to focus on their own behaviours, control their learning processes, and consequently, increase their advantage to learn.
Implications on grouping
A third finding emerged during the data analyses. If students vary in terms of their content ability, and vary in terms of their ability to regulate their own learning, then perhaps it is feasible to consider learning behaviour when grouping students in a classroom. For many years, teachers have tended to group students at their ZPD for instructional purposes, but this only takes into account the variety of learning needs in terms of content focus for the students. Students who have different SRL behaviours also have different learning needs in terms of how those behaviours are scaffolded, utilized or enhanced. It is possible that teachers could use the information about how students use SRL behaviours to guide their own learning to group students not only based on content understanding, but also on students’ capacity to learn how to learn. An example of how such grouping could occur is shown in Figure 5(a) and (b).
Teaching methods used in schools are beyond the scope of this article. However, it would be remiss not to discuss how students with different needs should be catered for, not only in terms of content coverage. According to traditional content knowledge groupings, the sole student in Group 2, Figure 5(b) (high mathematical ability, low SRL behaviour) would be included with the Group 1 students (high mathematical ability, low SRL behaviour). This student, however, exhibited far less SRL behaviours than the students in Group 1. They would likely not excel in a situation where they were given a choice of learning tasks, freedom to work independently, and perhaps the responsibility of designing their own learning plan. A student at this low level of regulation would likely choose the easiest task (even though they are highly able), distract others (avoidance behaviour), and design a learning plan that did not require any effort on their behalf. Teachers have long noticed these types of students, typically referred to as ‘cruisers’ or ‘disengaged’. Similarly, students in Group 3, Figure 5(b) could be given more choice in learning, more freedom in student agency and more engagement with the learning process to reward and capitalize on their advanced SRL behaviour, even though these students are only average achievers in the mathematical content sense. As learning moves beyond content understanding and into the realms of generalized capabilities and ‘learning how to learn’, it is crucial that students’ SRL behaviour is not only measured, but also utilized to inform teaching practice.
Students can be scaffolded within their ZPD for SRL as well as content knowledge, and students should be taught the learning behaviours that suit those they are ready to learn, especially in secondary school where fewer students are exhibiting these behaviours.
Limitations
The SRL tool used in this study is likely to measure only the intention or perspective that the student has on how they regulate their own learning based on each capability. The self-report tool does not, and cannot, measure the effectiveness of each SRL approach undertaken by the student, only that they have reported that they undertook that approach. This is the limitation of such a self-report. While students may have claimed that they were using an effective strategy in class, the effectiveness of the strategy which they reported was not measured. Therefore, the SRL tool measures motivations and learning intentions in accordance with the SRL construct. In short, the questionnaire captures the metacognitive, but not necessarily the cognitive, elements of SRL.
The data presented in this study could be presented in the opposite direction, with content ability predicting SRL behaviour. The modelling does not reveal the direction of the relationship, as regression analysis cannot indicate causation. It was hypothesized that SRL behaviours might predict academic performance, as students who have developed the ability to regulate their own learning may become better learners and thus develop higher skills in mathematics and reading comprehension. Alternatively, students’ high content ability might drive them to become better learners, displaying higher levels of SRL due to their previous successes in academic performance.
Future research on students of varying grades should be undertaken in a consistent approach with a unified use of one or more robust measurement tool/s. With current SRL research often focusing on specific cohorts of students (specific grades, countries, schooling types), using different measurement tools depending on the context, we are lacking the insights that can be gained from a more general but large-scale approach. While many research studies have focused on an intervention approach with SRL training programs, the exact populations of students in which these interventions would be most necessary have not been identified. Further, research on SRL needs to start looking beyond measuring SRL behaviour and observing patterns and begin to focus on teaching students how to learn effectively. This requires the use of measurement tools that indicate students’ ZPD in terms of SRL and not just content knowledge, so that teachers can utilize this valuable information when planning classroom activities and grouping students.
Conclusion
SRL is an academic process by which the learner systematically and intentionally monitors aspects of their thinking, motivation, and behaviour in response to internal and external environments. Students who are able to regulate their own learning can modify and monitor their behaviour using metacognition, motivation, self-awareness, and self-efficacy to reach a desired learning outcome. This study has demonstrated that SRL behaviours are associated with academic performance in mathematics and reading comprehension for students in Grades 5, 6, 7 and 8, with the relationship strongest at Grade 8. However, as students’ progress through these grade levels, the use of SRL behaviour diminishes, with Grade 8s reporting the lowest use of SRL behaviours. Fostering student SRL is therefore vitally important in all grade levels and especially in secondary schooling, as the student’s own behaviour is one aspect of their educational environment that they themselves can control, with the expert direction from their teachers.
Footnotes
Declaration of Conflicting Interests
The author(s) declared no potential conflicts of interest with respect to the research, authorship, and/or publication of this article.
Funding
The author(s) disclosed receipt of the following financial support for the research, authorship, and/or publication of this article: This work was supported by the Australian Research Council Linkage project “Realising the Potential of Australia’s High Capacity Students” (LP140100236).