
Abstract
This study examined the structure of the Best Start Kindergarten Assessment (Best Start) of literacy and numeracy, with the aim of confirming a two-factor measure of attainment at school entry comparable in structure to standardised measures of literacy and numeracy administered in later school years. Administrative data from the 2009 Best Start were obtained from the New South Wales Department of Education for 37,734 children aged ∼5 years (i.e. as they entered their first year of compulsory schooling) as part of the New South Wales Child Development Study. Exploratory and confirmatory factor analyses were performed on the 11 Best Start scales using a split half methodology, with the findings supporting a two-factor solution underpinning literacy and numeracy attainment. The availability of this two-factor Best Start measure of literacy and numeracy at school entry, which precedes the repeated national assessments conducted later in the primary and high school years, facilitates research to examine pathways of academic performance over time.
Keywords
Introduction
Population assessments of academic achievement provide important information to educators and to policy makers about student competencies in identified curriculum areas (e.g. reading and mathematics) at particular year levels (Marks, 2014). They have the capacity to guide the design and delivery of whole-school programs that can support the learning capacity of all students as well as targeted intervention programs for children who fall behind expected minimum standards. In Australia, the standardised National Assessment Program of Literacy and Numeracy (NAPLAN) is conducted annually with students in Years 3, 5, 7 and 9. While NAPLAN allows the monitoring of student, school and population performances during primary and high school years, it does not include an earlier assessment of literacy and numeracy during the first three years of formal schooling. Yet, the early childhood period prior to school entry is recognised as an important stage in which to establish the foundations for later literacy and numeracy (Zubrick, Taylor, & Christensen, 2015). Thus, engagement in formal pre-school programs (age ∼4 years) has been shown to be associated with higher performance on the NAPLAN in middle childhood (VIC Department of Education and Childhood Development, 2013). Similarly, children’s educational attainment in middle childhood and adolescence on the NAPLAN is predicted by developmental skills and attributes rated by classroom teachers at school entry, including cognitive (early literacy and numeracy), social, emotional, physical and communication skills, as measured by the Australian Early Development Census (AEDC; Brinkman et al., 2013).
The Best Start Kindergarten Assessment (Best Start) is a standardised population literacy and numeracy assessment developed by the New South Wales (NSW) Department of Education to ascertain each child’s literacy and numeracy skills at school entry (kindergarten; age ∼5 years). It is administered by teachers and conducted at the beginning of the first year of formal (compulsory) education (kindergarten) to enable the development of appropriate learning programs and teaching plans by classroom teachers (NSW Department of Education and Training, 2009a). The Best Start theoretically assesses seven aspects of literacy and four aspects of numeracy, but the development and psychometric examination of these aspects was conducted separately for literacy and numeracy components. Consequently, it has not been formally established whether the factor structure of the Best Start supports the computation of total literacy and numeracy scales. In this study, we explored the capacity of the Best Start as an early childhood measure of literacy and numeracy attainment at school entry, which can be used in conjunction with later population assessments to examine patterns of academic achievement over time. Exploratory factor analysis (EFA) and confirmatory factor analysis (CFA) were conducted to examine the factor structure of the Best Start in a population sample derived through the New South Wales Child Development Study (NSW-CDS). It was hypothesised that a two-factor model of literacy and numeracy would underpin the 11 aspects of these skills measured by the Best Start.
Methodology
Study sample and design
The participants in this study were derived from the NSW-CDS cohort, a population cohort of 99.7% of children in their first year of schooling in 2009 in the Australian state of NSW (Carr et al., 2016). The NSW-CDS cohort was convened through a multi-agency record linkage of health, education, child protection, crime and vital statistics administrative records. The cohort was defined by the AEDC, with the record linkage carried out by the Centre for Health and Record Linkage (CHeReL: http://www/cherel.org.au) using probabilistic methods.
The NSW-CDS cohort has 37,734 Best Start records following the exclusion of 3593 records, which did not link to the NSW-CDS cohort, were duplicates, or had incomplete Best Start scale data. This subsample represents 43.4% of the NSW-CDS cohort, and 43.2% of kindergarten students (i.e. those attending Government schools) in NSW in 2009. 1 The sociodemographic characteristics of this subsample are comparable to the overall NSW-CDS cohort (see Table 1) in terms of age, sex and remoteness (Department of Health and Aged Care (Australian Government), 2001). Socio-economic status (SES) was measured using the socio-economic indexes for areas (SEIFA) obtained from linked AEDC records. The SEIFA index is based on census information (i.e. income, occupation and education) for each residential postcode (Australian Bureau of Statistics, 2006). As can be seen in Table 1, socioeconomic disadvantage in the subsample was similar to the distribution in the overall NSW-CDS cohort.
Comparison of the demographic characteristics between the NSW-CDS Cohort, and the Best Start subsample.
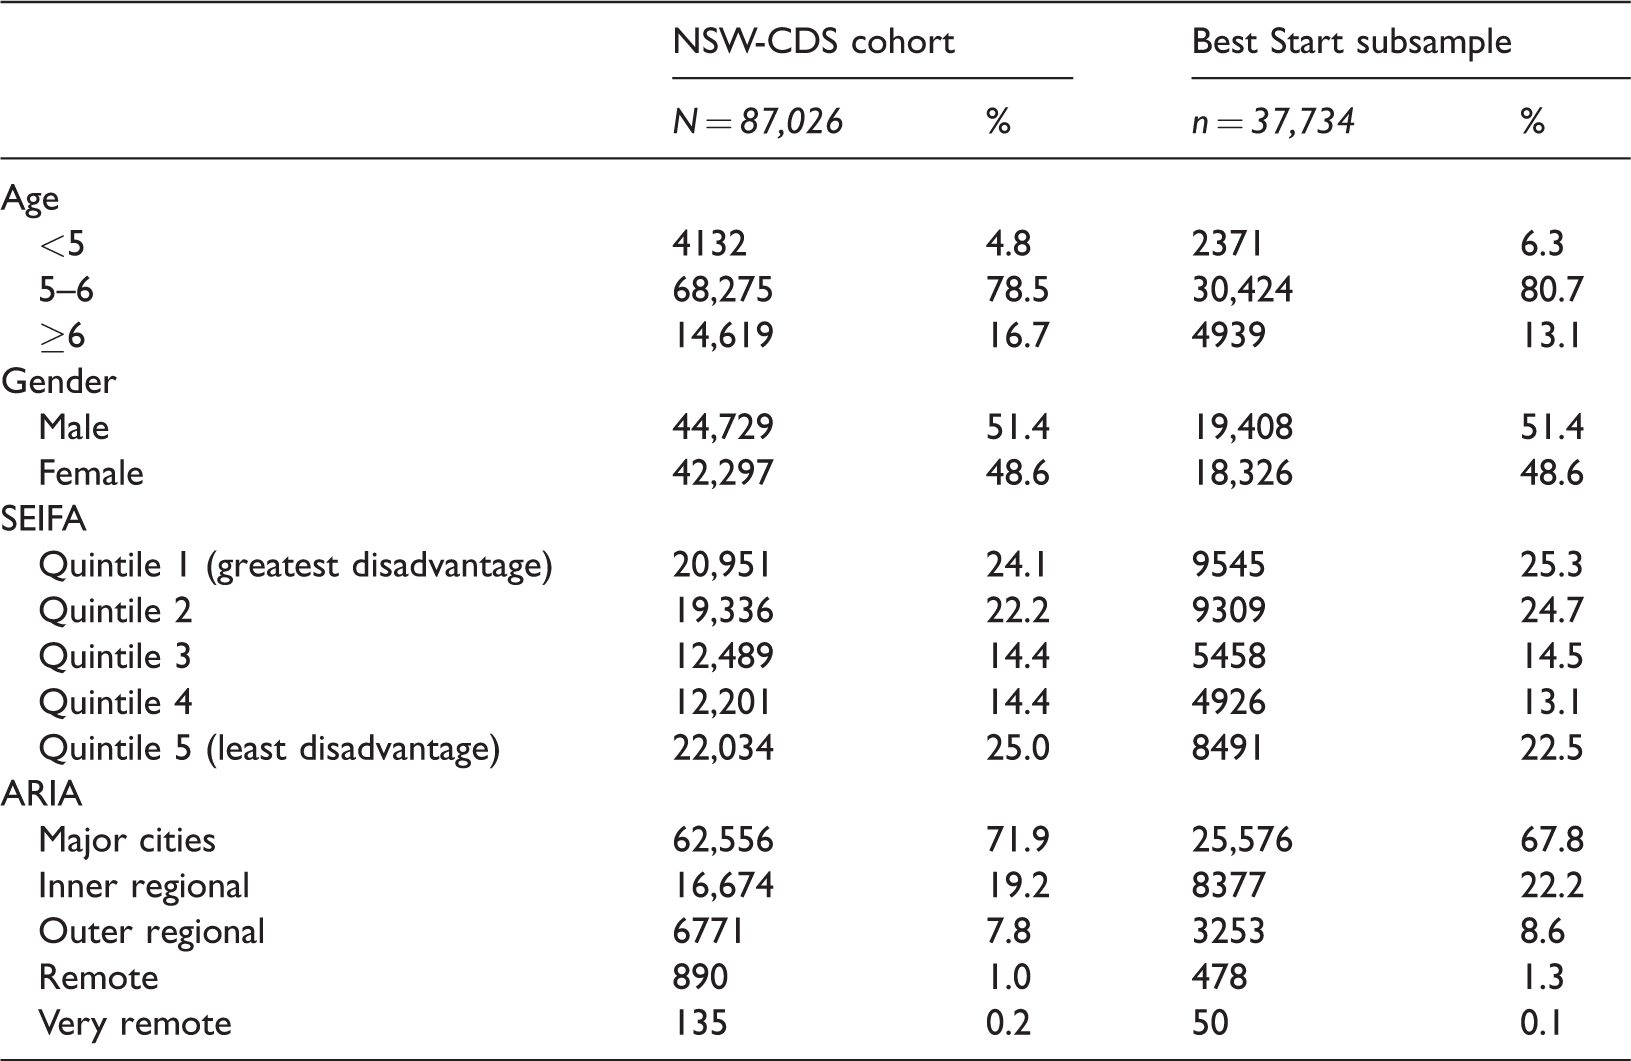
NSW-CDS: New South Wales Child Development Study; SEIFA: Socio-Economic Indexes for Areas; ARIA: Accessibility/Remoteness Index of Australia.
Ethical approval for the research was obtained from the NSW Population and Health Services Research Ethics Committee (HREC/11/CIPHS/14) and the University of New South Wales Human Research Ethics Committee (HC11409), with data custodian approvals provided by each relevant Government Department.
Measures
The 2009 Best Start consists of 36 tasks assessing seven aspects of literacy (i.e. ‘phonics’ (4 tasks), ‘phonemic awareness’ (7 tasks), ‘comprehension’ (4 tasks), ‘aspects of speaking’ (4 tasks), ‘reading texts’ (6 tasks), ‘aspects of writing’ (4 tasks) and ‘concepts about print’ (7 tasks) (NSW Department of Education and Training, 2009b) and 36 tasks assessing four aspects of numeracy (i.e. ‘early arithmetical strategies’ (6 tasks), ‘pattern and the repeated unit’ (i.e. subitising) (4 tasks), ‘forward number word sequences’ (9 tasks) and ‘numeral identification’ (17 tasks) (NSW Department of Education and Training, 2009c)). Each task is administered using a standardised interview schedule and scored using a descriptive marking guide (NSW Department of Education and Training, 2009a). Task-level data are not recorded in the Best Start administrative dataset, with data only available for the seven aspects of literacy and four aspects of numeracy calculated by class teachers during administration of the tasks.
Literacy task-level performance is assessed according to task-specific marking guides, in which ordinal scores (range 0–2, with an extra category for non-response) that reflect early literacy continuum levels are assigned for each of the seven aspects of literacy. These scores are based on the teacher’s balanced judgement of the student’s overall task-level performance for that aspect (NSW Department of Education and Training, 2009b), whereby higher scores reflect increasing proficiency. For example, in one of the comprehension tasks, the student is read a story book and asked to retell the story (NSW Department of Education and Training, 2007), and the associated marking guide provides a description of performance at each level (i.e. 2 = an unprompted sequenced retell of the story; 1 = a prompted sequenced retell of the story; 0 = an incorrect retell; N = no attempt) (NSW Department of Education and Training, 2009b).
Numeracy is also rated on an ordinal scale reflecting early numeracy continuum levels, according to a marking guide for the four aspects of numeracy (NSW Department of Education and Training, 2009c). For example, in the numerical identification aspect, the 17 tasks involve the student being shown a numeral (e.g. “5”) and asked “Can you tell me what number this is?” (NSW Department of Education and Training, 2009c); correct and incorrect responses are recorded for each task. Performance on this aspect is reflected in three levels, with the teacher allocating a score based on the alignment of the student’s recorded performance with the marking guide (i.e. 0 = may identify some, but not all numerals in the range 1–10; 1 = identifies all numerals 1–10; 2 = identifies all numerals 1–20; 3 = identifies numerals 1–100) (NSW Department of Education and Training, 2009c).
In the Australian education system, no prerequisite literacy and numeracy skills are specified for the commencement of formal schooling; therefore, the Best Start does not measure underachievement. Instead, the baseline level of 0 indicates normal or expected performance, and levels 1–3 indicate incrementally increased performance above what is expected. Of the four numeracy scales, early arithmetical strategies and forward number word sequences are the only two scales not reported on a range of 0–3 and are instead reported on scales of 0–4 and 0–5, respectively. For the purpose of the current analyses, these two aspects of numeracy were transformed 2 to a range of 0–3 for the purpose of comparability with the other aspects of numeracy.
The development of the literacy component of the Best Start was commissioned to the Australian Council for Educational Research (ACER) by the NSW Department of Education and based on a modified version of the ACER Longitudinal Literacy and Numeracy Study literacy instrument (Meiers & Khoo, 2008; Meiers, Khoo, Rowe, Stephanou, & Anderson, 2006). This modified version, with a reported adequate range of difficulty, has been assessed for psychometric properties, with fit statistics reported as satisfactory (Meiers & Khoo, 2008). No information regarding the psychometric properties of the numeracy component, which was developed by the NSW Department of Education is publicly available.
Data analysis
A split-half sample approach was adopted to facilitate cross validation (Browne & Cudeck, 1992; Cudeck & Browne, 1983); the dataset was split randomly into two independent subsamples of equivalent size. To examine whether a two-factor structure of literacy and numeracy was represented in the 11 Best Start aspects, EFA was conducted in the first subsample and CFA in the second subsample. Descriptive statistics and correlations for the Best Start scales are provided for the EFA and CFA subsamples in Table 2. The mean score for numeral identification was consistent between both samples (0.76; see Table 2), with the mean scores for the remaining Best Start scales slightly higher for the EFA subsample. The correlations between Best Start scales within the two subsamples showed some variation, with differences of 0.10 or more demonstrated between most of the aspects of numeracy, and between some of the aspects of literacy.
Descriptive statistics and correlations for the Best Start Kindergarten Assessment.
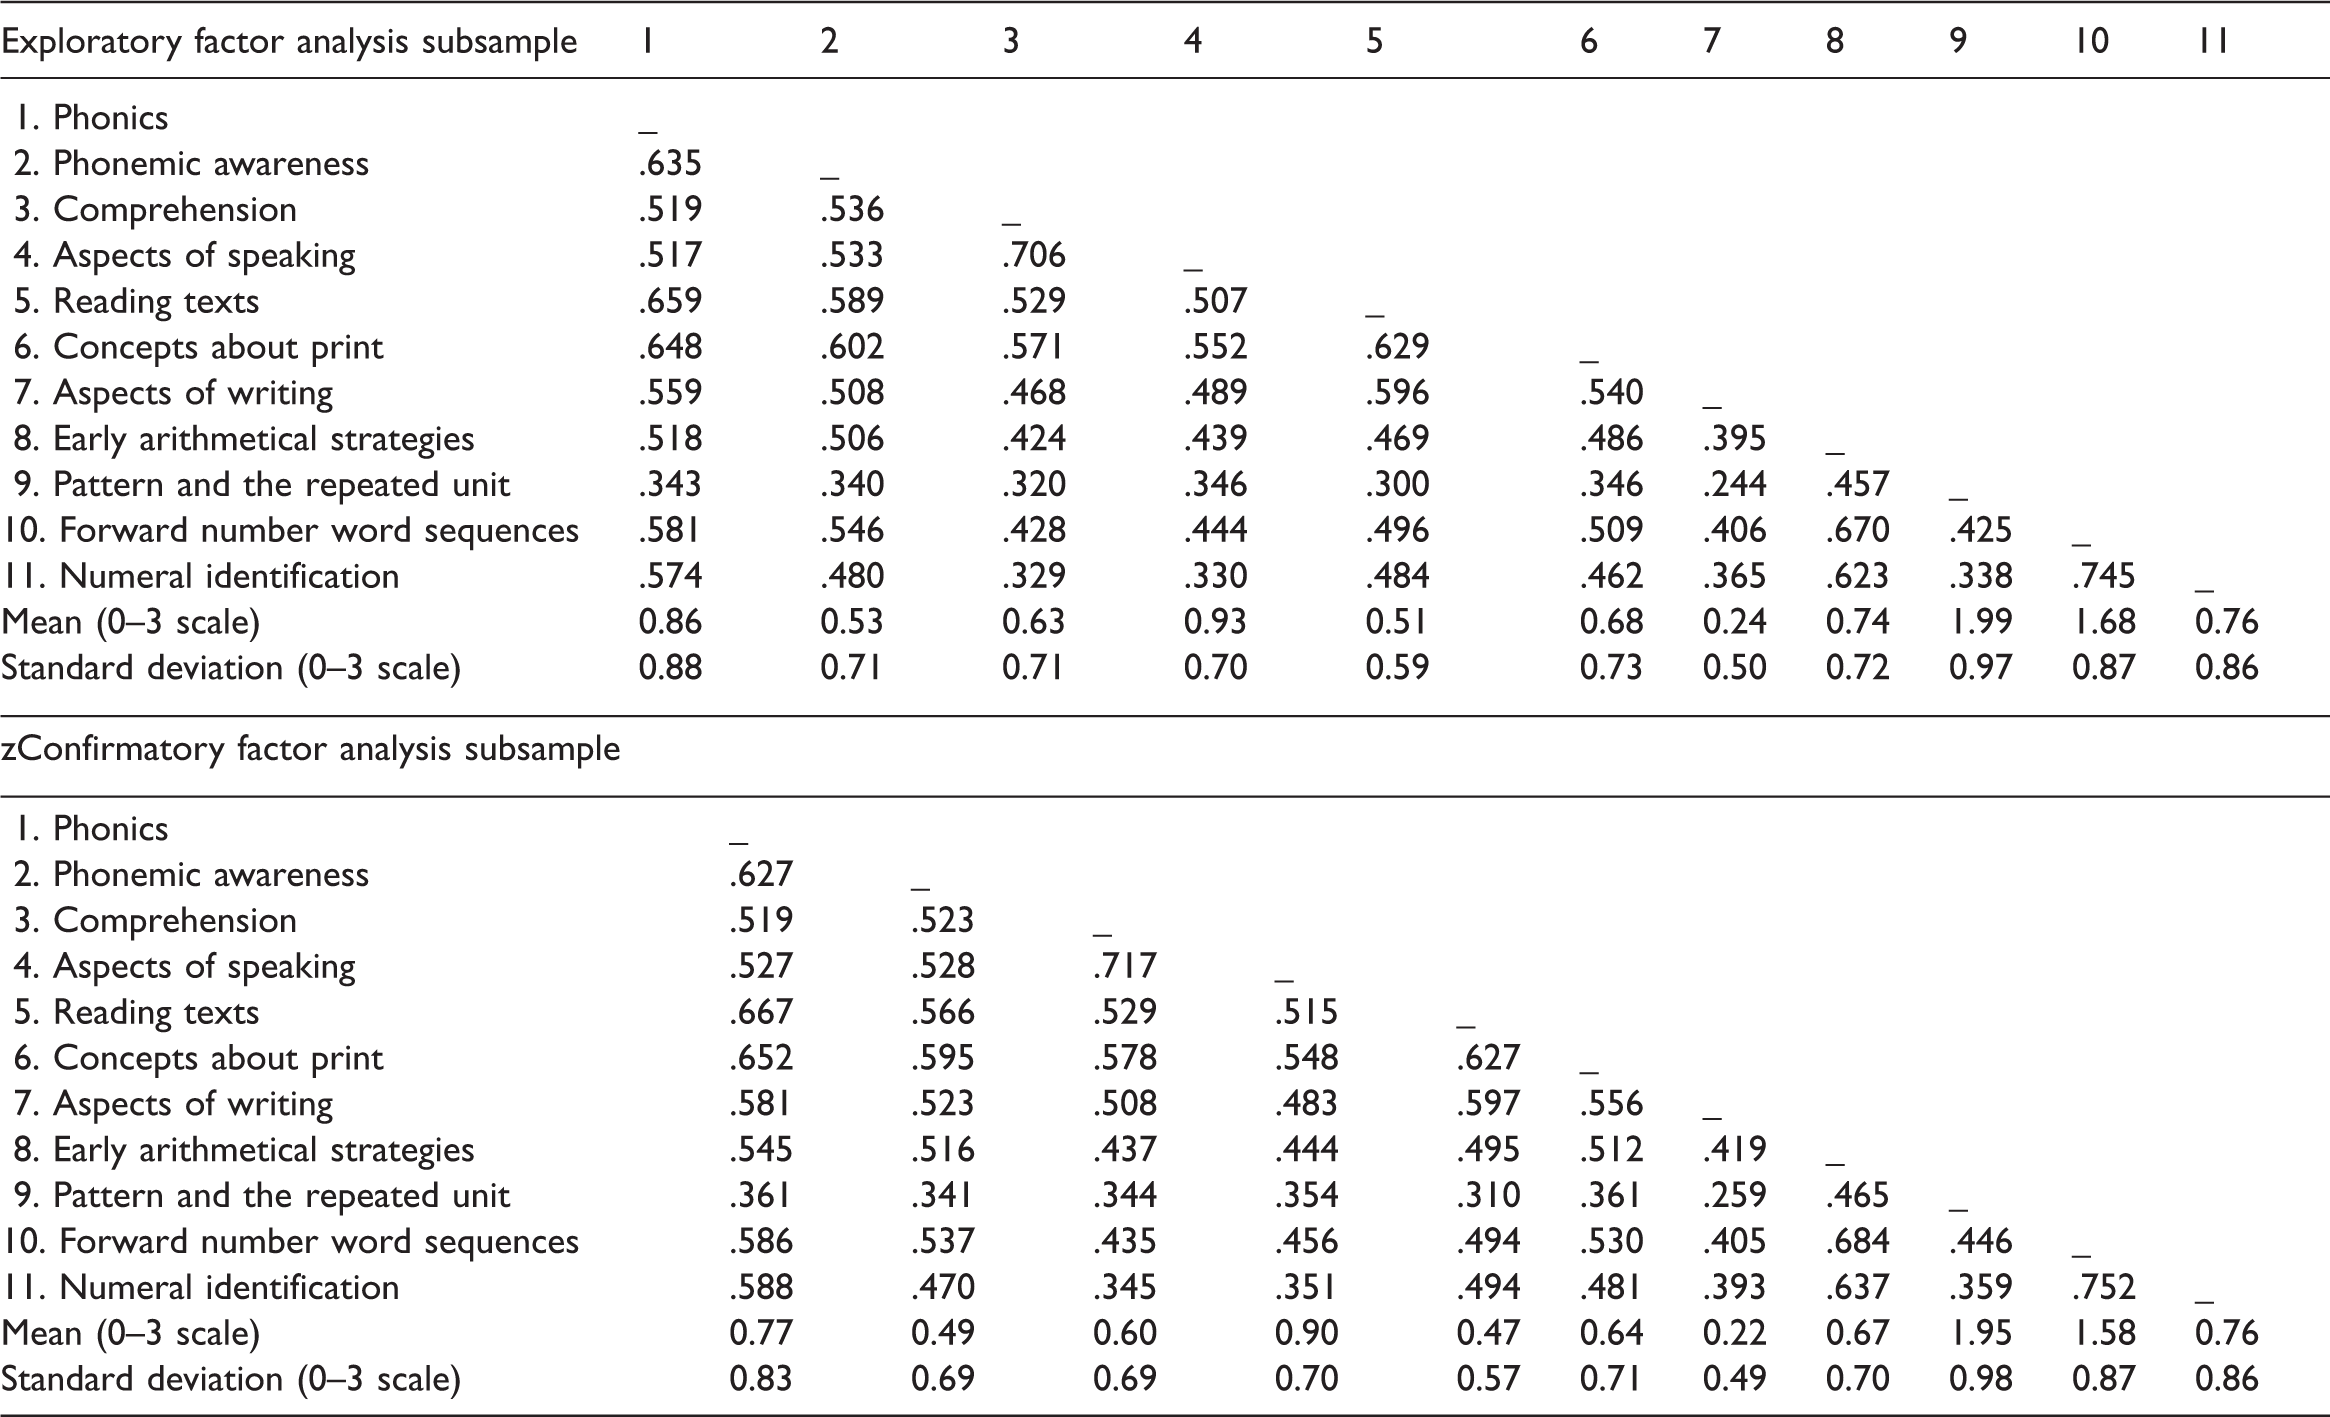
Note: All correlations were significant at p = .000.
Data were analysed in the MPLUS v7.4 software package using a weighted least squares estimator for both the EFA and CFA (Muthén & Muthén, 1998; 2013;2015). The discrepancy between the estimated and observed polychoric correlations of the Best Start scales were assessed using the root mean square error of approximation (RMSEA; Steiger, 1990), and the relative fit of the factor models in comparison to the baseline (1-factor) model were assessed using the Tucker–Lewis and comparative fit indices (TLI, CFI) (Bentler, 1990; Tucker & Lewis, 1973). Good model fit was defined as CFI and TLI values greater than 0.9 (Byrne, 1994; Hu & Bentler, 1995), and a RMSEA of less than 0.06 (Hu & Bentler, 1999). For the EFA, an oblimin rotation was conducted on the 11 Best Start scales in the EFA subsample (n = 18,867), fitting one to three factors (i.e. a baseline model, the anticipated two-factor model and a potentially over-fitted three-factor model). Factors were identified based on eigenvalues greater than one (Kaiser, 1960). A CFA was subsequently specified according to the findings of the EFA on the second subsample (n = 18,877).
Results
EFA
Within the EFA, eigenvalues for the first three components were 5.976, 1.146 and 0.825, respectively, with the two factor solution retained based on eigenvalues greater than one (Kaiser, 1960). As expected with a large sample size, chi-square was significant (χ2 = 3167.19, p ≤ .001, df = 34), prompting further fit indices to be examined. Very good fit for the two-factor model was demonstrated by the CFI (0.98) and TLI (0.97), with RMSEA (0.07) demonstrating fair fit (Hu & Bentler, 1999). The two factors were moderately correlated (r = 0.62). Comrey and Lee’s (1992) factor loading threshold criteria were adopted, with loadings from 0.23 to 0.44 regarded as ‘poor’, 0.45 to 0.54 regarded as ‘fair’, 0.55 to 0.62 regarded as ‘good’, 0.63 to 0.70 regarded as ‘very good’ and 0.71 and greater considered to be ‘excellent’.
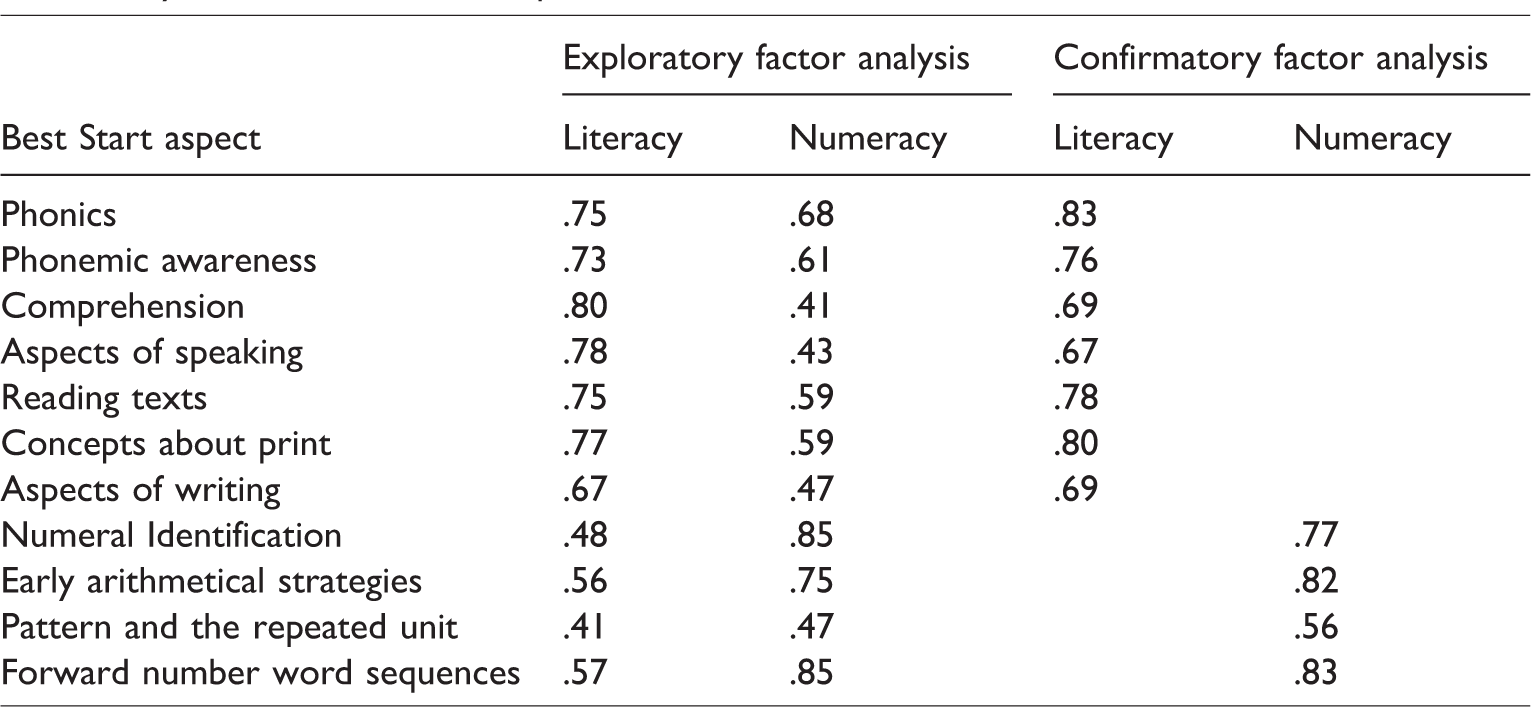
Factor 1 was consistent with a literacy component, with excellent loadings for phonics (0.75), phonemic awareness (0.73), comprehension (0.80), aspects of speaking (0.79), reading texts (0.75) and concepts about print (0.77) and very good loadings for aspects of writing (0.67).
Factor 2 was consistent with a numeracy component with excellent loadings for numeral identification (0.85), early arithmetical strategies (0.75), and forward number word sequences (0.87) and fair factor loadings for pattern and the repeated unit (0.47).
In terms of cross-loadings, four of the seven literacy aspects showed sizable loadings on Factor 2 (the numeracy component), namely phonics (0.68), phonemic awareness (0.61), reading texts (0.59) and concepts about print (0.59). In addition, some non-trivial loadings on Factor 1 (the literacy component) emerged for three of the four numeracy aspects, namely early arithmetical strategies (0.56), forward number word sequences (0.57) and pattern and the repeated unit (0.41). Considering the strong theoretical explanation for these cross-loadings, with literacy and numeracy skills known to be correlated in this age group (Fuchs et al., 2006; McClelland et al., 2007; Purpura, Hume, Sims, & Lonigan, 2011), these aspects were retained. However, it should be noted that the difference between the size of the factor-loading of a particular aspect on the relevant component and the cross-loading of the same aspect on the alternate component was acceptable at 0.10 or greater, with the exception of phonics and pattern and the repeated unit (see Table 3).
Factor loadings for the two-factor model derived from the exploratory and confirmatory factor analyses of the Best Start aspects.
CFA
As expected with a large sample size, chi-square was highly significant (χ2(43) = 4166.86, p ≤ .001), prompting further fit indices to be examined. Very good fit for the two-factor model was demonstrated for CFI (0.97) and TLI (0.96), however, the RMSEA (0.08) demonstrated poor fit (Hu & Bentler, 1999). The modification index indicated substantial cross-loadings within both factors, with an improved model resulting from the allowance of the correlation between errors for phonics and comprehension, phonics and aspects of writing, phonics and reading texts, comprehension and aspects of speaking, aspects of speaking and reading texts, numeral identification and pattern and the repeated unit, numeral identification and forward number word sequences, and early arithmetical strategies and forward number word sequences. After allowing for error correlations, the two-factor model demonstrated very good fit for CFI (0.99), TLI (0.99) and RMSEA (0.04). Factor loadings are presented in Table 3, with strong loadings replicated in the CFA model for the literacy and numeracy factors. The literacy and numeracy factors were strongly correlated (0.80).
Discussion
To our knowledge, this study is the first to examine the factor structure of all 11 aspects of the Best Start in a population sample. A two-factor model was confirmed in our study of 37,734 children, among the seven aspects of literacy (factor 1) and the four aspects of numeracy (factor 2) measured by the Best Start. These findings support the computation of total literacy and total numeracy scales from the Best Start to index literacy and numeracy skills of the population upon school entry. This two-factor structure is comparable to that characterising the standardised NAPLAN measures of literacy and numeracy administered in later school years. Thus, results from the Best Start can be used in the modelling of longitudinal pathways of academic achievement in the population from early childhood.
Australian research examining predictors and outcomes of academic achievement at different stages of a student’s academic career has primarily focused on the NAPLAN in Years 3, 5, 7 and 9, and Year 12 (age ∼17) higher school certificate examinations. For example, the NAPLAN has been linked to the Longitudinal Study of Australian Children data to examine early childhood factors predictive of academic performance in middle childhood and adolescence (Vidal & Baxter, 2016), and the association between attendance in a formal pre-school program (age ∼4 years) and academic performance in middle childhood (VIC Department of Education and Childhood Development, 2013). Other research has investigated the impact of prior achievement on occupational intent by linking NAPLAN and school enrolment data to survey data on student career aspirations and educational intentions (Gore, Holmes, Smith, Southgate, & Albright, 2015). The use of the Best Start in conjunction with the NAPLAN in longitudinal research of this nature will enable the introduction of crucial information on early childhood literacy and numeracy, prior to the earliest NAPLAN assessment conducted at age 8 years. For example, inclusion of the Best Start in multidisciplinary record linkage studies examining the association between educational attainment and developmental functioning could enable the early childhood period to be considered.
The potential to consider educational attainment from the early years to later educational attainment on a unidimensional graded continuum was demonstrated by Looveer and Mulligan (2009), who successfully mapped psychometrically comparable interview-based assessments of numeracy in a large NSW public school student sample between Kindergarten and Year 6. While the current findings support the utility of the Best Start as an early childhood measure (at school entry) of literacy and numeracy in longitudinal research on academic achievement, additional research would be required to consider Best Start and NAPLAN results as part of a common graded scale. This was beyond the scope of the present study. However, tests equating of the Best Start and NAPLAN may be possible by undertaking a literacy and numeracy assessment of mixed design in Year 1 or 2 (or both), in an equating sample. This would enable the consideration of comparable test forms and modes of scoring across the three time points, thereby minimising equating drift due to the reduced time period between testing. Similarly, vital work also needs to be completed to establish trait consistency between test outcomes in the early years (including those assessed in the Best Start) and outcomes in the later years (including those assessed in the NAPLAN).
Though the available Best Start data on aspects of literacy and numeracy (e.g. reading, numeral identification) constitutes similar information to that widely used from other administrative education databases (Brendan & Moshe, 2014; Daraganova, Edwards, & Sipthorp, 2013; Marks, 2014; VIC Department of Education and Childhood Development, 2013; Vidal & Baxter, 2016; Zendarski, Sciberras, Mensah, & Hiscock, 2016), some limitations should be considered with respect to the use of these Best Start data for the research purposes described here. For instance, the EFA and CFA performed in this study would ideally have been conducted on the item (task)-level information, however, item-level information is not collected by the NSW Department of Education as part of this administrative dataset. Since there is no reliability or validity information publically available for the numeracy component of the Best Start based on item-level data, any research examining the numeracy scales will need to be interpreted with caution. Ideally, this limitation would be best addressed with a comprehensive examination of the psychometric properties, item-level parameters, group differences and factor structure of the Best Start by integrating Item Response Theory (IRT) with structural analysis, in addition to research examining the construct validity of numeracy components. Multidisciplinary trends in analysis support the use of EFA and CFA in conjunction with IRT for comprehensive psychometric evaluations, with IRT and factor analysis providing superior information for individual-item performance and subscale-level performance, respectively (Barghaus & Fantuzzo, 2014; Bulotsky-Shearer, Fernandez, & Rainelli, 2013; Costa, Dieng, Cust, Butow, & Kasparian, 2016; Diviani, Dima, & Schulz, 2017; Osteen, 2010). In the absence of task-level information, a thorough examination of the function of each item within the Best Start could not be undertaken here, such that factor analysis was the favoured approach for examining construct-level structure in the current study. Finally, as there are no literacy and numeracy benchmarks at school entry, the Best Start does not include an indicator of “below expected” performance. While this limits the capacity to use this instrument to examine poor literacy and numeracy performance at school entry, there is substantial utility afforded by a measure of above expected performance in potential studies of resilience.
In sum, this study provides evidence of the two-factor structure of the Best Start as an early childhood assessment of literacy and numeracy in the first year of formal (compulsory) schooling. The powerful contribution that standardised public assessment can make to economic prosperity and quality of life has been acknowledged (Broadfoot & Black, 2004), and the traditional dependency on disciplinary-based public examinations has been supplemented more recently with assessments of general capabilities. In Australia, these date back to the first national surveys of literacy and numeracy in 1975 and 1981 that set the foundations for the full cohort assessments like Best Start and NAPLAN (Bourke, Mills, Stanyon, & Holzer, 1981). Assessment of this kind is logistically complex, costly to develop and administer, disruptive for schools and most certainly not without its critics and detractors. Notwithstanding, cohort-based assessment of literacy and numeracy has shown to have far reaching impacts on public policy, educational accountability and reform, classroom practice and feedback on student learning.
Footnotes
Acknowledgements
This research was supported by the use of population data owned by the NSW Department of Education and Commonwealth Department of Education; however, the information and views contained in this study do not necessarily, or at all, reflect the views or information held by that department.
Declaration of conflicting interests
The author(s) declared no potential conflicts of interest with respect to the research, authorship, and/or publication of this article.
Funding
The author(s) disclosed receipt of the following financial support for the research, authorship, and/or publication of this article: Australian Research Council’s Linkage Project funding scheme (project number LP110100150), with the NSW Ministry of Health, NSW Department of Education, and the NSW Department of Family and Community Services representing the Linkage Project Partners; the National Health and Medical Research Council (NHMRC Project Grant APP1058652); and the Australian Rotary Health Project Grant funding scheme (project number RG104090). Melissa Green was supported by a National Health and Medical Research Council R.D. Wright Biomedical Career Development Fellowship (1061875); Vaughan Carr, Kristin Laurens, and Felicity Harris were supported by the Schizophrenia Research Institute using an infrastructure grant from the NSW Ministry of Health; Kristin Laurens was also supported by an Australian Research Council Future Fellowship (FT170100294). Kimberlie Dean was supported by Justice Health & Forensic Mental Health Network, NSW.